- Phân tích
- Tin tức và các công cụ
- Tin tức thị trường
- EUR/JPY Price Analysis: Consolidation phase imminent as bulls retreat
EUR/JPY Price Analysis: Consolidation phase imminent as bulls retreat
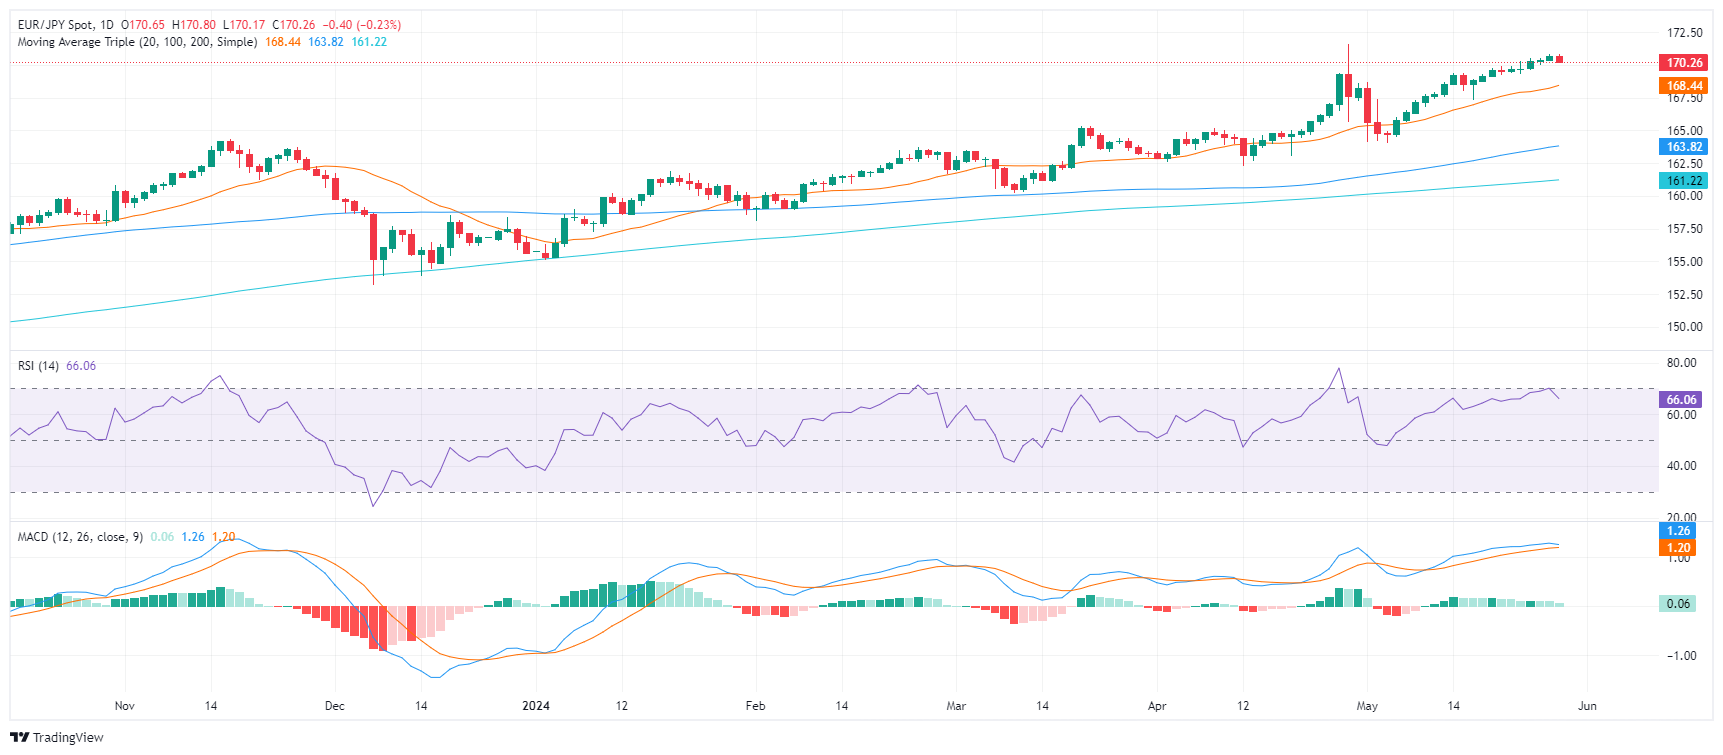
- The daily RSI and MACD are edging downwards but remain in positive territory hinting at a possible consolidation phase that could be brief.
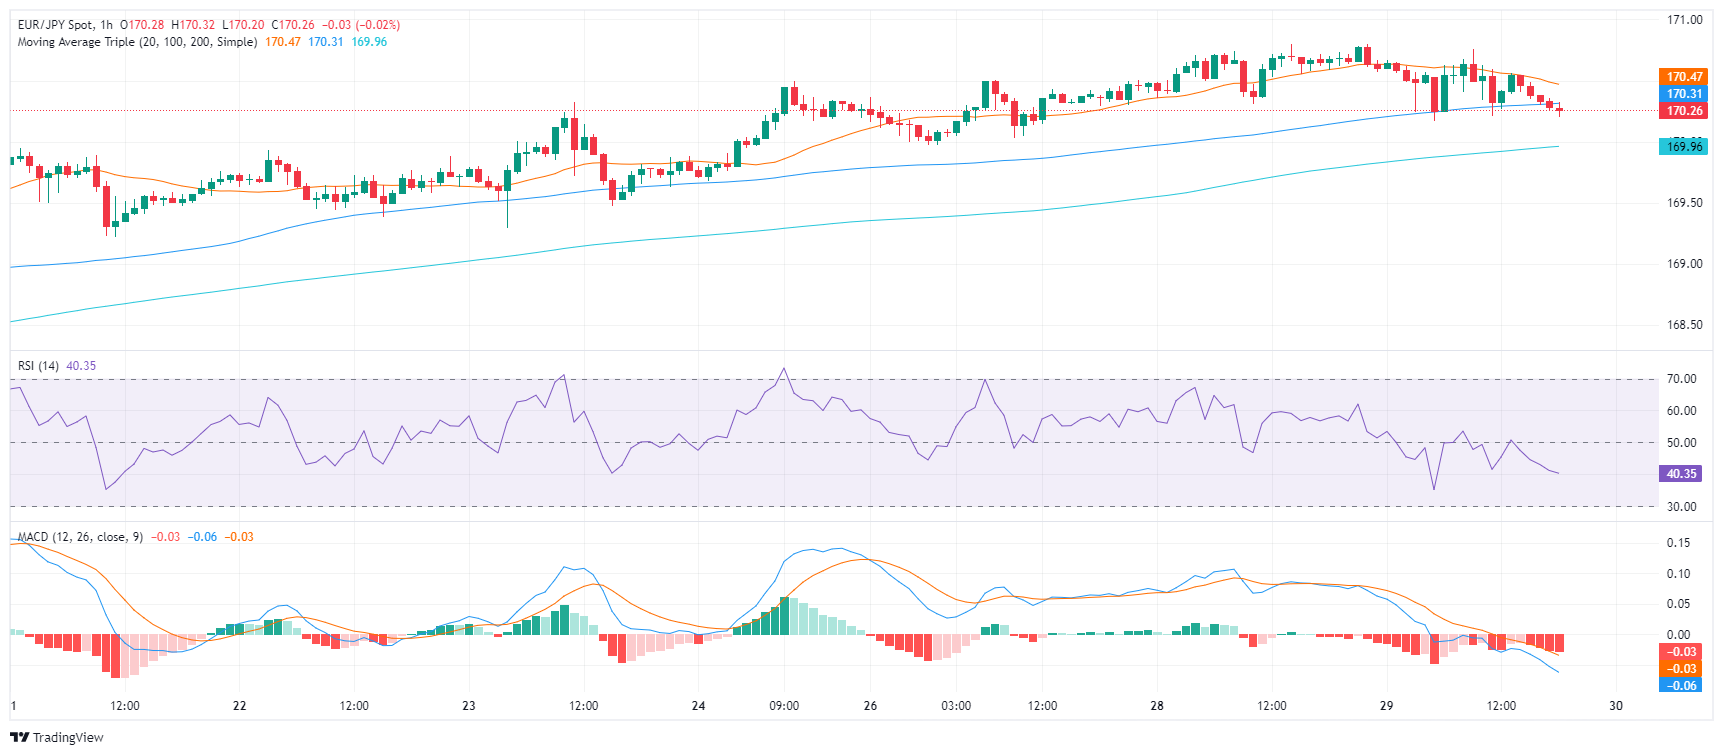
- On the hourly chart, indicators have shifted into the negative zone, further pointing towards an ongoing correction phase.
- The EUR/JPY's position above main SMAs keeps a long-term bullish sentiment alive despite the recent pullback.
In Wednesday's session, the EUR/JPY pair retreated slightly to 170.29, demonstrating an immediate dampening of the bullish momentum. However, since it remains close to cycle highs of 171.60, the consolidation period might not last long. Traders should observe the 170-168.00 range for potential correction movements before affirming changes to the outlook.
In the daily analysis, the Relative Strength Index (RSI) and the Moving Average Convergence Divergence (MACD) indicate a slight downward movement but still remain in the positive region. Both demonstrate the stopped short bullish trend which may lead to a short consolidation phase.
EUR/JPY daily chart
On the hourly chart, both RSI and MACD have now edged into the negative zone, corroborating with the indication of an ongoing corrective phase, which is likely response to recent gains.
EUR/JPY hourly chart
Notably, the current position of the EUR/JPY pair above the 20-day SMA at 168.45, though threatened, maintains the short-term bullish sentiment. Any movements below this could, however, fundamentally shift the bullish scenario. Below it, the 100 and 200-day SMA offer additional supportive barriers in case sellers come in strong.


© 2000-2026. Bản quyền Teletrade.
Trang web này được quản lý bởi Teletrade D.J. LLC 2351 LLC 2022 (Euro House, Richmond Hill Road, Kingstown, VC0100, St. Vincent and the Grenadines).
Thông tin trên trang web không phải là cơ sở để đưa ra quyết định đầu tư và chỉ được cung cấp cho mục đích làm quen.
Giao dịch trên thị trường tài chính (đặc biệt là giao dịch sử dụng các công cụ biên) mở ra những cơ hội lớn và tạo điều kiện cho các nhà đầu tư sẵn sàng mạo hiểm để thu lợi nhuận, tuy nhiên nó mang trong mình nguy cơ rủi ro khá cao. Chính vì vậy trước khi tiến hành giao dịch cần phải xem xét mọi mặt vấn đề chấp nhận tiến hành giao dịch cụ thể xét theo quan điểm của nguồn lực tài chính sẵn có và mức độ am hiểu thị trường tài chính.
Sử dụng thông tin: sử dụng toàn bộ hay riêng biệt các dữ liệu trên trang web của công ty TeleTrade như một nguồn cung cấp thông tin nhất định. Việc sử dụng tư liệu từ trang web cần kèm theo liên kết đến trang teletrade.vn. Việc tự động thu thập số liệu cũng như thông tin từ trang web TeleTrade đều không được phép.
Xin vui lòng liên hệ với pr@teletrade.global nếu có câu hỏi.
ngân hàng