- Phân tích
- Tin tức và các công cụ
- Tin tức thị trường
- AUD/NZD declines following higher inflation figures from Australia and soft ANZ data
AUD/NZD declines following higher inflation figures from Australia and soft ANZ data
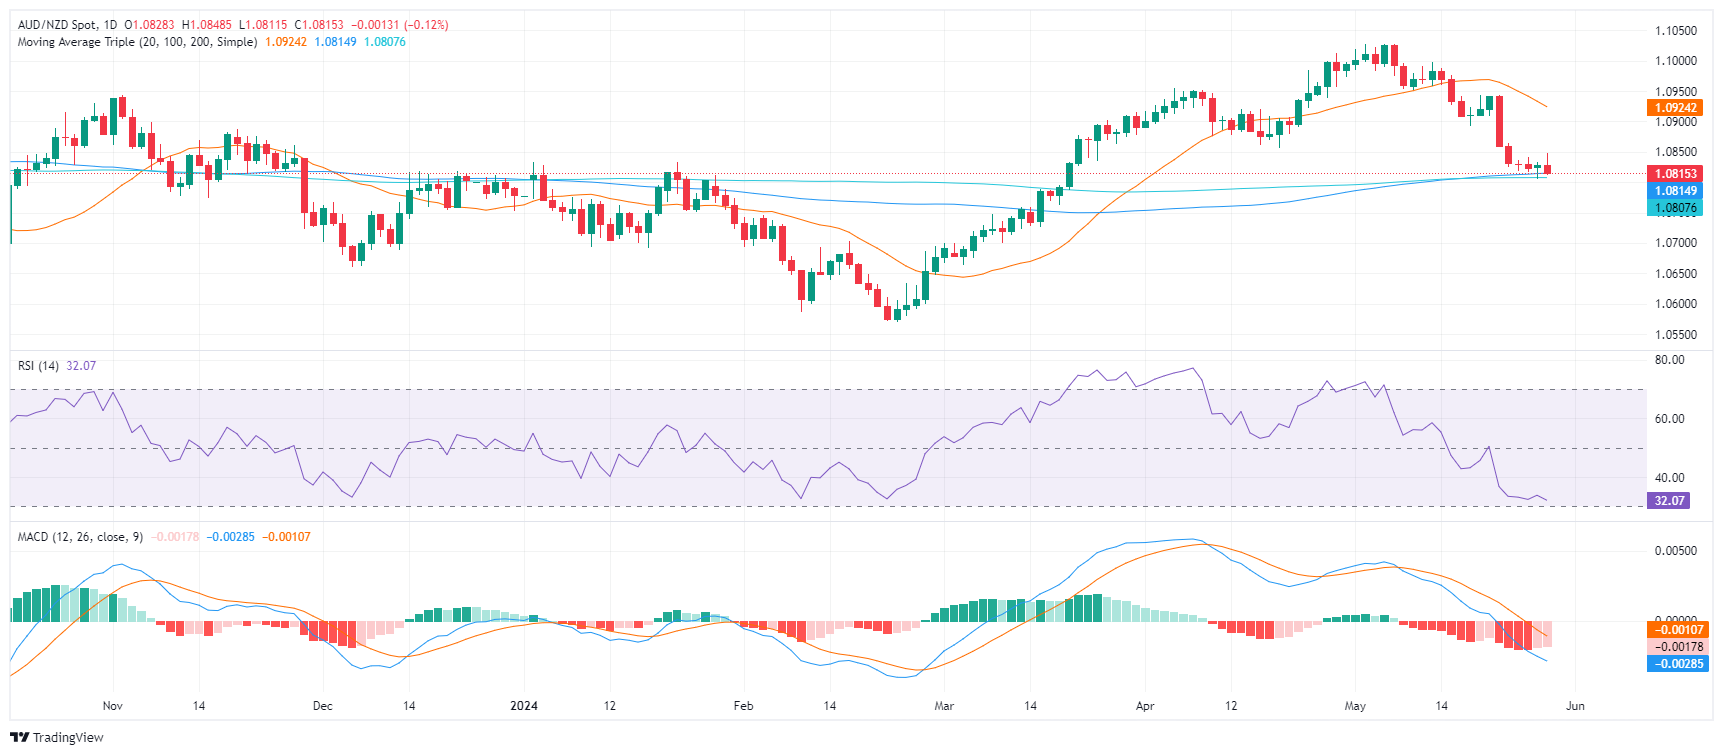
- The AUD/NZD declines to a low of 1.0815 after reaching a high of 1.0850 on Wednesday.
- Australian high-tier data tempers RBA's dovish expectations, while soft New Zealand data renews RBNZ policy divergence.
- Following downbeat ANZ data, the market bets over higher odds of an RBNZ rate cut in November.
The AUD/NZD was seen trading lower during Wednesday's trading session, as markets digest high-tier data from both Australia and New Zealand.
In Australia, April's Consumer Price Indxe (CPI) came in hot at 3.6% YoY, surpassing the 3.4% expectations and the previous month's 3.5%. This marked the second consecutive month of acceleration and is the highest inflation rate since November. With core inflation remaining sticky above 4%, there are strong signals that the Reserve Bank of Australia (RBA) might turn its tone to a more hawkish one.
Meanwhile, the disappointing ANZ business survey data for May became a focal point in New Zealand. The Own Activity Outlook index dropped to a low of 11.8 from 14.3 in April, hinting towards weaker growth. Recently sticky domestic inflation led to the RBNZ discussing a potential rate increase which led to a significant strengthening of the Kiwi, markets are betting that the first cut will come in November of this year, priced in by 65%.
AUD/NZD technical analysis
On the daily chart, the Relative Strength Index (RSI) remains in negative territory, indicating a robust downtrend. This is consolidated by the rising red bars of the Moving Average Convergence Divergence (MACD) histogram, which confirms the continued downward momentum.
That being said, as the pair approached oversold terrain, the pair may see a slight upward correction in the next sessions.
AUD/NZD daily chart


© 2000-2026. Bản quyền Teletrade.
Trang web này được quản lý bởi Teletrade D.J. LLC 2351 LLC 2022 (Euro House, Richmond Hill Road, Kingstown, VC0100, St. Vincent and the Grenadines).
Thông tin trên trang web không phải là cơ sở để đưa ra quyết định đầu tư và chỉ được cung cấp cho mục đích làm quen.
Giao dịch trên thị trường tài chính (đặc biệt là giao dịch sử dụng các công cụ biên) mở ra những cơ hội lớn và tạo điều kiện cho các nhà đầu tư sẵn sàng mạo hiểm để thu lợi nhuận, tuy nhiên nó mang trong mình nguy cơ rủi ro khá cao. Chính vì vậy trước khi tiến hành giao dịch cần phải xem xét mọi mặt vấn đề chấp nhận tiến hành giao dịch cụ thể xét theo quan điểm của nguồn lực tài chính sẵn có và mức độ am hiểu thị trường tài chính.
Sử dụng thông tin: sử dụng toàn bộ hay riêng biệt các dữ liệu trên trang web của công ty TeleTrade như một nguồn cung cấp thông tin nhất định. Việc sử dụng tư liệu từ trang web cần kèm theo liên kết đến trang teletrade.vn. Việc tự động thu thập số liệu cũng như thông tin từ trang web TeleTrade đều không được phép.
Xin vui lòng liên hệ với pr@teletrade.global nếu có câu hỏi.
ngân hàng