- Phân tích
- Tin tức và các công cụ
- Tin tức thị trường
- GBP/USD Price Analysis: Slumps to fresh weekly lows as bears eye 1.2700
GBP/USD Price Analysis: Slumps to fresh weekly lows as bears eye 1.2700
- GBP/USD tumbles to new three-day low as ‘evening star’ chart pattern emerges.
- Buyers’ momentum begins to fade as RSI aims toward the 50-midline.
- If the pair drops below 1.2700, look for further losses; otherwise, bulls can challenge 1.2800.
The British Pound fell to a new weekly low against the Greenback on Wednesday as US Treasury bond yields continued to climb. Federal Reserve officials remained cautious and influenced traders' expectations of just 25 basis points of rate cuts seen toward the end of 2024. The GBP/USD trades at 1.2719, down 0.33%.
GBP/USD Price Analysis: Technical outlook
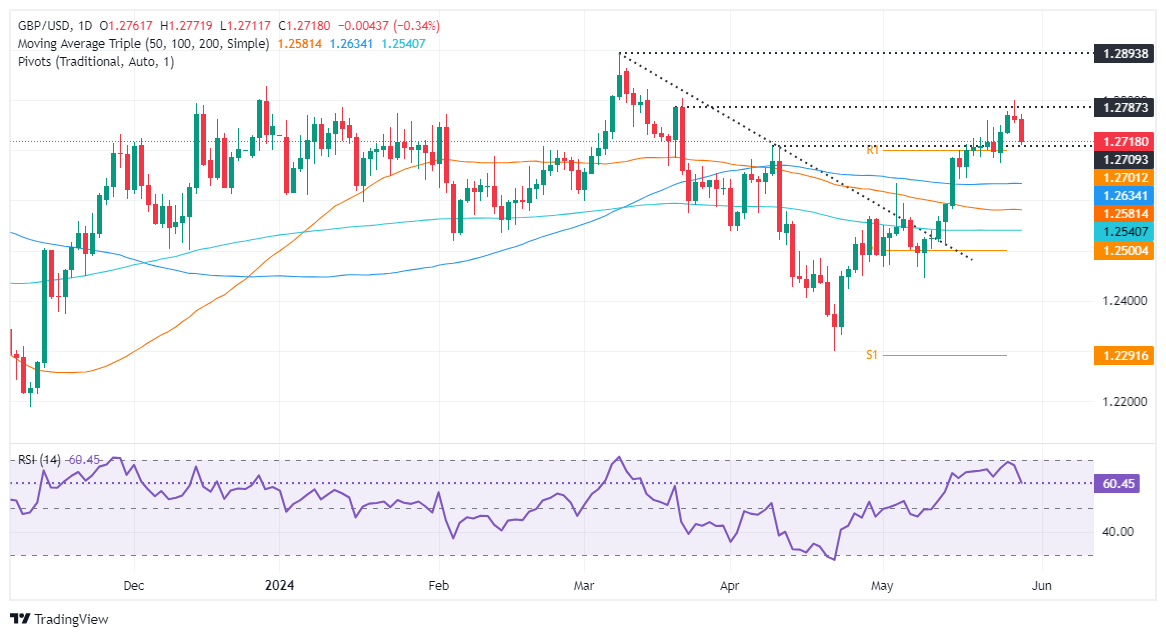
The GBP/USD formed a three-candle chart formation called an ‘evening star,’ hinting that prices could tumble further. Momentum remains bullish, as depicted by the Relative Strength Index (RSI), but aims toward the 50-midline, which means that buyers are losing momentum.
On further weakness, if GBP/USD drops below 1.2700, the pair could test the May 3 daily high turned support at 1.2634. Once cleared, the next support would be the 50-day moving average (DMA) at 1.2580, followed by the 200-DMA at 1.2539.
On the other hand, if buyers reclaim the current week's high of 1.2777, further gains are seen above 1.2800, like the year-to-date (YTD) high of 1.2893.
GBP/USD Price Action – Daily Chart
British Pound PRICE Today
The table below shows the percentage change of British Pound (GBP) against listed major currencies today. British Pound was the strongest against the Australian Dollar.
| USD | EUR | GBP | JPY | CAD | AUD | NZD | CHF | |
|---|---|---|---|---|---|---|---|---|
| USD | 0.33% | 0.33% | 0.13% | 0.34% | 0.40% | 0.27% | 0.05% | |
| EUR | -0.33% | -0.01% | -0.22% | 0.00% | 0.06% | -0.06% | -0.28% | |
| GBP | -0.33% | 0.00% | -0.22% | -0.02% | 0.05% | -0.05% | -0.29% | |
| JPY | -0.13% | 0.22% | 0.22% | 0.20% | 0.27% | 0.15% | -0.10% | |
| CAD | -0.34% | -0.00% | 0.02% | -0.20% | 0.07% | -0.05% | -0.30% | |
| AUD | -0.40% | -0.06% | -0.05% | -0.27% | -0.07% | -0.11% | -0.34% | |
| NZD | -0.27% | 0.06% | 0.05% | -0.15% | 0.05% | 0.11% | -0.25% | |
| CHF | -0.05% | 0.28% | 0.29% | 0.10% | 0.30% | 0.34% | 0.25% |
The heat map shows percentage changes of major currencies against each other. The base currency is picked from the left column, while the quote currency is picked from the top row. For example, if you pick the British Pound from the left column and move along the horizontal line to the US Dollar, the percentage change displayed in the box will represent GBP (base)/USD (quote).


© 2000-2026. Bản quyền Teletrade.
Trang web này được quản lý bởi Teletrade D.J. LLC 2351 LLC 2022 (Euro House, Richmond Hill Road, Kingstown, VC0100, St. Vincent and the Grenadines).
Thông tin trên trang web không phải là cơ sở để đưa ra quyết định đầu tư và chỉ được cung cấp cho mục đích làm quen.
Giao dịch trên thị trường tài chính (đặc biệt là giao dịch sử dụng các công cụ biên) mở ra những cơ hội lớn và tạo điều kiện cho các nhà đầu tư sẵn sàng mạo hiểm để thu lợi nhuận, tuy nhiên nó mang trong mình nguy cơ rủi ro khá cao. Chính vì vậy trước khi tiến hành giao dịch cần phải xem xét mọi mặt vấn đề chấp nhận tiến hành giao dịch cụ thể xét theo quan điểm của nguồn lực tài chính sẵn có và mức độ am hiểu thị trường tài chính.
Sử dụng thông tin: sử dụng toàn bộ hay riêng biệt các dữ liệu trên trang web của công ty TeleTrade như một nguồn cung cấp thông tin nhất định. Việc sử dụng tư liệu từ trang web cần kèm theo liên kết đến trang teletrade.vn. Việc tự động thu thập số liệu cũng như thông tin từ trang web TeleTrade đều không được phép.
Xin vui lòng liên hệ với pr@teletrade.global nếu có câu hỏi.
ngân hàng