- Phân tích
- Tin tức và các công cụ
- Tin tức thị trường
- EUR/USD Price Analysis: Moves below 1.0850 despite a bullish bias
EUR/USD Price Analysis: Moves below 1.0850 despite a bullish bias
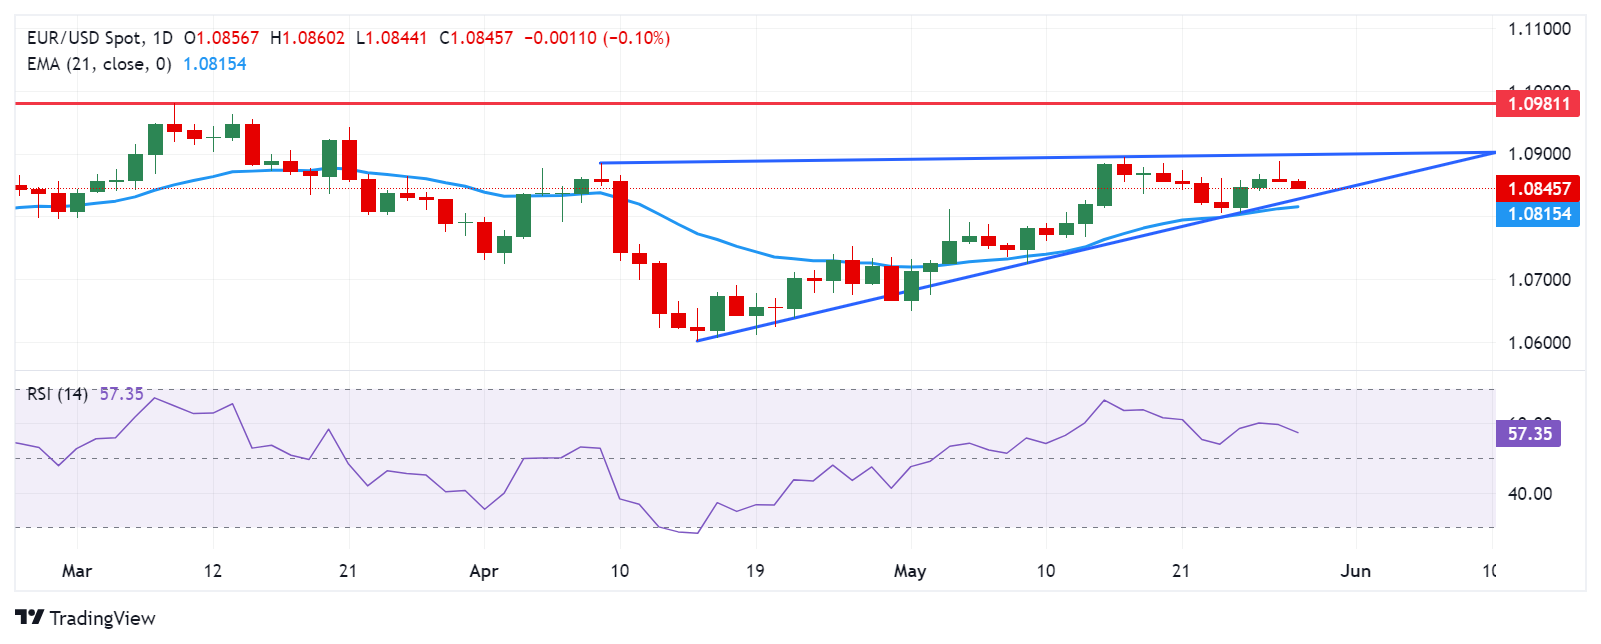
- EUR/USD consolidates within the ascending triangle, indicating a bullish bias.
- The upper boundary of the ascending triangle and the psychological level of 1.0900 appear to be key resistance levels.
- The pair could test the lower boundary of the ascending triangle, followed by the 21-day EMA at 1.0815.
EUR/USD extended losses to near 1.0850 during the Asian session on Wednesday. The pair faces challenges as the US Dollar (USD) gains ground amidst emerging risk aversion sentiment, possibly triggered by hawkish remarks from Minneapolis Fed President Neel Kashkari. Kashkari's comments suggest that rate increases are still a possibility and express uncertainty about the disinflationary process, with a prediction of only two rate cuts.
However, an analysis of the daily chart indicates a bullish bias for the EUR/USD pair, as it consolidates within an ascending triangle. Additionally, the 14-day Relative Strength Index (RSI) momentum indicator is slightly above the 50 level, further supporting this bullish bias.
The EUR/USD pair could potentially challenge the upper boundary of the ascending triangle, followed by the psychological resistance level at 1.0900. Breaking above this level could lead the pair toward the region around the significant level of 1.0950, followed by a three-month high of 1.0981.
On the downside, immediate support for the EUR/USD pair could be found at the lower boundary of the ascending triangle, followed by the 21-day Exponential Moving Average (EMA) at 1.0815. A breach below the psychological level of 1.0800 might exert downward pressure, potentially navigating toward the area around the significant level of 1.0700.
EUR/USD: Daily Chart


© 2000-2026. Bản quyền Teletrade.
Trang web này được quản lý bởi Teletrade D.J. LLC 2351 LLC 2022 (Euro House, Richmond Hill Road, Kingstown, VC0100, St. Vincent and the Grenadines).
Thông tin trên trang web không phải là cơ sở để đưa ra quyết định đầu tư và chỉ được cung cấp cho mục đích làm quen.
Giao dịch trên thị trường tài chính (đặc biệt là giao dịch sử dụng các công cụ biên) mở ra những cơ hội lớn và tạo điều kiện cho các nhà đầu tư sẵn sàng mạo hiểm để thu lợi nhuận, tuy nhiên nó mang trong mình nguy cơ rủi ro khá cao. Chính vì vậy trước khi tiến hành giao dịch cần phải xem xét mọi mặt vấn đề chấp nhận tiến hành giao dịch cụ thể xét theo quan điểm của nguồn lực tài chính sẵn có và mức độ am hiểu thị trường tài chính.
Sử dụng thông tin: sử dụng toàn bộ hay riêng biệt các dữ liệu trên trang web của công ty TeleTrade như một nguồn cung cấp thông tin nhất định. Việc sử dụng tư liệu từ trang web cần kèm theo liên kết đến trang teletrade.vn. Việc tự động thu thập số liệu cũng như thông tin từ trang web TeleTrade đều không được phép.
Xin vui lòng liên hệ với pr@teletrade.global nếu có câu hỏi.
ngân hàng