- Phân tích
- Tin tức và các công cụ
- Tin tức thị trường
- NZD/USD flattens out near 0.6140 after testing 11-week high
NZD/USD flattens out near 0.6140 after testing 11-week high
- Easing Greenback pressure gives Kiwi another leg into fresh highs.
- Momentum remains thin as NZD rtaders grapple with a lack of data.
- US GDP, PCE inflation prints to dominate the last half of the trading week.
NZD/USD eased back into the 0.6140 level in early Wednesday trading as Kiwi traders await a reason to move. The economic calendar is notably thin except for the NZ government’s latest Budget Release on Thursday, leaving NZD traders adrift until Friday’s speech from Reserve Bank of New Zealand (RBNZ) Governor Orr.
US data in the back half of the trading week will drive investor sentiment with an update to US quarterly Gross Domestic Product (GDP) and the latest print of Personal Consumption Expenditure (PCE) Price Index inflation.
Investors have been awaiting signs of movement from the Federal Reserve (Fed) on rate cuts, with markets broadly keeping an eye on a flurry of appearances from Fed officials in the early week. Broad-market hopes for rate cuts continue to wither against a cautious Fed, and rate markets are pricing in roughly even odds of a quarter-point rate trim from the Federal Open Market Committee (FOMC) in September.
NZD/USD technical outlook
The Kiwi is drifting into the high side against the Greenback this week, and the pair has closed in the green for four consecutive trading weeks. Despite recent upswings, the pair is hitting technical consolidation just north of the 200-day Exponential Moving Average (EMA) at 0.6070.
Bullish momentum may be hitting a wall on the NZD/USD with the Moving Average Convergence-Divergence (MACD) signal lines running far ahead of bullish histogram bars, implying buying pressure may be poised for a reversal.
NZD/USD daily chart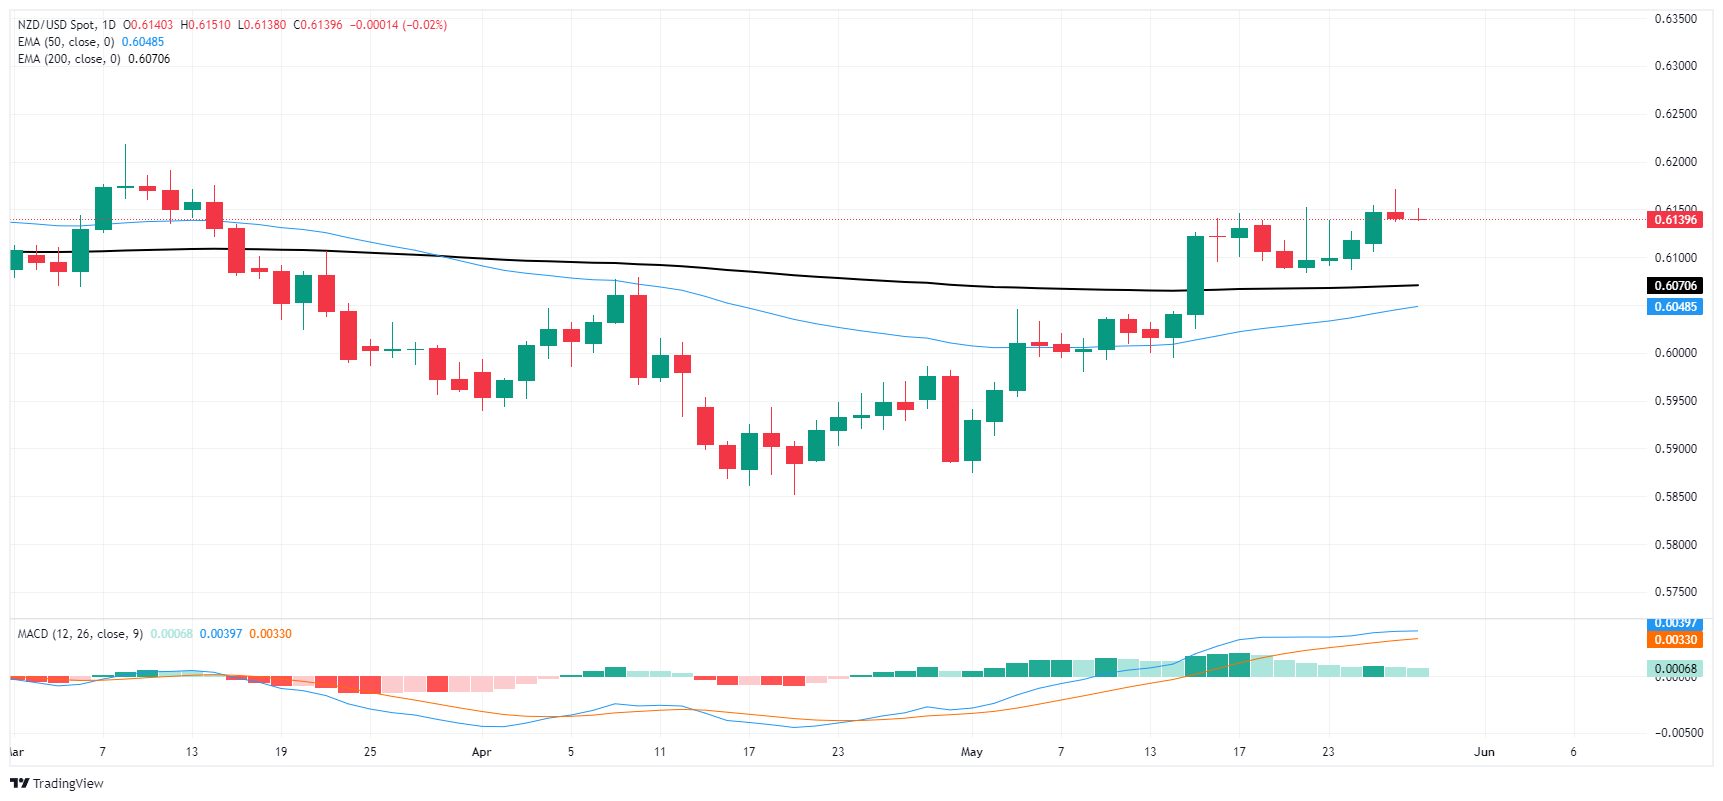


© 2000-2026. Bản quyền Teletrade.
Trang web này được quản lý bởi Teletrade D.J. LLC 2351 LLC 2022 (Euro House, Richmond Hill Road, Kingstown, VC0100, St. Vincent and the Grenadines).
Thông tin trên trang web không phải là cơ sở để đưa ra quyết định đầu tư và chỉ được cung cấp cho mục đích làm quen.
Giao dịch trên thị trường tài chính (đặc biệt là giao dịch sử dụng các công cụ biên) mở ra những cơ hội lớn và tạo điều kiện cho các nhà đầu tư sẵn sàng mạo hiểm để thu lợi nhuận, tuy nhiên nó mang trong mình nguy cơ rủi ro khá cao. Chính vì vậy trước khi tiến hành giao dịch cần phải xem xét mọi mặt vấn đề chấp nhận tiến hành giao dịch cụ thể xét theo quan điểm của nguồn lực tài chính sẵn có và mức độ am hiểu thị trường tài chính.
Sử dụng thông tin: sử dụng toàn bộ hay riêng biệt các dữ liệu trên trang web của công ty TeleTrade như một nguồn cung cấp thông tin nhất định. Việc sử dụng tư liệu từ trang web cần kèm theo liên kết đến trang teletrade.vn. Việc tự động thu thập số liệu cũng như thông tin từ trang web TeleTrade đều không được phép.
Xin vui lòng liên hệ với pr@teletrade.global nếu có câu hỏi.
ngân hàng