- Phân tích
- Tin tức và các công cụ
- Tin tức thị trường
- AUD/JPY Price Analysis: Bulls display signs of fatigue, potential shift remains possible
AUD/JPY Price Analysis: Bulls display signs of fatigue, potential shift remains possible
- Daily chart indicators suggest a slowdown in buying traction with RSI positioned above 70 indicating overbought conditions.
- Hourly chart indicators weaken, implying the possibility of short-term losses in the upcoming Asian session.
- The bulls might not have enough traction to retest the cycle highs above 105.00.
In Tuesday's session, the AUD/JPY pair continued to edge higher, securing some gains but at a seemingly slower pace, stabilizing around the 104.60 mark. Given the extended upward phase with 15 gains out of the last 19 sessions, buyers may be showing signs of fatigue. The market could be heading towards a short-term correction as indicators flash overbought signals.
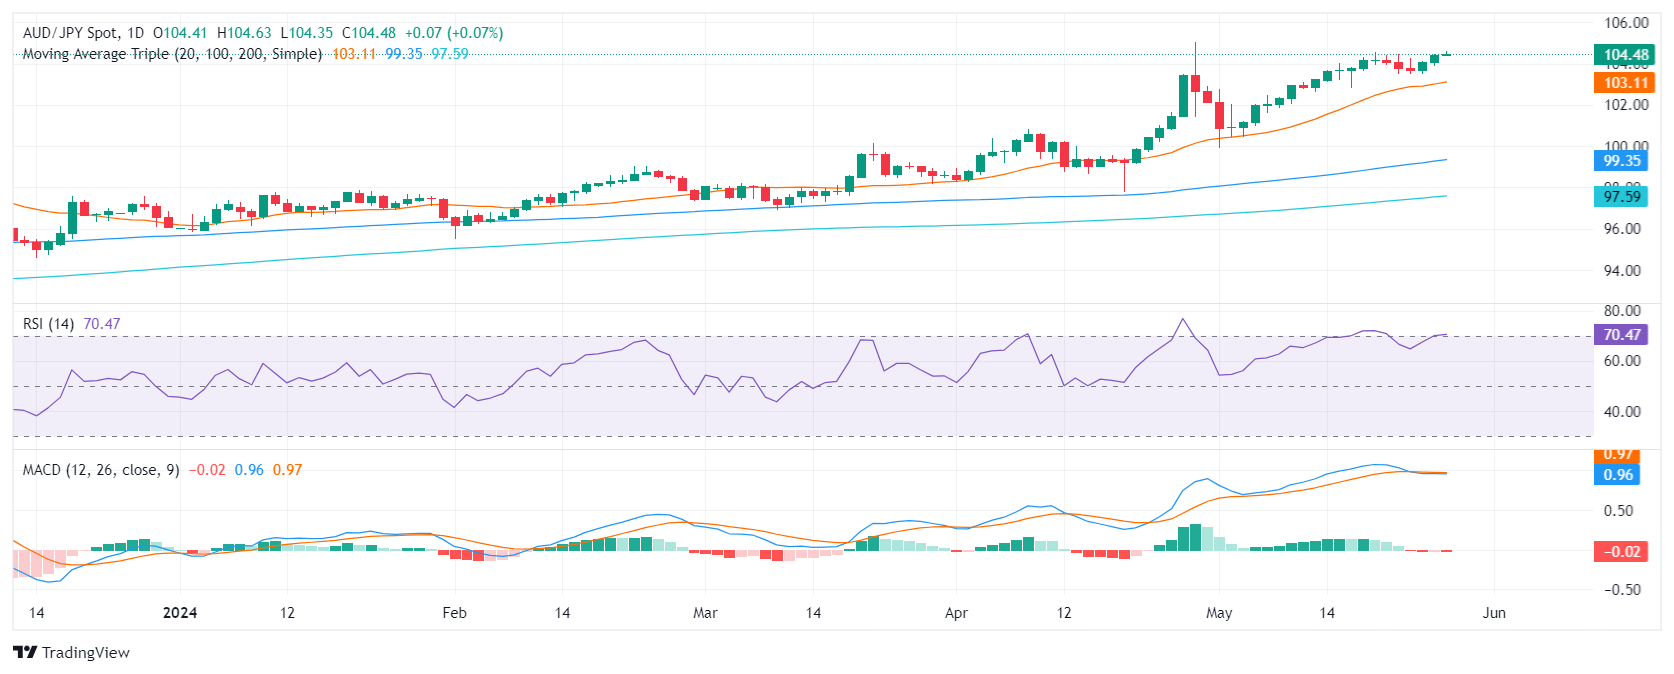
On the daily chart, the RSI has inched above the 70 territory, an area typically considered overbought. This situation, along with the MACD producing red bars, suggests that while buyers still hold control, their grip is loosening.
AUD/JPY daily chart
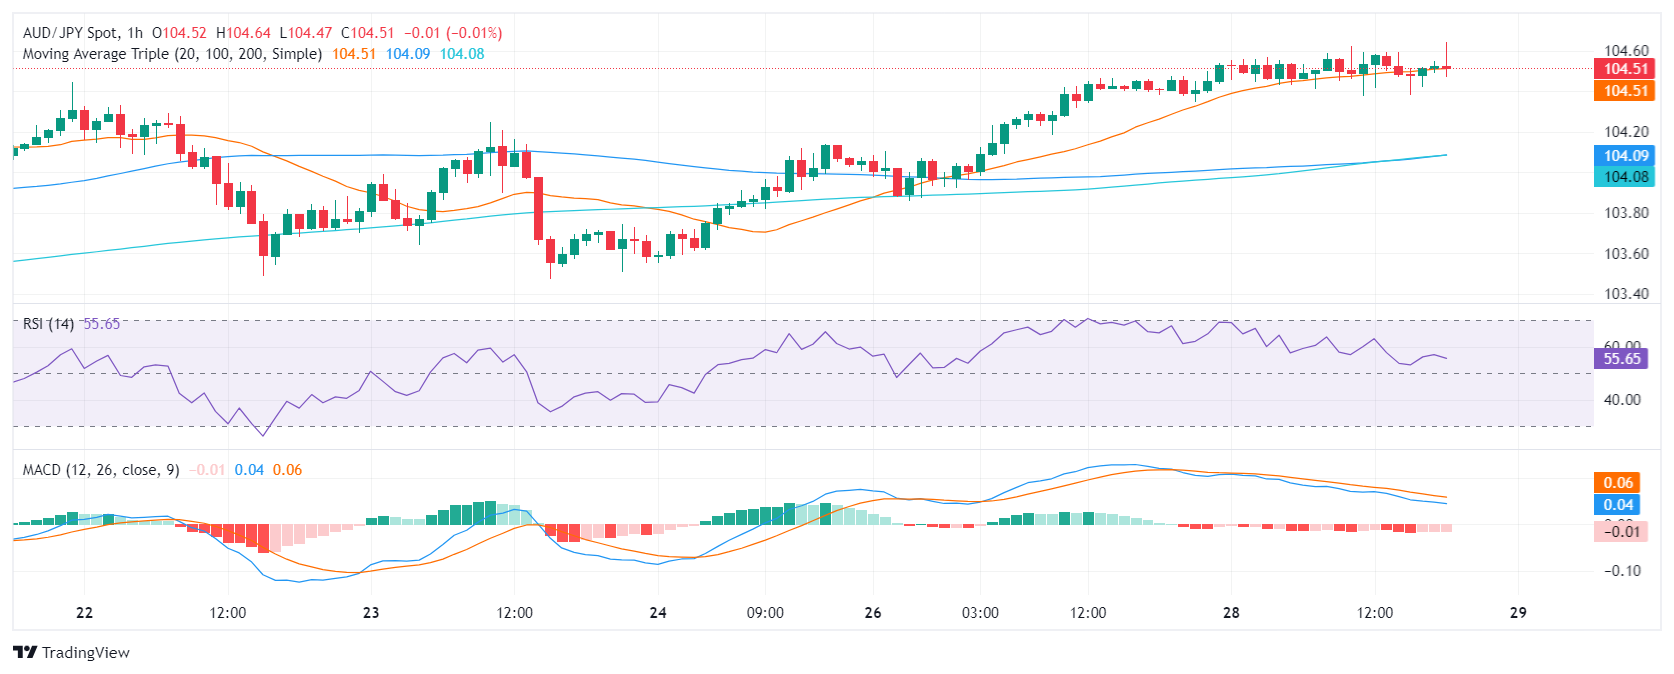
The hourly chart portrays similar sentiments. The RSI is nearing 50 and displays a downward bias. Concurrently, the MACD prints rising red bars, hinting at a weakening bullish momentum in the near term.
AUD/JPY hourly chart
Zooming out for the big picture, the AUD/JPY continues to trade above all three key Simple Moving Average (SMA) benchmarks of 20, 100, and 200 days, affirming a bullish perspective. However, with the pair stabilizing around multi-year highs, and overt signs of buyer exhaustion, the possibility of a near-term correction is becoming increasingly apparent. The main resistance is the cycle high just above 105.00 while the 20-day SMA at 103.12 offers itself as a strong support.


© 2000-2026. Bản quyền Teletrade.
Trang web này được quản lý bởi Teletrade D.J. LLC 2351 LLC 2022 (Euro House, Richmond Hill Road, Kingstown, VC0100, St. Vincent and the Grenadines).
Thông tin trên trang web không phải là cơ sở để đưa ra quyết định đầu tư và chỉ được cung cấp cho mục đích làm quen.
Giao dịch trên thị trường tài chính (đặc biệt là giao dịch sử dụng các công cụ biên) mở ra những cơ hội lớn và tạo điều kiện cho các nhà đầu tư sẵn sàng mạo hiểm để thu lợi nhuận, tuy nhiên nó mang trong mình nguy cơ rủi ro khá cao. Chính vì vậy trước khi tiến hành giao dịch cần phải xem xét mọi mặt vấn đề chấp nhận tiến hành giao dịch cụ thể xét theo quan điểm của nguồn lực tài chính sẵn có và mức độ am hiểu thị trường tài chính.
Sử dụng thông tin: sử dụng toàn bộ hay riêng biệt các dữ liệu trên trang web của công ty TeleTrade như một nguồn cung cấp thông tin nhất định. Việc sử dụng tư liệu từ trang web cần kèm theo liên kết đến trang teletrade.vn. Việc tự động thu thập số liệu cũng như thông tin từ trang web TeleTrade đều không được phép.
Xin vui lòng liên hệ với pr@teletrade.global nếu có câu hỏi.
ngân hàng