- Phân tích
- Tin tức và các công cụ
- Tin tức thị trường
- AUD/NZD clears daily losses and eye ANZ data
AUD/NZD clears daily losses and eye ANZ data
- AUD/NZD cleared daily losses, reaching 1.0852 during Tuesday's session despite soft Australian data.
- Following weak Australian data, the markets anticipate dovish moves from the RBA which may weigh on the Aussie.
- Investors await New Zealand's May ANZ business survey, which could impact the expectations on the next RBNZ policies.
The AUD/NZD is currently trading with slight gains, as market participants digest recent figures from Australia and look forward to ANZ data from New Zealand.
In Australia, Retail sales for April came in slightly under expectations at 0.1% MoM, following a 0.4% decline in March. This lackluster performance could influence the Reserve Bank of Australia's (RBA) policies and might prompt it to take a more dovish approach, taking off the table a rate hike after its New Zealander peer, the Reserve Bank of New Zealand (RBNZ) revived that discussion recently.
On the Kiwis, the anticipation in New Zealand is centered on the ANZ business survey data for May to be released during the upcoming Asian session. Depending on the results, this could sway the betting on the RBNZ's upcoming monetary policy decisions. While officials have hinted at a potential rate cut, market predictions continue to bet on a first cut to occur in Q4.
AUD/NZD technical analysis
On the daily chart, the Relative Strength Index (RSI) maintains its position in negative territory. This is fortified by the red bars of the Moving Average Convergence Divergence (MACD) histogram, confirming a continued downward momentum.
AUD/NZD daily chart
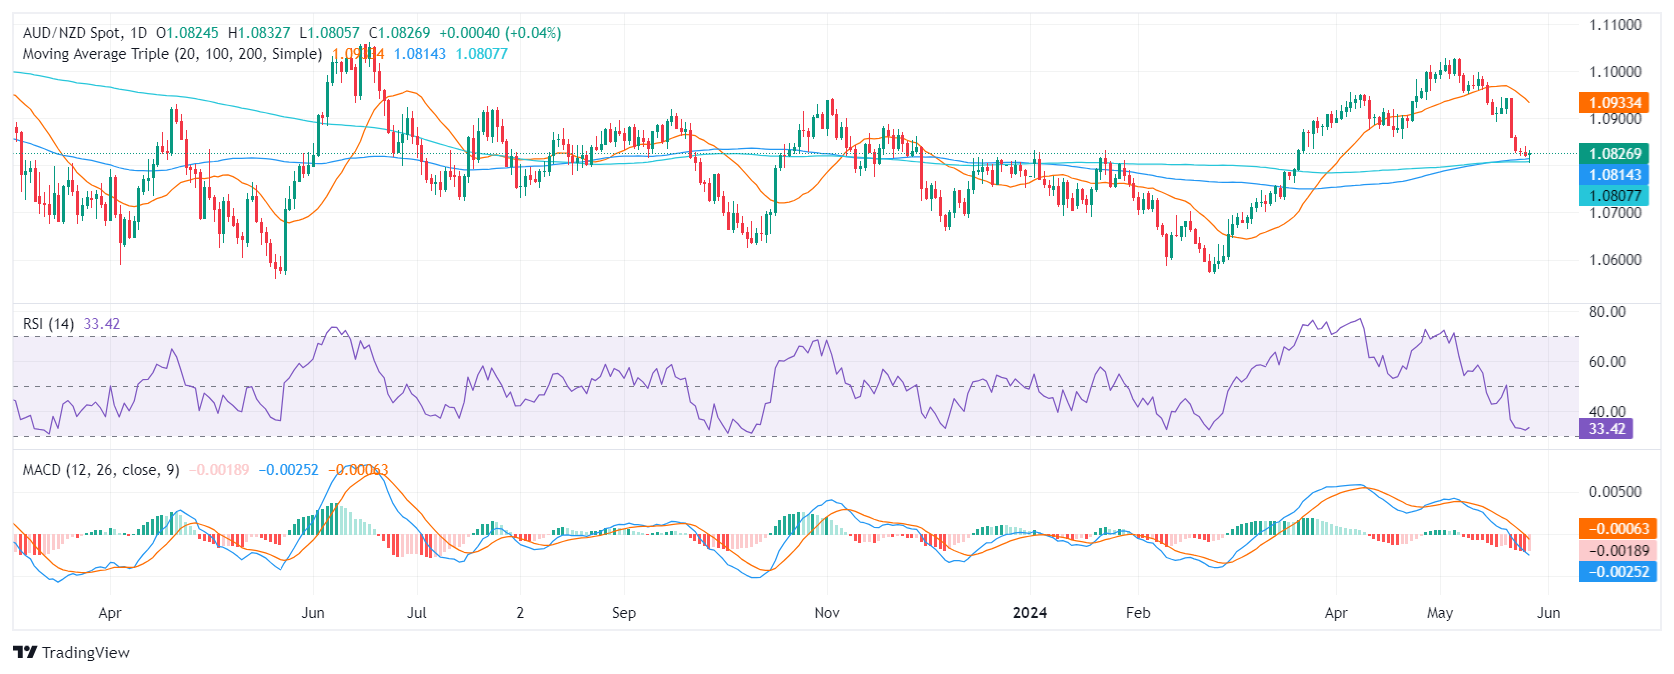
Nevertheless, the pair trades above its 100- and 200-day Simple Moving Averages (SMA), suggesting a medium-to-long uptrend. However, with the AUD/NZD standing below the 20-day SMA, it highlights a dominance for the short-term.


© 2000-2026. Bản quyền Teletrade.
Trang web này được quản lý bởi Teletrade D.J. LLC 2351 LLC 2022 (Euro House, Richmond Hill Road, Kingstown, VC0100, St. Vincent and the Grenadines).
Thông tin trên trang web không phải là cơ sở để đưa ra quyết định đầu tư và chỉ được cung cấp cho mục đích làm quen.
Giao dịch trên thị trường tài chính (đặc biệt là giao dịch sử dụng các công cụ biên) mở ra những cơ hội lớn và tạo điều kiện cho các nhà đầu tư sẵn sàng mạo hiểm để thu lợi nhuận, tuy nhiên nó mang trong mình nguy cơ rủi ro khá cao. Chính vì vậy trước khi tiến hành giao dịch cần phải xem xét mọi mặt vấn đề chấp nhận tiến hành giao dịch cụ thể xét theo quan điểm của nguồn lực tài chính sẵn có và mức độ am hiểu thị trường tài chính.
Sử dụng thông tin: sử dụng toàn bộ hay riêng biệt các dữ liệu trên trang web của công ty TeleTrade như một nguồn cung cấp thông tin nhất định. Việc sử dụng tư liệu từ trang web cần kèm theo liên kết đến trang teletrade.vn. Việc tự động thu thập số liệu cũng như thông tin từ trang web TeleTrade đều không được phép.
Xin vui lòng liên hệ với pr@teletrade.global nếu có câu hỏi.
ngân hàng