- Phân tích
- Tin tức và các công cụ
- Tin tức thị trường
- NZD/JPY Price Analysis: Bullish momentum sustains, potential correction looms on overbought conditions
NZD/JPY Price Analysis: Bullish momentum sustains, potential correction looms on overbought conditions
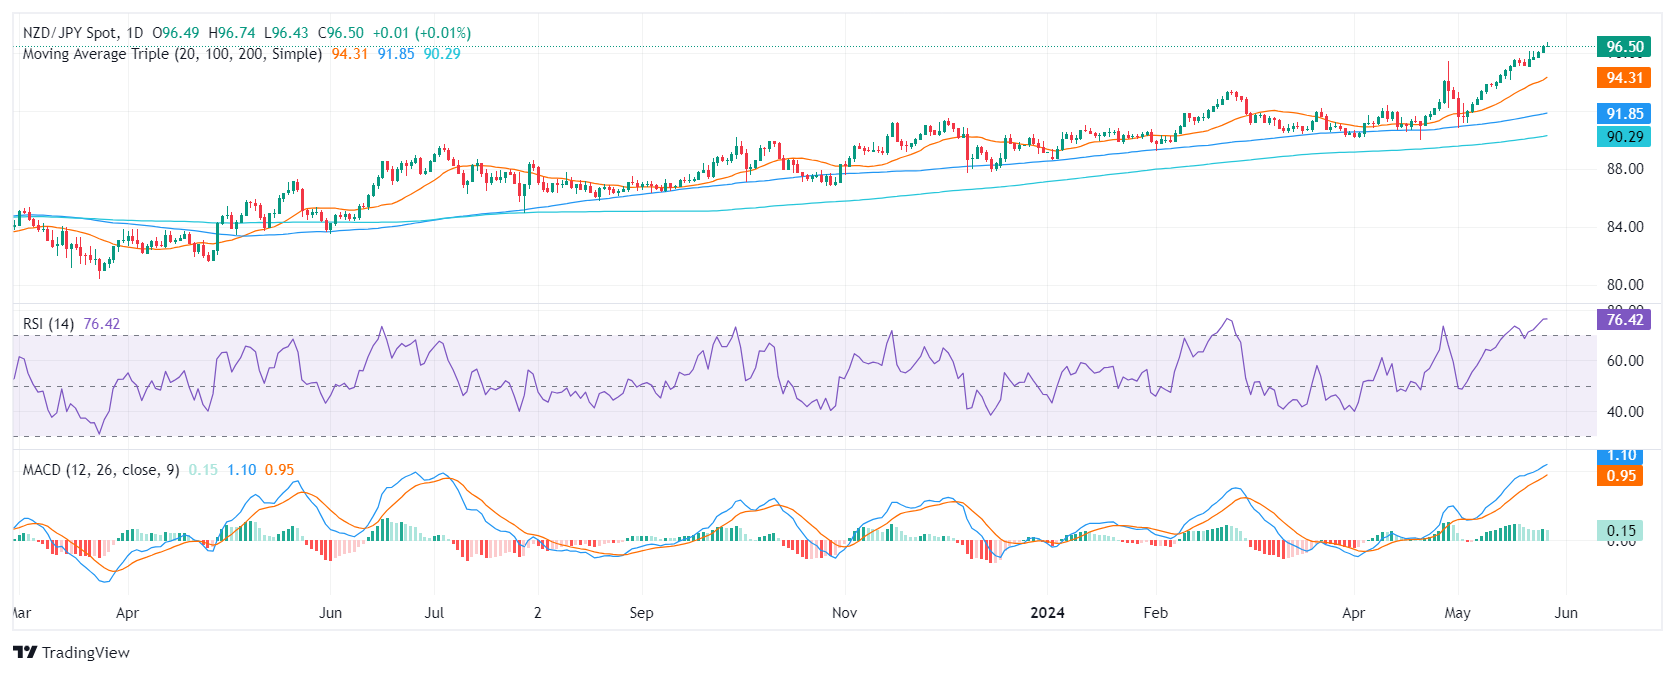
- The daily chart flashes overbought signals but the overall trend favors the bulls.
- Post achieving multi-year highs over 96.70, NZD/JPY shows a possibility for a healthy technical correction.
- The pair has a strong support level at 95.00, a crucial point for buyers to defend to contain potential losses.
On Tuesday's session, the NZD/JPY pair rose to 96.62 it highest level since July 2007. The outlook has shifted to cautious, with signs of a possible reversal in momentum as indicators flash overbought signals, but the overall bullish outlook remains intact.
Based on the daily chart indicators, the Relative Strength Index (RSI) consistently reflects overbought conditions standing deep in the overbought threshold. This hints at a potential downward price correction. Concurrently, the Moving Average Convergence Divergence (MACD) evidences continued positive momentum with its flat green bars.
NZD/JPY daily chart
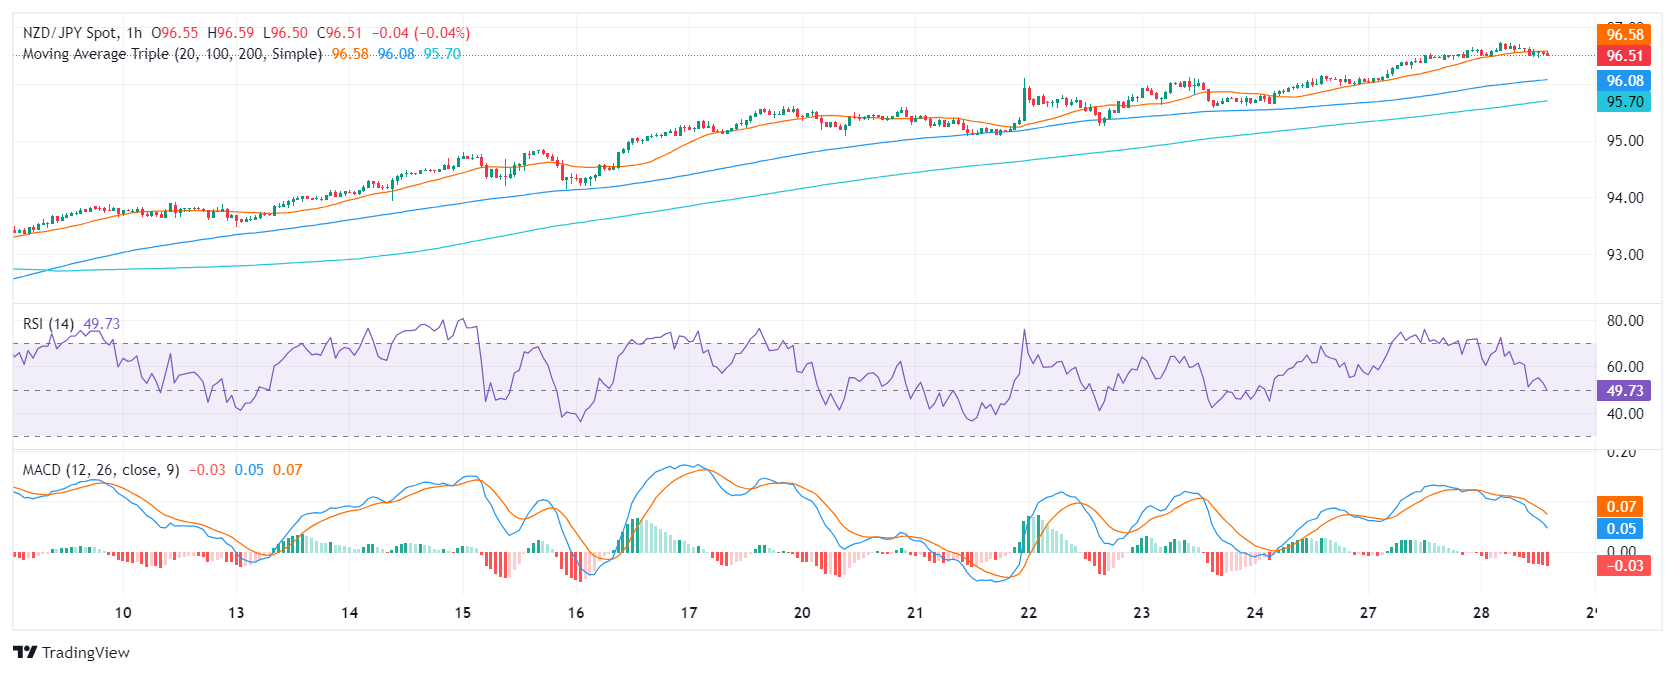
Looking at the hourly chart, the RSI demonstrates lower strength compared to the daily view and has already started to edge downwards. In line with that, the MACD histogram suggests negative momentum as revealed by the presence of red bars.
NZD/JPY hourly chart
In the broader context, the NZD/JPY presently exhibits a strong uptrend, as displayed by its position above the 20, 100, and 200-day Simple Moving Averages (SMA). This indicates that the currency pair's short-term gains are exceeding both its medium and long-term averages.
As a correction looms, any downward movements that keep the pair above its SMAs could be considered corrective, with the first strong support seen at around 95.00.


© 2000-2026. Bản quyền Teletrade.
Trang web này được quản lý bởi Teletrade D.J. LLC 2351 LLC 2022 (Euro House, Richmond Hill Road, Kingstown, VC0100, St. Vincent and the Grenadines).
Thông tin trên trang web không phải là cơ sở để đưa ra quyết định đầu tư và chỉ được cung cấp cho mục đích làm quen.
Giao dịch trên thị trường tài chính (đặc biệt là giao dịch sử dụng các công cụ biên) mở ra những cơ hội lớn và tạo điều kiện cho các nhà đầu tư sẵn sàng mạo hiểm để thu lợi nhuận, tuy nhiên nó mang trong mình nguy cơ rủi ro khá cao. Chính vì vậy trước khi tiến hành giao dịch cần phải xem xét mọi mặt vấn đề chấp nhận tiến hành giao dịch cụ thể xét theo quan điểm của nguồn lực tài chính sẵn có và mức độ am hiểu thị trường tài chính.
Sử dụng thông tin: sử dụng toàn bộ hay riêng biệt các dữ liệu trên trang web của công ty TeleTrade như một nguồn cung cấp thông tin nhất định. Việc sử dụng tư liệu từ trang web cần kèm theo liên kết đến trang teletrade.vn. Việc tự động thu thập số liệu cũng như thông tin từ trang web TeleTrade đều không được phép.
Xin vui lòng liên hệ với pr@teletrade.global nếu có câu hỏi.
ngân hàng