- Phân tích
- Tin tức và các công cụ
- Tin tức thị trường
- GBP/USD Price Analysis: Stays firm despite retreating at 1.2800 as bears loom
GBP/USD Price Analysis: Stays firm despite retreating at 1.2800 as bears loom
- GBP/USD maintains gains at 1.2786, up 0.14% from daily high.
- Resistance trendline and overbought RSI hint at potential correction.
- Short-term bearish engulfing pattern signals possible downward pressure.
The British Pound demonstrated its resilience against the Greenback on Tuesday, maintaining its gains as traders in the UK and the US returned after a long weekend. The GBP/USD is currently trading at 1.2786, showing a steady increase of 0.14% from its daily high of 1.2800.
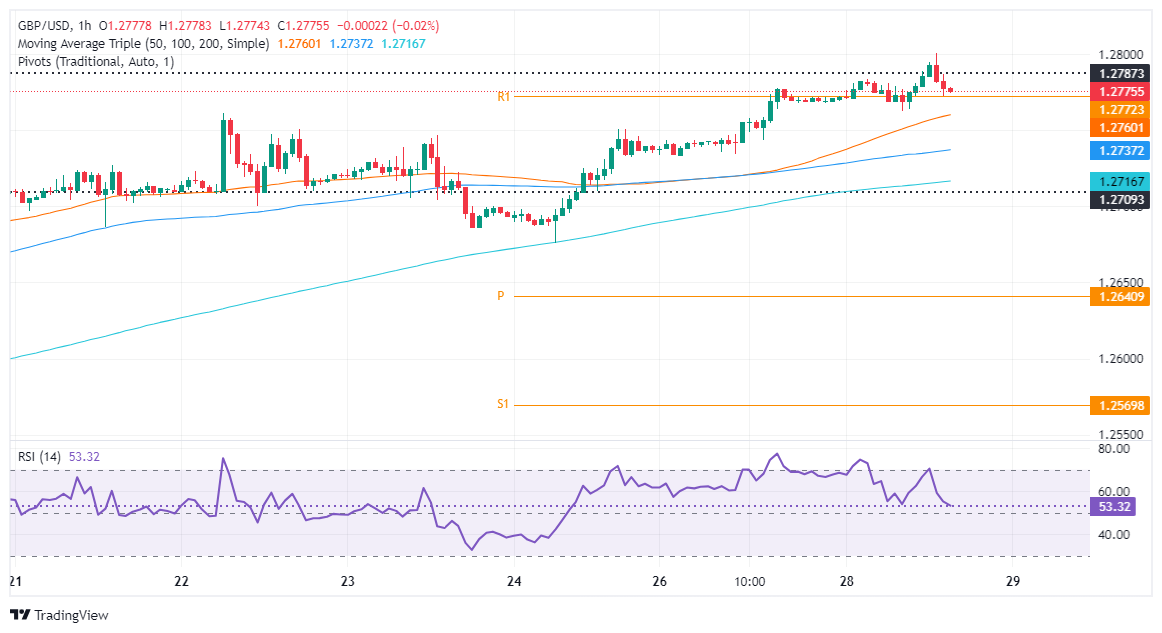
GBP/USD Price Analysis: Technical outlook
The GBP/USD tested the 1.2800 figure, yet a confluence of technical indicators with a downslope resistance trendline drawn from the highs of July 2023 and the March 21 cycle high at around 1.2803, pushed the exchange rate back to current spot prices. Momentum is in favor of buyers, but the Relative Strength Index (RSI) is about to turn overbought, hinting the pair could be headed for a correction.
In the short term, the GBP/USD hourly chart has formed a ‘bearish engulfing’ candle chart pattern, an indication that a leg-down is underway. Additionally, bullish momentum is fading as the Relative Strength Index (RSI) aims toward the 50 midline, which, once crossed, could exert downward pressure on the major.
Key support levels lie at the current day’s low of1.2762, followed by the confluence of the 50-simple moving average (SMA) at 1.2759, followed by the confluence of the100-SMA and the S1 pivot point at around 1.2736/39, ahead of the 200-SMA at 1.2716.
Conversely, if buyers stepped in and pushed prices above 1.2803, look for a re-test of the year-to-date (YTD) high of 1.2893.
GBP/USD Price Action – Hourly Chart


© 2000-2026. Bản quyền Teletrade.
Trang web này được quản lý bởi Teletrade D.J. LLC 2351 LLC 2022 (Euro House, Richmond Hill Road, Kingstown, VC0100, St. Vincent and the Grenadines).
Thông tin trên trang web không phải là cơ sở để đưa ra quyết định đầu tư và chỉ được cung cấp cho mục đích làm quen.
Giao dịch trên thị trường tài chính (đặc biệt là giao dịch sử dụng các công cụ biên) mở ra những cơ hội lớn và tạo điều kiện cho các nhà đầu tư sẵn sàng mạo hiểm để thu lợi nhuận, tuy nhiên nó mang trong mình nguy cơ rủi ro khá cao. Chính vì vậy trước khi tiến hành giao dịch cần phải xem xét mọi mặt vấn đề chấp nhận tiến hành giao dịch cụ thể xét theo quan điểm của nguồn lực tài chính sẵn có và mức độ am hiểu thị trường tài chính.
Sử dụng thông tin: sử dụng toàn bộ hay riêng biệt các dữ liệu trên trang web của công ty TeleTrade như một nguồn cung cấp thông tin nhất định. Việc sử dụng tư liệu từ trang web cần kèm theo liên kết đến trang teletrade.vn. Việc tự động thu thập số liệu cũng như thông tin từ trang web TeleTrade đều không được phép.
Xin vui lòng liên hệ với pr@teletrade.global nếu có câu hỏi.
ngân hàng