- Phân tích
- Tin tức và các công cụ
- Tin tức thị trường
- AUD/JPY Price Analysis: Bulls maintain a positive stride, potential shift remains possible
AUD/JPY Price Analysis: Bulls maintain a positive stride, potential shift remains possible
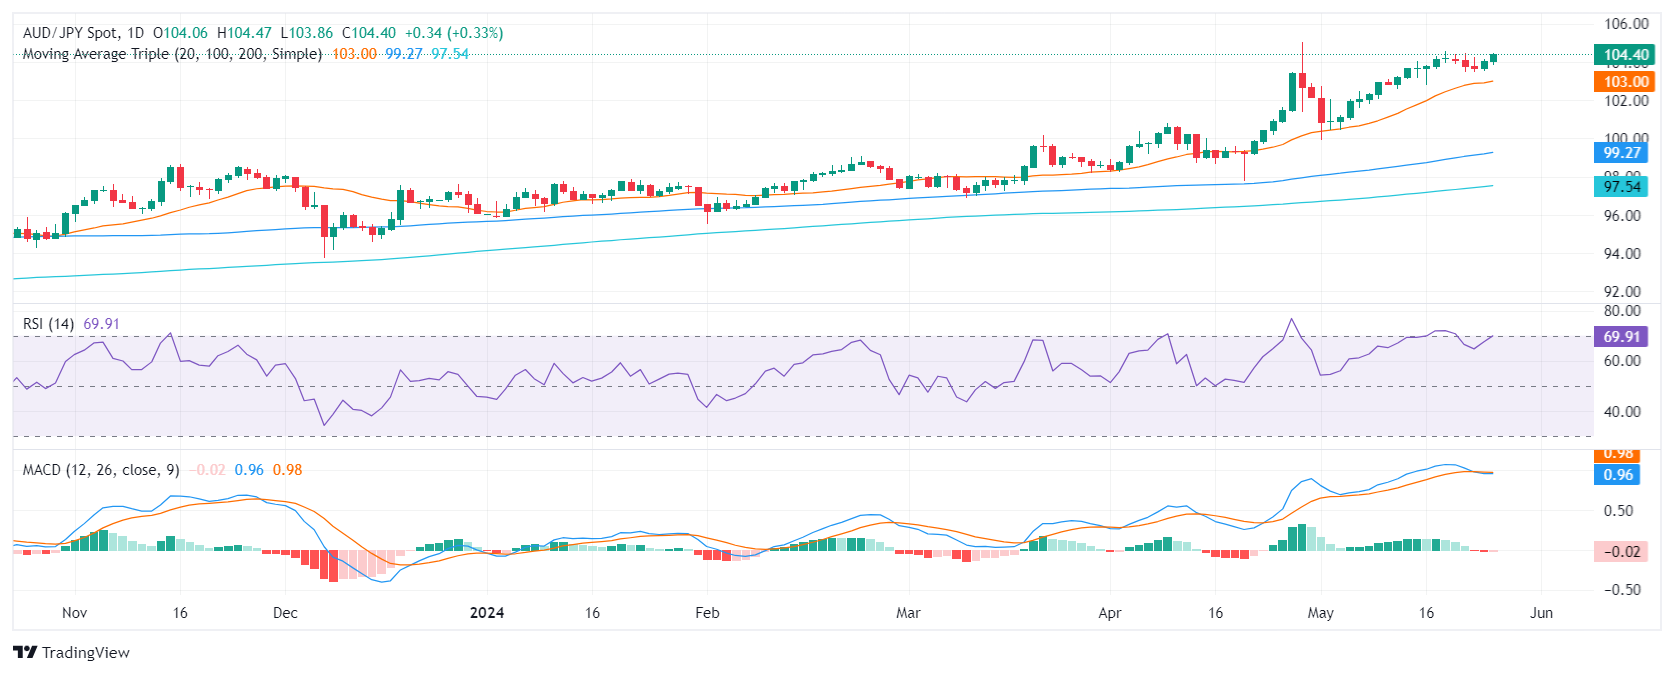
- Daily chart indicators depict a steady buying traction with RSI deep in positive area , but nearing overbought conditions.
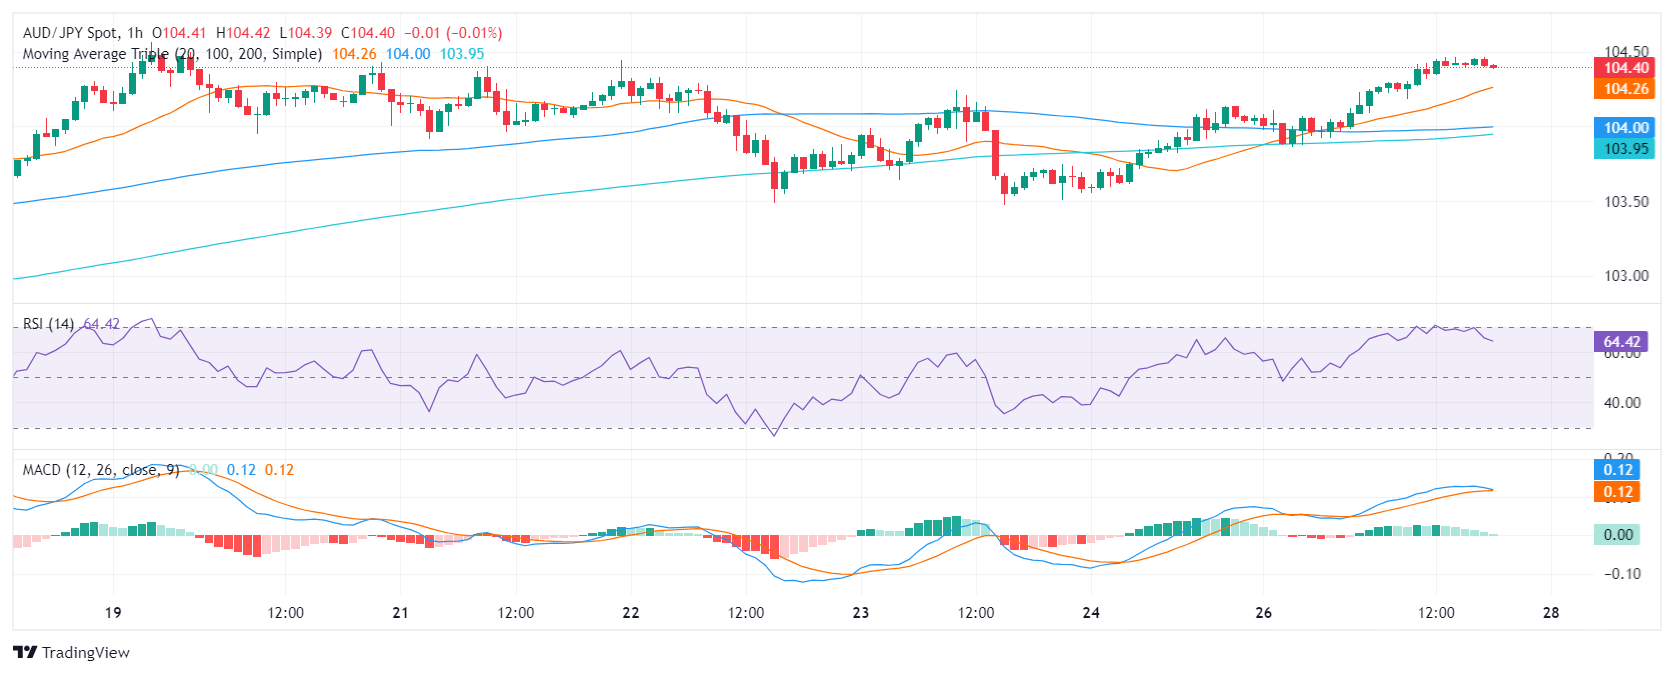
- On the hourly chart indicators are beginning to flatten, which suggests the cross may face some losses ahead of the Asian session.
- Given the heightened momentum, the stage could be set for a shift in market dominance, suggesting a potential correction on the horizon.
In Monday's session, the AUD/JPY pair managed to acquire supplementary momentum and saw some gains. Despite the strength of the buying momentum, the market may be heading for a correction since the Relative Strength Index (RSI) and Moving Average Convergence Divergence (MACD) hint at overbought levels. Ahead of the Asian session, with the pair nearing cyclical peaks, an incoming pullback for the cross may be on the horizon.
Examining the daily chart, the RSI is near the overbought territory. A gradual decrease from overbought conditions is evident while maintaining a positive trend, indicating buyers' dominance but hinting at a potential flattening. In line with that, the MACD shows a negative momentum as red bars are seen.
AUD/JPY daily chart
The hourly RSI values reveal a similar positive trend, with values hovering around the 60 mark but pointing downwards. This is backed by the MACD which prints decreasing green bars.
AUD/JPY hourly chart
In the broader context, the AUD/JPY is trading above all three key Simple Moving Average (SMA) benchmarks of 20, 100, and 200 days and this alignment suggests a strong bullish outlook for the pair. However, as the pair remains near cycle highs and due to the cross momentum becoming overextended, a correction could be imminent.


© 2000-2026. Bản quyền Teletrade.
Trang web này được quản lý bởi Teletrade D.J. LLC 2351 LLC 2022 (Euro House, Richmond Hill Road, Kingstown, VC0100, St. Vincent and the Grenadines).
Thông tin trên trang web không phải là cơ sở để đưa ra quyết định đầu tư và chỉ được cung cấp cho mục đích làm quen.
Giao dịch trên thị trường tài chính (đặc biệt là giao dịch sử dụng các công cụ biên) mở ra những cơ hội lớn và tạo điều kiện cho các nhà đầu tư sẵn sàng mạo hiểm để thu lợi nhuận, tuy nhiên nó mang trong mình nguy cơ rủi ro khá cao. Chính vì vậy trước khi tiến hành giao dịch cần phải xem xét mọi mặt vấn đề chấp nhận tiến hành giao dịch cụ thể xét theo quan điểm của nguồn lực tài chính sẵn có và mức độ am hiểu thị trường tài chính.
Sử dụng thông tin: sử dụng toàn bộ hay riêng biệt các dữ liệu trên trang web của công ty TeleTrade như một nguồn cung cấp thông tin nhất định. Việc sử dụng tư liệu từ trang web cần kèm theo liên kết đến trang teletrade.vn. Việc tự động thu thập số liệu cũng như thông tin từ trang web TeleTrade đều không được phép.
Xin vui lòng liên hệ với pr@teletrade.global nếu có câu hỏi.
ngân hàng