- Phân tích
- Tin tức và các công cụ
- Tin tức thị trường
- USD/JPY Price Analysis: Flatlines amid subdued session, hovers around 156.90
USD/JPY Price Analysis: Flatlines amid subdued session, hovers around 156.90
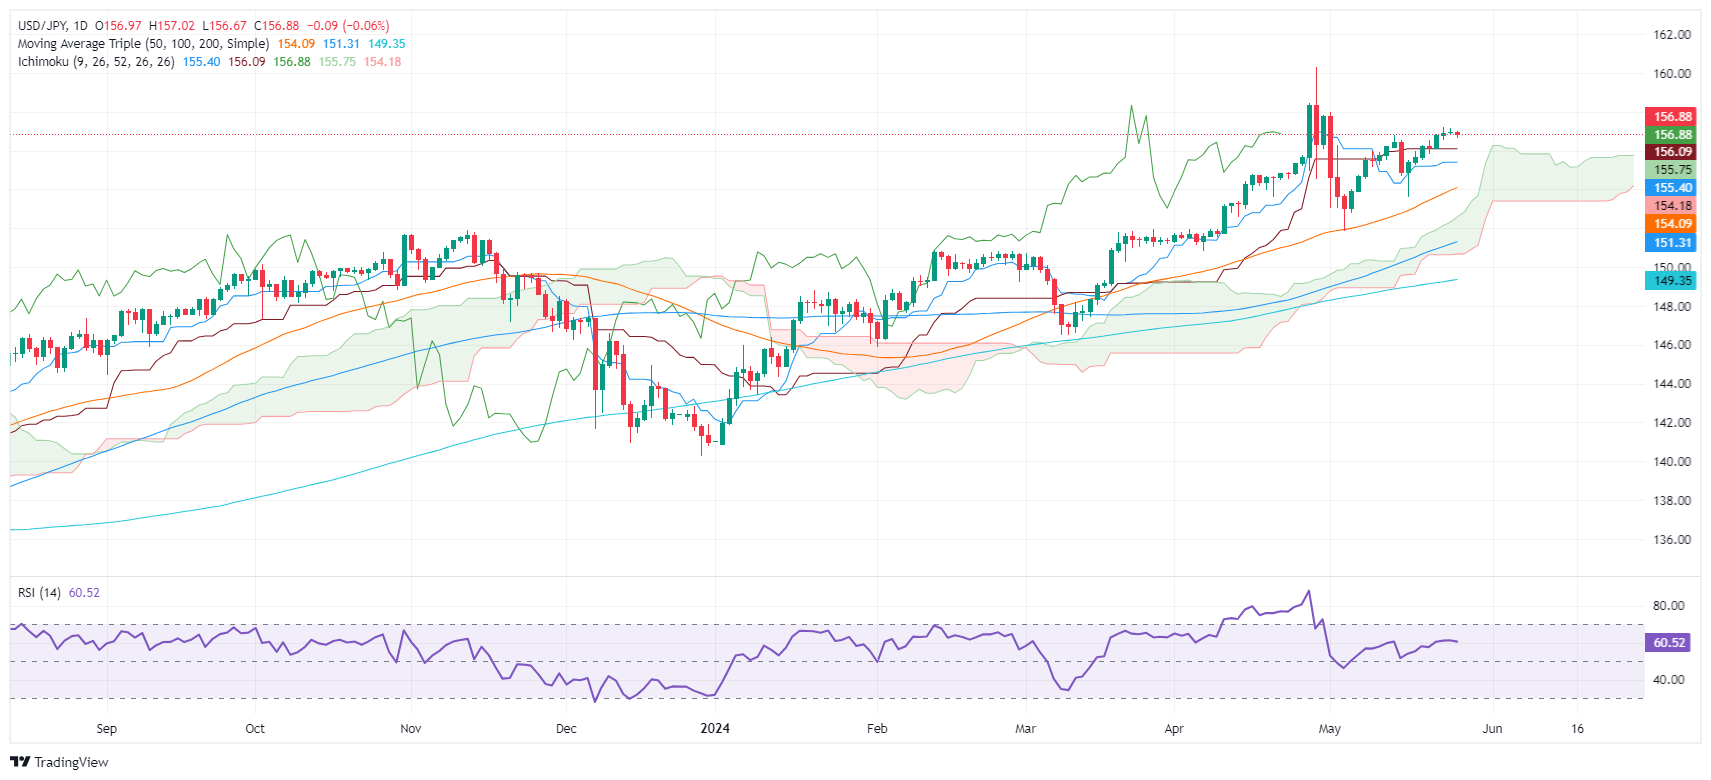
- USD/JPY down slightly by 0.08% at 156.87, amid low-volume trading due to US Memorial Day.
- Technicals show an upward trend, with prices above the Ichimoku Cloud, Tenkan-Sen, and Kijun-Sen.
- Resistance at 157.00, followed by April 26 high of 158.44 and YTD high of 160.32.
- Support levels include Tenkan-Sen at 156.05, Senkou Span A at 155.72, Kijun-Sen at 155.39, and 50-DMA at 154.08.
The USD/JPY trade subdued amid low-volume trading on Monday. courtesy of the observance of Memorial Day, as Wall Street remained closed. The major trades at 156.87, registering modest losses of 0.08%.
USD/JPY Price Analysis: Technical outlook
From a technical perspective, the USD/JPY is upward biased, as evidenced by successive series of higher highs and lows and price action standing above the Ichimoku Cloud (Kumo). Additionally, the spot price is also above the Tenkan and Kijun-Sen, a further indication of bulls’ strength. Yet intervention threats by Japanese authorities kept buyers at bay instead of committing to open fresh long positions.
However, if USD/JPY clears the 157.00 figure, further gains lie overhead. The next resistance would be the April 26 high at 158.44, followed by the year-to-date (YTD) high at 160.32.
Conversely, if it stumbles below the confluence of the Tenkan-Sen at 156.05, that will sponsor a leg down. Next key support levels emerge at the Senkou Span A at 155.72, followed by the Kijun-Sen at 155.39, ahead of the 50-day moving average (DMA) at 154.08.
USD/JPY Price Action – Daily Chart


© 2000-2026. Bản quyền Teletrade.
Trang web này được quản lý bởi Teletrade D.J. LLC 2351 LLC 2022 (Euro House, Richmond Hill Road, Kingstown, VC0100, St. Vincent and the Grenadines).
Thông tin trên trang web không phải là cơ sở để đưa ra quyết định đầu tư và chỉ được cung cấp cho mục đích làm quen.
Giao dịch trên thị trường tài chính (đặc biệt là giao dịch sử dụng các công cụ biên) mở ra những cơ hội lớn và tạo điều kiện cho các nhà đầu tư sẵn sàng mạo hiểm để thu lợi nhuận, tuy nhiên nó mang trong mình nguy cơ rủi ro khá cao. Chính vì vậy trước khi tiến hành giao dịch cần phải xem xét mọi mặt vấn đề chấp nhận tiến hành giao dịch cụ thể xét theo quan điểm của nguồn lực tài chính sẵn có và mức độ am hiểu thị trường tài chính.
Sử dụng thông tin: sử dụng toàn bộ hay riêng biệt các dữ liệu trên trang web của công ty TeleTrade như một nguồn cung cấp thông tin nhất định. Việc sử dụng tư liệu từ trang web cần kèm theo liên kết đến trang teletrade.vn. Việc tự động thu thập số liệu cũng như thông tin từ trang web TeleTrade đều không được phép.
Xin vui lòng liên hệ với pr@teletrade.global nếu có câu hỏi.
ngân hàng