- Phân tích
- Tin tức và các công cụ
- Tin tức thị trường
- AUD/NZD experiences a slight decline as markets await key data
AUD/NZD experiences a slight decline as markets await key data
- AUD/NZD dips mildly to 1.0821 during Monday's session.
- Markets are eyeing Australia's April CPI and Retail Sales updates this week.
- Investors will eye New Zealand's May ANZ business survey, which is expected to reveal a slowdown in activity.
The AUD/NZD is presently trading with mild fluctuations, expecting key figures from Australia and New Zealand along the week.
On the Australian side, the focus is primarily on the April Consumer Price Index (CPI) and Retail sales data. The CPI is projected to register a slight decrease, dropping to 3.4% YoY while Retail Sales are expected to recover somewhat. The outcome of the data might shape the expectations of the Reserve Bank of Australia (RBA) which has lately advocated for a cautious stance.
On the other hand, the attention in New Zealand is directed towards the ANZ business survey data for May on Tuesday. The outcome might also shape the bets on the next Reserve Bank of New Zealand (RBNZ)'s monetary policy decisions. While the bank suggested a potential rate hike, market prediction indicates an opposing view, leaning towards a first rate cut in November.
AUD/NZD technical analysis
In the daily chart, the Relative Strength Index (RSI) sits within negative territory. Despite an uptick in the latest reading to 30, the pair remains pressured, as the positive momentum observed earlier in the week has considerably waned. The negative trend, as suggested by the RSI, is further confirmed by the rising red bars of the Moving Average Convergence Divergence (MACD) histogram, affirming the downside momentum.
AUD/NZD daily chart
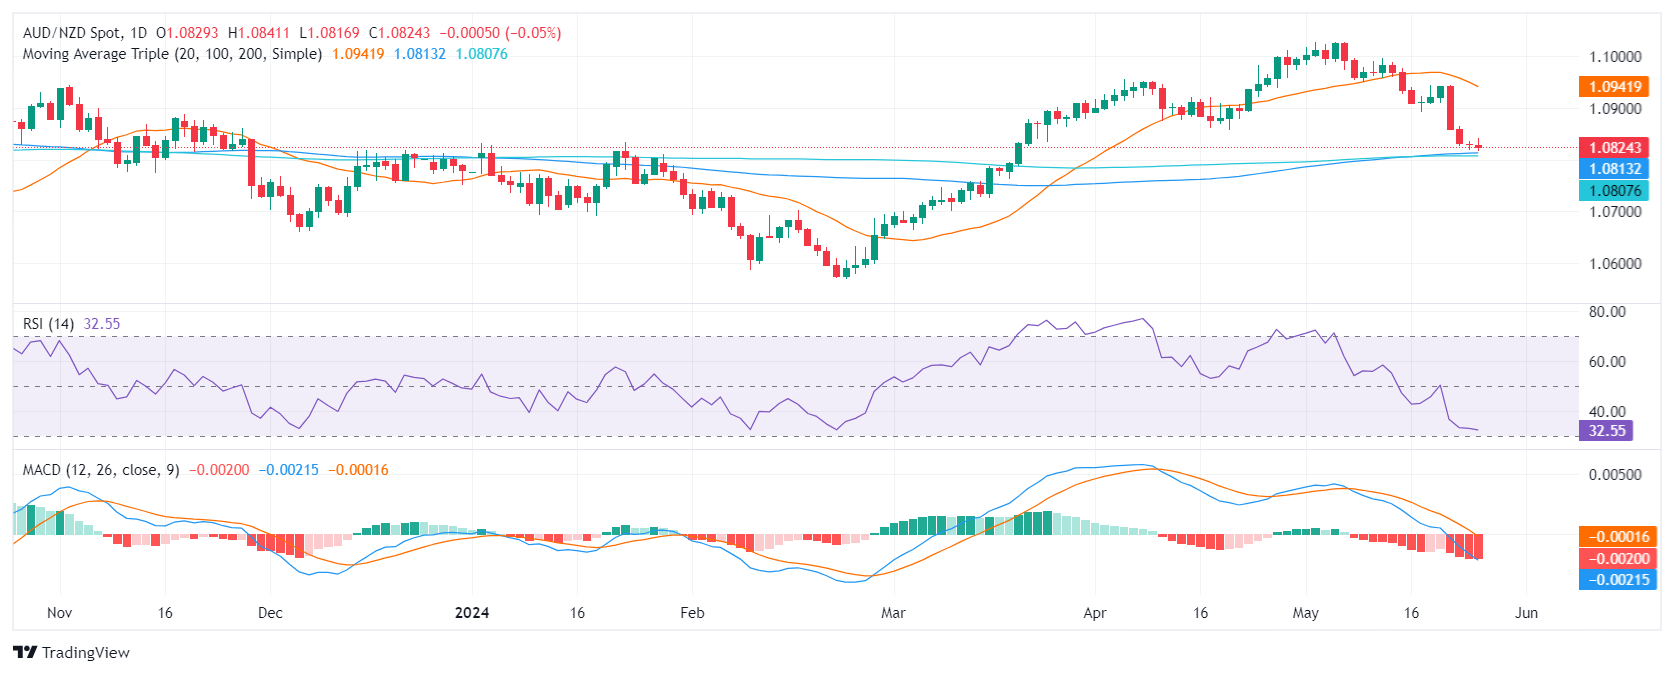
On a positive note, the pair currently trades above its 100 and 200-day Simple Moving Averages (SMA), indicating potential medium-to-long-term upward momentum. However, the AUD/NZD's positioning below the 20-day SMA highlights the near-term volatility anticipated.


© 2000-2026. Bản quyền Teletrade.
Trang web này được quản lý bởi Teletrade D.J. LLC 2351 LLC 2022 (Euro House, Richmond Hill Road, Kingstown, VC0100, St. Vincent and the Grenadines).
Thông tin trên trang web không phải là cơ sở để đưa ra quyết định đầu tư và chỉ được cung cấp cho mục đích làm quen.
Giao dịch trên thị trường tài chính (đặc biệt là giao dịch sử dụng các công cụ biên) mở ra những cơ hội lớn và tạo điều kiện cho các nhà đầu tư sẵn sàng mạo hiểm để thu lợi nhuận, tuy nhiên nó mang trong mình nguy cơ rủi ro khá cao. Chính vì vậy trước khi tiến hành giao dịch cần phải xem xét mọi mặt vấn đề chấp nhận tiến hành giao dịch cụ thể xét theo quan điểm của nguồn lực tài chính sẵn có và mức độ am hiểu thị trường tài chính.
Sử dụng thông tin: sử dụng toàn bộ hay riêng biệt các dữ liệu trên trang web của công ty TeleTrade như một nguồn cung cấp thông tin nhất định. Việc sử dụng tư liệu từ trang web cần kèm theo liên kết đến trang teletrade.vn. Việc tự động thu thập số liệu cũng như thông tin từ trang web TeleTrade đều không được phép.
Xin vui lòng liên hệ với pr@teletrade.global nếu có câu hỏi.
ngân hàng