- Phân tích
- Tin tức và các công cụ
- Tin tức thị trường
- EUR/JPY Price Analysis: Bulls times might be up as indicators approach overbought territory
EUR/JPY Price Analysis: Bulls times might be up as indicators approach overbought territory
- The daily RSI and MACD remain in positive territory but suggest that consolidation may be incoming..
- The same indicators on the hourly chart hint also signal a possible consolidation phase subsequent to recent gains.
- The EUR/JPY's position above primary SMAs maintains long-term bullish sentiment.
In Monday's session, the EUR/JPY pair is trading mildly higher, showing continued dominance by the bulls. However, caution must be exercised due to signs of overbought conditions, which tend to be followed by downward movements
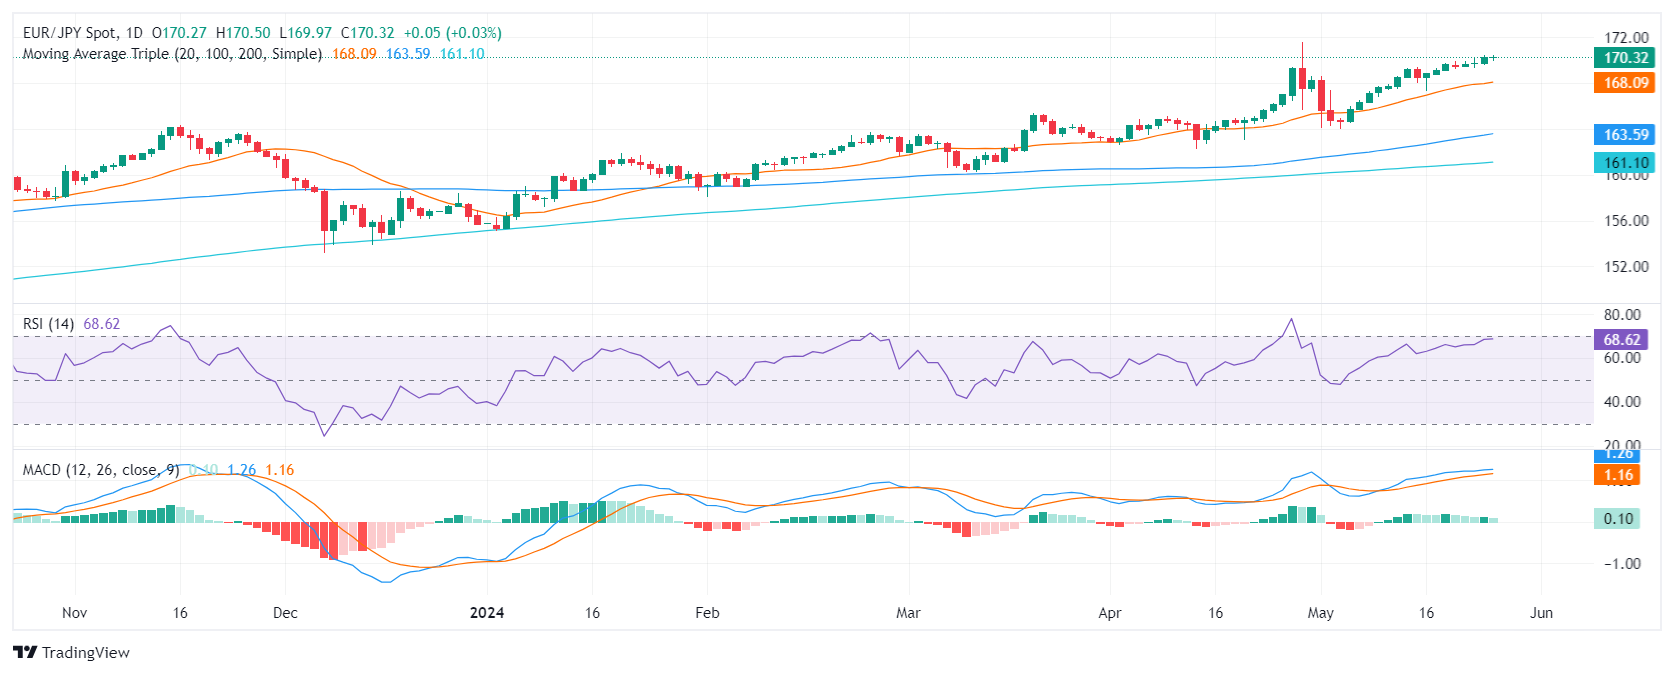
In the daily analysis, the Relative Strength Index (RSI) for the EUR/JPY pair has been observing a steady positive trend. It points out that buyers hold a strong position with the latest reading nearing overbought territory. Concurrently, the Moving Average Convergence Divergence (MACD) histogram fortifies this stance, demonstrating flat green bars symbolizing a steady but flattening positive momentum.
EUR/JPY daily chart
Transitioning to the hourly chart, the RSI has dipped from high-positive towards a negative slope, with the latest reading at 54, distancing itself from an earlier overbought condition. The MACD histogram also hints at a pace alteration, continuing to print flat green bars, implying a downturn in buying pressure.
EUR/JPY hourly chart
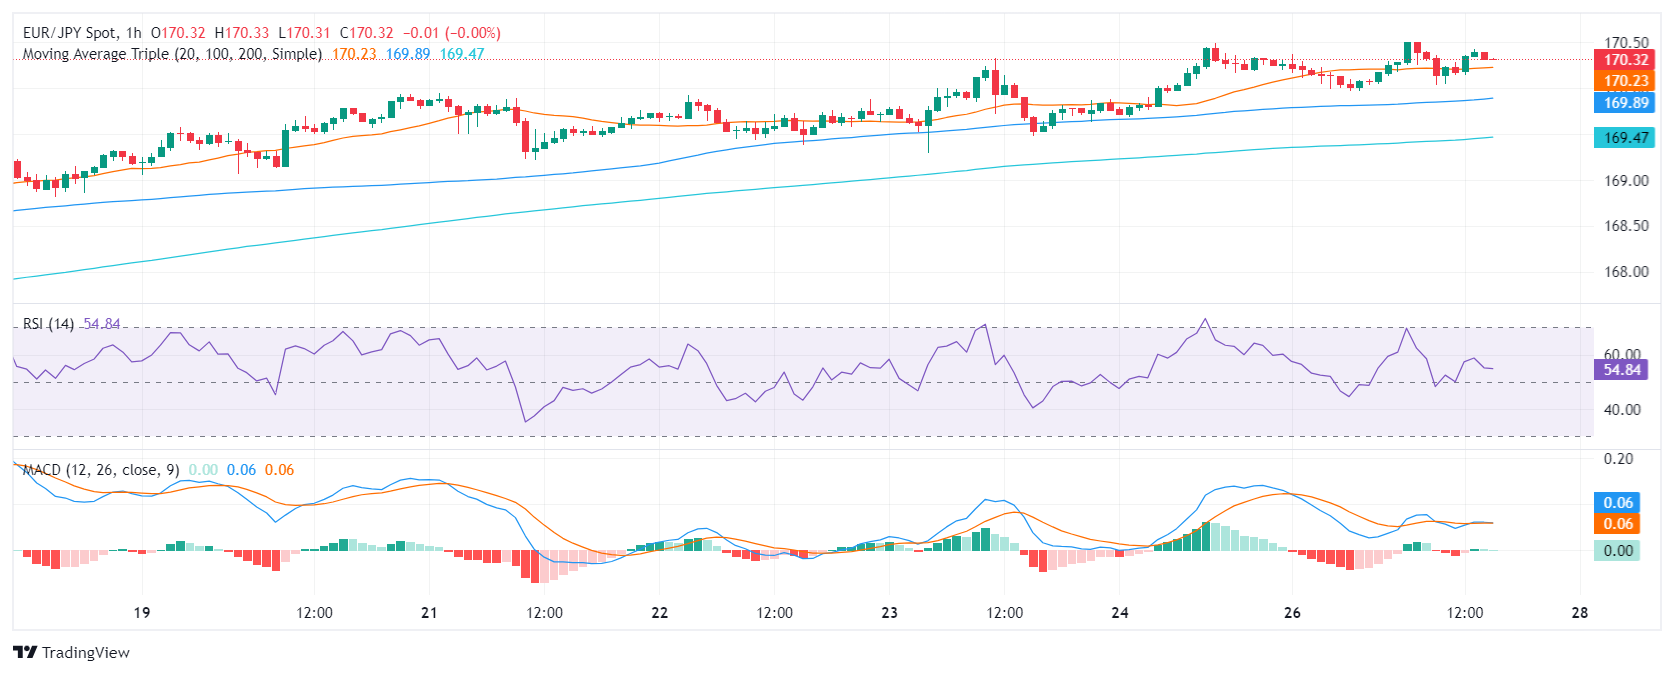
The EUR/JPY robust performance is highlighted by its position above the key Simple Moving Average (SMA) benchmarks at 20,100, and 200 days. However, a technical correction may be incoming but any movements which keep the pair above these levels could be considered as mere consolidation.


© 2000-2026. Bản quyền Teletrade.
Trang web này được quản lý bởi Teletrade D.J. LLC 2351 LLC 2022 (Euro House, Richmond Hill Road, Kingstown, VC0100, St. Vincent and the Grenadines).
Thông tin trên trang web không phải là cơ sở để đưa ra quyết định đầu tư và chỉ được cung cấp cho mục đích làm quen.
Giao dịch trên thị trường tài chính (đặc biệt là giao dịch sử dụng các công cụ biên) mở ra những cơ hội lớn và tạo điều kiện cho các nhà đầu tư sẵn sàng mạo hiểm để thu lợi nhuận, tuy nhiên nó mang trong mình nguy cơ rủi ro khá cao. Chính vì vậy trước khi tiến hành giao dịch cần phải xem xét mọi mặt vấn đề chấp nhận tiến hành giao dịch cụ thể xét theo quan điểm của nguồn lực tài chính sẵn có và mức độ am hiểu thị trường tài chính.
Sử dụng thông tin: sử dụng toàn bộ hay riêng biệt các dữ liệu trên trang web của công ty TeleTrade như một nguồn cung cấp thông tin nhất định. Việc sử dụng tư liệu từ trang web cần kèm theo liên kết đến trang teletrade.vn. Việc tự động thu thập số liệu cũng như thông tin từ trang web TeleTrade đều không được phép.
Xin vui lòng liên hệ với pr@teletrade.global nếu có câu hỏi.
ngân hàng