- Phân tích
- Tin tức và các công cụ
- Tin tức thị trường
- NZD/USD Price Analysis: Bullish sentiment maintains despite softening momentum
NZD/USD Price Analysis: Bullish sentiment maintains despite softening momentum
- Despite softening positive momentum indicated by the daily MACD, the overall trend still favors the buyers.
- Hourly chart shows fairly neutral RSI but negative momentum in MACD, signaling possible short-term fluctuations.
- Regardless of potential shifts suggested by hourly indicators, the overall bullish bias based on daily SMAs is intact.
- Signs of weakening buying momentum in NZD/USD implies potential retests of key SMAs, dictating investor alertness.
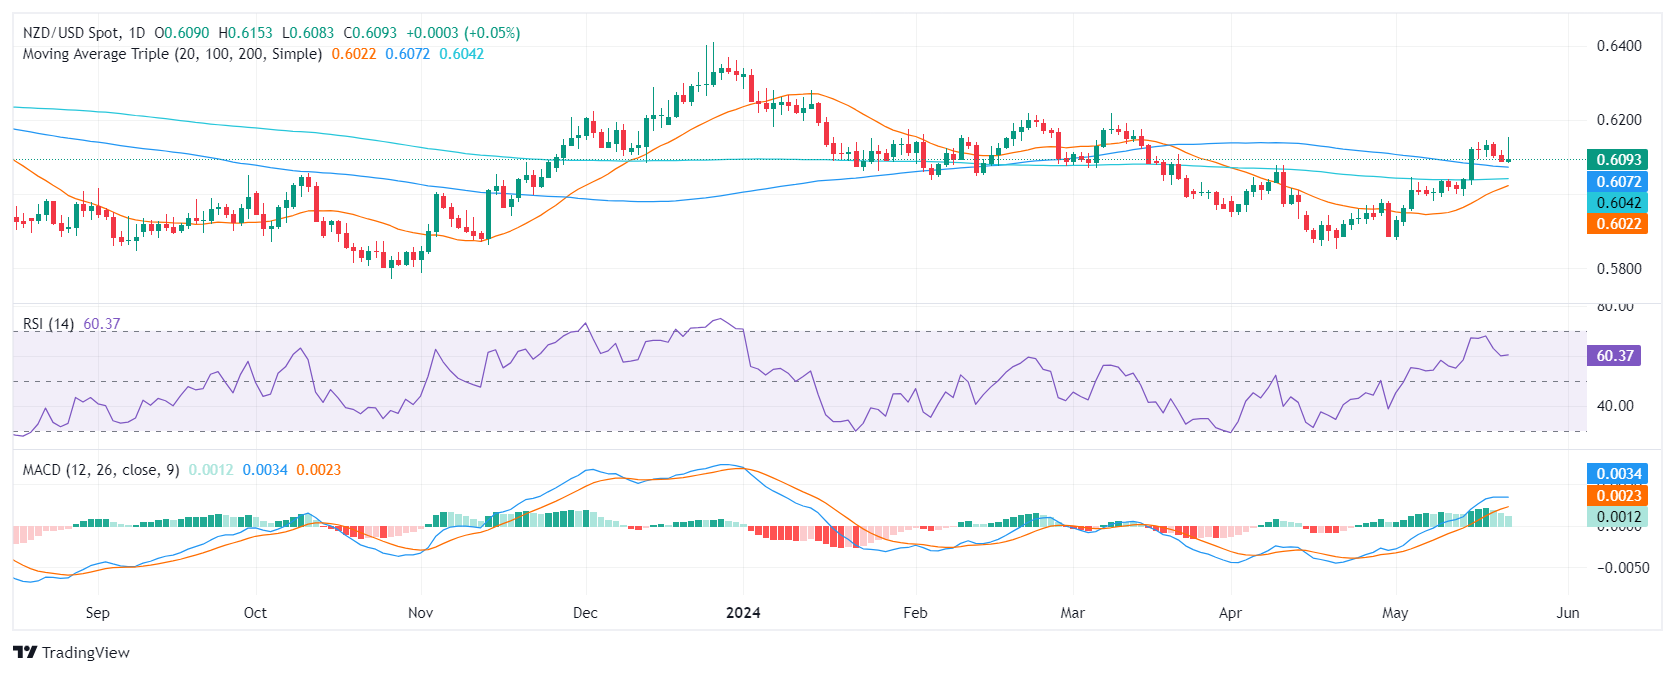
On Wednesday's session, the NZD/USD showed diminishing buying traction and fell just below 0.6100. However, the short-term outlook will be positive if the pair maintains its position over new reference points set by 100 and 200-day Simple Moving Averages (SMAs). If lost, the bears might step in aggressively.
Examining the daily chart, the Relative Strength Index (RSI) exhibits a positive but flattening trend, with its most recent reading of 60. Simultaneously, the Moving Average Convergence Divergence (MACD) displays decreasing green bars indicating a slight softening of positive momentum.
NZD/USD daily chart
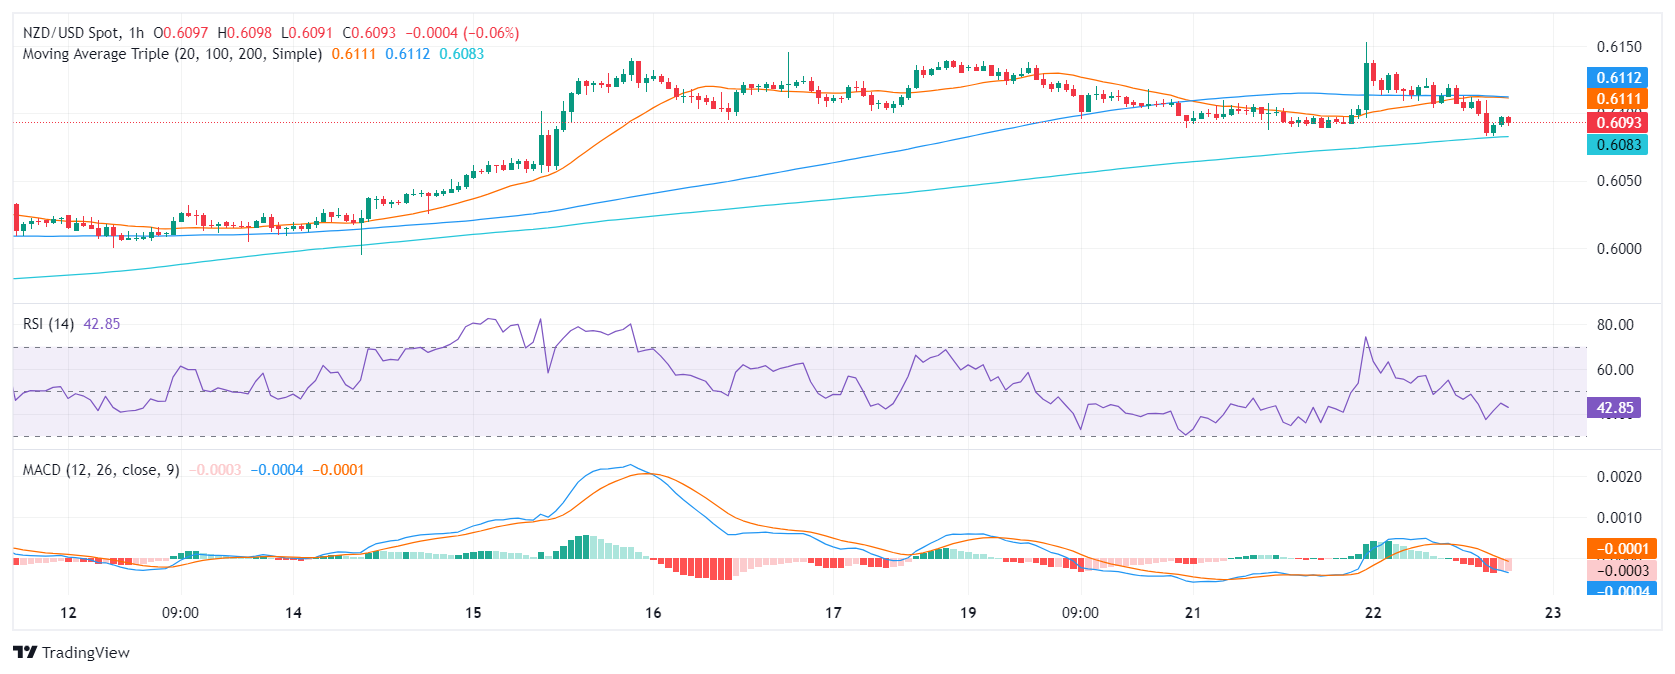
Focusing on the hourly view, the RSI has moderately adjusted with the latest reading of 41, reflecting a fairly neutral direction. Notably, the MACD histogram has produced consistently flat red bars, signaling negative momentum on an intraday basis.
NZD/USD hourly chart
In conclusion, investors seem to be taking profits and, should the pair hold above the recently-conquered 100 and 200-day Simple Moving Averages (SMAs), any downward movement should not necessarily be considered a selling signal. However, buying traction appears to be waning, and the pair is set for a retest of the mentioned SMAs.


© 2000-2026. Bản quyền Teletrade.
Trang web này được quản lý bởi Teletrade D.J. LLC 2351 LLC 2022 (Euro House, Richmond Hill Road, Kingstown, VC0100, St. Vincent and the Grenadines).
Thông tin trên trang web không phải là cơ sở để đưa ra quyết định đầu tư và chỉ được cung cấp cho mục đích làm quen.
Giao dịch trên thị trường tài chính (đặc biệt là giao dịch sử dụng các công cụ biên) mở ra những cơ hội lớn và tạo điều kiện cho các nhà đầu tư sẵn sàng mạo hiểm để thu lợi nhuận, tuy nhiên nó mang trong mình nguy cơ rủi ro khá cao. Chính vì vậy trước khi tiến hành giao dịch cần phải xem xét mọi mặt vấn đề chấp nhận tiến hành giao dịch cụ thể xét theo quan điểm của nguồn lực tài chính sẵn có và mức độ am hiểu thị trường tài chính.
Sử dụng thông tin: sử dụng toàn bộ hay riêng biệt các dữ liệu trên trang web của công ty TeleTrade như một nguồn cung cấp thông tin nhất định. Việc sử dụng tư liệu từ trang web cần kèm theo liên kết đến trang teletrade.vn. Việc tự động thu thập số liệu cũng như thông tin từ trang web TeleTrade đều không được phép.
Xin vui lòng liên hệ với pr@teletrade.global nếu có câu hỏi.
ngân hàng