- Phân tích
- Tin tức và các công cụ
- Tin tức thị trường
- USD/JPY Price Analysis: Sideways below 156.50 as US yields fall
USD/JPY Price Analysis: Sideways below 156.50 as US yields fall
- USD/JPY faces resistance at 156.50 as 10-year Treasury yields decline.
- Bullish technical outlook with waning momentum; RSI under 50 could signal potential losses.
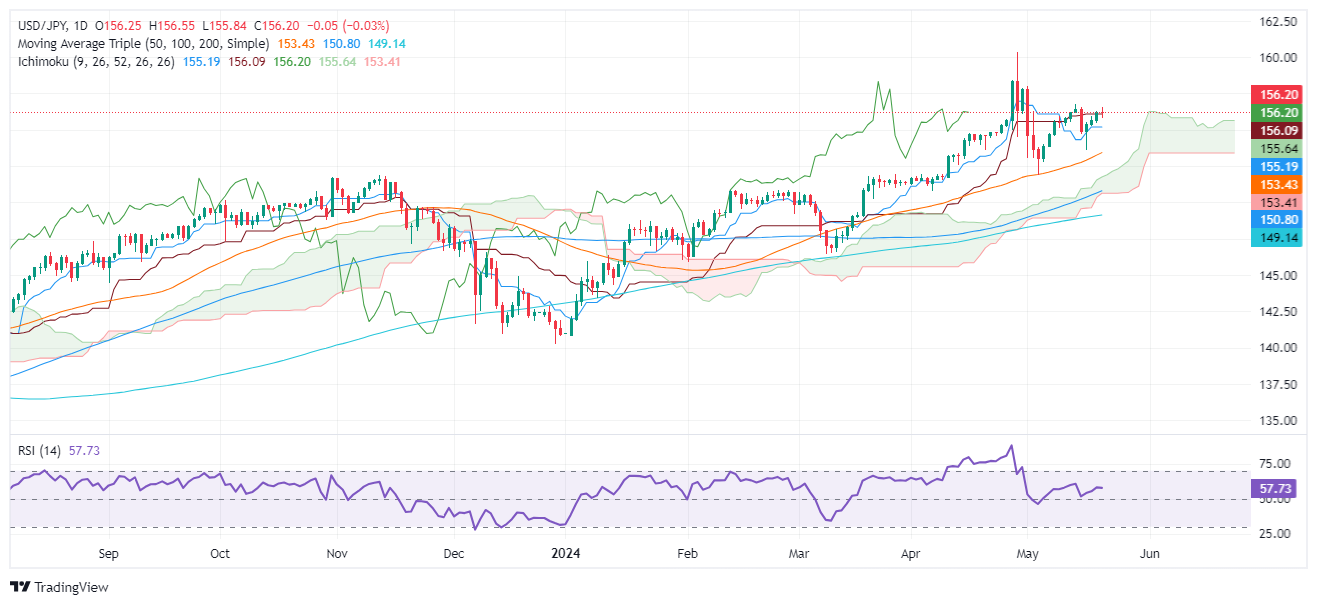
- Resistance levels lie at 156.76, 157.00, and YTD high of 160.32.
- Key support emerges at 156.00, Senkou Span A (155.61), and Kijun-Sen (155.18).
The USD/JPY pair faces stir resistance at around 156.50 retreats as the US 10-year Treasury note yield drops three and a half basis points, a headwind for the Greenback. The positive correlation between the major and the US 10-year note yield weighed on the pair, down 0.06%, and trades at 156.19.
USD/JPY Price Analysis: Technical outlook
The USD/JPY remains upward biased, but buyers seem to have lost some momentum. They remain unable to bring the pair upwards and challenge the latest cycle high of 156.76, the May 14 high. The Relative Strength Index (RSI) suggests that buying pressure is fading. Despite standing in bullish territory, if the RSI punches below the 50-midline, that could pave the way for USD/JPY losses.
For a bullish continuation, the USD/JPY first resistance would be 156.76, followed by 157.00. Up next would be the May 1 high at 157.98, ahead of challenging the year-to-date (YTD) high of 160.32.
On the flip side, and the most likely path in the near term, if USD/JPY tumbles below 156.00, the first support would be the Senkou Span A at 155.61. Once cleared, the next stop would be the Kijun-Sen at 155.18 ahead of 155.00.
USD/JPY Price Action – Daily Chart


© 2000-2026. Bản quyền Teletrade.
Trang web này được quản lý bởi Teletrade D.J. LLC 2351 LLC 2022 (Euro House, Richmond Hill Road, Kingstown, VC0100, St. Vincent and the Grenadines).
Thông tin trên trang web không phải là cơ sở để đưa ra quyết định đầu tư và chỉ được cung cấp cho mục đích làm quen.
Giao dịch trên thị trường tài chính (đặc biệt là giao dịch sử dụng các công cụ biên) mở ra những cơ hội lớn và tạo điều kiện cho các nhà đầu tư sẵn sàng mạo hiểm để thu lợi nhuận, tuy nhiên nó mang trong mình nguy cơ rủi ro khá cao. Chính vì vậy trước khi tiến hành giao dịch cần phải xem xét mọi mặt vấn đề chấp nhận tiến hành giao dịch cụ thể xét theo quan điểm của nguồn lực tài chính sẵn có và mức độ am hiểu thị trường tài chính.
Sử dụng thông tin: sử dụng toàn bộ hay riêng biệt các dữ liệu trên trang web của công ty TeleTrade như một nguồn cung cấp thông tin nhất định. Việc sử dụng tư liệu từ trang web cần kèm theo liên kết đến trang teletrade.vn. Việc tự động thu thập số liệu cũng như thông tin từ trang web TeleTrade đều không được phép.
Xin vui lòng liên hệ với pr@teletrade.global nếu có câu hỏi.
ngân hàng