- Phân tích
- Tin tức và các công cụ
- Tin tức thị trường
- NZD/USD Price Analysis: Bulls assert dominance, closes its best week of 2024
NZD/USD Price Analysis: Bulls assert dominance, closes its best week of 2024
- The daily chart reveals a strong bullish sentiment with indicators deep in positive territory.
- Hourly indicators show a flattening buying traction but remain positive.
- The pair closed its best week since November 2023.
In Friday's session, the NZD/USD rose to the 0.6137 level, demonstrating a strong bullish trend. After closing above its main Simple Moving Averages (SMAs) of 20,100 and 200 days, the pair secured its best week since late 2023.
On the daily chart, the Relative Strength Index (RSI) reveals a positive trend, moving from below 60 and nearing the 70 mark. This indicates that the NZD/USD pair is accumulating strength, demonstrating bullish pressure in the recent sessions. Concurrently, the Moving Average Convergence Divergence (MACD) prints green bars, showing steady buying traction.
NZD/USD daily chart

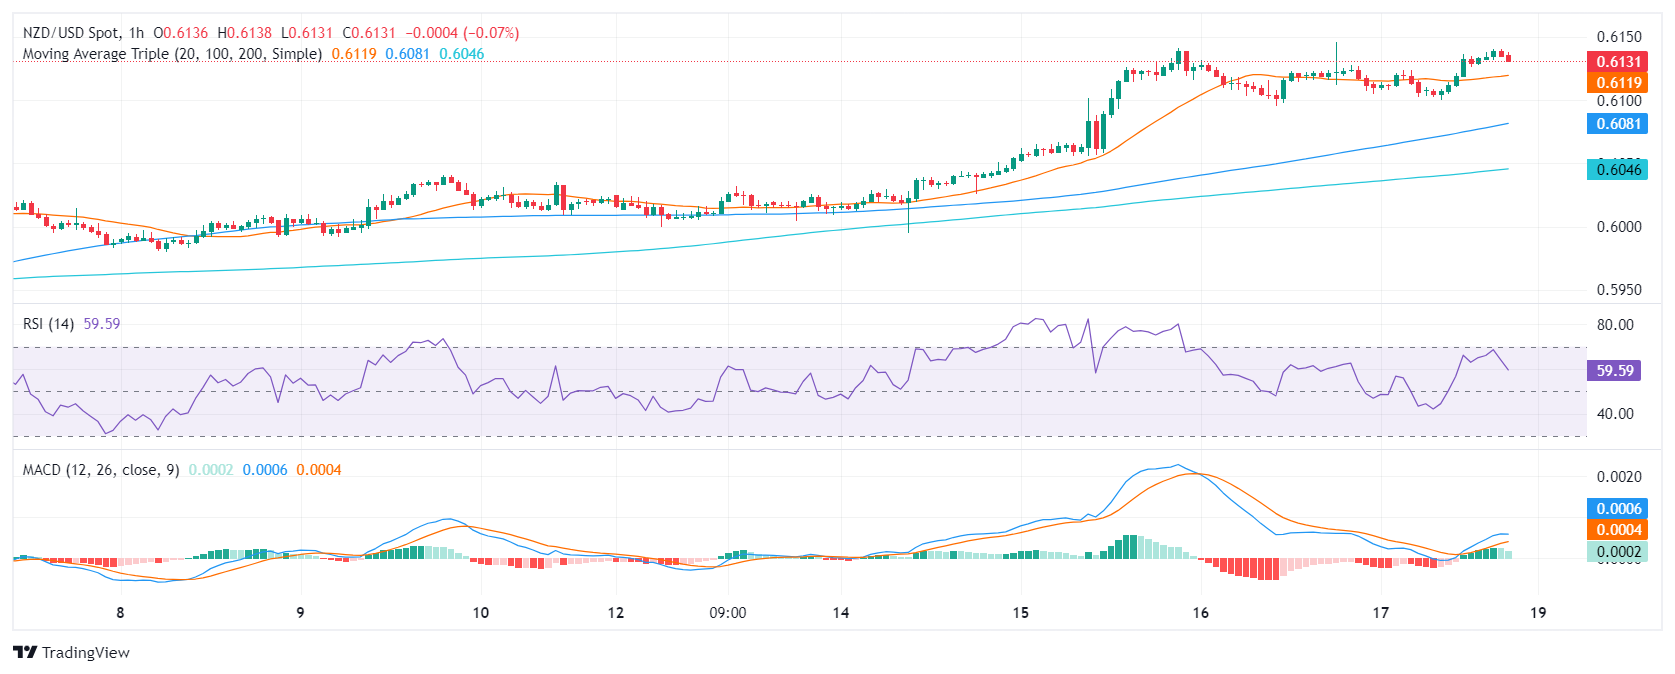
The hourly RSI readings exhibit a consistent positive trend over the recent hours, but was seen finishing at 57.17 but pointing downwards. The hourly MACD chart supports this view, with gradually diminishing green bars indicating a slowing positive momentum as investors take profits.
NZD/USD hourly chart
In conclusion, the NZD/USD is in a robust technical position, showing short and long-term bullish signals on the daily and short-term charts. Although the RSI shows that the pair is approaching overbought conditions and the hourly indicators show dwindling positive momentum, the pair retains its position above vital SMAs. Traders shouldn’t take off the table further corrective movements as investors might continue taking profits.


© 2000-2026. Bản quyền Teletrade.
Trang web này được quản lý bởi Teletrade D.J. LLC 2351 LLC 2022 (Euro House, Richmond Hill Road, Kingstown, VC0100, St. Vincent and the Grenadines).
Thông tin trên trang web không phải là cơ sở để đưa ra quyết định đầu tư và chỉ được cung cấp cho mục đích làm quen.
Giao dịch trên thị trường tài chính (đặc biệt là giao dịch sử dụng các công cụ biên) mở ra những cơ hội lớn và tạo điều kiện cho các nhà đầu tư sẵn sàng mạo hiểm để thu lợi nhuận, tuy nhiên nó mang trong mình nguy cơ rủi ro khá cao. Chính vì vậy trước khi tiến hành giao dịch cần phải xem xét mọi mặt vấn đề chấp nhận tiến hành giao dịch cụ thể xét theo quan điểm của nguồn lực tài chính sẵn có và mức độ am hiểu thị trường tài chính.
Sử dụng thông tin: sử dụng toàn bộ hay riêng biệt các dữ liệu trên trang web của công ty TeleTrade như một nguồn cung cấp thông tin nhất định. Việc sử dụng tư liệu từ trang web cần kèm theo liên kết đến trang teletrade.vn. Việc tự động thu thập số liệu cũng như thông tin từ trang web TeleTrade đều không được phép.
Xin vui lòng liên hệ với pr@teletrade.global nếu có câu hỏi.
ngân hàng