- Phân tích
- Tin tức và các công cụ
- Tin tức thị trường
- EUR/USD Price Analysis: Drops to near 1.0850, further support at nine-day EMA
EUR/USD Price Analysis: Drops to near 1.0850, further support at nine-day EMA
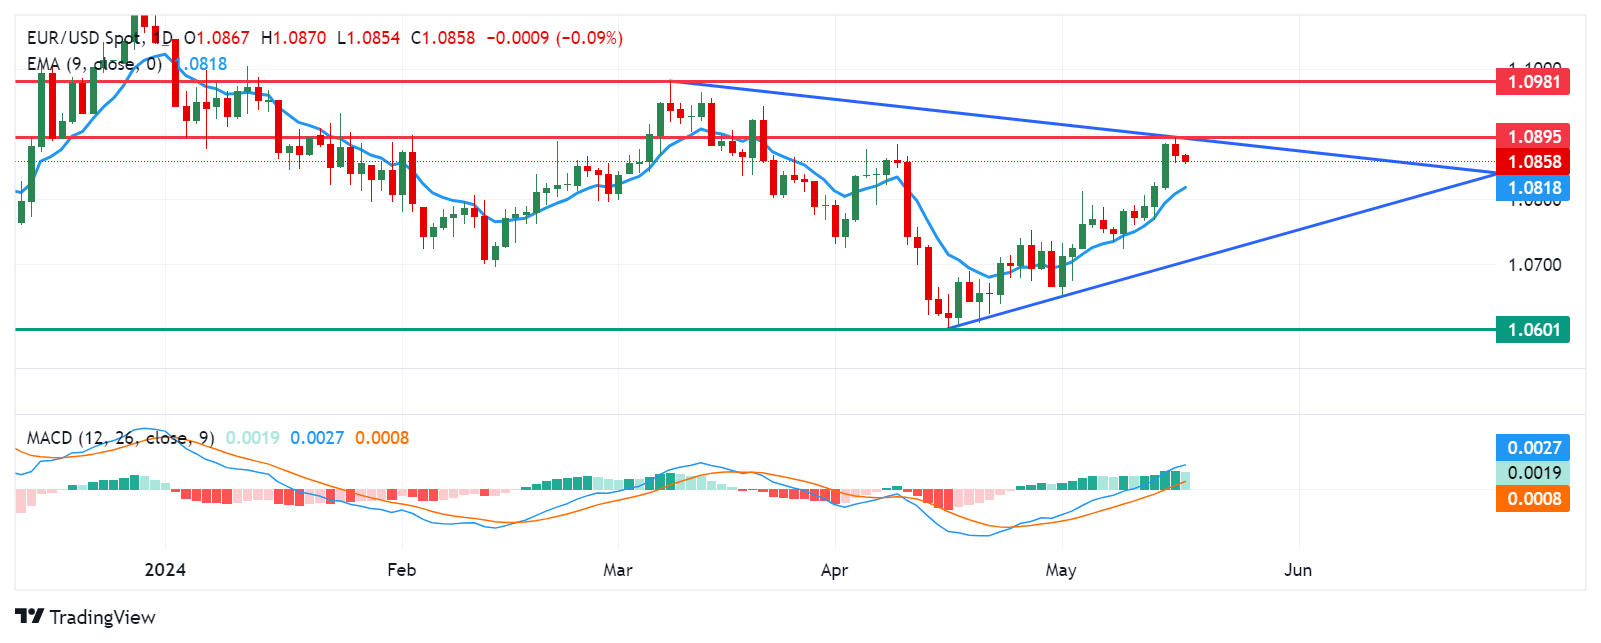
- EUR/USD could retest the upper boundary aligned with the psychological level of 1.0900.
- The momentum indicator MACD suggests a bullish sentiment for the pair.
- The potential support appears at the nine-day EMA at 1.0818.
EUR/USD continues to lose ground, trading around 1.0860 during the Asian hours on Friday. From a technical perspective on a daily chart, analysis indicates a sideways trend for the pair as it continues to lie within the symmetrical triangle. A surpassing of the upper boundary could shift the momentum toward a bullish bias.
However, the momentum indicator Moving Average Convergence Divergence (MACD) suggests a bullish sentiment for the EUR/USD pair. Positioned above the centerline, there's a noted divergence above the signal line, indicating upward momentum.
The EUR/USD pair could challenge the key barrier at the upper boundary of the symmetrical triangle aligned with the psychological level of 1.0900. A break above this level could support the pair to test the pullback resistance at 1.0981.
Conversely, downside potential for the EUR/USD pair suggests initial support near the significant level of 1.0850, with further support expected around the nine-day Exponential Moving Average (EMA) at 1.0818. A breach below the latter could prompt movement toward the lower boundary of the symmetrical triangle, aligning with the psychological threshold of 1.0700. Additional support levels might come into play around April’s low at 1.0601.
EUR/USD: Daily Chart


© 2000-2026. Bản quyền Teletrade.
Trang web này được quản lý bởi Teletrade D.J. LLC 2351 LLC 2022 (Euro House, Richmond Hill Road, Kingstown, VC0100, St. Vincent and the Grenadines).
Thông tin trên trang web không phải là cơ sở để đưa ra quyết định đầu tư và chỉ được cung cấp cho mục đích làm quen.
Giao dịch trên thị trường tài chính (đặc biệt là giao dịch sử dụng các công cụ biên) mở ra những cơ hội lớn và tạo điều kiện cho các nhà đầu tư sẵn sàng mạo hiểm để thu lợi nhuận, tuy nhiên nó mang trong mình nguy cơ rủi ro khá cao. Chính vì vậy trước khi tiến hành giao dịch cần phải xem xét mọi mặt vấn đề chấp nhận tiến hành giao dịch cụ thể xét theo quan điểm của nguồn lực tài chính sẵn có và mức độ am hiểu thị trường tài chính.
Sử dụng thông tin: sử dụng toàn bộ hay riêng biệt các dữ liệu trên trang web của công ty TeleTrade như một nguồn cung cấp thông tin nhất định. Việc sử dụng tư liệu từ trang web cần kèm theo liên kết đến trang teletrade.vn. Việc tự động thu thập số liệu cũng như thông tin từ trang web TeleTrade đều không được phép.
Xin vui lòng liên hệ với pr@teletrade.global nếu có câu hỏi.
ngân hàng