- Phân tích
- Tin tức và các công cụ
- Tin tức thị trường
- Silver Price Analysis: XAG/USD rally pauses as ‘doji’ emerges as US yields climb
Silver Price Analysis: XAG/USD rally pauses as ‘doji’ emerges as US yields climb
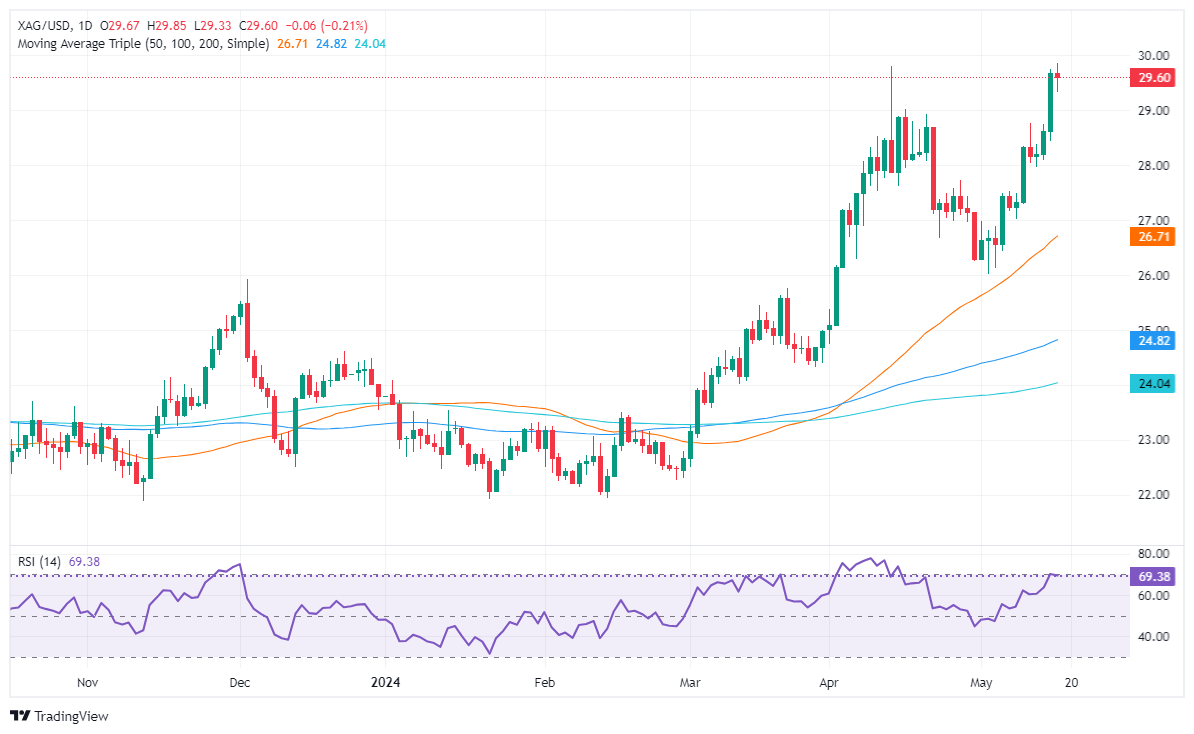
- Silver trades at $29.60, posting slight losses of 0.04% amid mixed US economic data.
- Technical outlook shows a ‘doji’ pattern, signaling indecision among traders.
- Silver must stay above $29.00 to challenge the YTD high of $29.79 and further resistance levels at $32.15 and $35.40.
Silver’s advancement paused on Thursday, as the grey metal posted minuscule losses of 0.04%, exchanging hands virtually unchanged. Jobs data, along with mixed housing data and the lack of strength in the manufacturing and industrial sectors, boosted US yields and the Greenback. Therefore, the grey metal dropped and traded at $29.60 at the time of writing.
XAG/USD Price Analysis: Technical outlook
Silver’s uptrend remains in place, but Thursday’s price action forming a ‘doji’ indicates that neither buyers nor sellers are in the domain of price action. It should be said that a ‘double top’ looms. However, momentum favors the former, as the Relative Strength Index (RSI) continues to aim upward despite approaching overbought conditions.
That said, if XAG/USD stays above $29.00, buyers could remain hopeful of testing the year-to-date (YTD) high of $29.79. A breach of the latter will pave the way to challenge the February 2013 high of $32.15, followed by the October 2012 high of $35.40.
Conversely, sellers must drag Silver’s price below the $29.00 figure. In that outcome, the pullback could reach the May 18, 2021, high turned support at $28.75, followed by the $28.00 mark. Further losses lie below the latter, with key support seen at $27.00.
XAG/USD Price Action – Daily Chart


© 2000-2026. Bản quyền Teletrade.
Trang web này được quản lý bởi Teletrade D.J. LLC 2351 LLC 2022 (Euro House, Richmond Hill Road, Kingstown, VC0100, St. Vincent and the Grenadines).
Thông tin trên trang web không phải là cơ sở để đưa ra quyết định đầu tư và chỉ được cung cấp cho mục đích làm quen.
Giao dịch trên thị trường tài chính (đặc biệt là giao dịch sử dụng các công cụ biên) mở ra những cơ hội lớn và tạo điều kiện cho các nhà đầu tư sẵn sàng mạo hiểm để thu lợi nhuận, tuy nhiên nó mang trong mình nguy cơ rủi ro khá cao. Chính vì vậy trước khi tiến hành giao dịch cần phải xem xét mọi mặt vấn đề chấp nhận tiến hành giao dịch cụ thể xét theo quan điểm của nguồn lực tài chính sẵn có và mức độ am hiểu thị trường tài chính.
Sử dụng thông tin: sử dụng toàn bộ hay riêng biệt các dữ liệu trên trang web của công ty TeleTrade như một nguồn cung cấp thông tin nhất định. Việc sử dụng tư liệu từ trang web cần kèm theo liên kết đến trang teletrade.vn. Việc tự động thu thập số liệu cũng như thông tin từ trang web TeleTrade đều không được phép.
Xin vui lòng liên hệ với pr@teletrade.global nếu có câu hỏi.
ngân hàng