- Phân tích
- Tin tức và các công cụ
- Tin tức thị trường
- EUR/USD reaches for 1.0900, easing US CPI inflation pummels Greenback
EUR/USD reaches for 1.0900, easing US CPI inflation pummels Greenback
- EUR/USD climbs on broad-market Greenback selloff.
- US CPI inflation eases further, sparking Fed rate cut hopes.
- Bets for September rate cut firm up.
EUR/USD climbed on Wednesday in one of the pair’s single-best days of 2024, climbing towards 1.0900 and on pace to etch in a fourth consecutive gain week. Broad-market selling pressure deflated the US Dollar (USD) after risk appetite roared to the forefront after US Consumer Price Index (CPI) inflation eased more than investors expected.
US CPI inflation eased to 0.3% MoM, below median market forecasts of a steady 0.4% print and triggering a broad-market risk rally as sentiment pinned further into hope for an approaching rate cut from the Federal Reserve (Fed) in September. According to the CME’s FedWatch Tool, rate markets are pricing in over 70% odds of at least a quarter-point rate trim when the Fed meets in September.
European final Gross Domestic Product (GDP) figures broadly came in as expected for the first quarter, with Q1 GDP printing at 0.3% QoQ, which is in line with forecasts and the previous quarter’s growth. The rest of the week is strictly mid-tier data releases on both sides of the Atlantic, leaving markets to wistfully look ahead to whether or not the Fed will cut interest rates late in the third quarter.
EUR/USD technical outlook
EUR/USD is taking a bullish run at the 1.0900 handle as the pair extends a bullish bounce from the 200-hour Exponential Moving Average (EMA) from 1.0730. The 200-hour EMA is rising above 1.0780, but intraday bidding has dragged EUR/USD well above technical indicators, and the pair is up over 2.7% from April’s swing low near 1.0600.
Daily candles pierced the 200-day EMA at 1.0798 on Wednesday, but a descending pattern of lower highs threatens a clean extension with a near-term technical ceiling priced in from 1.0950.
EUR/USD hourly chart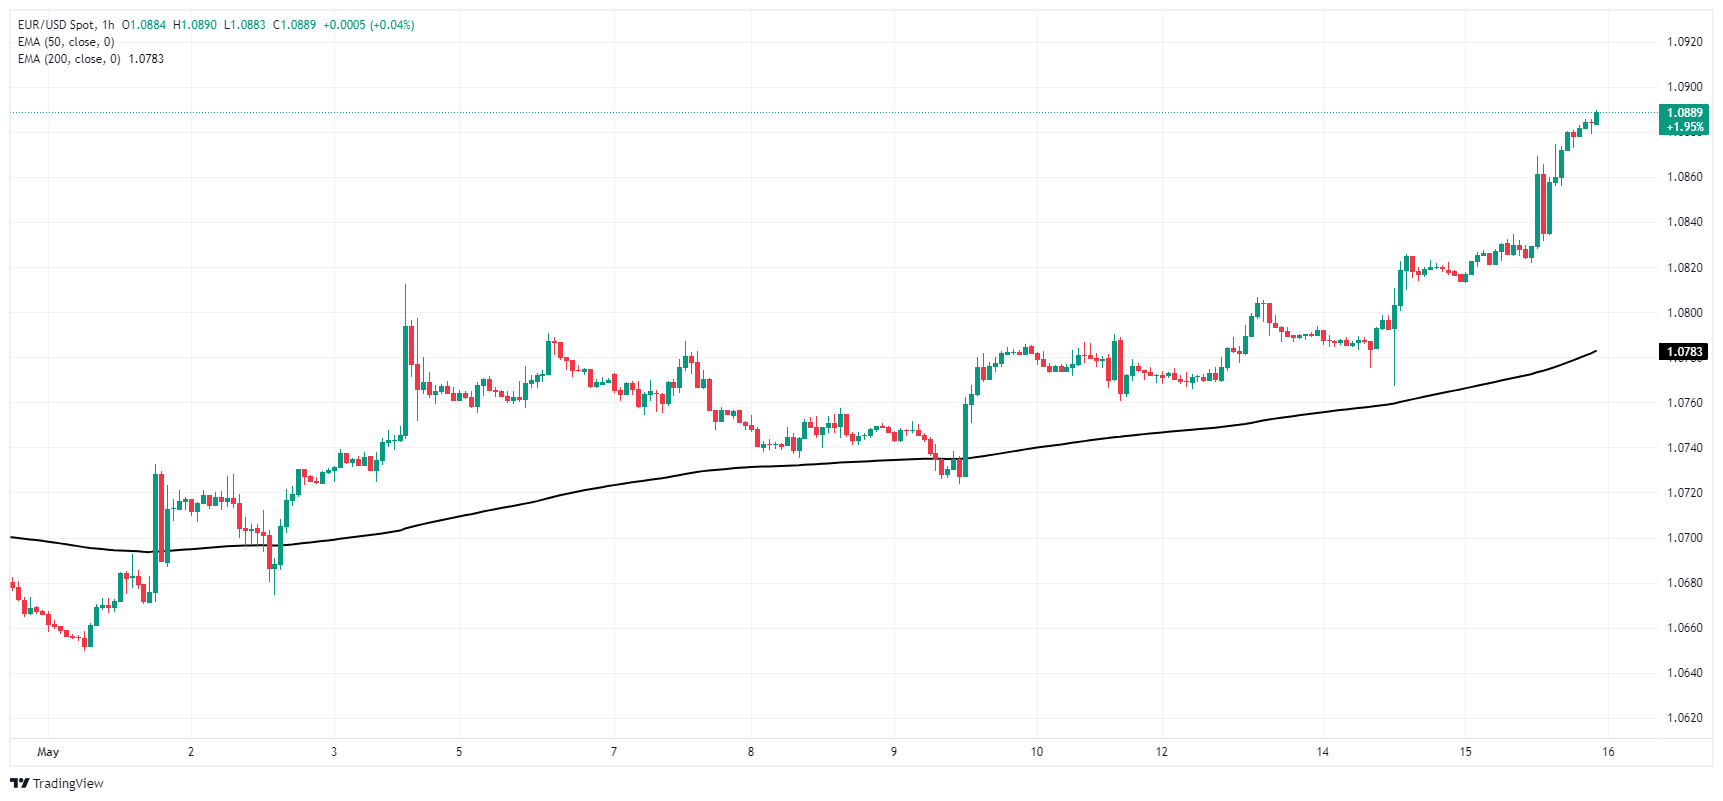
EUR/USD daily chart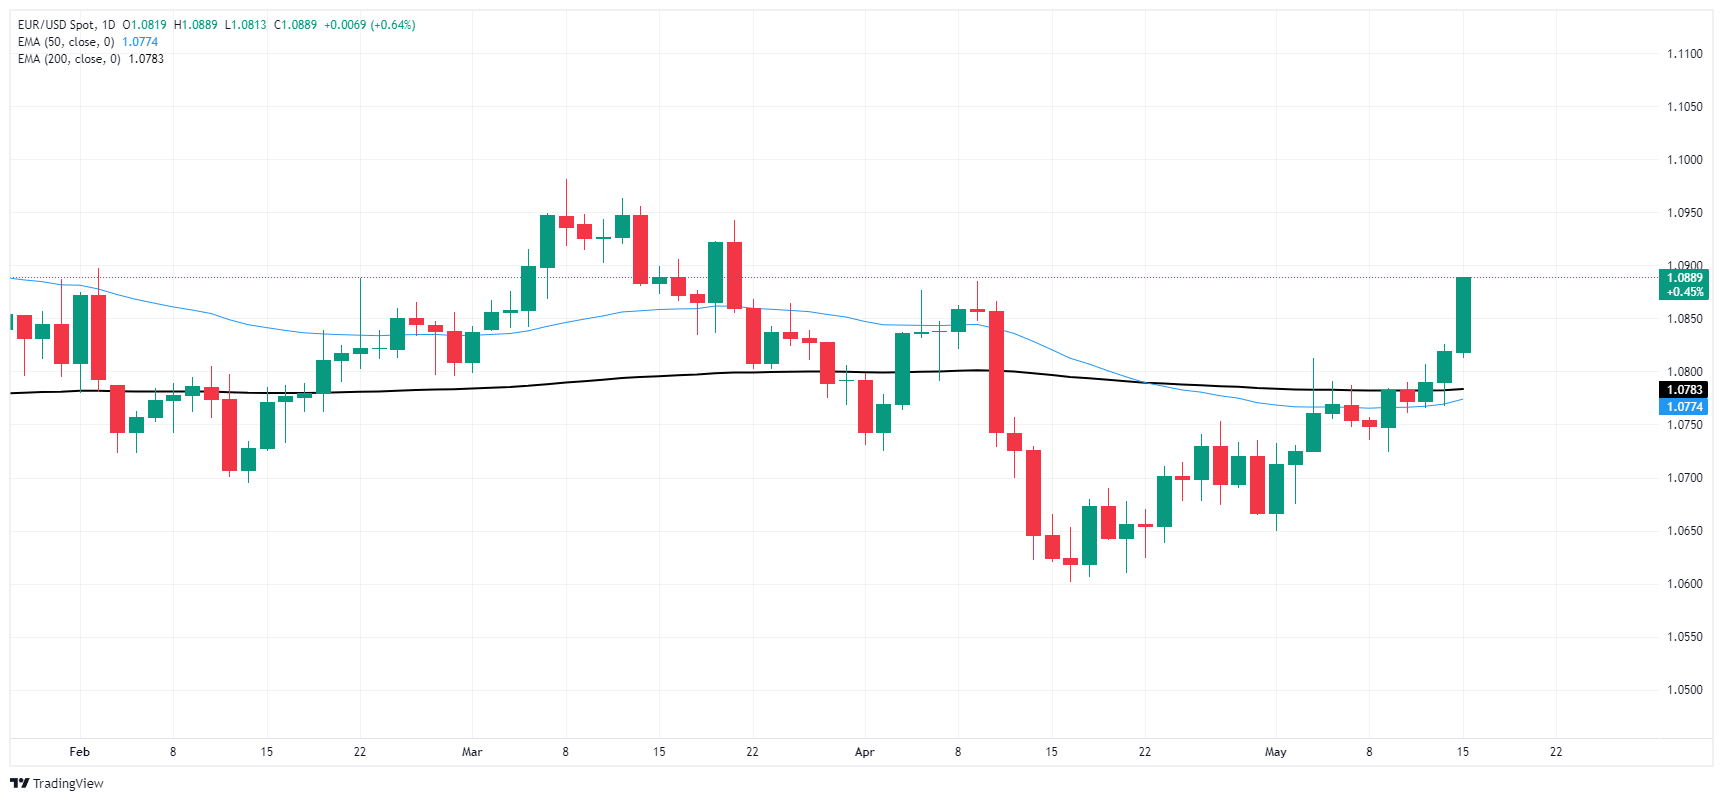


© 2000-2026. Bản quyền Teletrade.
Trang web này được quản lý bởi Teletrade D.J. LLC 2351 LLC 2022 (Euro House, Richmond Hill Road, Kingstown, VC0100, St. Vincent and the Grenadines).
Thông tin trên trang web không phải là cơ sở để đưa ra quyết định đầu tư và chỉ được cung cấp cho mục đích làm quen.
Giao dịch trên thị trường tài chính (đặc biệt là giao dịch sử dụng các công cụ biên) mở ra những cơ hội lớn và tạo điều kiện cho các nhà đầu tư sẵn sàng mạo hiểm để thu lợi nhuận, tuy nhiên nó mang trong mình nguy cơ rủi ro khá cao. Chính vì vậy trước khi tiến hành giao dịch cần phải xem xét mọi mặt vấn đề chấp nhận tiến hành giao dịch cụ thể xét theo quan điểm của nguồn lực tài chính sẵn có và mức độ am hiểu thị trường tài chính.
Sử dụng thông tin: sử dụng toàn bộ hay riêng biệt các dữ liệu trên trang web của công ty TeleTrade như một nguồn cung cấp thông tin nhất định. Việc sử dụng tư liệu từ trang web cần kèm theo liên kết đến trang teletrade.vn. Việc tự động thu thập số liệu cũng như thông tin từ trang web TeleTrade đều không được phép.
Xin vui lòng liên hệ với pr@teletrade.global nếu có câu hỏi.
ngân hàng