- Phân tích
- Tin tức và các công cụ
- Tin tức thị trường
- NZD/USD Price Analysis: Bulls gather traction and brighten the outlook, indicators hit overbought conditions
NZD/USD Price Analysis: Bulls gather traction and brighten the outlook, indicators hit overbought conditions
- The daily RSI of the NZD/USD signals it is approaching overbought, which often indicates future consolidation or potential reversal.
- The same indicators in the hourly chart further strengthen this view, specifically, with the RSI crossing the 70 mark.
- Buyers regained the 100 and 200-day SMAs, and this points to a bullish outlook.
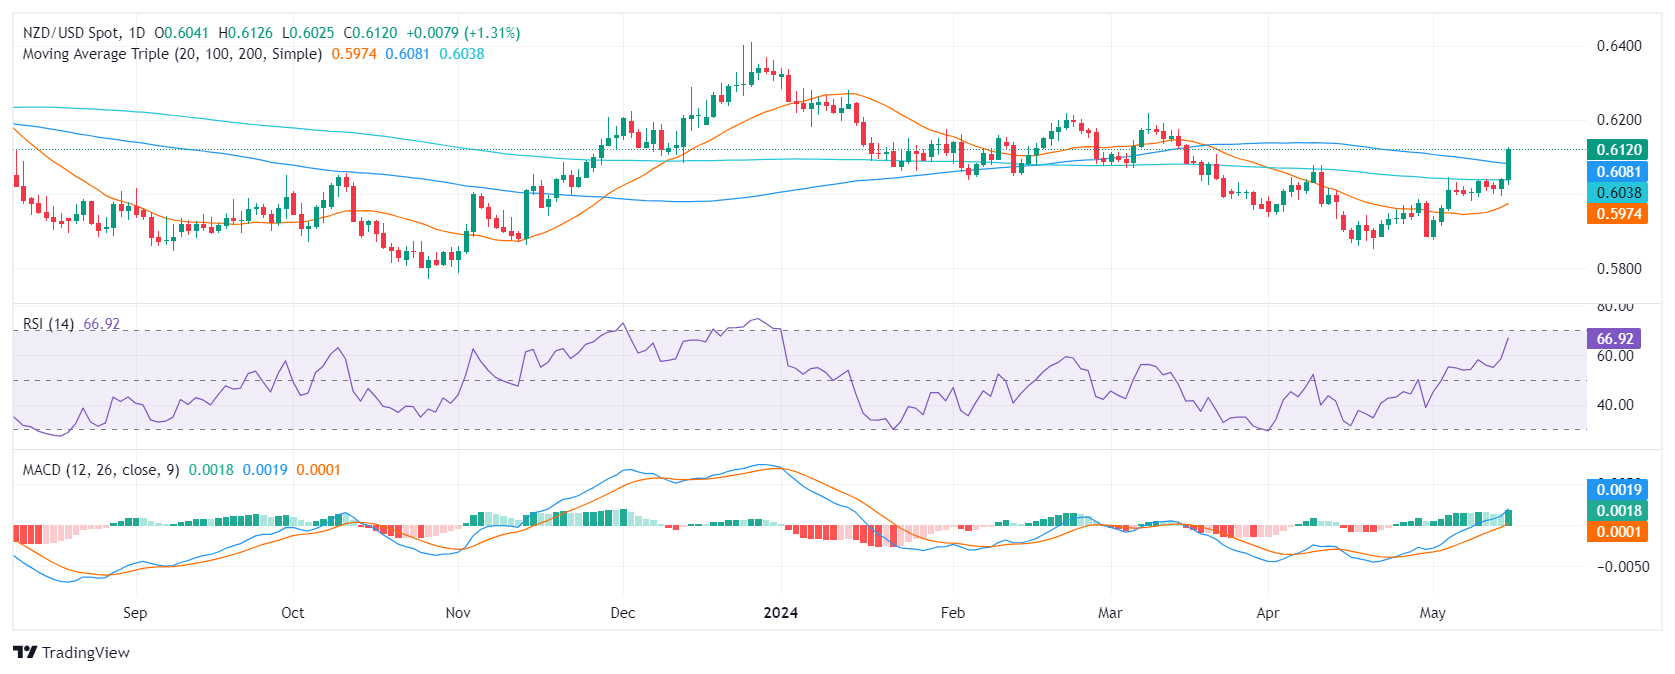
In the Wednesday session, the NZD/USD pair rides a strong bullish wave, with a recent increase of 1.28%. The uptick made the pair jump above its 100 and 200-day Simple Moving Averages (SMAs), indicating that the outlook turned positive for the pair. However, as indicators approach overbought conditions, a consolidation may be incoming.
On the daily chart, the Relative Strength Index (RSI) indicates that NZD/USD is approaching overbought territory. The positive trend evident over the past few days, along with the recent surge, reveals that the strength is currently with buyers. However, this upward pressure may soon decrease, as the RSI nearing overbought conditions often signals future consolidation or potential reversal.
NZD/USD daily chart
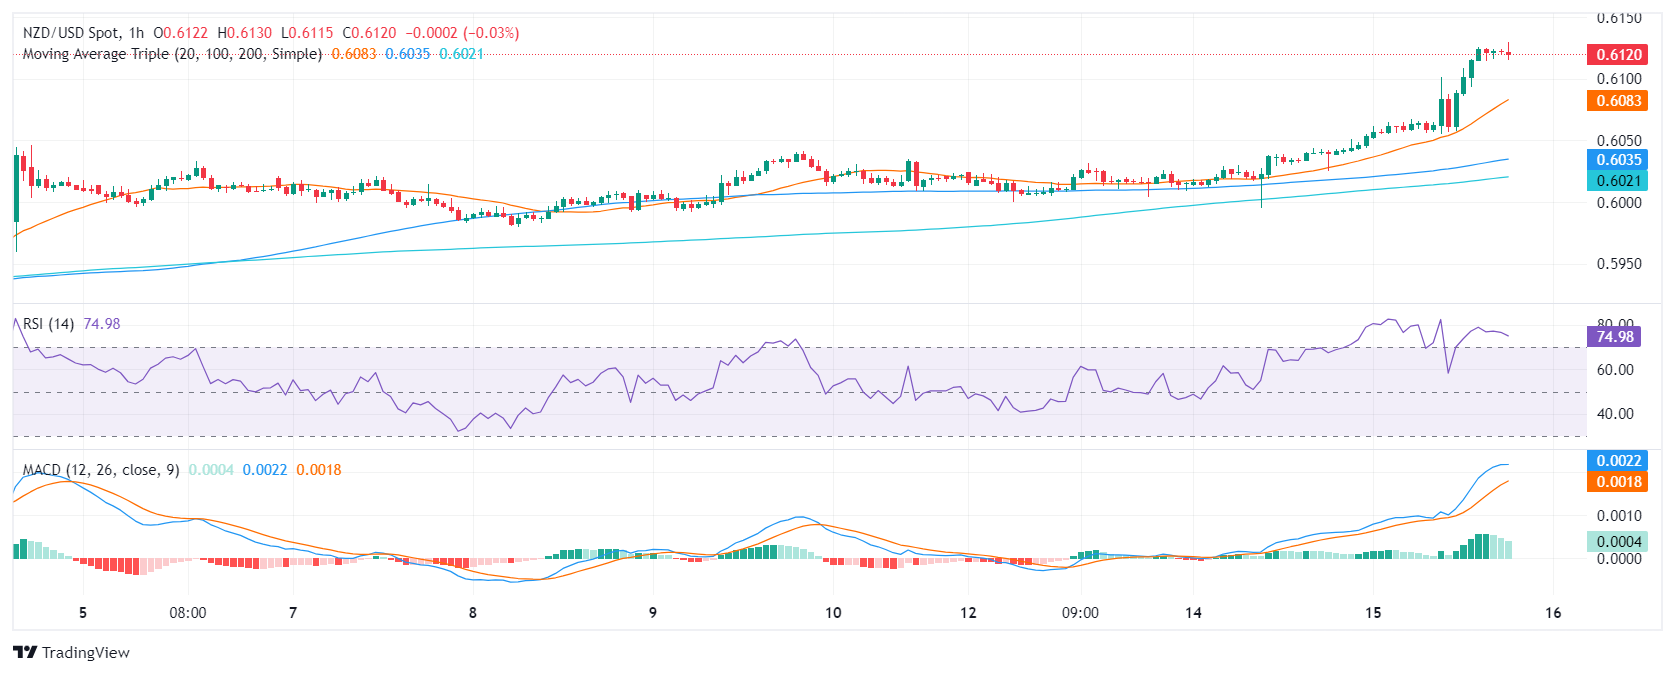
The hourly chart shows that RSI readings exceeded 70, reinforcing indications of overbought conditions. The recent Moving Average Convergence Divergence (MACD) showing flat green bars indicates sustained but flat positive momentum.
NZD/USD hourly chart
In conclusion, the technical indicators for NZD/USD suggest strong buyer momentum. However, the RSI's proximity to overbought conditions hints at a potential easing of this upward pressure. This, coupled with the strong bullish trend indicated by the jumping above longer-term SMAs, presents a positive outlook but demands careful observation for potential corrections.


© 2000-2026. Bản quyền Teletrade.
Trang web này được quản lý bởi Teletrade D.J. LLC 2351 LLC 2022 (Euro House, Richmond Hill Road, Kingstown, VC0100, St. Vincent and the Grenadines).
Thông tin trên trang web không phải là cơ sở để đưa ra quyết định đầu tư và chỉ được cung cấp cho mục đích làm quen.
Giao dịch trên thị trường tài chính (đặc biệt là giao dịch sử dụng các công cụ biên) mở ra những cơ hội lớn và tạo điều kiện cho các nhà đầu tư sẵn sàng mạo hiểm để thu lợi nhuận, tuy nhiên nó mang trong mình nguy cơ rủi ro khá cao. Chính vì vậy trước khi tiến hành giao dịch cần phải xem xét mọi mặt vấn đề chấp nhận tiến hành giao dịch cụ thể xét theo quan điểm của nguồn lực tài chính sẵn có và mức độ am hiểu thị trường tài chính.
Sử dụng thông tin: sử dụng toàn bộ hay riêng biệt các dữ liệu trên trang web của công ty TeleTrade như một nguồn cung cấp thông tin nhất định. Việc sử dụng tư liệu từ trang web cần kèm theo liên kết đến trang teletrade.vn. Việc tự động thu thập số liệu cũng như thông tin từ trang web TeleTrade đều không được phép.
Xin vui lòng liên hệ với pr@teletrade.global nếu có câu hỏi.
ngân hàng