- Phân tích
- Tin tức và các công cụ
- Tin tức thị trường
- USD/SEK declines as markets digest US Retail Sales and CPI figures
USD/SEK declines as markets digest US Retail Sales and CPI figures
- US CPI and Retail Sales came in lower than expected.
- The odds of a cut from the Fed in July slightly increase, and September continues being the best-case scenario.
- Fed officials might change their tone as economic figures showed softness.
On Wednesday, the USD/SEK saw sharp losses as the potential for sooner interest rate cuts by the Fed, in light of the recent Consumer Price Index (CPI) disinflation and lackluster Retail Sales, may exert weight on the USD.
On the data front, the US Bureau of Labor Statistics reported that the US witnessed a marginal decrease in inflation, with the headline CPI moving down from 3.5% in March to 3.4% in April. Core CPI also observed a fall, retreating from 3.8% to 3.6%, aligning with market expectations. In addition, U.S. Retail sales in April remained stagnant, a dip from the anticipated 0.4% growth.
The cooling economic indicators imply that the Federal Reserve might contemplate a sooner start of the easing cycle which would invariably exert pressure on the USD. The CME FedWatch Tool highlights that investors have already priced in that there will be no changes in interest rates in June, but continue seeing with good eyes a cut in September. Those odds slightly increase for the July meeting but remain low.
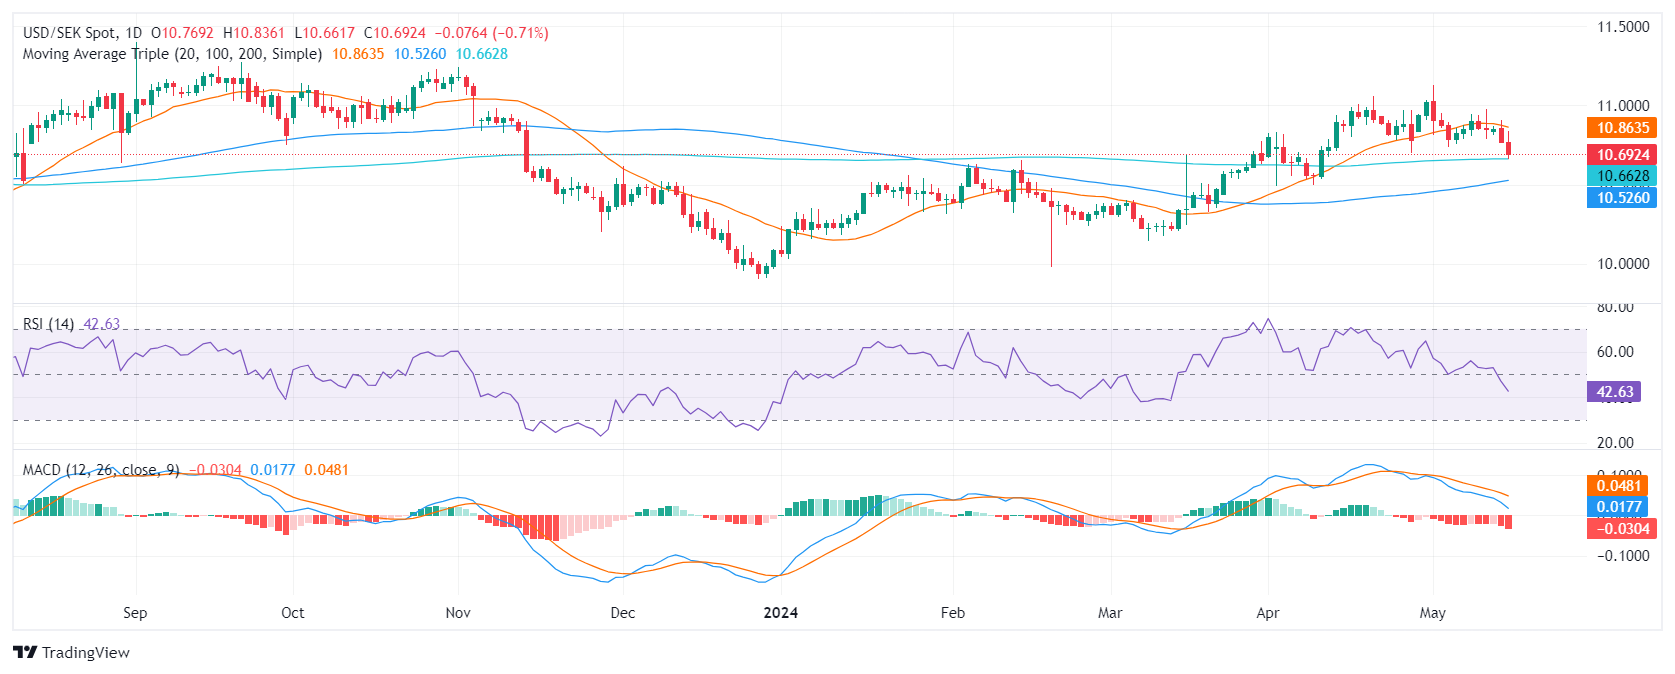
USD/SEK technical analysis
On the daily chart, the Relative Strength Index (RSI) for the USD/SEK pair resides in negative territory. The latest reading, marking a downward trend, suggests that sellers are dominating. Moreover, the Moving Average Convergence Divergence (MACD) is producing rising red bars, thus demonstrating negative momentum.
That being said, strong support was noted at the 200-day Simple Moving Average (SMA) with buyers defending the level at 10.66. This defense acts as a crucial bulwark against any potential downward trend reversals.


© 2000-2026. Bản quyền Teletrade.
Trang web này được quản lý bởi Teletrade D.J. LLC 2351 LLC 2022 (Euro House, Richmond Hill Road, Kingstown, VC0100, St. Vincent and the Grenadines).
Thông tin trên trang web không phải là cơ sở để đưa ra quyết định đầu tư và chỉ được cung cấp cho mục đích làm quen.
Giao dịch trên thị trường tài chính (đặc biệt là giao dịch sử dụng các công cụ biên) mở ra những cơ hội lớn và tạo điều kiện cho các nhà đầu tư sẵn sàng mạo hiểm để thu lợi nhuận, tuy nhiên nó mang trong mình nguy cơ rủi ro khá cao. Chính vì vậy trước khi tiến hành giao dịch cần phải xem xét mọi mặt vấn đề chấp nhận tiến hành giao dịch cụ thể xét theo quan điểm của nguồn lực tài chính sẵn có và mức độ am hiểu thị trường tài chính.
Sử dụng thông tin: sử dụng toàn bộ hay riêng biệt các dữ liệu trên trang web của công ty TeleTrade như một nguồn cung cấp thông tin nhất định. Việc sử dụng tư liệu từ trang web cần kèm theo liên kết đến trang teletrade.vn. Việc tự động thu thập số liệu cũng như thông tin từ trang web TeleTrade đều không được phép.
Xin vui lòng liên hệ với pr@teletrade.global nếu có câu hỏi.
ngân hàng