- Phân tích
- Tin tức và các công cụ
- Tin tức thị trường
- GBP/USD Price Analysis: Peaks at five-week high, fails to challenge 1.2700
GBP/USD Price Analysis: Peaks at five-week high, fails to challenge 1.2700
- GBP/USD climbs past 100-DMA, with buyers gaining traction.
- Buying interest remains strong, as RSI points upwards, yet to become overbought.
- Key resistance lies at 1.2670, which would exacerbate followed by 1.2700.
- Sellers target a close below the 100-DMA to challenge 1.2600.
The Pound Sterling advanced some 0.30% and hit a five-week high of 1.2670 following the release of the US Consumer Price Index (CPI). The data was mostly aligned with estimates, showing a continuation of the disinflation process, which weighed on the Greenback. The GBP/USD trades at 1.2641 at the time of writing.
GBP/USD Price Analysis: Technical outlook
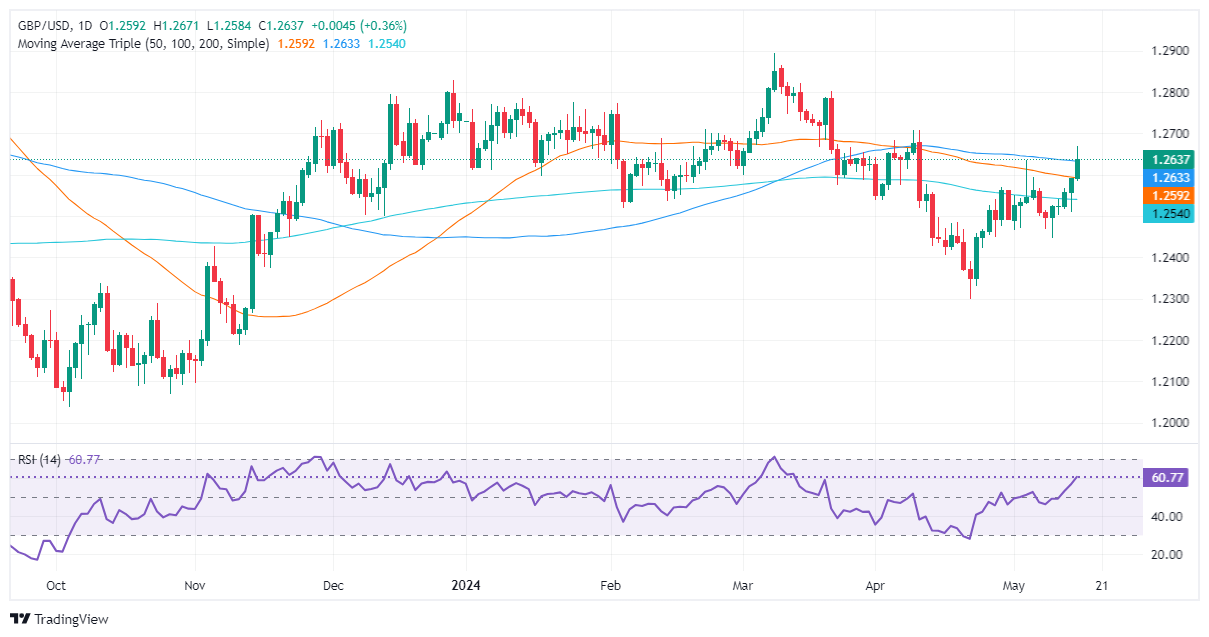
The GBP/USD remains neutral to upward bias and hit a weekly high at 1.2670 following a soft US inflation report. However, the pair has retreated toward the 100-day moving average (DMA) at 1.2632, seen as the next key technical level that, once surpassed, could pave the way for further gains.
The Relative Strength Index (RSI) shows that momentum favors buyers. The RSI aims upward with enough room before portraying overbought conditions.
If buyers reclaim the 100-DMA, the next resistance would be today’s high at 1.2670. A breach of the latter will expose the April 9 high at 1.2709, ahead of rallying to the next supply zone at 1.2803, the March 21 high. Once surpassed, the next stop would be the year-to-date (YTD) high at 1.2894.
Conversely, sellers remain hopeful that the GBP/USD exchange rate could tumble below the 100-DMA and achieve a daily close below that level, to challenge 1.2600. Once cleared, the next stop would be the 50-DMa at 1.2591, followed by the 200-DMA at 1.2539.
GBP/USD Price Action – Daily Chart


© 2000-2026. Bản quyền Teletrade.
Trang web này được quản lý bởi Teletrade D.J. LLC 2351 LLC 2022 (Euro House, Richmond Hill Road, Kingstown, VC0100, St. Vincent and the Grenadines).
Thông tin trên trang web không phải là cơ sở để đưa ra quyết định đầu tư và chỉ được cung cấp cho mục đích làm quen.
Giao dịch trên thị trường tài chính (đặc biệt là giao dịch sử dụng các công cụ biên) mở ra những cơ hội lớn và tạo điều kiện cho các nhà đầu tư sẵn sàng mạo hiểm để thu lợi nhuận, tuy nhiên nó mang trong mình nguy cơ rủi ro khá cao. Chính vì vậy trước khi tiến hành giao dịch cần phải xem xét mọi mặt vấn đề chấp nhận tiến hành giao dịch cụ thể xét theo quan điểm của nguồn lực tài chính sẵn có và mức độ am hiểu thị trường tài chính.
Sử dụng thông tin: sử dụng toàn bộ hay riêng biệt các dữ liệu trên trang web của công ty TeleTrade như một nguồn cung cấp thông tin nhất định. Việc sử dụng tư liệu từ trang web cần kèm theo liên kết đến trang teletrade.vn. Việc tự động thu thập số liệu cũng như thông tin từ trang web TeleTrade đều không được phép.
Xin vui lòng liên hệ với pr@teletrade.global nếu có câu hỏi.
ngân hàng