- Phân tích
- Tin tức và các công cụ
- Tin tức thị trường
- EUR/JPY Price Analysis: Rallies for seventh straight day as bulls target 170.00
EUR/JPY Price Analysis: Rallies for seventh straight day as bulls target 170.00
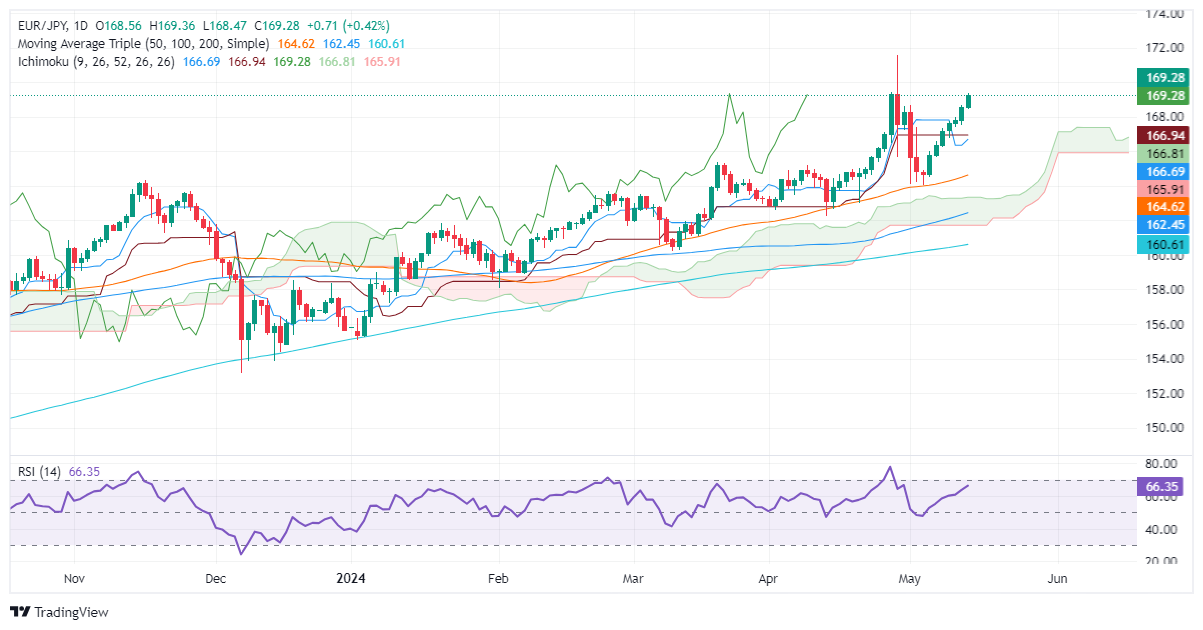
- EUR/JPY edges up 0.44%, extending its winning streak to seven days amid positive market sentiment.
- Technical outlook remains bullish; RSI nears overbought territory, indicating strong upward momentum.
- Watch resistance at April’s 26 high of 169.39, 170.00, and YTD high at 171.58.
- Key support levels at 169.00, 166.93/81, and 165.90.
During the North American session, the Euro prolonged its gains versus the Japanese Yen in late trading. Market sentiment remains upbeat; hence, the EUR/JPY trades with gains of 0.44%, at 169.27 at the time of writing.
EUR/JPY Price Analysis: Technical outlook
From a technical perspective, the EUR/JPY remains upward biased, extending its gains for seven straight days, whereas fears that Japanese authorities could intervene in the Forex markets can limit the upside.
Momentum remains favoring the uptrend, as the Relative Strength Index is in bullish territory and about to become overbought. However, due to the strength of the uptrend, the most extreme level wouldn’t be 70, as most traders would use 80.
With that said, the first key resistance level would be the April 26 high at 169.39. Once surpassed, sellers' next line of defense would be the 170.00 figure, followed by the year-to-date (YTD) high at 171.58.
Conversely, if EUR/JPY retreats and dives below 169.00, that could exert downward pressure on the cross. The first support level would be the confluence of the Kijun-Sen and the Senkou Span A at around 166.93/81, followed by the Tenkan-Sen at 166.68. A breach of the latter will expose the Senkou Span B at 165.90.
EUR/JPY Price Action – Daily Chart


© 2000-2026. Bản quyền Teletrade.
Trang web này được quản lý bởi Teletrade D.J. LLC 2351 LLC 2022 (Euro House, Richmond Hill Road, Kingstown, VC0100, St. Vincent and the Grenadines).
Thông tin trên trang web không phải là cơ sở để đưa ra quyết định đầu tư và chỉ được cung cấp cho mục đích làm quen.
Giao dịch trên thị trường tài chính (đặc biệt là giao dịch sử dụng các công cụ biên) mở ra những cơ hội lớn và tạo điều kiện cho các nhà đầu tư sẵn sàng mạo hiểm để thu lợi nhuận, tuy nhiên nó mang trong mình nguy cơ rủi ro khá cao. Chính vì vậy trước khi tiến hành giao dịch cần phải xem xét mọi mặt vấn đề chấp nhận tiến hành giao dịch cụ thể xét theo quan điểm của nguồn lực tài chính sẵn có và mức độ am hiểu thị trường tài chính.
Sử dụng thông tin: sử dụng toàn bộ hay riêng biệt các dữ liệu trên trang web của công ty TeleTrade như một nguồn cung cấp thông tin nhất định. Việc sử dụng tư liệu từ trang web cần kèm theo liên kết đến trang teletrade.vn. Việc tự động thu thập số liệu cũng như thông tin từ trang web TeleTrade đều không được phép.
Xin vui lòng liên hệ với pr@teletrade.global nếu có câu hỏi.
ngân hàng