- Phân tích
- Tin tức và các công cụ
- Tin tức thị trường
- USD/JPY Price Analysis: Climbs above 156.00 as bulls target 157.00
USD/JPY Price Analysis: Climbs above 156.00 as bulls target 157.00
- USD/JPY up 0.17% driven by US producer price data suggesting potential for sustained high Fed rates.
- Technicals: Six days of gains, with strong upward momentum above the Ichimoku Cloud.
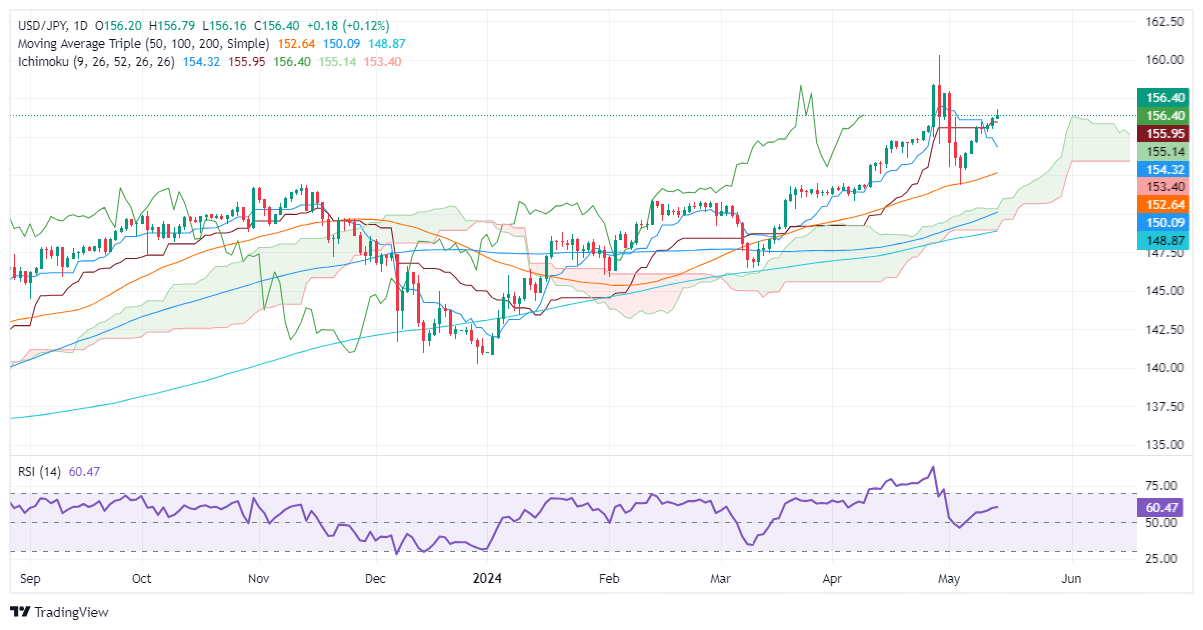
- Resistance at 157.00, then May 1 high of 157.98 and April 26 high of 158.44.
- Support at 156.00, 155.90 (Kijun-Sen), and 155.10 (Senkou Span A).
The USD/JPY climbed during the North American session after inflation data in the United States (US) showed that prices on the producer side edged higher than expected. This suggests the Fed might maintain rates higher for longer amid fears that consumer inflation could reaccelerate. The pair trades at 156.48, up by 0.17%.
USD/JPY Price Analysis: Technical outlook
The USD/JPY extended its gains for the sixth consecutive trading day, reigniting fears that Japanese authorities could intervene in the Forex markets. Momentum remains tilted to the upside, as price action remains above the Ichimoku Cloud (Kumo). At the same time, the Relative Strength Index (RSI) trends are higher in bullish territory, which could open the door to re-test yearly highs.
If buyers reclaim the 157.00 figure, that could open the door to challenging the May 1 high at 157.98. Once surpassed, key resistance levels emerge, like Apri’s26 high at 158.44, followed by the April 29 high of 160.22.
On the other hand, if sellers drag prices below 156.00, further losses lie below. The next support would be the Kijun-Sen at 155.90. Should the pair extend its downtrend, the next demand area emerges at the Senkou Span A at 155.10 before sellers challenge the Tenkan-Sen at 154.31.
USD/JPY Price Action – Daily Chart


© 2000-2026. Bản quyền Teletrade.
Trang web này được quản lý bởi Teletrade D.J. LLC 2351 LLC 2022 (Euro House, Richmond Hill Road, Kingstown, VC0100, St. Vincent and the Grenadines).
Thông tin trên trang web không phải là cơ sở để đưa ra quyết định đầu tư và chỉ được cung cấp cho mục đích làm quen.
Giao dịch trên thị trường tài chính (đặc biệt là giao dịch sử dụng các công cụ biên) mở ra những cơ hội lớn và tạo điều kiện cho các nhà đầu tư sẵn sàng mạo hiểm để thu lợi nhuận, tuy nhiên nó mang trong mình nguy cơ rủi ro khá cao. Chính vì vậy trước khi tiến hành giao dịch cần phải xem xét mọi mặt vấn đề chấp nhận tiến hành giao dịch cụ thể xét theo quan điểm của nguồn lực tài chính sẵn có và mức độ am hiểu thị trường tài chính.
Sử dụng thông tin: sử dụng toàn bộ hay riêng biệt các dữ liệu trên trang web của công ty TeleTrade như một nguồn cung cấp thông tin nhất định. Việc sử dụng tư liệu từ trang web cần kèm theo liên kết đến trang teletrade.vn. Việc tự động thu thập số liệu cũng như thông tin từ trang web TeleTrade đều không được phép.
Xin vui lòng liên hệ với pr@teletrade.global nếu có câu hỏi.
ngân hàng