- Phân tích
- Tin tức và các công cụ
- Tin tức thị trường
- NZD/USD Price Analysis: Bears tighten their grip and present battle at around 0.6000
NZD/USD Price Analysis: Bears tighten their grip and present battle at around 0.6000
- The daily RSI and MACD indicate diminishing buying momentum as bulls struggle to gain further ground.
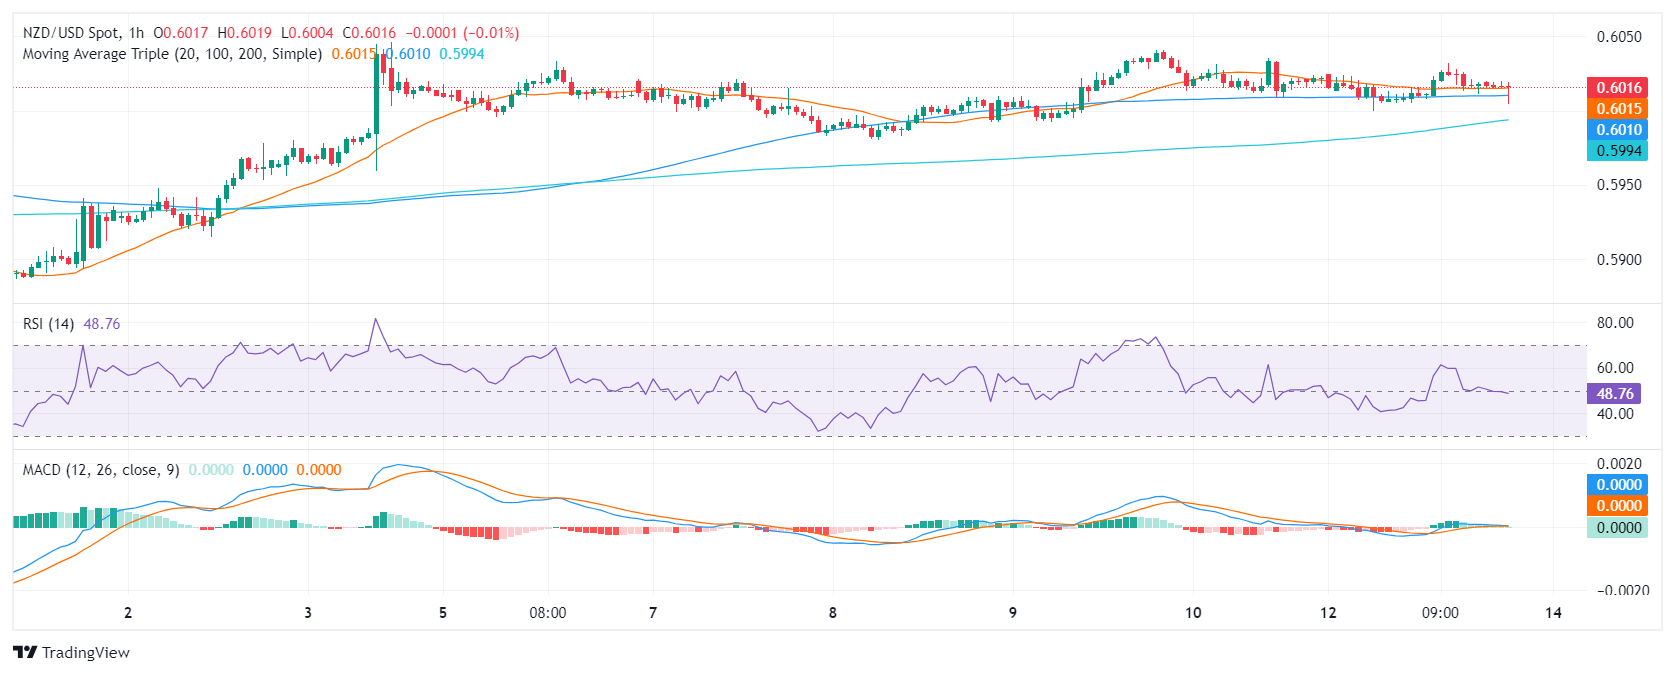
- The hourly indicators reveal that sellers have a slight upper hand ahead of the Asian session.
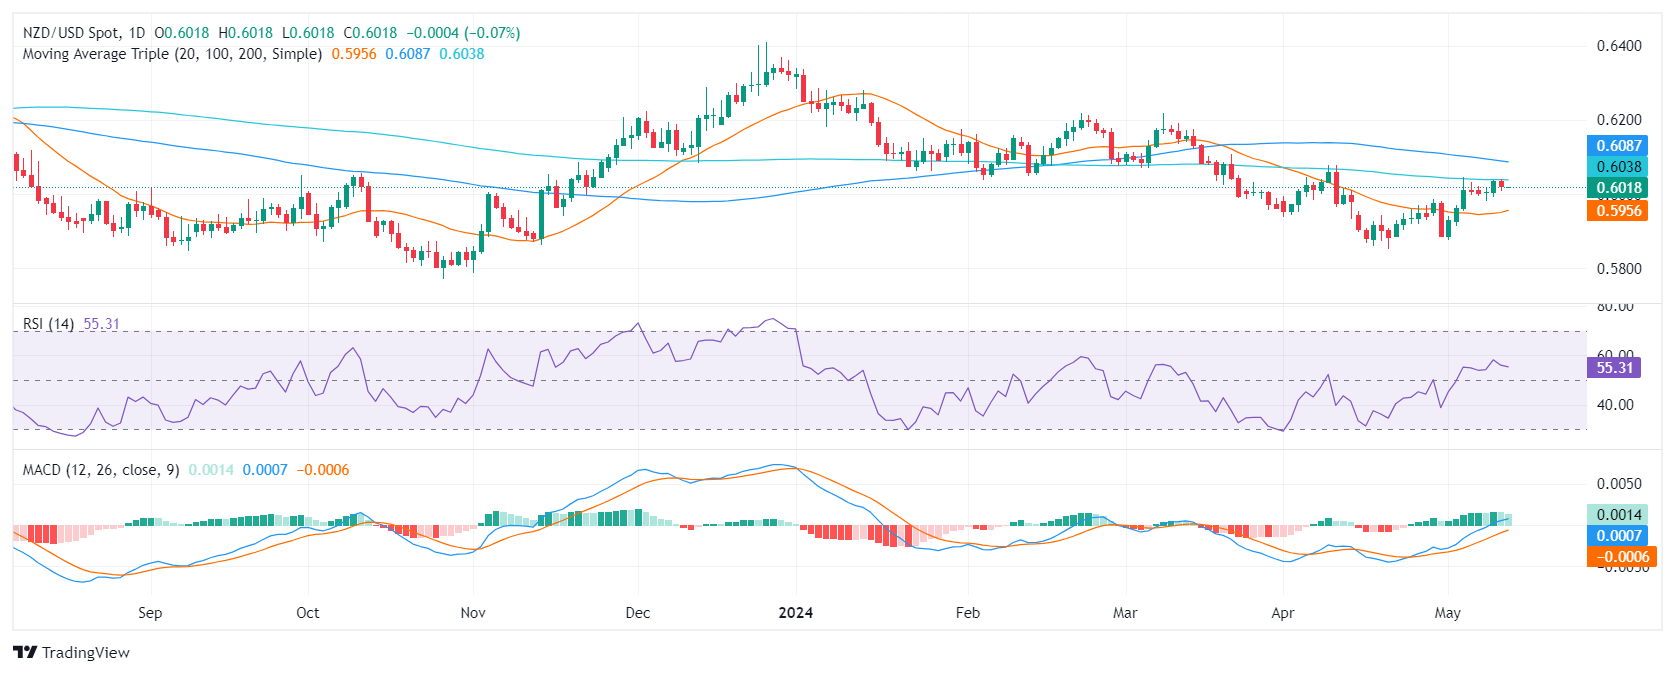
In Monday's session, the NZD/USD pair traded with mild losses, and sellers gained ground. As the pair is facing strong resistance at the 200-day Simple Moving Average (SMA), the pair struggles to consolidate advances. Indicators are flattening and indicate that the moment of the bulls may be coming to an end.
On the daily chart, the Relative Strength Index (RSI) shows a flattening traction above 50. At the same time, the Moving Average Convergence Divergence (MACD) histogram reveals a decrease in buying momentum, demonstrated by diminishing green bars.
NZD/USD daily chart
The hourly RSI indicates a slightly negative trend with the latest reading falling towards its middlepoint, showing a slight dominance from the sellers in the market. This is supported by the MACD, which also prints decreasing green bars, further confirming the decrease in buying momentum at an intraday level.
NZD/USD hourly chart
Interpreting the broader perspective, the NZD/USD is positioned below the thresholds of its 100, 200-day Simple Moving Averages (SMA). Significant bearish momentum, implying a prevailing downward trend in both the medium and long term. However, if the buyers defend the 20-day SMA, they may still have some hope to make another stride to reclaim the 200-day SMA.4


© 2000-2026. Bản quyền Teletrade.
Trang web này được quản lý bởi Teletrade D.J. LLC 2351 LLC 2022 (Euro House, Richmond Hill Road, Kingstown, VC0100, St. Vincent and the Grenadines).
Thông tin trên trang web không phải là cơ sở để đưa ra quyết định đầu tư và chỉ được cung cấp cho mục đích làm quen.
Giao dịch trên thị trường tài chính (đặc biệt là giao dịch sử dụng các công cụ biên) mở ra những cơ hội lớn và tạo điều kiện cho các nhà đầu tư sẵn sàng mạo hiểm để thu lợi nhuận, tuy nhiên nó mang trong mình nguy cơ rủi ro khá cao. Chính vì vậy trước khi tiến hành giao dịch cần phải xem xét mọi mặt vấn đề chấp nhận tiến hành giao dịch cụ thể xét theo quan điểm của nguồn lực tài chính sẵn có và mức độ am hiểu thị trường tài chính.
Sử dụng thông tin: sử dụng toàn bộ hay riêng biệt các dữ liệu trên trang web của công ty TeleTrade như một nguồn cung cấp thông tin nhất định. Việc sử dụng tư liệu từ trang web cần kèm theo liên kết đến trang teletrade.vn. Việc tự động thu thập số liệu cũng như thông tin từ trang web TeleTrade đều không được phép.
Xin vui lòng liên hệ với pr@teletrade.global nếu có câu hỏi.
ngân hàng