- Phân tích
- Tin tức và các công cụ
- Tin tức thị trường
- EUR/JPY Price Analysis: Bulls maintain momentum, potential short-term pullbacks on the horizon
EUR/JPY Price Analysis: Bulls maintain momentum, potential short-term pullbacks on the horizon
- The daily chart of the EUR/JPY reveals strong buying momentum, backed by positive RSI and MACD readings.
- Hourly chart indicators show a possible easing off from overbought status, potentially hinting at a nearing correction.
In Monday's session, the EUR/JPY pair showed strong bullish momentum, registering a rise to 168.52, marking a favorable 0.45% shift. However, potential short-term wavering observed in the hourly chart's indicators, suggests an approaching cooling-off phase, which could lead to profit-taking. As the ascent continues, investors are monitoring for a possible retest of the cycle highs above 170.00 in future sessions.
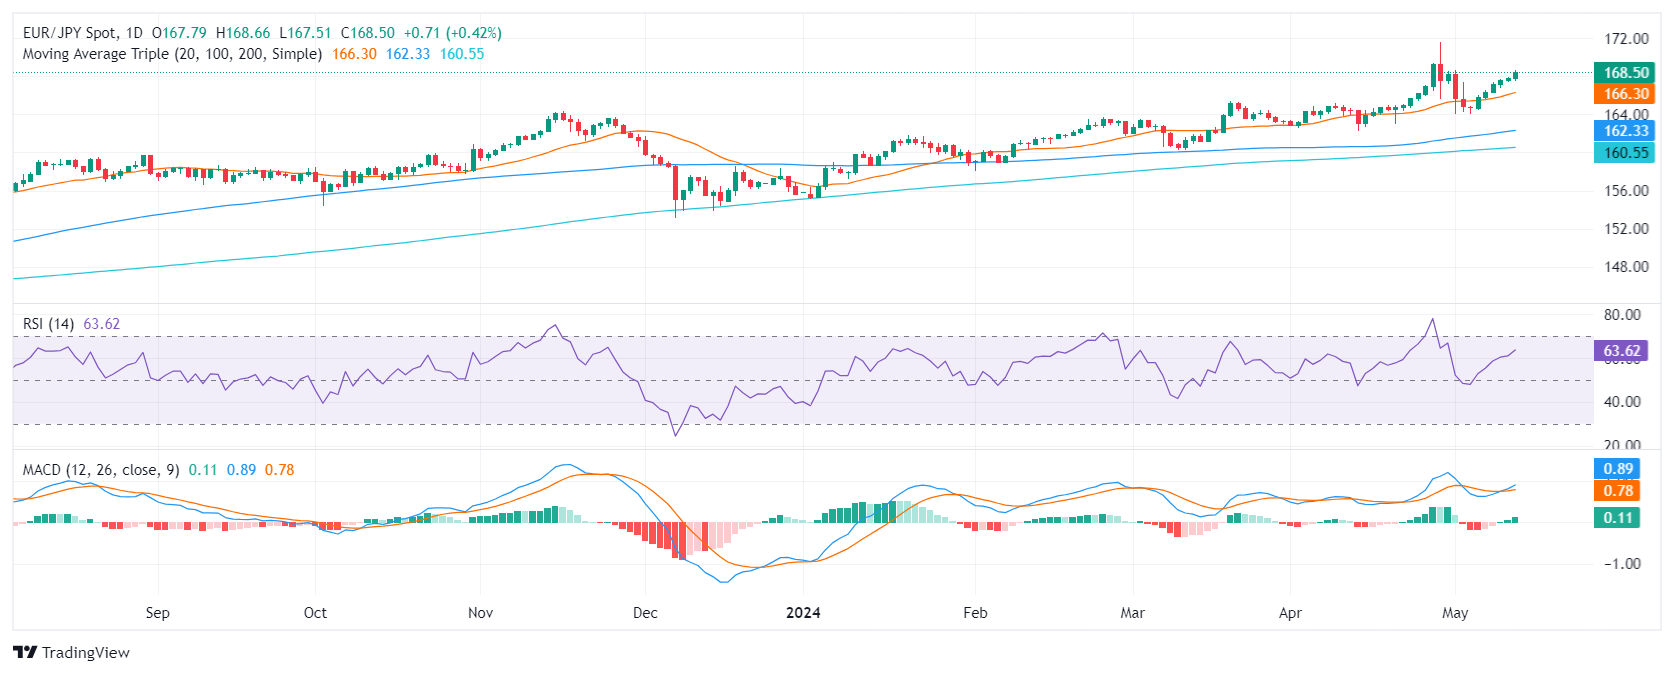
On the daily chart, the Relative Strength Index (RSI) is situated within the positive territory, signaling a buying bias. The consistent upward movement of the RSI, especially its peak at approximately 63, indicates strong buying momentum. Concurrently, the Moving Average Convergence Divergence (MACD) histogram shows increasing green bars, reinforcing the bullish outlook.
EUR/JPY daily chart
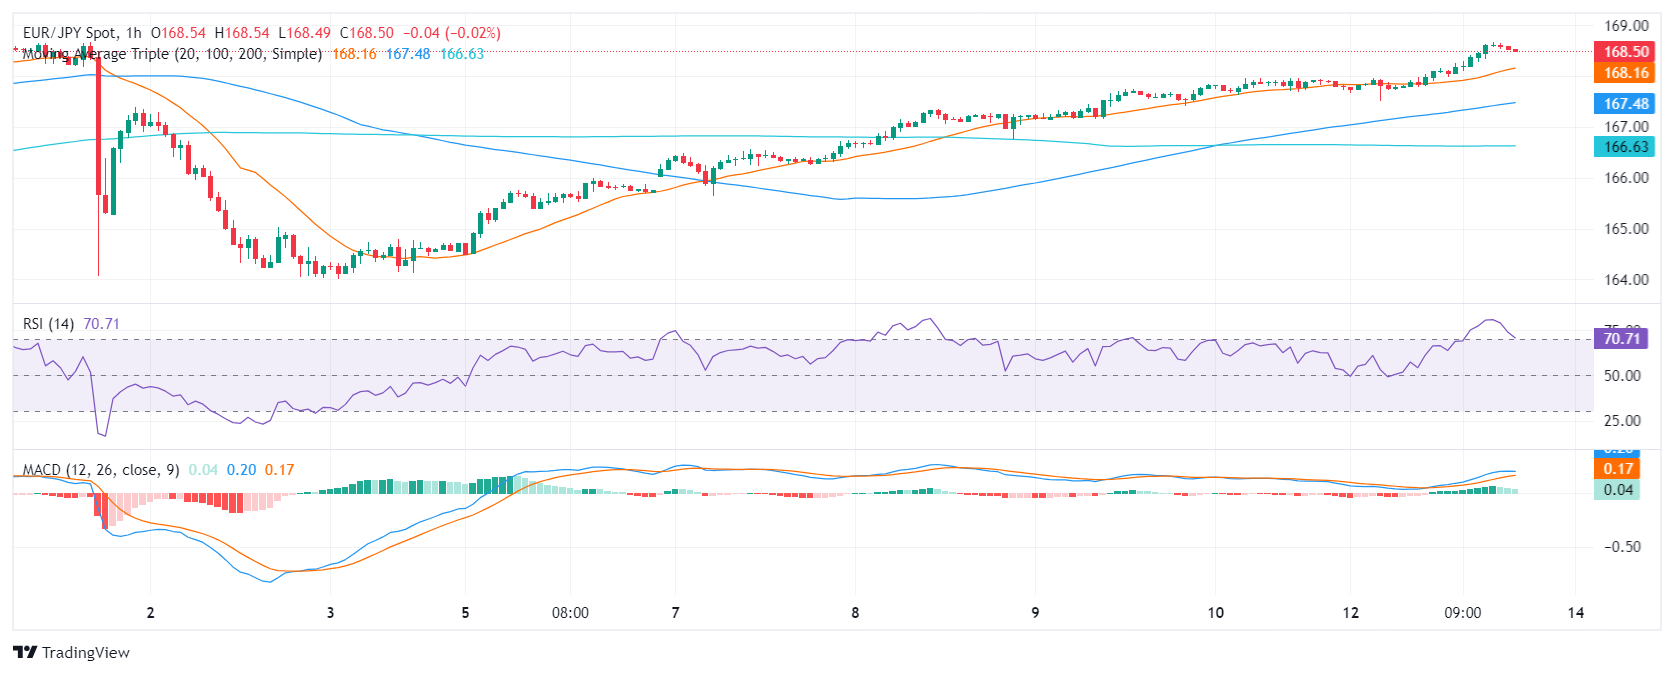
Moving to the hourly chart, the RSI shows heightened levels, consistently breaching the overbought threshold. A notable drop from approximately 80 to around 70 level, however, suggests a possible easing off from overbought status. Complementarily, the MACD on the hourly chart registers reducing green bars, implying a slowing pace of buying activity.
EUR/JPY hourly chart
Assessing the overall scenario, the EUR/JPY remains resilient around its Simple Moving Average (SMA) clusters. The pair is above the 20, 100, and 200-day SMA, important short- and long-term trend indicators, signifying a potential bullish bias in the near-term outlook. In addition, the pair being close to multi-year highs also paints with green the overall outlook.


© 2000-2026. Bản quyền Teletrade.
Trang web này được quản lý bởi Teletrade D.J. LLC 2351 LLC 2022 (Euro House, Richmond Hill Road, Kingstown, VC0100, St. Vincent and the Grenadines).
Thông tin trên trang web không phải là cơ sở để đưa ra quyết định đầu tư và chỉ được cung cấp cho mục đích làm quen.
Giao dịch trên thị trường tài chính (đặc biệt là giao dịch sử dụng các công cụ biên) mở ra những cơ hội lớn và tạo điều kiện cho các nhà đầu tư sẵn sàng mạo hiểm để thu lợi nhuận, tuy nhiên nó mang trong mình nguy cơ rủi ro khá cao. Chính vì vậy trước khi tiến hành giao dịch cần phải xem xét mọi mặt vấn đề chấp nhận tiến hành giao dịch cụ thể xét theo quan điểm của nguồn lực tài chính sẵn có và mức độ am hiểu thị trường tài chính.
Sử dụng thông tin: sử dụng toàn bộ hay riêng biệt các dữ liệu trên trang web của công ty TeleTrade như một nguồn cung cấp thông tin nhất định. Việc sử dụng tư liệu từ trang web cần kèm theo liên kết đến trang teletrade.vn. Việc tự động thu thập số liệu cũng như thông tin từ trang web TeleTrade đều không được phép.
Xin vui lòng liên hệ với pr@teletrade.global nếu có câu hỏi.
ngân hàng