- Phân tích
- Tin tức và các công cụ
- Tin tức thị trường
- EUR/JPY Price Analysis: Bullish forces steering the market, minor pullbacks possible
EUR/JPY Price Analysis: Bullish forces steering the market, minor pullbacks possible
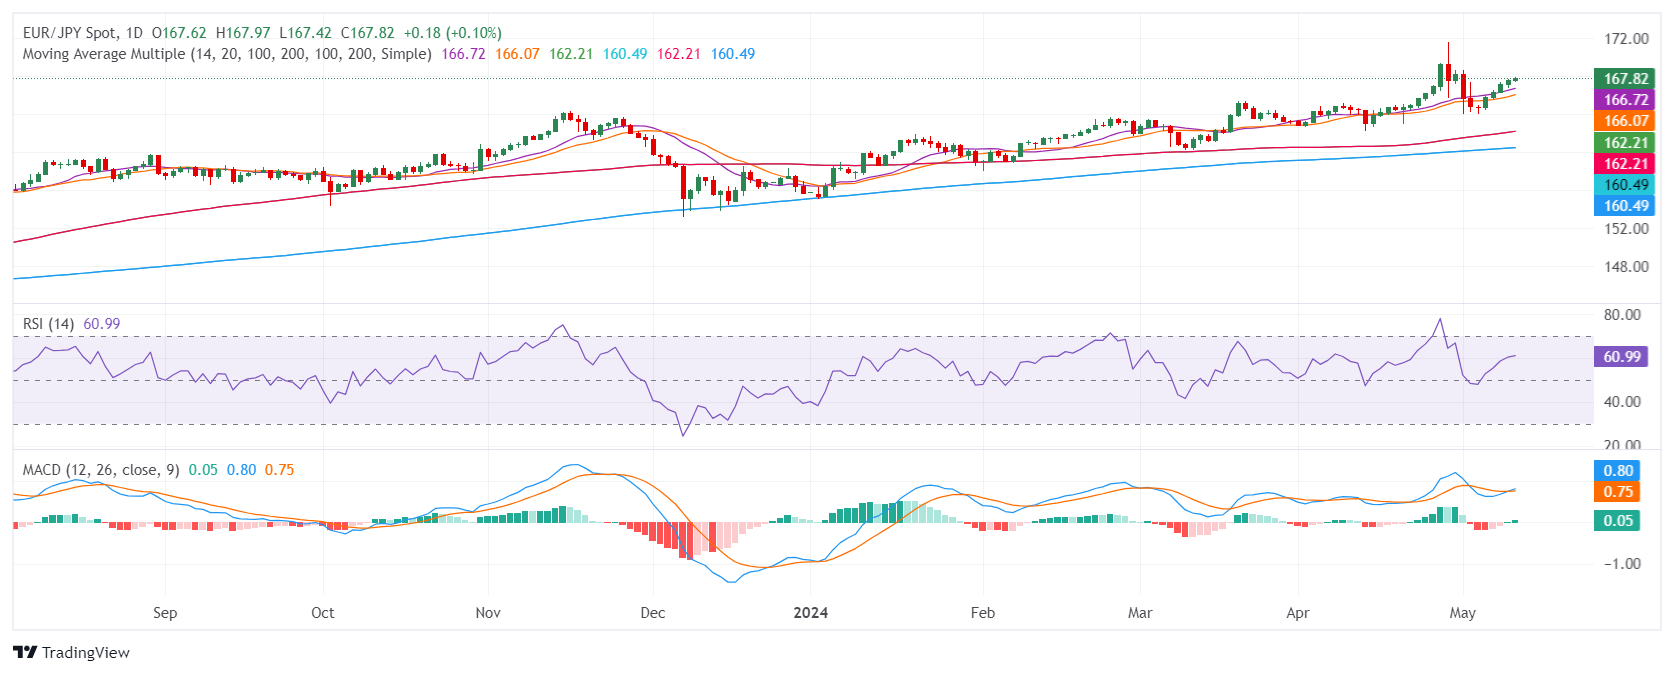
- The daily EUR/JPY RSI reveals ongoing bullish momentum, demonstrating a stable shift from 44 to 60 in the last sessions.
- Daily MACD perspectives align with the RSI, implying further progression of the positive momentum.
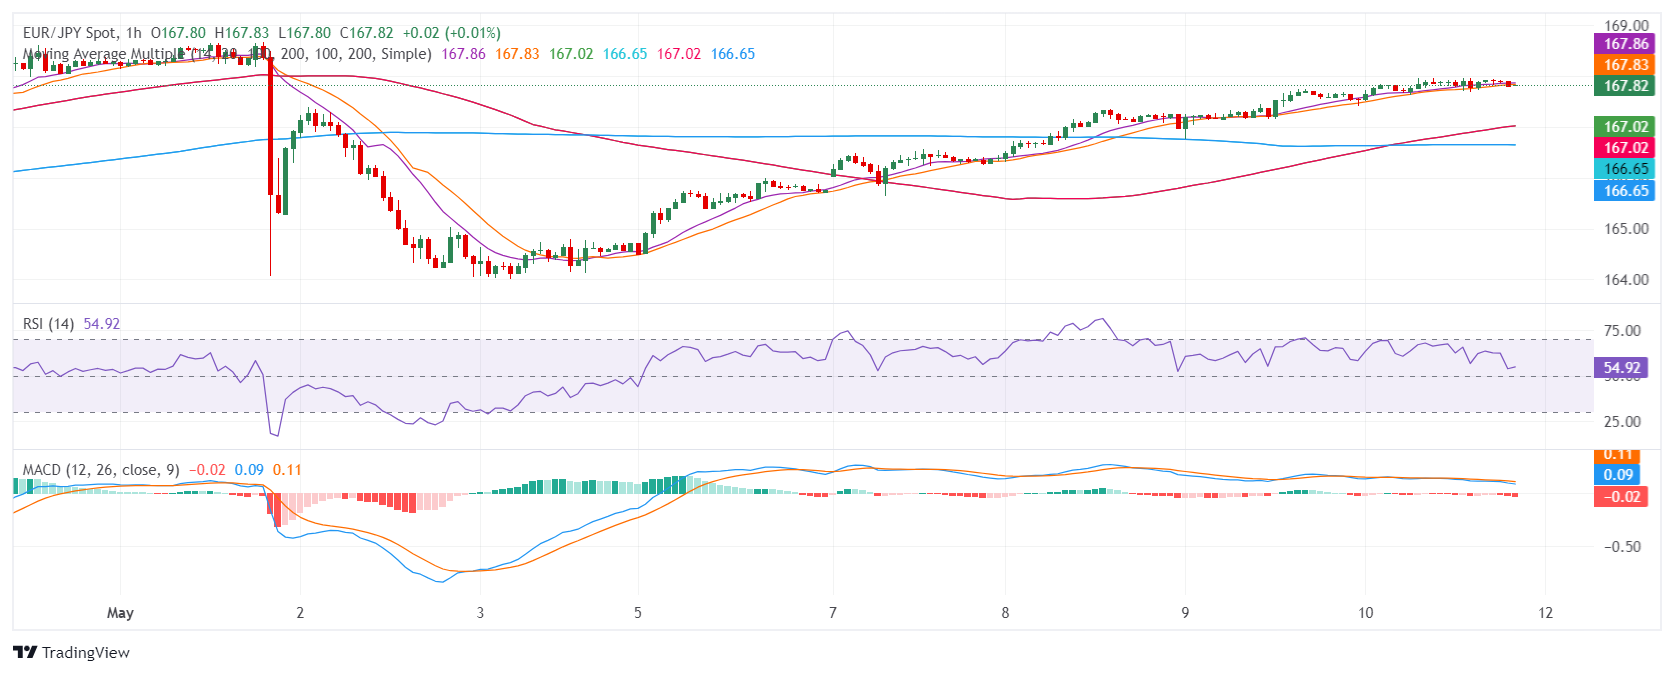
- Hourly chart shows a dip in RSI to 53 and indicates rising sellers' traction, suggesting a temporary pause in ongoing bullish momentum.
The EUR/JPY has been dominating with a steady bullish trend. It rose to 167.85 on Friday, reflecting a positive momentum primarily driven by market buyers. However, short-term sellers seem to be upping their game, implying potential transient pullbacks as indicators are flashing overbought signals in the hourly chart.
On the daily chart, the Relative Strength Index (RSI) for the EUR/JPY. A stable increase from since last week 44 to the current reading of 60 reveals an ongoing bullish momentum, primarily driven by market buyers. The Moving Average Convergence Divergence (MACD) corresponds with this perspective by showcasing rising green bars, indicating that the positive momentum is further progressing.
EURJPY daily chart
Looking at the hourly chart, the RSI presents a slight pullback to 53.26 after peaking at 67.40. While this indicates a potential slowing of buying dominance, the MACD, emphasized by rising red bars, suggests the formation of negative momentum. Despite the noticeable shift in the hourly chart, the dominant daily bullish outlook remains unchanged.
EURJPY hourly chart
In assessing the bigger picture, the EUR/JPY is positioned above its Simple Moving Averages (SMA) for the 20, 100, and 200-day periods which suggests that the buyers are clearly in command.


© 2000-2026. Bản quyền Teletrade.
Trang web này được quản lý bởi Teletrade D.J. LLC 2351 LLC 2022 (Euro House, Richmond Hill Road, Kingstown, VC0100, St. Vincent and the Grenadines).
Thông tin trên trang web không phải là cơ sở để đưa ra quyết định đầu tư và chỉ được cung cấp cho mục đích làm quen.
Giao dịch trên thị trường tài chính (đặc biệt là giao dịch sử dụng các công cụ biên) mở ra những cơ hội lớn và tạo điều kiện cho các nhà đầu tư sẵn sàng mạo hiểm để thu lợi nhuận, tuy nhiên nó mang trong mình nguy cơ rủi ro khá cao. Chính vì vậy trước khi tiến hành giao dịch cần phải xem xét mọi mặt vấn đề chấp nhận tiến hành giao dịch cụ thể xét theo quan điểm của nguồn lực tài chính sẵn có và mức độ am hiểu thị trường tài chính.
Sử dụng thông tin: sử dụng toàn bộ hay riêng biệt các dữ liệu trên trang web của công ty TeleTrade như một nguồn cung cấp thông tin nhất định. Việc sử dụng tư liệu từ trang web cần kèm theo liên kết đến trang teletrade.vn. Việc tự động thu thập số liệu cũng như thông tin từ trang web TeleTrade đều không được phép.
Xin vui lòng liên hệ với pr@teletrade.global nếu có câu hỏi.
ngân hàng