- Phân tích
- Tin tức và các công cụ
- Tin tức thị trường
- USD/NOK trades mildly lower after Norwegian CPI data
USD/NOK trades mildly lower after Norwegian CPI data
- Despite hot inflation readings from Norway, the Fed’s hawkish stance limits the downside.
- Markets are gearing up for next week’s US CPI reading which may likely set the pace of the pair.
The USD/NOK pair is trading with mild losses around 10.85. The Federal Reserve's (Fed) hawkish approach seems to be aiding the USD, while strong economic recovery signals in Norway aren't offsetting this impact on the NOK. As the American calendar remains empty, all eyes are on next week’s Consumer Price Index (CPI) report from April from the US.
Norway's April CPI showed that the headline number rose to 3.6% year-on-year, which was slightly higher than anticipated, although it showed a slight drop from March's 3.9%. Meanwhile, the underlying inflation rate surprised by coming in at 4.4% year-on-year, two ticks higher than expected, and up from March's 4.5%.
Last week, the Norges Bank opted to maintain rates at 4.5% and highlighted the possibility of needing to sustain a tight monetary policy stance for a longer duration than previously anticipated, citing the current data trends. Markets are expecting only 50 bps of easing in the next 12 months.
On the US side, US Fed officials are keeping the hawkish bets steady and as for now, investors are delaying the start of the easing cycle to September.
USD/NOK technical analysis
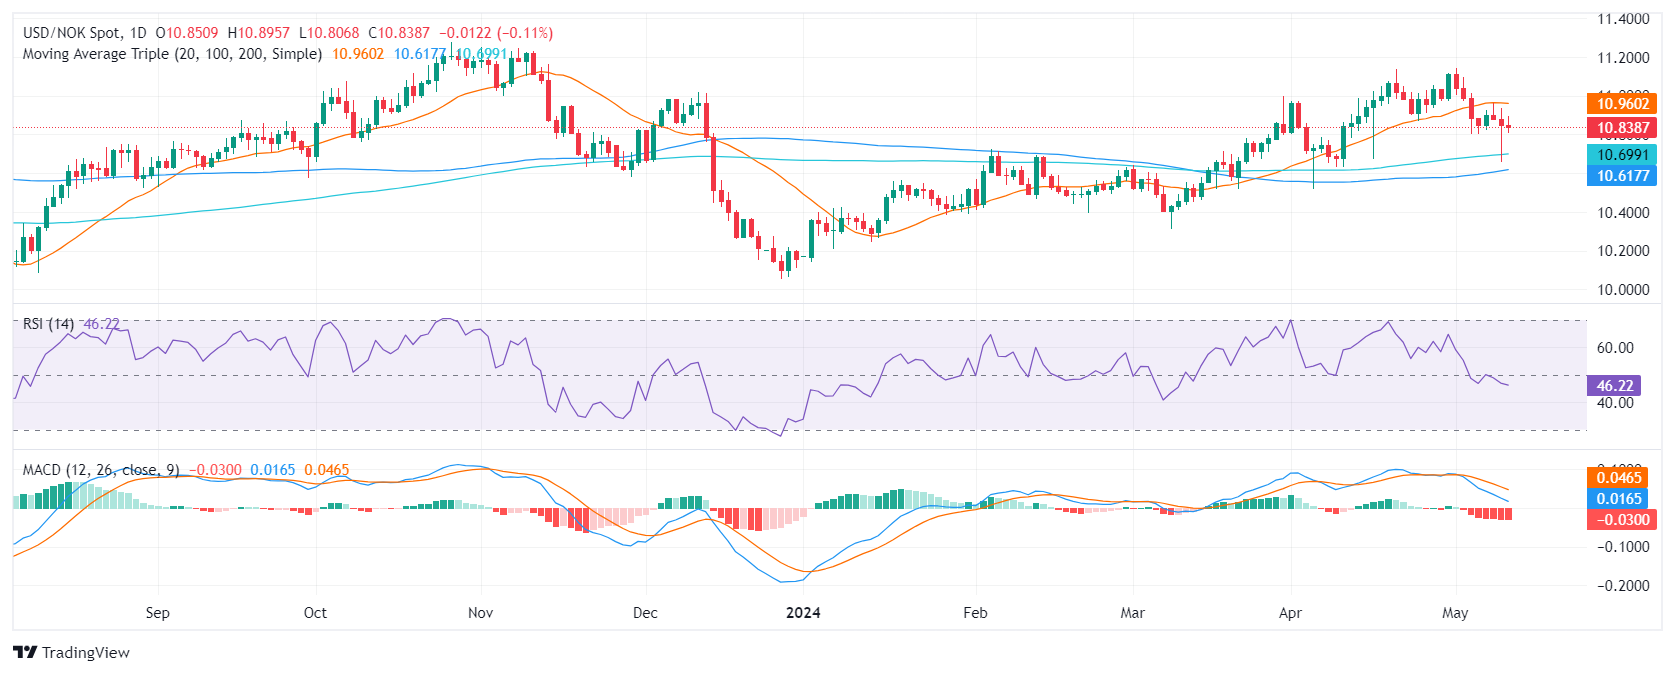
The daily Relative Strength Index (RSI) for the USD/NOK pair remains largely within the negative territory. Today's reading is at 46.66, which suggests a somewhat bearish short-term outlook. Due to its fluctuation, with an initial high near-overbought conditions and a subsequent drop, the RSI indicates the potential for bearish pressure. However, the consistent presence within the negative territory also warns of a continuous downtrend possibility.
Simultaneously, the Moving Average Convergence Divergence (MACD) histogram strengthens this view. Rising red bars signify an increasing negative momentum, with sellers gaining a more dominant position in the market.
USD/NOK technical analysis
Upon evaluation of the bigger picture, the USD/NOK chart exhibits a strong stance above the 20, 100, and 200-day Simple Moving Averages (SMAs). As the pair trades above these key moving averages, it indicates a bullish long-term trend, considering both minor and major aspects. However, given the significant trading above these levels, traders should be mindful of the potential pullback risks, which could provide possible buying opportunities.
In conclusion, despite a bearish short-term view provided by the daily RSI and MACD indicators, the placement above the SMAs suggests an overall bullish trajectory for the USD/NOK pair. Caution is warranted due to possible volatility and the likelihood of pullbacks, hence the need for continuous monitoring of market trends and indicators.
USD/NOK daily chart


© 2000-2026. Bản quyền Teletrade.
Trang web này được quản lý bởi Teletrade D.J. LLC 2351 LLC 2022 (Euro House, Richmond Hill Road, Kingstown, VC0100, St. Vincent and the Grenadines).
Thông tin trên trang web không phải là cơ sở để đưa ra quyết định đầu tư và chỉ được cung cấp cho mục đích làm quen.
Giao dịch trên thị trường tài chính (đặc biệt là giao dịch sử dụng các công cụ biên) mở ra những cơ hội lớn và tạo điều kiện cho các nhà đầu tư sẵn sàng mạo hiểm để thu lợi nhuận, tuy nhiên nó mang trong mình nguy cơ rủi ro khá cao. Chính vì vậy trước khi tiến hành giao dịch cần phải xem xét mọi mặt vấn đề chấp nhận tiến hành giao dịch cụ thể xét theo quan điểm của nguồn lực tài chính sẵn có và mức độ am hiểu thị trường tài chính.
Sử dụng thông tin: sử dụng toàn bộ hay riêng biệt các dữ liệu trên trang web của công ty TeleTrade như một nguồn cung cấp thông tin nhất định. Việc sử dụng tư liệu từ trang web cần kèm theo liên kết đến trang teletrade.vn. Việc tự động thu thập số liệu cũng như thông tin từ trang web TeleTrade đều không được phép.
Xin vui lòng liên hệ với pr@teletrade.global nếu có câu hỏi.
ngân hàng