- Phân tích
- Tin tức và các công cụ
- Tin tức thị trường
- Silver Price Analysis: XAG/USD test key resistance levels amid uptrends
Silver Price Analysis: XAG/USD test key resistance levels amid uptrends
- Silver dips to $26.54, down 0.43%; 'dragonfly doji' hints at possible uptrend.
- Finds support at 61.8% Fibonacci level ($26.41); crossing $27.00 could boost bullish momentum.
- Downside risk if below May 2 low of $26.02, aiming for 50-day MA at $25.79.
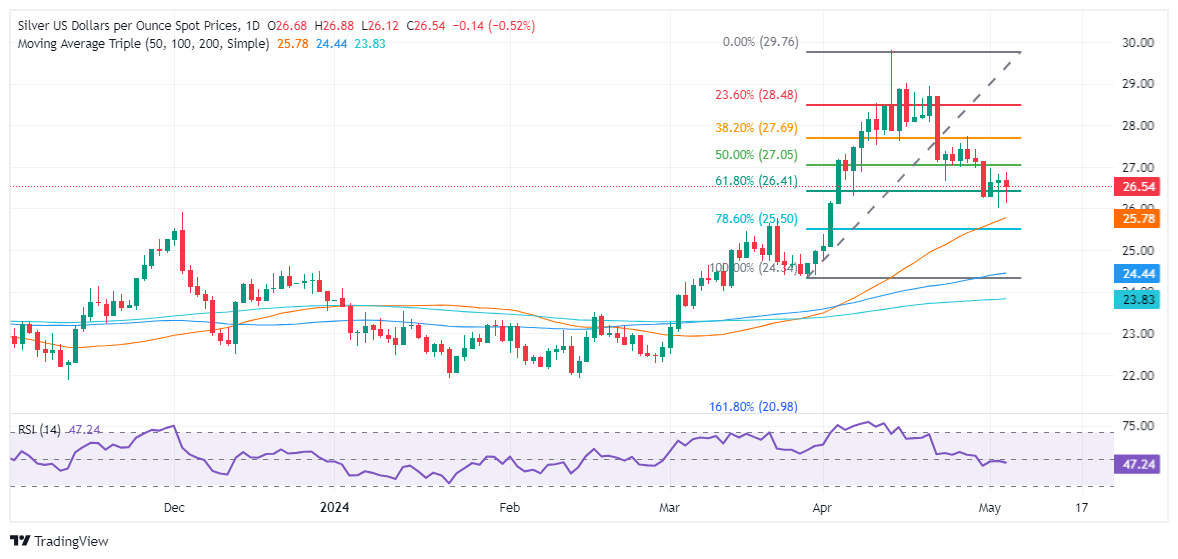
Silver price uptrend continued during the week despite registering losses of around 2.40%. Nevertheless, May 2’s price action forming a ‘dragonfly doji,’ a bullish candle, alongside technical indicators suggesting that the grey metal remains bullish, could pave the way for a recovery. At the time of writing, XAG/USD trades at $26.54, down 0.43%.
XAG/USD Price Analysis: Technical outlook
As previously mentioned, Silver remains bullishly biased after posting an impressive rally that passed the $29.00 mark. It appears to have bottomed out at around the 61.8% Fibonacci retracement at $26.41, though buyers had been unable to test the $27.00 mark.
Although momentum had shifted bearishly, with the Relative Strength Index (RSI) diving below the 50-midline, upside risks remain. If buyers reclaim the $27.00 figure, that could reignite buying pressure and pave the way to challenge the next resistance level seen at the 38.2% Fibo retracement at $27.70. Once surpassed, the next step would be the 23.6% Fibo retracement at $28.49.
Nevertheless, with the RSI standing at bearish territory, sellers need to push prices below the May 2 low of $26.02. Once cleared the next stop would be the 50-day moving average (DMA) at $25.79, followed by the 78.6% Fibo retracement at $25.50.
XAU/USD Price Action – Daily Chart


© 2000-2026. Bản quyền Teletrade.
Trang web này được quản lý bởi Teletrade D.J. LLC 2351 LLC 2022 (Euro House, Richmond Hill Road, Kingstown, VC0100, St. Vincent and the Grenadines).
Thông tin trên trang web không phải là cơ sở để đưa ra quyết định đầu tư và chỉ được cung cấp cho mục đích làm quen.
Giao dịch trên thị trường tài chính (đặc biệt là giao dịch sử dụng các công cụ biên) mở ra những cơ hội lớn và tạo điều kiện cho các nhà đầu tư sẵn sàng mạo hiểm để thu lợi nhuận, tuy nhiên nó mang trong mình nguy cơ rủi ro khá cao. Chính vì vậy trước khi tiến hành giao dịch cần phải xem xét mọi mặt vấn đề chấp nhận tiến hành giao dịch cụ thể xét theo quan điểm của nguồn lực tài chính sẵn có và mức độ am hiểu thị trường tài chính.
Sử dụng thông tin: sử dụng toàn bộ hay riêng biệt các dữ liệu trên trang web của công ty TeleTrade như một nguồn cung cấp thông tin nhất định. Việc sử dụng tư liệu từ trang web cần kèm theo liên kết đến trang teletrade.vn. Việc tự động thu thập số liệu cũng như thông tin từ trang web TeleTrade đều không được phép.
Xin vui lòng liên hệ với pr@teletrade.global nếu có câu hỏi.
ngân hàng