- Phân tích
- Tin tức và các công cụ
- Tin tức thị trường
- USD/CAD Price Analysis: Consolidates around 1.3650 ahead of Fed’s preferred inflation gauge
USD/CAD Price Analysis: Consolidates around 1.3650 ahead of Fed’s preferred inflation gauge
- USD/CAD trades sideways ahead of the US core PCE Inflation that will influence Fed rate cut expectations.
- The US Dollar remains on backfoot as weak US Q1 GDP raise concerns over the economic outlook.
- Investors see the BoC pivoting to interest rate cuts from June.
The USD/CAD pair is stuck in a tight range near 1.3650 in Friday’s European session. The Loonie asset struggles for a direction as the US Dollar consolidates ahead of the United States core Personal Consumption Expenditure Price Index (PCE) data for March, which will be published at 12:30 GMT.
On a monthly basis, the underlying inflation data is estimated to have increased steadily by 0.3%. Annually, the inflation measure is seen decelerating to 2.6% from the prior reading of 2.8%. The core PCE Price Index is the Federal Reserve’s (Fed) preferred inflation gauge, which is expected to influence speculation about when the central bank pivots to interest rate cuts, which financial markets are currently anticipating from the September meeting.
The US Dollar Index (DXY) is slightly up at 105.70 in the London session but fell sharply on Thursday after the US Q1 Gross Domestic Product (GDP) report showed that the economy expanded at a slower rate of 1.6% from the consensus of 2.5% and the prior reading of 3.4%. This has triggered doubts over the US economic outlook.
Meanwhile, the Canadian Dollar has remained underpinned against the US Dollar this week despite firm expectations that the Bank of Canada (BoC) will start reducing interest rates from the June meeting. Easing inflation, weak Retail Sales and loosening labor market conditions have boosted BoC rate cut bets for June.
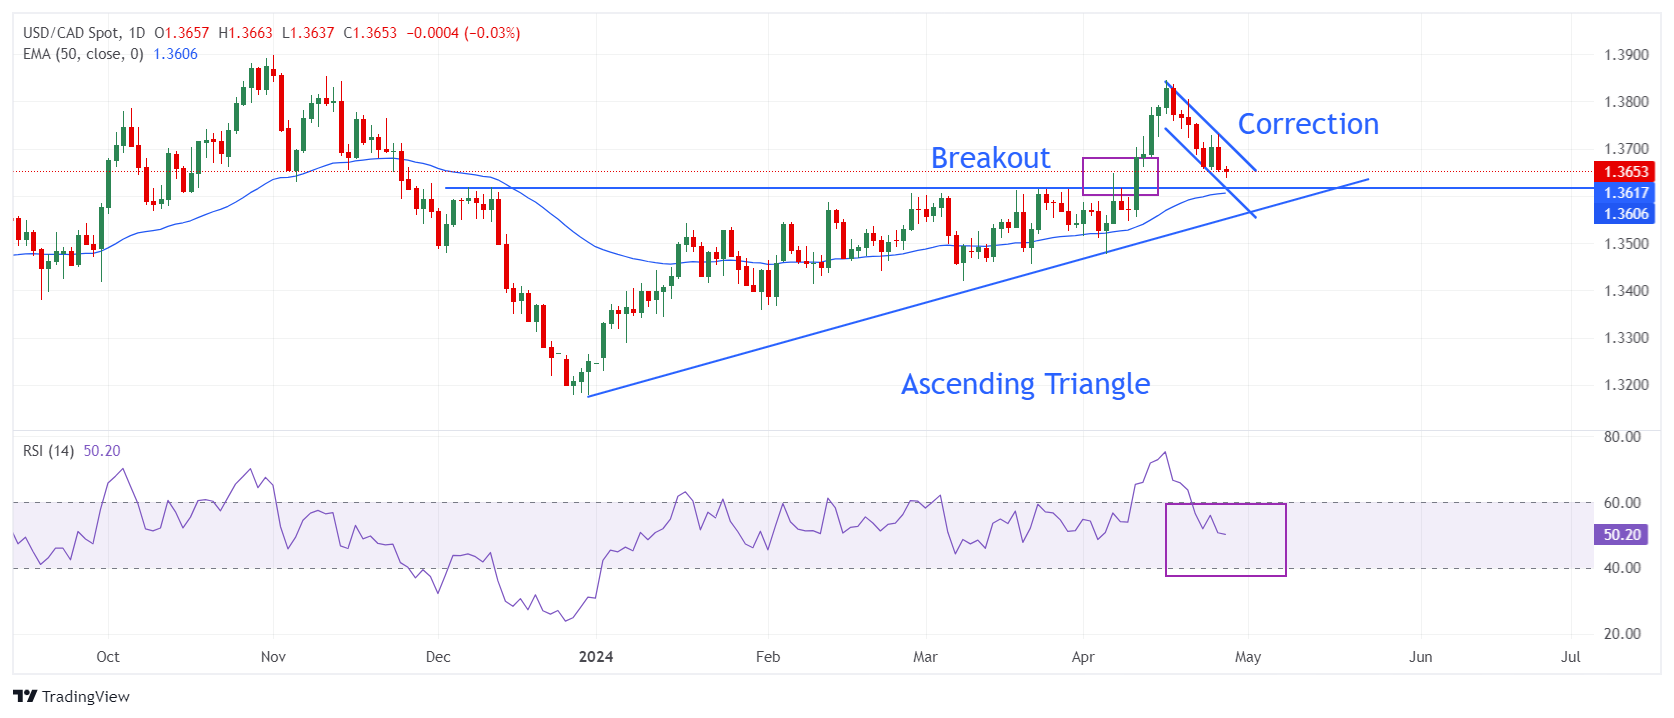
USD/CAD corrects to near the breakout region of the Ascending Triangle chart pattern formed on a daily timeframe. The retest of the breakout region is keenly tracked by investors to build fresh longs as it is considered a discounted price. The 50-day Exponential Moving Average (EMA) near 1.3620 will provide support to the US Dollar bulls.
The 14-period Relative Strength Index (RSI) falls into the 40.00-60.00. The RSI is expected to rebound from 40.00 as the upside bias remains intact. However, a breakdown below the same will increase the odds of a bearish reversal.
Fresh buying opportunity would emerge if the asset falls further to near April 8 high at 1.3617. This would drive the asset towards April 11 low at 1.3661, followed by the round-level resistance of 1.3700.
In an alternate scenario, a breakdown below April 9 low around 1.3547 will expose the asset to the psychological support of 1.3500 and March 21 low around 1.3456.
USD/CAD daily chart
© 2000-2026. Bản quyền Teletrade.
Trang web này được quản lý bởi Teletrade D.J. LLC 2351 LLC 2022 (Euro House, Richmond Hill Road, Kingstown, VC0100, St. Vincent and the Grenadines).
Thông tin trên trang web không phải là cơ sở để đưa ra quyết định đầu tư và chỉ được cung cấp cho mục đích làm quen.
Giao dịch trên thị trường tài chính (đặc biệt là giao dịch sử dụng các công cụ biên) mở ra những cơ hội lớn và tạo điều kiện cho các nhà đầu tư sẵn sàng mạo hiểm để thu lợi nhuận, tuy nhiên nó mang trong mình nguy cơ rủi ro khá cao. Chính vì vậy trước khi tiến hành giao dịch cần phải xem xét mọi mặt vấn đề chấp nhận tiến hành giao dịch cụ thể xét theo quan điểm của nguồn lực tài chính sẵn có và mức độ am hiểu thị trường tài chính.
Sử dụng thông tin: sử dụng toàn bộ hay riêng biệt các dữ liệu trên trang web của công ty TeleTrade như một nguồn cung cấp thông tin nhất định. Việc sử dụng tư liệu từ trang web cần kèm theo liên kết đến trang teletrade.vn. Việc tự động thu thập số liệu cũng như thông tin từ trang web TeleTrade đều không được phép.
Xin vui lòng liên hệ với pr@teletrade.global nếu có câu hỏi.


