- Phân tích
- Tin tức và các công cụ
- Tin tức thị trường
- USD/JPY goes on a roller-coaster ride prompted by geopolitical risk
USD/JPY goes on a roller-coaster ride prompted by geopolitical risk
- USD/JPY whipsaws lower and then higher on alternating risk-on risk-off caused by Middle East tensions.
- Governor Ueda talks about defending the Yen from further weakness and currency-induced imported inflation.
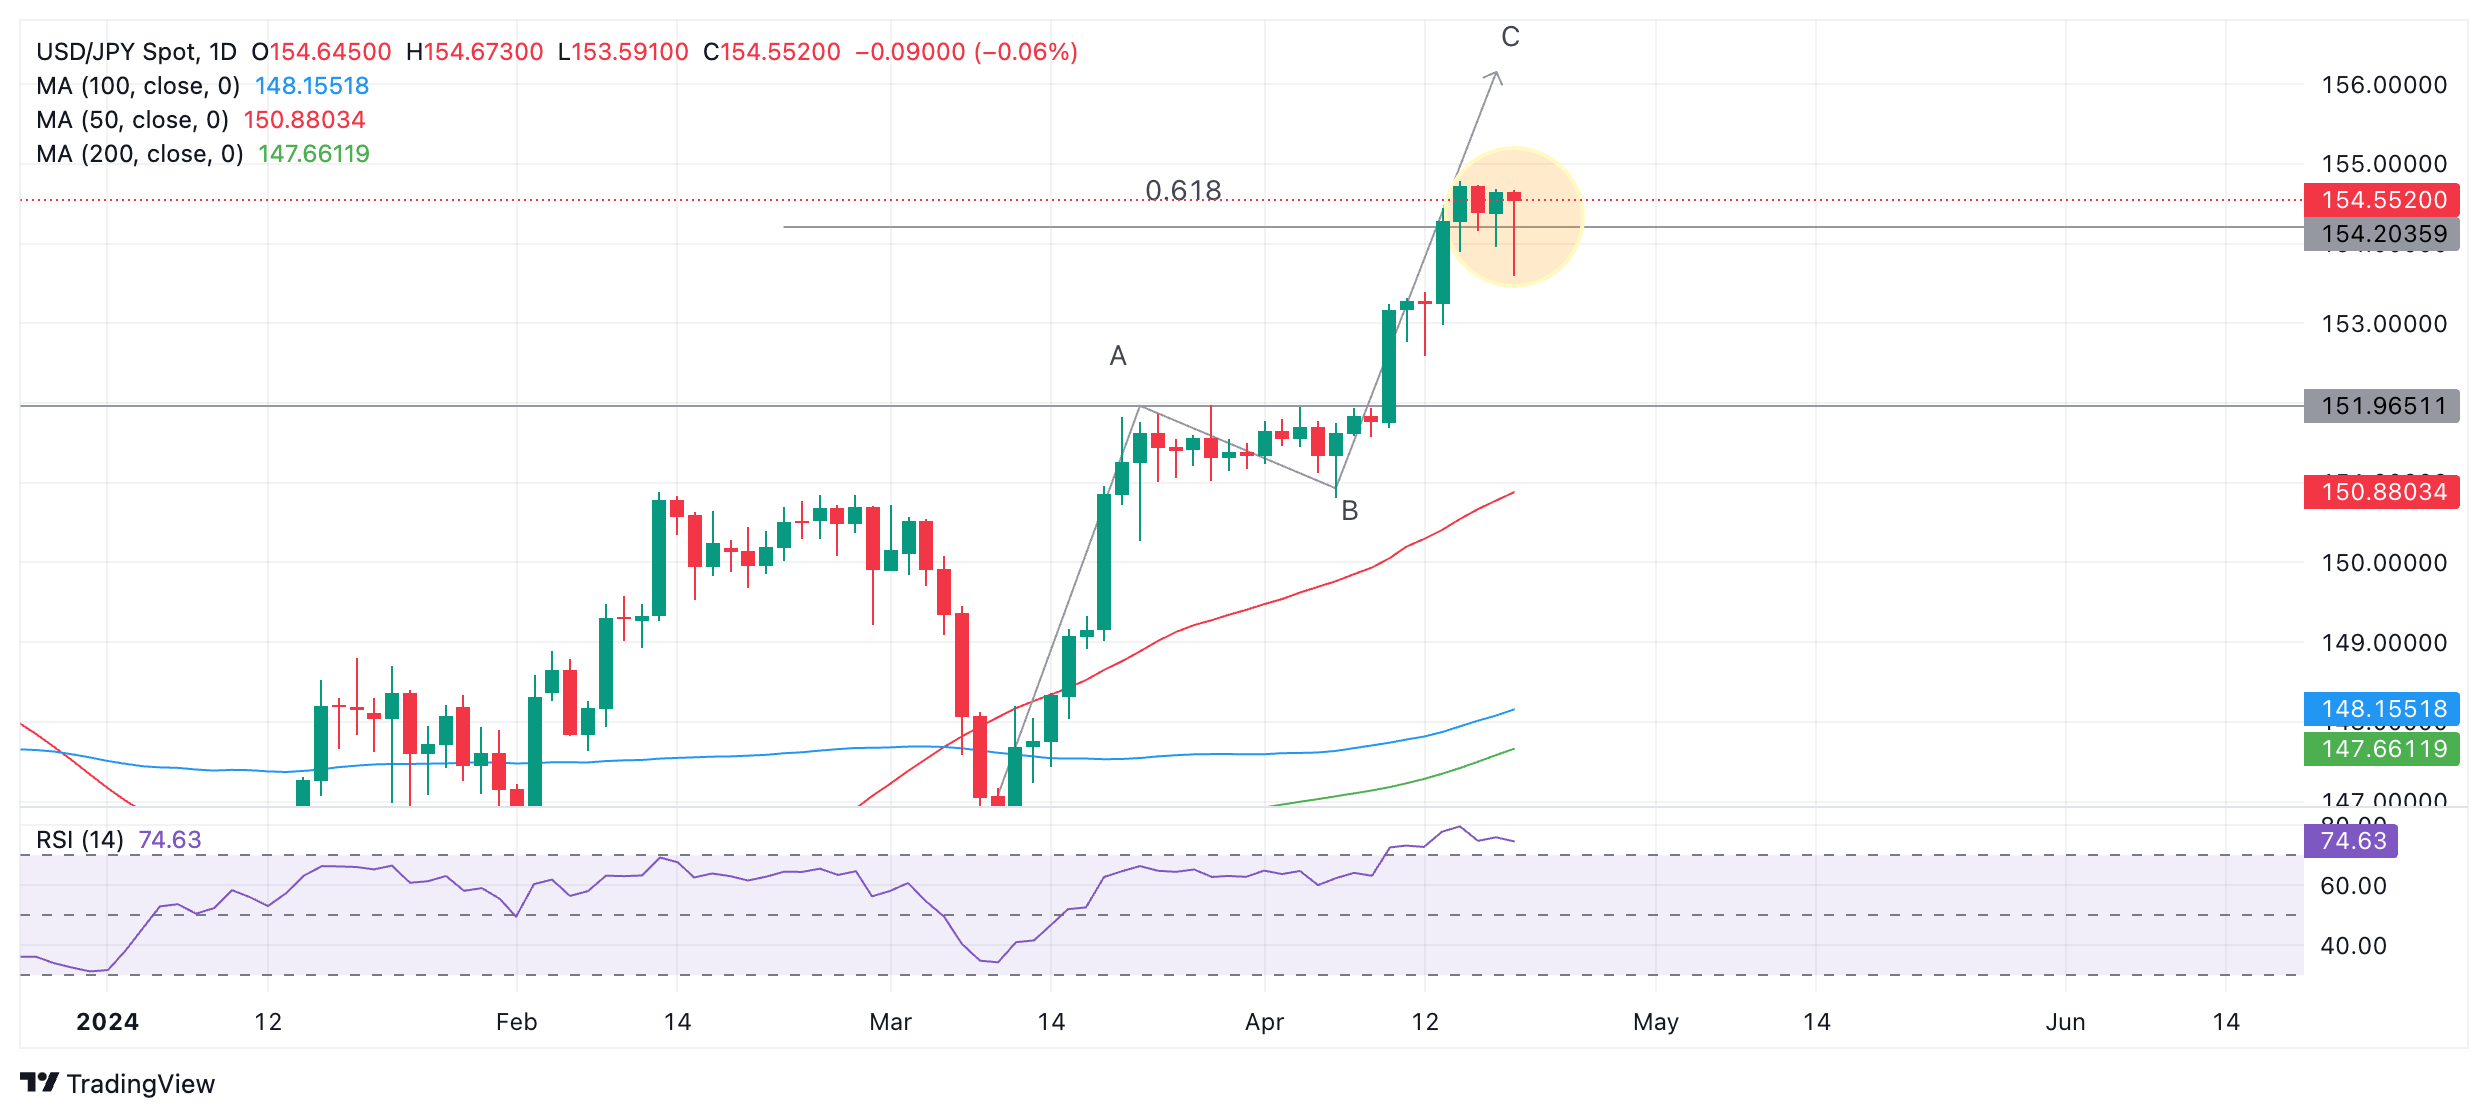
- USD/JPY price chart shows bearish Hanging Man forming, boding ill for future price action.
USD/JPY is trading in the 154.50s on Friday after declining to a low for the day in the 153.00s on the back of a spike in safe-haven demand that disproportionately favored the Japanese Yen (JPY).
An escalation in Middle East tensions, triggered a flight to safety overnight after news of bomb explosions in Iran. The attacks were thought to be orchestrated by Israel in retaliation for the drone armada sent by Iran on April 13.
Although the US Dollar benefited from the flight to safety, JPY gained more from the shift in sentiment, pushing down USD/JPY which expresses the number of Japanese Yen purchasable with one US Dollar.
The pair subsequently recovered as tensions eased, however, and a senior Iranian official reportedly stated Iran has no immediate plans to retaliate, according to Reuters.
Inflation ticks lower but Ueda adopts hawkish tone
On the data front, the Japanese National Consumer Price Index (CPI) for March increased by 2.7% year-over-year, compared to a 2.8% rise in February, according to the Japan Statistics Bureau.
Despite the decline in inflation observed in the data, however, the Governor of the Bank of Japan (BoJ) Kazuo Ueda issued hawkish rhetoric supporting the Japanese Yen. Ueda said the central bank might consider raising interest rates again if significant declines in the Yen caused currency-related inflation, according to Reuters.
Technical Analysis: USD/JPY looks to post bearish Hanging Man pattern
USD/JPY looks like it may be positing a bearish Hanging Man candlestick pattern on Friday (circled) assuming the close does not differ markedly from the current market price.
If the Hanging Man completes and is followed by a bearish candlestick on Monday it will confirm a short-term bearish reversal pattern and indicate lower prices are likely to follow.
USD/JPY Daily Chart
A Measured Move price pattern, composed of three waves, commonly labeled A, B and C has been unfolding since the start of March.
The general rule with these patterns is that the end of wave C can be estimated as occurring where wave C is equal in length to wave A, or a Fibonacci ratio of wave A. At the very least C normally extends to a 0.618 ratio of A.
USD/JPY has already reached the conservative estimate for the end of wave C at the Fib. 0.618 extension of A, at 154.20. This means there is a possibility C may have reached its limit and the Measured Move could be complete.
Once the Measured Move completes it is usually followed by a reversal, which in this case means a decline.
If the end of C equals A, however, it still has higher to go and could reach roughly 156.11.
The Relative Strength Index (RSI) is in overbought territory, suggesting the risk of a pullback is on the horizon. The advice is for bullish traders with a medium-term outlook to not add to their positions. If RSI exits overbought it may be a sign USD/JPY is pulling back.
A break above the 154.78 high could indicate a continuation of the uptrend to the next target at the more 156.11 optimistic end of wave C.
Alternatively, further weakness could lead to a correction back to support at the top of wave A, at 151.96.
© 2000-2026. Bản quyền Teletrade.
Trang web này được quản lý bởi Teletrade D.J. LLC 2351 LLC 2022 (Euro House, Richmond Hill Road, Kingstown, VC0100, St. Vincent and the Grenadines).
Thông tin trên trang web không phải là cơ sở để đưa ra quyết định đầu tư và chỉ được cung cấp cho mục đích làm quen.
Giao dịch trên thị trường tài chính (đặc biệt là giao dịch sử dụng các công cụ biên) mở ra những cơ hội lớn và tạo điều kiện cho các nhà đầu tư sẵn sàng mạo hiểm để thu lợi nhuận, tuy nhiên nó mang trong mình nguy cơ rủi ro khá cao. Chính vì vậy trước khi tiến hành giao dịch cần phải xem xét mọi mặt vấn đề chấp nhận tiến hành giao dịch cụ thể xét theo quan điểm của nguồn lực tài chính sẵn có và mức độ am hiểu thị trường tài chính.
Sử dụng thông tin: sử dụng toàn bộ hay riêng biệt các dữ liệu trên trang web của công ty TeleTrade như một nguồn cung cấp thông tin nhất định. Việc sử dụng tư liệu từ trang web cần kèm theo liên kết đến trang teletrade.vn. Việc tự động thu thập số liệu cũng như thông tin từ trang web TeleTrade đều không được phép.
Xin vui lòng liên hệ với pr@teletrade.global nếu có câu hỏi.


