- Phân tích
- Tin tức và các công cụ
- Tin tức thị trường
- EUR/USD under pressure after US CPI and FOMC minutes
EUR/USD under pressure after US CPI and FOMC minutes
- US headline and core CPI exceeded expectations, rising to 3.5% and 3.8% respectively in March.
- FOMC minutes from March highlighted uncertainty about the persistence of high inflation and the efficacy of monetary policy.
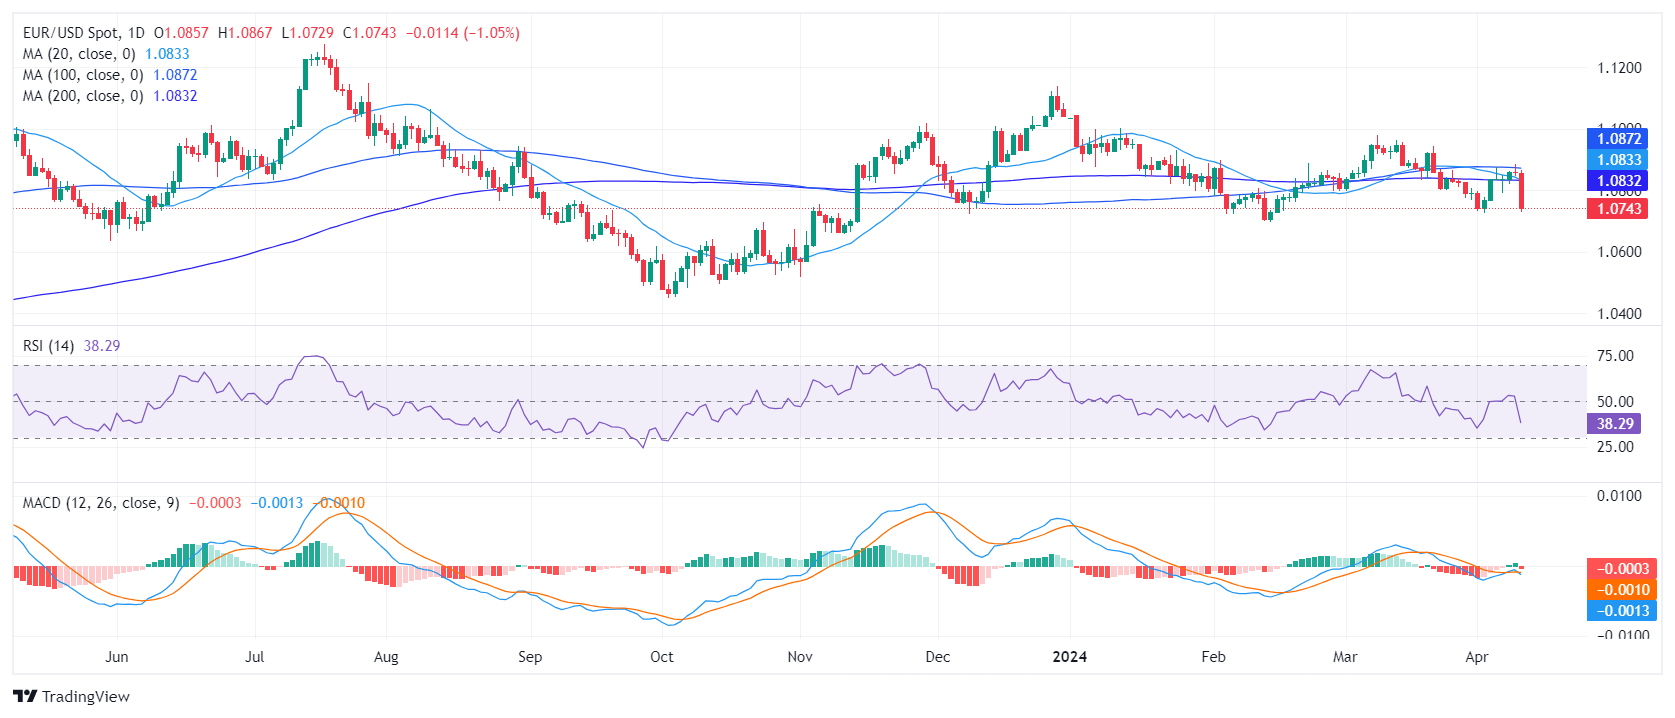
The EUR/USD pair declined to 1.0739, representing a substantial decline of 1.1%. This decline has occurred following the release of hot inflation figures from the US which fueled hawkish bets on the Federal Reserve (Fed). The Federal Open Market Committee (FOMC) minutes from the March meeting didn’t trigger any reaction.
The US Bureau of Labor Statistics (BLS) revealed on Wednesday that the nation's inflation rate, reflected by the Consumer Price Index (CPI), increased from 3.2% in February to 3.5% in March on an annual basis. This outstripped the predicted market forecast of 3.4%. The yearly core CPI, which omits fluctuating food and energy costs, mirrored February's growth by rising 3.8%. Both the CPI and the core CPI climbed by 0.4% monthly, exceeding analysts' projection of 0.3%. As a reaction, US Treasury yields soared while the odds of a June Rate cut by the Fed declined to over 20%. The mix of hawkish bets as rising yields benefited the USD during the session.
On the other hand, the FOMC Minutes disclosed a general lack of assurance amongst participants concerning the persistence of high inflation rates, with recent data failing to bolster their trust in the economy cooling down and t in the inflation rate steadily reaching the 2% benchmark. With inflation running hot as well as the labor market, officials may change their language and slowly give up on the chances of a June rate cut by the Fed.
EUR/USD technical analysis
On the daily chart, the Relative Strength Index (RSI) fell within negative territory, with the latest reading at 38. This deviation from a positive trend suggests a shift in market dominance towards the sellers. Along with the RSI, the Moving Average Convergence Divergence (MACD) displayed a fresh red bar, indicating negative market momentum.
In the broader outlook, the EUR/USD also exhibits a bearish trend as it is positioned below key Simple Moving Averages (SMAs). SMAs are tools used to smooth out significant price data fluctuations over specific time periods to discern market trends. Specifically, today it fell below the 200-day SMA, typically considered a long-term trend indicator.

© 2000-2026. Bản quyền Teletrade.
Trang web này được quản lý bởi Teletrade D.J. LLC 2351 LLC 2022 (Euro House, Richmond Hill Road, Kingstown, VC0100, St. Vincent and the Grenadines).
Thông tin trên trang web không phải là cơ sở để đưa ra quyết định đầu tư và chỉ được cung cấp cho mục đích làm quen.
Giao dịch trên thị trường tài chính (đặc biệt là giao dịch sử dụng các công cụ biên) mở ra những cơ hội lớn và tạo điều kiện cho các nhà đầu tư sẵn sàng mạo hiểm để thu lợi nhuận, tuy nhiên nó mang trong mình nguy cơ rủi ro khá cao. Chính vì vậy trước khi tiến hành giao dịch cần phải xem xét mọi mặt vấn đề chấp nhận tiến hành giao dịch cụ thể xét theo quan điểm của nguồn lực tài chính sẵn có và mức độ am hiểu thị trường tài chính.
Sử dụng thông tin: sử dụng toàn bộ hay riêng biệt các dữ liệu trên trang web của công ty TeleTrade như một nguồn cung cấp thông tin nhất định. Việc sử dụng tư liệu từ trang web cần kèm theo liên kết đến trang teletrade.vn. Việc tự động thu thập số liệu cũng như thông tin từ trang web TeleTrade đều không được phép.
Xin vui lòng liên hệ với pr@teletrade.global nếu có câu hỏi.


