- Phân tích
- Tin tức và các công cụ
- Tin tức thị trường
- EUR/GBP threatens the 20-day SMA after European PMIs
EUR/GBP threatens the 20-day SMA after European PMIs
- The EUR/GBP stands at 0.8560, marking a 0.25% increase in the session.
- European PMIs from January where upwards revised but remained still in contraction territory.
- Hourly indicators hint at potential consolidation after bulls got rejected near overbought area.
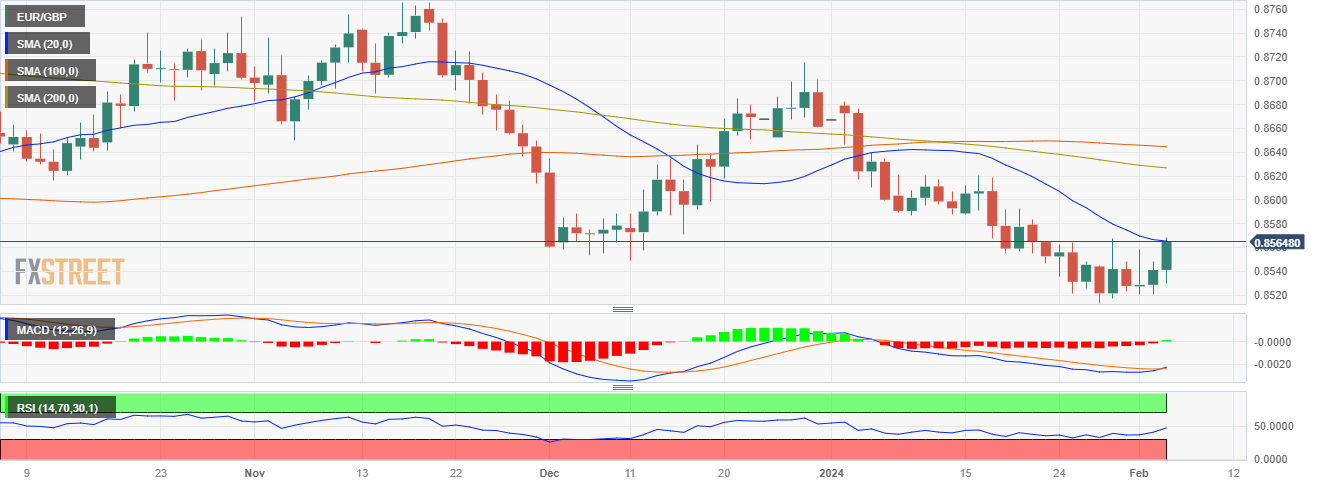
In Monday's session, the EUR/GBP pair was seen trading at 0.8560, gaining a 0.25% and seems to be marching towards the 20-day Simple Moving Average (SMA) at 0.8565 . Despite pressures from a stagnant Euro Area economy and anticipations of ECB's rate cut, the daily chart indicates the dominance of buyers. On the hourly chart, however, indicators hint at a possible pullback as they got rejected near the overbought territory.
During the European session, the Hamburg Commercial Bank (HCOB) PMIs from January where upwards revised which gave some traction to the EUR but they still remain deep in contraction area. This situation may push the ECB to initiate a rate cut by June 2024, assuming the economies continue to weaken. Conversely, the UK economy shows signs of potential firmness with the Bank of England (BoE) shifting from assessing the need for restrictive monetary policy to sustaining the current stance. Following the bank's decision to hold rates, market anticipates around 100 bps of rate cuts for 2024, which might be moderated due to expected fiscal amendments. On the ECB side, markets expect between 125 and 150 bps of easing in 2024 and this divergences may eventually limit any upwards movements by the cross.
EUR/GBP levels to watch
Assessing the daily chart indicators, the Relative Strength Index (RSI) is glimpsing a positive gradient despite being within negative territory. This exhibits a potential shift towards an upward trend as bulls start to conquer additional ground. In addition, the Moving Average Convergence Divergence (MACD) is exhibiting increased green bars, suggesting that the upward force is taking control. The shift in momentum may come into fruition in case the buyers manage to push the pair back above the 20-day Simple Moving Average (SMA) .
Switching to the hourly chart for the more immediate perspective, the scenario seems to be a bit more complicated for the bulls. Even though indicators have been rebuffed near overbought territory, the RSI portrays a downward slope positioned within positive territory, indicating some selling momentum as buyers seem to be taking profits. However, the sustained growth in the green bars of the MACD identifies a continuous buying pressure in the shorter timeframe.
EUR/GBP daily chart

© 2000-2026. Bản quyền Teletrade.
Trang web này được quản lý bởi Teletrade D.J. LLC 2351 LLC 2022 (Euro House, Richmond Hill Road, Kingstown, VC0100, St. Vincent and the Grenadines).
Thông tin trên trang web không phải là cơ sở để đưa ra quyết định đầu tư và chỉ được cung cấp cho mục đích làm quen.
Giao dịch trên thị trường tài chính (đặc biệt là giao dịch sử dụng các công cụ biên) mở ra những cơ hội lớn và tạo điều kiện cho các nhà đầu tư sẵn sàng mạo hiểm để thu lợi nhuận, tuy nhiên nó mang trong mình nguy cơ rủi ro khá cao. Chính vì vậy trước khi tiến hành giao dịch cần phải xem xét mọi mặt vấn đề chấp nhận tiến hành giao dịch cụ thể xét theo quan điểm của nguồn lực tài chính sẵn có và mức độ am hiểu thị trường tài chính.
Sử dụng thông tin: sử dụng toàn bộ hay riêng biệt các dữ liệu trên trang web của công ty TeleTrade như một nguồn cung cấp thông tin nhất định. Việc sử dụng tư liệu từ trang web cần kèm theo liên kết đến trang teletrade.vn. Việc tự động thu thập số liệu cũng như thông tin từ trang web TeleTrade đều không được phép.
Xin vui lòng liên hệ với pr@teletrade.global nếu có câu hỏi.


