- Phân tích
- Tin tức và các công cụ
- Tin tức thị trường
- NZD/USD faces strong downward force amid surprising strong NFP figures
NZD/USD faces strong downward force amid surprising strong NFP figures
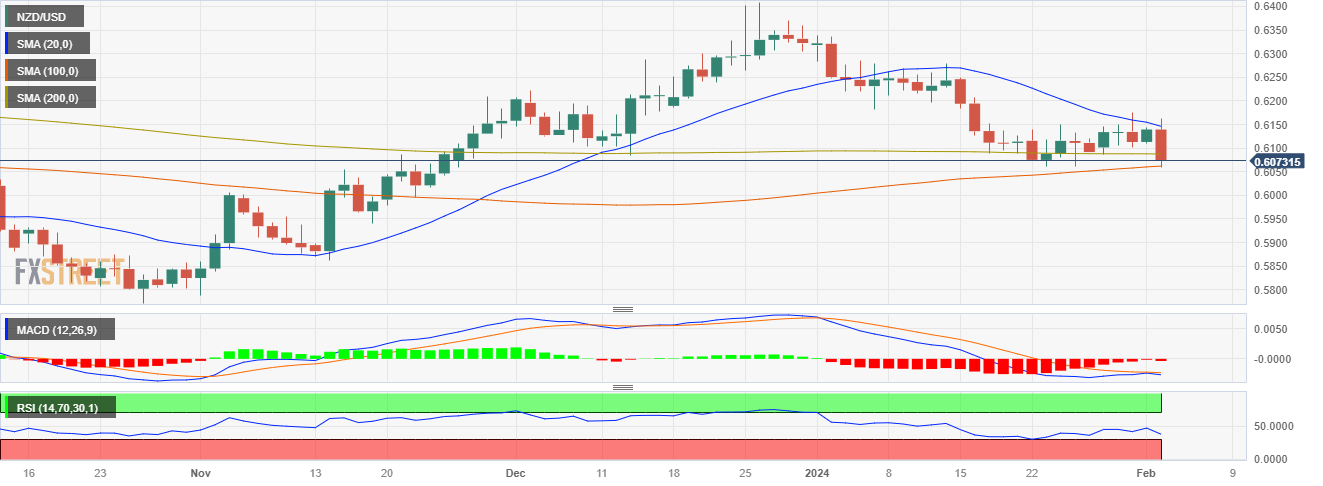
- The NZD/USD showed a strong downward swing, falling near the 0.6060 level.
- US Nonfarm Payrolls added 353K jobs in January surpassing by a wide margin the expectations.
- The bets of a rate cut in March sharply declined and markets pushed the start of the easing to May.
In Friday's trading session, the NZD/USD took a steep turn downwards, landing at a rough level of 0.6060. The pronounced downward trajectory resulted from a surprisingly strong US Nonfarm Payrolls report that pushed the pair into bearish domain as markets gave up the hopes of sooner rate cuts by the Federal Reserve (Fed). For the week, the pair closed a 0.40% weekly loss.
The US Bureau of Labor Statistics reported that the Nonfarm Payrolls for January presented a robust picture with a significant increase of 353K compared to the consensus figure of 180K and the previous 333K. The Average Hourly Earnings in January increased by 0.6%, outstripping the anticipated 0.3% and the preceding 0.4% respectively while the yearly measure soared to a 4.5%, higher than the prior 4.4% and beating the expected 4.1%. Lastly, the Unemployment Rate for January remained steady at 3.7%, which aligns with its previous figure and was slightly lower than the anticipated 3.8%.
As a reaction, the US bond rose across the board as markets start to prepare for the easing cycle of the Fed to start in May rather than in March. The 2-year rate is currently standing at 4.37%, with the 5 and 10-year yields observed at 4% and 4.05% respectively. As per historical financial trends, a rise in yields generally tends to fortify the USD's position as it is more appealling for foreign investors.
In line with that, the CME FedWatch Tool showed a significant drop in the likelihood of a March interest rate cut, with estimates now standing at just 20% while the odds of a cut in the following May meeting rose to nearly 58%.
NZD/USD levels to watch
The daily chart suggests that the pair has a bearish bias, at least in the short-term. Indicators signal declining buying power, as depicted by the negative slope and negative territory in the Relative Strength Index (RSI). Adding to that the histogram of the Moving Average Convergence Divergence (MACD) displays rising red bars, hinting that the overall momentum favors the sellers.
Looking at the pair's position relative to moving averages, it is trading below the 20-day and 200-day Simple Moving Averages (SMAs), another sign of bearish sentiment. Yet, interestingly, it sits above the 100-day SMA, indicating that the bulls are maintaining a bullish grip on the broader outlook.

© 2000-2026. Bản quyền Teletrade.
Trang web này được quản lý bởi Teletrade D.J. LLC 2351 LLC 2022 (Euro House, Richmond Hill Road, Kingstown, VC0100, St. Vincent and the Grenadines).
Thông tin trên trang web không phải là cơ sở để đưa ra quyết định đầu tư và chỉ được cung cấp cho mục đích làm quen.
Giao dịch trên thị trường tài chính (đặc biệt là giao dịch sử dụng các công cụ biên) mở ra những cơ hội lớn và tạo điều kiện cho các nhà đầu tư sẵn sàng mạo hiểm để thu lợi nhuận, tuy nhiên nó mang trong mình nguy cơ rủi ro khá cao. Chính vì vậy trước khi tiến hành giao dịch cần phải xem xét mọi mặt vấn đề chấp nhận tiến hành giao dịch cụ thể xét theo quan điểm của nguồn lực tài chính sẵn có và mức độ am hiểu thị trường tài chính.
Sử dụng thông tin: sử dụng toàn bộ hay riêng biệt các dữ liệu trên trang web của công ty TeleTrade như một nguồn cung cấp thông tin nhất định. Việc sử dụng tư liệu từ trang web cần kèm theo liên kết đến trang teletrade.vn. Việc tự động thu thập số liệu cũng như thông tin từ trang web TeleTrade đều không được phép.
Xin vui lòng liên hệ với pr@teletrade.global nếu có câu hỏi.


