- Phân tích
- Tin tức và các công cụ
- Tin tức thị trường
- AUD/USD stuck near 0.6600 ahead of Australian CPI
AUD/USD stuck near 0.6600 ahead of Australian CPI
- AUD/USD continues to cycle around the 0.6600 handle.
- Aussie CPI print for Q4 2023 expected to show further inflation easing.
- US Fed rate call, NFP labor figures to weigh down the rest of the trading week.
AUD/USD cycled in a familiar pattern around the 0.6600 price point on Tuesday as Antipodeans gear up for a fresh print of Australian Consumer Price Index (CPI) inflation figures with the next rate call from the US Federal Reserve (Fed0 in the barrel for Wednesday and US Nonfarm Payrolls (NFP) labor figures slated for Friday.
Australia’s QoQ CPI is expected to ease back to 0.8% from the previous quarter’s 1.2%, and the Reserve Bank of Australia’s (RBA) Trimmed Mean CPI for the annualized fourth quarter is likewise forecast to clip down from 5.2% to 4.3%.
Australia Monthly CPI Preview: Inflation expected to ease further
The heavy-hitters this week revolve around a one-two punch of another Fed rate call and Friday’s US NFP labor print. The Fed is broadly expected to keep rates on hold this week, but cut-hungry investors are having a hard time letting go of bets for a March rate cut, with 44% of the rate swap market still hoping for a rate cut by March according to the CME’s FedWatch Tool.
This week’s US NFP print is expected to show a slight cooling in US labor markets, with the NFP forecast to come in at 180K in January compared to December’s 216K. Markets have routinely undershot NFP forecasts recently, and a topside upset could see investors suffering a rate tantrum as a stubbornly-healthy US labor market reduces chances of rate cuts happening sooner rather than later.
AUD/USD technical outlook
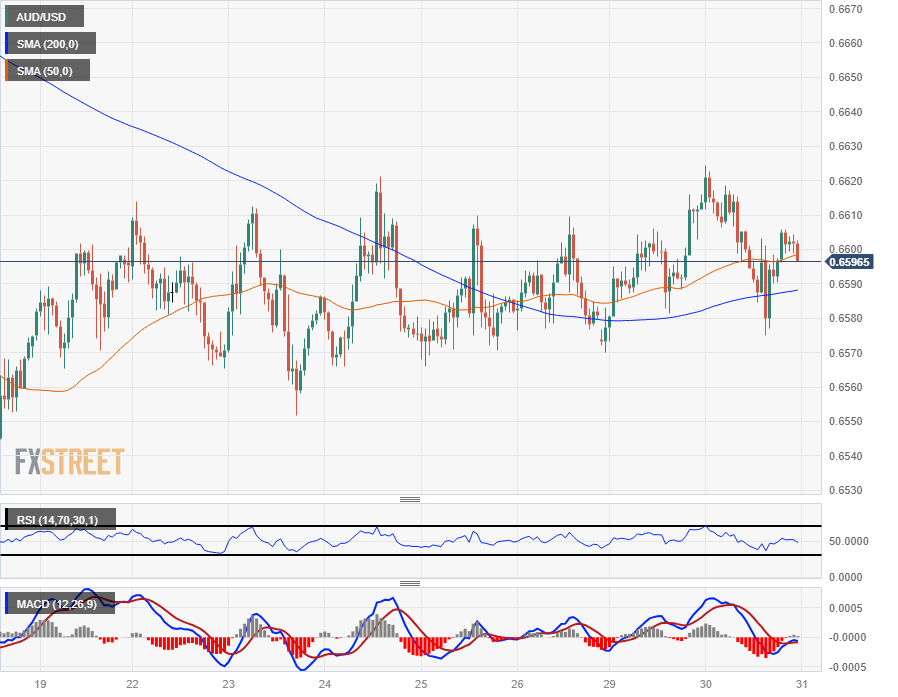
AUD/USD continues to get hung up on the 0.6600 handle, with intraday price action cycling the major price level with near-term momentum getting propped up by a bullish tilt in the 200-hour Simple Moving Average (SMA) rising into 0.6590.
Daily candlesticks remain underpinned by the 200-day SMA at 0.6570, and the AUD/USD is caught in a dense congestion zone between the 50-day and 200-day SMAs as the pair consolidates into the midrange.
AUD/USD Hourly chart
AUD/USD Daily chart
© 2000-2026. Bản quyền Teletrade.
Trang web này được quản lý bởi Teletrade D.J. LLC 2351 LLC 2022 (Euro House, Richmond Hill Road, Kingstown, VC0100, St. Vincent and the Grenadines).
Thông tin trên trang web không phải là cơ sở để đưa ra quyết định đầu tư và chỉ được cung cấp cho mục đích làm quen.
Giao dịch trên thị trường tài chính (đặc biệt là giao dịch sử dụng các công cụ biên) mở ra những cơ hội lớn và tạo điều kiện cho các nhà đầu tư sẵn sàng mạo hiểm để thu lợi nhuận, tuy nhiên nó mang trong mình nguy cơ rủi ro khá cao. Chính vì vậy trước khi tiến hành giao dịch cần phải xem xét mọi mặt vấn đề chấp nhận tiến hành giao dịch cụ thể xét theo quan điểm của nguồn lực tài chính sẵn có và mức độ am hiểu thị trường tài chính.
Sử dụng thông tin: sử dụng toàn bộ hay riêng biệt các dữ liệu trên trang web của công ty TeleTrade như một nguồn cung cấp thông tin nhất định. Việc sử dụng tư liệu từ trang web cần kèm theo liên kết đến trang teletrade.vn. Việc tự động thu thập số liệu cũng như thông tin từ trang web TeleTrade đều không được phép.
Xin vui lòng liên hệ với pr@teletrade.global nếu có câu hỏi.


