- Phân tích
- Tin tức và các công cụ
- Tin tức thị trường
- EUR/GBP edges lower ahead of ECB decision
EUR/GBP edges lower ahead of ECB decision
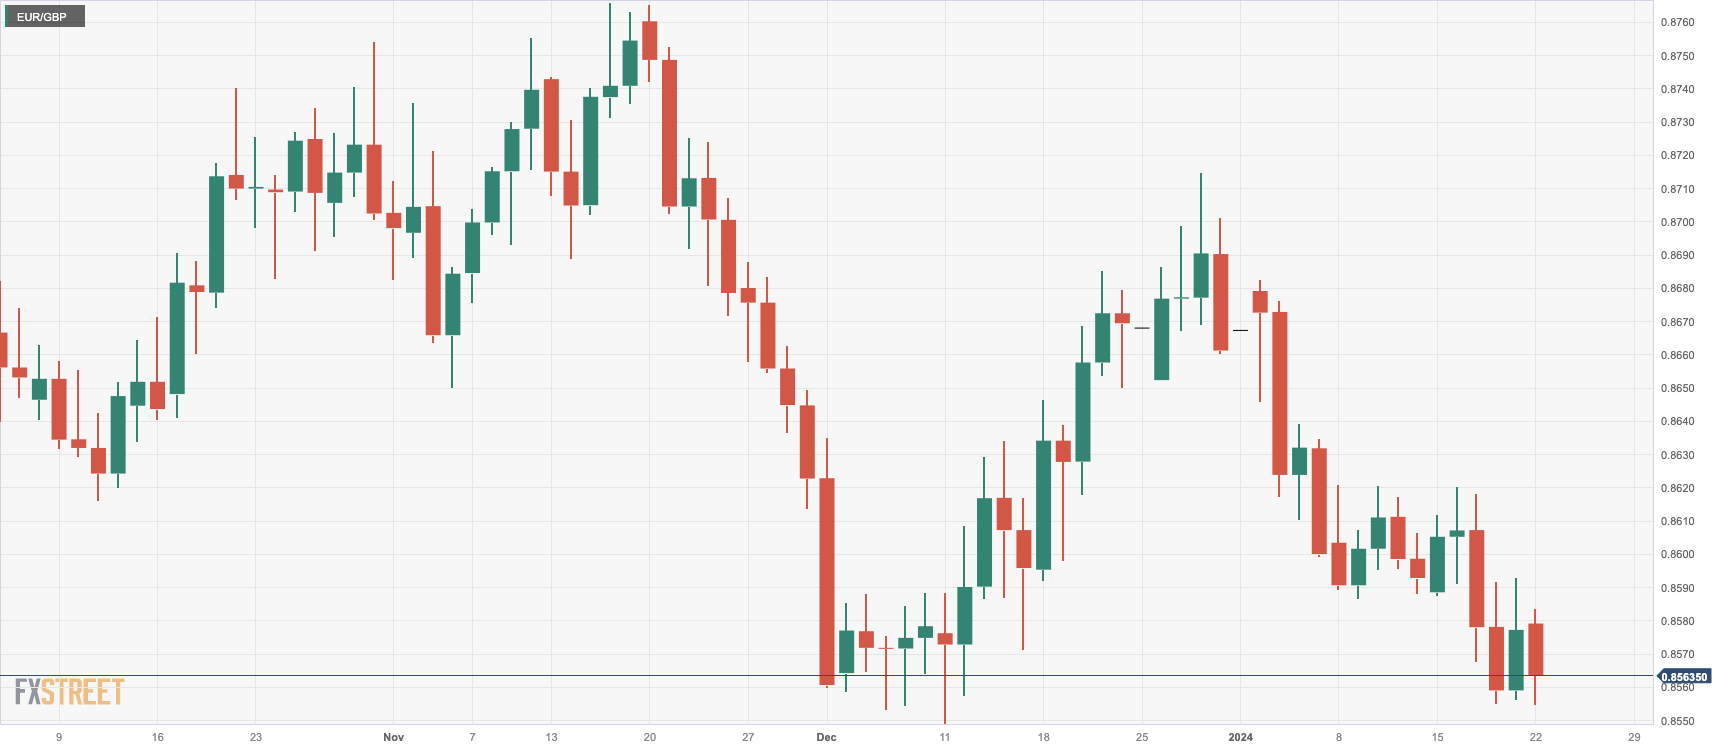
- The EUR/GBP records 0.20% losses standing at 0.8562.
- The ECB meets on Thursday, no policy change expected.
- Daily chart indicators present bearish sentiment: RSI indicates a negative slope in unfavorable territory with MACD's rising red bars hinting at a selling momentum.
On Monday's session, the EUR/GBP pair was seen trading at the 0.8562 level, depicting a 0.20% loss. The daily chart indicates a neutral to bearish outlook with bulls struggling to find solid ground. On the four-hour chart, indicators suggest a flattened momentum within negative territory, pointing to a domination of sellers over buyers. Overall, the Pound seems to have a slight command over the Euro mainly due to the British economy holding stronger than the majority of the EU countries and markets betting on a more dovish European Central Bank (ECB).
In that sense, markets are pricing in the European Central Bank to begin its rate cuts in Q2, with nearly 150 bp of total easing seen this year due to the latest round of weak economic data. On Thursday the ECB meets, were markets await the bank to hold its policy rate unchanged for the fourth consecutive time and investors will look for clues forward guidance, which may affect the crosses’s dynamics. As for the Bank of England (BoE), despite the relative robustness of the UK economy, market sentiments project the first rate cut in Q2, with approximately 125 bp of total rate cuts anticipated throughout the year.
EUR/GBP levels to watch
On the daily chart, the Relative Strength Index (RSI) is in a downward trajectory within the negative region, indicating an ongoing selling pressure. The positioning of the pair under the three key Simple Moving Averages (SMAs) - the 20, 100 and 200-day SMAs - corroborates this bearishness. This unfavorable climate is further solidified by the increasing red bars observed on the Moving Average Convergence Divergence (MACD) histogram.
Zooming into the four-hour chart, the indicators have stagnated within the negative arena, portraying a pause in the bearish momentum. The four-hour RSI is hovering flat in the negative space, yet the MACD histogram displays rising red bars. This suggests a lukewarm selling momentum, implying buyers yet have to exhibit concrete attempts to shift the scales.
EUR/GBP daily chart

© 2000-2026. Bản quyền Teletrade.
Trang web này được quản lý bởi Teletrade D.J. LLC 2351 LLC 2022 (Euro House, Richmond Hill Road, Kingstown, VC0100, St. Vincent and the Grenadines).
Thông tin trên trang web không phải là cơ sở để đưa ra quyết định đầu tư và chỉ được cung cấp cho mục đích làm quen.
Giao dịch trên thị trường tài chính (đặc biệt là giao dịch sử dụng các công cụ biên) mở ra những cơ hội lớn và tạo điều kiện cho các nhà đầu tư sẵn sàng mạo hiểm để thu lợi nhuận, tuy nhiên nó mang trong mình nguy cơ rủi ro khá cao. Chính vì vậy trước khi tiến hành giao dịch cần phải xem xét mọi mặt vấn đề chấp nhận tiến hành giao dịch cụ thể xét theo quan điểm của nguồn lực tài chính sẵn có và mức độ am hiểu thị trường tài chính.
Sử dụng thông tin: sử dụng toàn bộ hay riêng biệt các dữ liệu trên trang web của công ty TeleTrade như một nguồn cung cấp thông tin nhất định. Việc sử dụng tư liệu từ trang web cần kèm theo liên kết đến trang teletrade.vn. Việc tự động thu thập số liệu cũng như thông tin từ trang web TeleTrade đều không được phép.
Xin vui lòng liên hệ với pr@teletrade.global nếu có câu hỏi.


