- Phân tích
- Tin tức và các công cụ
- Tin tức thị trường
- Crude Oil continues recovery rebound, WTI reclaims $72.50
Crude Oil continues recovery rebound, WTI reclaims $72.50
- WTI edged back over $72.50 on Thursday as Crude Oil tries to recover more ground.
- Crude markets remain steeply off recent highs.
- Investors remain skeptical that production caps will undercut global demand declines.
West Texas Intermediate (WTI) has recovered additional ground on Thursday, extending a rebound sparked by a dovish pivot from the US Federal Reserve (Fed) on Wednesday that saw a broad-base market sentiment recovery, kicking off recovery rallies in the majority of asset classes and forcing the US Dollar (USD) into fresh lows.
A declining US Dollar, in tandem with rising market sentiment on the possibility of rate cuts from the Federal Reserve coming sooner rather than later, is helping to prop up Crude Oil prices heading into the tail end of the trading week.
With the Fed adjusting their dot plot of interest rate expectations to include several rate cuts in 2024 broader market sentiment is on the high side, dragging WTI back above the $70.00 handle, but bearish pressure has been building into Crude Oil markets since falling from late September’s highs just below the $94.00 handle.
The Organization for the Petroleum Exporting Countries (OPEC) has affirmed its dedication to extreme production cuts, at least at the administrative level; in practice, the oil cartel has no structural policy tools to force member states to adhere to production caps, nor is there any punishment for OPEC members that violate exporting quotas.
Energy markets remain skeptical that OPEC’s headline production cuts will be able to undercut declining global crude demand, especially as demand slumps in key oil-using markets such as China. Despite this, Energy Information Administration (EIA) barrel counts unexpectedly declined this week, with a 4.259 million barrel drawdown in US Crude Oil reserves for the week ended December 8. Markets had initially expected a slight decline of only 650K barrels, and the overhead declines add to the previous week’s drawdown of 4.632 million crude barrels.
WTI Technical Outlook
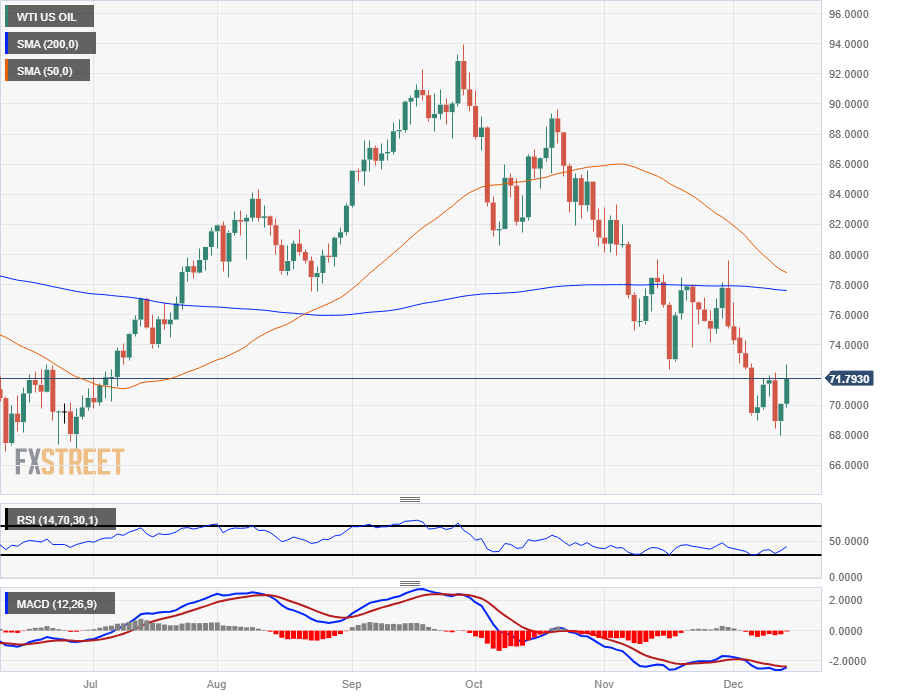
WTI’s rebound comes at the tail end of a very bearish run down the charts, and US Crude Oil is down nearly 24% from late September’s peak of $93.98. WTI has closed in the red for seven straight weeks.
Despite the near-term technical recovery, WTI remains deep inside bear country with the 200-day Simple Moving Average (SMA) high above current price action near the $78.00 handle. The 50-day SMA is firmly bearish, and is accelerating into a downside cross of the 200-day SMA which would provide stiff technical resistance for any bullish extensions beyond the $74.00 level.
WTI Daily Chart

WTI Technical Levels
© 2000-2026. Bản quyền Teletrade.
Trang web này được quản lý bởi Teletrade D.J. LLC 2351 LLC 2022 (Euro House, Richmond Hill Road, Kingstown, VC0100, St. Vincent and the Grenadines).
Thông tin trên trang web không phải là cơ sở để đưa ra quyết định đầu tư và chỉ được cung cấp cho mục đích làm quen.
Giao dịch trên thị trường tài chính (đặc biệt là giao dịch sử dụng các công cụ biên) mở ra những cơ hội lớn và tạo điều kiện cho các nhà đầu tư sẵn sàng mạo hiểm để thu lợi nhuận, tuy nhiên nó mang trong mình nguy cơ rủi ro khá cao. Chính vì vậy trước khi tiến hành giao dịch cần phải xem xét mọi mặt vấn đề chấp nhận tiến hành giao dịch cụ thể xét theo quan điểm của nguồn lực tài chính sẵn có và mức độ am hiểu thị trường tài chính.
Sử dụng thông tin: sử dụng toàn bộ hay riêng biệt các dữ liệu trên trang web của công ty TeleTrade như một nguồn cung cấp thông tin nhất định. Việc sử dụng tư liệu từ trang web cần kèm theo liên kết đến trang teletrade.vn. Việc tự động thu thập số liệu cũng như thông tin từ trang web TeleTrade đều không được phép.
Xin vui lòng liên hệ với pr@teletrade.global nếu có câu hỏi.


