- Аналітика
- Новини та інструменти
- Новини ринків
Новини ринків
- USD/CHF remains flat around 0.8832 ahead of the US key event.
- US PCE inflation matches expectations; Initial Jobless Claims are lower than expected.
- The Swiss Real Retail Sales YoY for July came in at -2.2% versus 1.8% prior.
- Market players await the Swiss Consumer Price Index (CPI), US Nonfarm Payrolls.
The USD/CHF pair oscillates around the 0.8821-0.8836 region in a narrow trading band during the early Asian trading hours on Friday. Markets turn cautious ahead of the key data from the US and Switzerland. At the time of writing, the USD/CHF is trading at 0.8833, unchanged on the day.
Meanwhile, the US Dollar Index (DXY), a measure of the value of USD against six other major currencies, holds above 103.60 and remains on the way to snapping a six-week uptrend. US Treasury yields falls again on Friday. The 10-year yield rebounds to 4.10% after reaching a two-week low of 4.07%
Data released on Thursday showed that the US Core Personal Consumption Expenditure Price Index, the Federal Reserve's preferred gauge of inflation, rose to 4.2% in July from 4.1% in the previous and in line with expectations. Additionally, Initial Claims fell to 228,000, falling short of the market consensus of 232,000. The figure marked the lowest level in four weeks while Continuing Claims reached their highest level in six weeks. The mixed economic data from the US challenged the Fed to keep rates higher for longer as Fed Chairman Jerome Powell said at the Jackson Hole Symposium that a possible further rate rise would be dependent on incoming data.
On the other hand, the Swiss Federal Statistical Office reported on Thursday that the nation's Real Retail Sales YoY for July came in at -2.2% versus 1.8% prior. Earlier this week, the KOF Leading Indicator for August came in at 91.1 versus 92.01 prior and below the market consensus of 91.5. Finally, the ZEW Survey of Expectation for the same period fell to -38.6 from -32.6 the previous month and missed the expectation of -31.3.
The renewed trade war tension between the US and China and the fear of China’s debt crisis might benefit the traditional safe-haven Swiss Franc. On Wednesday, Country Garden, the largest private real estate developer in China, issued a default warning if its financial performance continues to deteriorate.
Looking ahead, traders will take cues from the Swiss Consumer Price Index (CPI) for August ahead of the closely watched event, US Nonfarm Payrolls. The US economy is expected to create 170K jobs in August. Also, the Unemployment Rate and ISM Manufacturing PMI will be released later on Friday. These figures could give a clear direction for the USD/CHF pair.
US inflation expectations can be held responsible for the market’s latest dislike for the US Dollar, after fueling the Greenback to snap a three-day losing streak the previous day.
That said, the inflation expectations, as per the 10-year and 5-year breakeven inflation rates from the St. Louis Federal Reserve (FRED) data, remain on the back foot for the fourth consecutive day while declining to the lowest level since July 19.
With this, the 5-year and 10-year inflation expectations per the aforementioned calculations fall to 2.15% and 2.24% at the latest.
It’s worth observing that the Fed officials’ inability to please markets with a major hawkish surprise at Jackson Hole joins the recently mixed US data to raise concerns about the Fed’s policy pivot. However, today’s US employment data for August will be crucial for immediate directions.
The market forecasts 170K figures of the Nonfarm Payrolls (NFP) versus the previously downbeat outcomes of the JOLTS Job Openings, ADP Employment Change and higher prints of the US Continuing Jobless Claims. Additionally, the three-month average of the US NFP halves to 218K versus a year earlier.
Should the scheduled US employment numbers portray tighter job markets, the Fed officials may defend their bias conveying the “higher for longer” rates, which in turn can allow the US Dollar to pare the weekly losses and weigh on the riskier assets.
Also read: Nonfarm Payrolls Preview: Four scenarios for a jobs report set to test US economic resilience
- Silver Price remains sidelined after confirming one-week-old rising wedge bearish chart pattern.
- Cautious mood ahead of US NFP prods XAG/USD bears on their way to key SMA supports.
- Multiple upside hurdles to test Silver below $25.30 key resistance.
Silver Price (XAG/USD) remains on the back foot around $24.40 despite lacking downside momentum amid the early hours of Friday’s trading. In doing so, the bright metal portrays the market’s cautious mood ahead of the US employment report for August, including the headline Nonfarm Payrolls (NFP).
However, bearish MACD signals and the downbeat RSI (14) line, not overbought, join the confirmation of a one-week-old rising wedge bearish chart formation to keep the XAG/USD sellers hopeful.
With this, the Silver sellers appear well set to drop towards the 50-SMA level of around $24.15, a break of which could direct the XAG/USD toward the 200-SMA support of around $23.85.
It’s worth noting that the XAG/USD weakness past $23.85 will highlight the 38.2% Fibonacci retracement of the July-August downside, near $23.40, ahead of directing the sellers toward the mid-August swing high of around $23.00.
On the flip side, the Silver Price remains on the back foot unless defying the rising wedge chart formation, by crossing the stated wedge’s upper line near $25.05.
Even so, the tops marked during late July and the previous monthly high, respectively near $25.15 and $25.30, will act as the final defense of the Silver bears.
Silver Price: Four-hour chart
-01092023-638291216111641186.png)
Trend: Further downside expected
“More savings accounts are offering higher interest rates as a more competitive market emerges, though regulatory intervention may still be needed to ensure customers are getting fair value,” said the UK’s Financial Conduct Authority (FCA) early Friday morning in Asia per Reuters.
The UK FCA takes steps to make sure that British savings bank account holders get the benefits of higher rates as fast as they’re charged with higher costs while taking a loan. The issue gained the attention of the British regulator after some of the banks appeared lacking to pass on the interest rate hikes to the savings bank accounts per the news.
Reuters also cites the UK FCA order to the nine banks, including HSBC, to ensure the savings account holders got the benefits of higher rates in July.
Market implications
The news may help the GBP/USD pair to regain upside traction, after snapping a three-day winning streak, as it teases the Bank of England (BoE) hawks. However, the GBP/USD pair remains defensive near 1.2675 by the press time.
Also read: GBP/USD Price Analysis: 50-SMA defends Cable bulls below 1.2700, US NFP, BOE’s Pill eyed
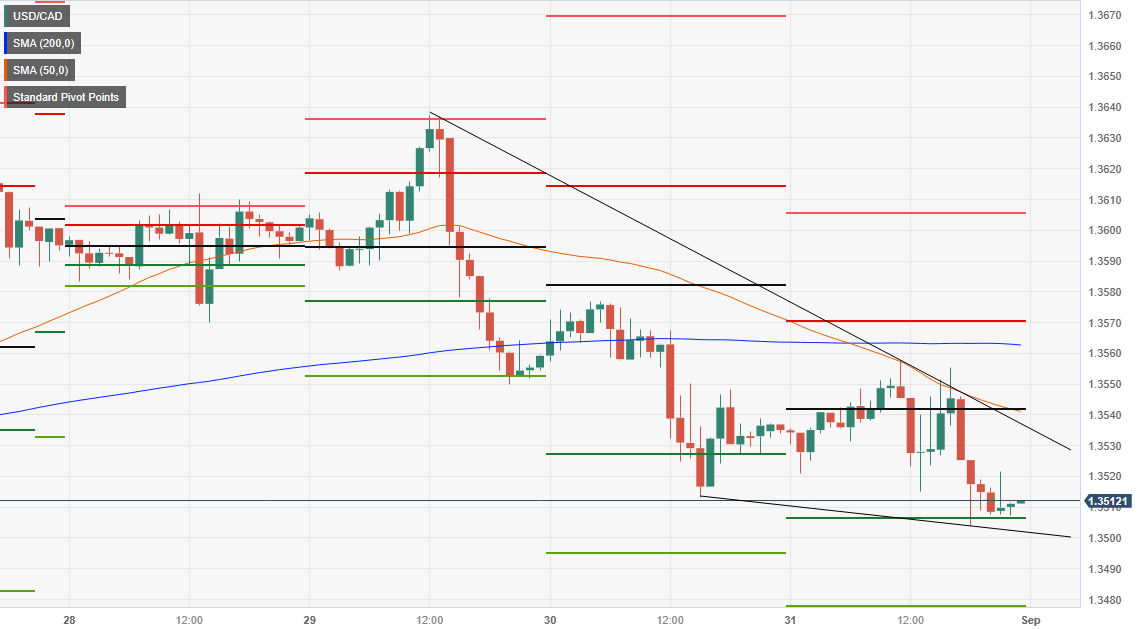
- USD/CAD trades nearly flat at 1.3510 as the Asian session begins, despite the US Dollar gaining against most G10 currencies.
- Falling US Treasury bond yields and a surge in oil prices support the Canadian Dollar.
- From a technical standpoint, the pair remains neutral to upward biased but is on the brink of breaking its uptrend, putting the 200-DMA at 1.3461 in focus.
The Canadian Dollar (CAD) remains in charge against the US Dollar (USD) even though the latter appreciated against most G10 FX currencies across the board. However, falling US Treasury bond yields and a jump in oil prices benefitted the CAD. Hence, the USD/CAD is trading at 1.3510, almost flat as the Asian session commences.
USD/CAD Price Analysis: Technical outlook
From a daily chart perspective, the USD/CAD remains neutral to upward biased, as the pair is still above the latest higher low achieved on August 21 at 1.3496, but at the brisk of breaking an uptrend market structure, that would expose the 200-day Moving Average (DMA) at 1.3461. Nevertheless, sellers must achieve a daily close below 1.3496 to remain hopeful of achieving lower lows, as the 50-DMA slope is trending up.
From an intraday standpoint, the pair broke below the August 24 daily ow of 1.3509, putting in play the 1.3500 figure. But one of the latest three candlesticks of August 31 price action drawing a larger wick on the bottom of the body suggests buyers entering the market around the 1.3500 area. Nevertheless, the USD/CAD is downward biased. First support emerges at 1.350, followed by the S1 daily pivot at 1.3488. A breach of the latter will expose the S2 pivot point at 1.3469 before diving to 1.3450. On the flip side, the first resistance would be the daily pivot point at 1.3523, followed by the 50-hour Moving Average (HMA) at 1.3540, before reaching the R1 pivot.
USD/CAD Price Action – Hourly chart
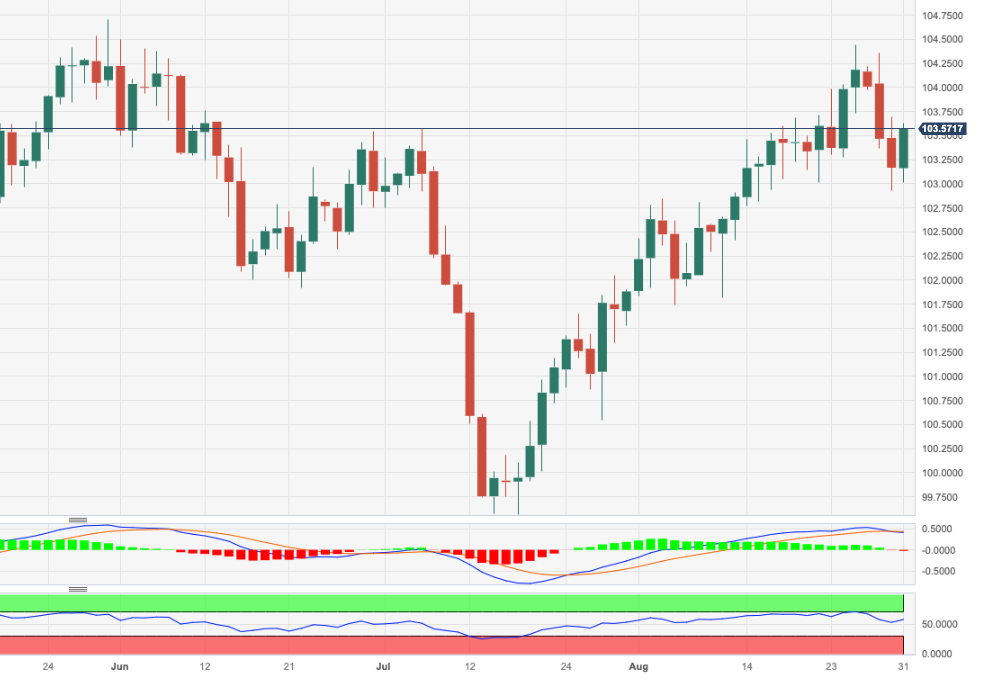
- US Dollar Index treads water after posting the biggest daily gain in a week while snapping three-day downtrend.
- US data, pre-NFP consolidation allows DXY traders to pare weekly losses.
- US employment numbers may help Fed hawks to defend “higher for longer” rates and propel Greenback.
US Dollar Index (DXY) struggles to defend the previous day’s rebound from the 200-DMA while making rounds to 103.60 amid Friday’s Asian session. In doing so, the Greenback’s gauge versus the six major currencies portrays the trader’s cautious mood ahead of today’s US monthly employment report, comprising the headline Nonfarm Payrolls (NFP), for August.
After witnessing downbeat prints of consumer confidence and employment clues, the US economic calendar flashed slightly better data on Thursday. The same joins the pre-data consolidation to help the DXY pare weekly losses, the first in seven, as market players await today’s key US jobs report.
It’s worth noting that the Fed’s preferred inflation gauge, namely the US Core Personal Consumption Expenditure (PCE) Price Index for August, matched market forecasts of 4.2% YoY and 0.2% MoM versus 4.1% and 0.2% respectively priors. Further, the Initial Jobless Claims dropped to 228K from 232K prior (revised) versus 235K market forecasts while the Chicago Purchasing Managers’ Index rose to 48.7 for August compared to 44.1 expected and 42.8 previous readings. Additionally, Personal Spending rose past the 0.6% expected and previous readings to 0.8% for July whereas Personal Income eased to 0.2% for the said month, from 0.3% market forecast and prior.
Apart from the data, Atlanta Fed President Bostic’s defense of keeping rates high also underpins the DXY rebound.
Elsewhere, market players seek more clues to defend the DXY bulls, which in turn highlights today’s US employment report and the risk catalysts comprising China PMIs and stimulus news. That said, the market forecasts 170K figures of the Nonfarm Payrolls (NFP) versus the previously upbeat outcomes of the JOLTS Job Openings, ADP Employment Change and higher prints of the US Continuing Jobless Claims. Additionally, the three-month average of the US NFP halves to 218K versus a year earlier.
Should the scheduled US jobs report print softer figures, the Fed may show readiness to keep the rates high despite turning down the rate hikes. With this, the US Dollar Index (DXY) may witness a lack of buying.
Technical Analysis
The US Dollar Index (DXY) recovers from the 200-DMA, around 103.05 by the press time, but the recovery needs validation from a six-week-old previous support line, now resistance around 104.00.
- NZD/USD struggles to find direction ahead of the key US data.
- US PCE inflation matches expectations; Initial Jobless Claims are lower than expected.
- New Zealand’s consumer confidence rose to 85 in August from 83.7.
- Investors will monitor the US ISM Manufacturing PMI, Nonfarm Payrolls, Unemployment Rate.
The NZD/USD pair trades sideways below the 0.6000 barrier during the early Asian session on Friday. The US Dollar Index posts mixed results following the US economic data. The pair currently trades near 0.5965, down 0.02% on the day. Market participants await the highly anticipated US Nonfarm Payrolls due later in the American session. The figure is expected to show a 170K rise in jobs.
On Thursday, the Federal Reserve's preferred gauge of inflation, the US Core Personal Consumption Expenditure Price Index, rose to 4.2% in July from 4.1% prior, in line with expectations. Additionally, Initial Claims fell to 228,000, falling short of the forecast 232,000 and marking the lowest number in four weeks. Continuing Claims, on the other hand, reached their highest level in six weeks.
On the Kiwi front, the ANZ – Roy Morgan Consumer Confidence for August showed that consumer confidence in New Zealand improved marginally to 85 in August from 83.7 but remained at subdued levels. However, there was more optimism among consumers regarding whether it was a good time to buy household items.
Apart from the data, the chief economist of the Reserve Bank of New Zealand (RBNZ) stated last week that policymakers would cut the OCR earlier than signaled if China experienced a more significant slowdown than the RBNZ anticipates. Investors will keep an eye on the Chinese Caixin Manufacturing PMI due later in the day. The weaker-than-expected result might exert pressure on the China-proxy Kiwi and act as a headwind for the NZD/USD pair.
Moving on, market players will closely watch the US ISM Manufacturing PMI. The figure is expected to improve from 46.4 to 47. The attention will then shift to Nonfarm Payrolls (NFP), followed by the Unemployment Rate. Traders will take cues from the data and find trading opportunities around the NZD/USD pair.
- GBP/USD picks up bids to pare the first daily loss in four, bracing for the weekly gain.
- Cable bounces off 50-SMA after retreating from five-week-old resistance line.
- MACD signals, sustained trading below the key resistance line, 200-SMA keep Pound Sterling sellers hopeful.
- Multiple supports to test bears while buyers can cheer 1.2760 breakout.
GBP/USD portrays the pre-NFP consolidation while bouncing off 50-SMA amid the early hours of Friday’s trading, following the first daily loss in four. That said, the Cable pair picks up bids to 1.2675 by the press time while bracing for the weekly gains.
Despite the latest rebound, the GBP/USD pair remains on the seller’s radar due to the quote’s multiple failures to cross a five-week-long descending resistance line and sustained trading below the 200-SMA. Adding strength to the downside bias is the looming bear cross on the MACD.
With this, the Pound Sterling is likely to portray another attempt to break the 50-SMA support of 1.2660.
Following that, the GBP/USD bears may aim for a slightly descending support line stretched from early August and the previous monthly low, respectively near 1.2610 and 1.2550.
Meanwhile, a downward-sloping resistance line from July 27, near 1.2720, restricts the immediate upside of the Cable pair ahead of the 200-SMA surrounding 1.2760.
In a case where the Pound Sterling remains firmer past 1.2760, the buyers will aim for the previous monthly high of around 1.2830.
Apart from the technical details, the final readings of the UK S&P Global Manufacturing PMI, the US employment report and the ISM Manufacturing PMI for August will also be important to aptly forecast the GBP/USD moves. Also, a speech from the Bank of England (BoE) policymaker Huw Pill will offer additional directions to the pair traders.
GBP/USD: Four-hour chart
Trend: Pullback expected
- US PCE inflation aligns with estimates but shows an uptick, while Initial Jobless Claims come in lower than expected, adding complexity to the Fed’s rate decision.
- ECB board member Isabel Schnabel reignites stagflation fears but doesn’t rule out more rate hikes; EU inflation data mixed, with core HICP falling to 5.3% YoY.
- Market participants now focus on Friday’s US Nonfarm Payrolls report and ISM Manufacturing PMI, which could provide further direction for the EUR/USD pair.
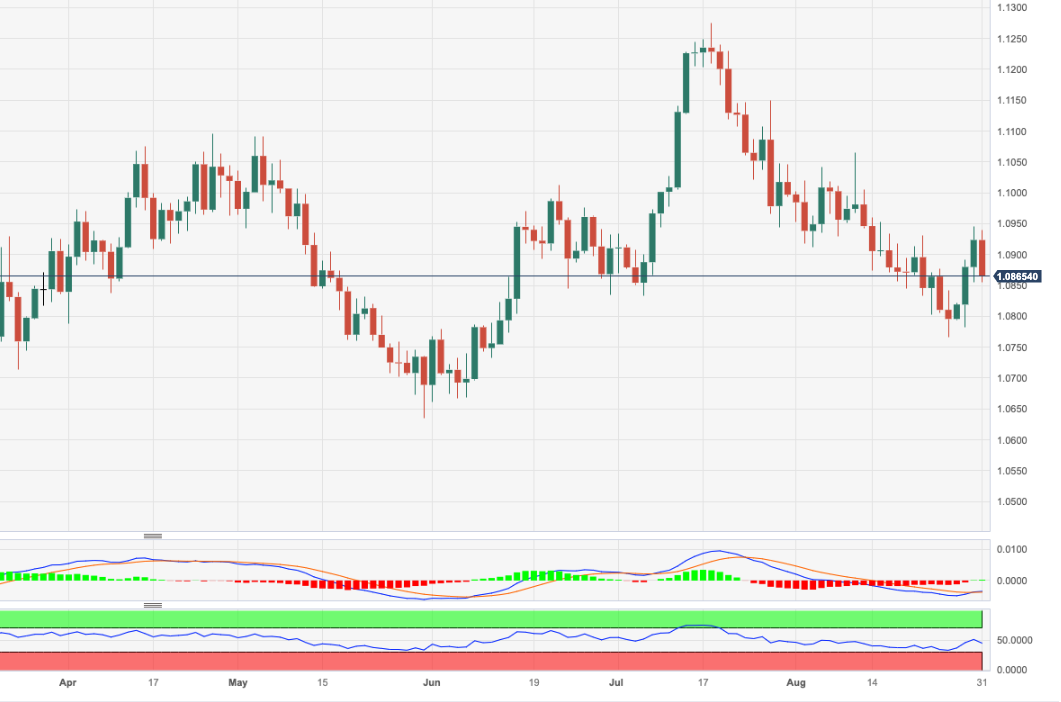
The Euro (EUR) reversed Wednesday’s gains vs. the US Dollar (USD), as the currency pair tanked, despite investors trimming the chances for a US Federal Reserve rate hike in September on a session that witnessed global bond yields falling. Hence, the EUR/USD is trading at 1.0843 after reaching a daily high of 1.0939, down 0.735.
Euro gave back its gains amid mixed EU inflation, ahead of US NFP report
After Wall Street closed, the EUR/USD finished the session in the mid-range of the week, with traders eyeing a drop toward the 200-day Moving Average (DMA) at 1.0815. All that is propelled by data from the United States (US) and the Eurozone (EU), as both economic blocs remain on a tightening cycle.
Beginning with the US, inflation data revealed by the Commerce Department showed the Fed’s favorite inflation gauge, the PCE, came at 3.3% YoY, as expected, but above June’s data at 3%. Core PCE followed the same path of aligning with estimates but increased from 4.1% to 4.2% YoY. Even though the advancement in inflation is not to worry about, solid labor market data justifies the Fed’s need to keep rates higher for longer.
Initial Jobless Claims for the last week came below estimates of 235K, at 229K, contrary to earlier data revealed during the week, namely job openings and the ADP National Employment report, that underscored the labor market was losing traction.
The EU’s agenda showed that inflation in the whole bloc was mixed, while a European Central Bank (ECB) board member, Isabel Schnabel, reignited stagflation fears after acknowledging growth headwinds but didn’t discount the need for more rate hikes. Data from the EU showed inflation remained unchanged at 5.3% YoY in August, but excluding volatile items, core HICP was 5.3%, below July’s 5.5%.
That opened the door for the ECB to take an approach similar to the Fed, of skipping rate hikes, as some voices had taken a cautious approach. Traders should be aware that before Christine Lagarde’s speech at Jackson Hole, ECB sources mentioned that hawks in the committee eased its previous posture.
All that said, market participants’ focus shifts to tomorrow’s US Nonfarm Payrolls report, which is expected to show the US economy added 170K jobs. The Unemployment rate and Average Hourly Earnings are expected at 3.5% and 4.4%, respectively. After that report, the ISM Manufacturing PMI will update the industry status in the world’s largest economy.
EUR/USD Price Analysis: Technical outlook
The EUR/USD is set to extend its losses. Price action in the last couple of days formed a ‘bearish engulfing’ candlestick pattern, warranting further downside. Still, the major will face strong support at the 200-DMA at 1.0815, the 1.0800 figure, and a five-month-old support trendline at around 1.0760/85. If those areas are cleared, sellers will set their eyes on the May 31 low of 1.0635.
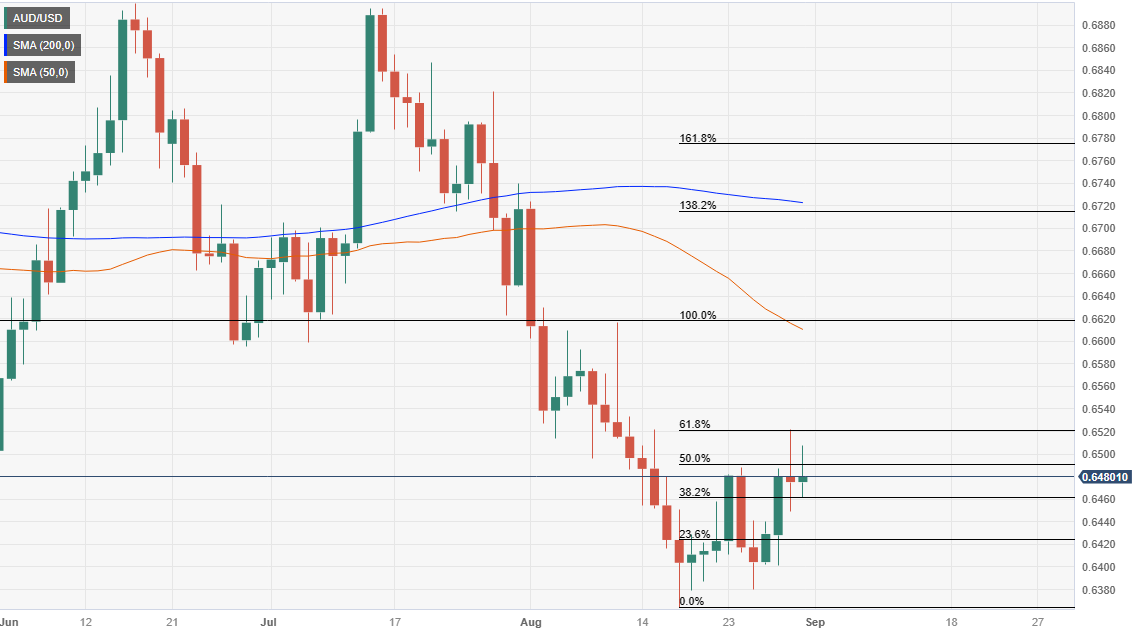
- AUD/USD struggles on the way to posting the first weekly gain in seven.
- Mixed China, Australia data joined cautious mood to prod the bulls despite keeping them in the driver’s seat.
- US inflation, activity and employment clues turn down hawkish concerns but may allow Fed to keep rates higher for longer.
- China Caixin Manufacturing PMI will precede US employment data for August, ISM Manufacturing PMI to provide fresh impulse.
AUD/USD portrays the typical pre-data anxiety as bulls take a breather around 0.6480-85 while marking the repeated attempts to stay beyond the 0.6500 as markets await the US employment report for August. Apart from the US Nonfarm Payrolls (NFP), the presence of China’s Caixin Manufacturing PMI and US ISM Manufacturing PMI also pushes the Aussie pair traders toward being cautious. Furthermore, Australia’s S&P Global Manufacturing PMI for August, expected to remain unchanged at 49.4 also prods the pair buyers.
That said, the Aussie pair remained on the front foot the previous day despite lacking momentum as mixed data from China, Australia and the US failed to offer any clear directions to the traders. Also, geopolitical concerns about the biggest customer China and doubts about its stimulus tested the AUD/USD bulls even as the broadly softer US Dollar allowed the pair buyers to keep the reins.
On Thursday, the US Dollar Index (DXY) recovered from the 200-DMA to print the first daily gain in four while ending the trading day around 103.65. Even so, the Greenback’s gauge versus the six major currencies remains on the way to snapping a six-week uptrend as the latest round of data challenges the Federal Reserve (Fed) hawks.
Among them, the Fed’s preferred inflation gauge, namely the US Core Personal Consumption Expenditure (PCE) Price Index for August, matched market forecasts of 4.2% YoY and 0.2% MoM versus 4.1% and 0.2% respectively priors. Further, the Initial Jobless Claims dropped to 228K from 232K prior (revised) versus 235K market forecasts while the Chicago Purchasing Managers’ Index rose to 48.7 for August compared to 44.1 expected and 42.8 previous readings. Additionally, Personal Spending rose past the 0.6% expected and previous readings to 0.8% for July whereas Personal Income eased to 0.2% for the said month, from 0.3% market forecast and prior.
At home, China’s official NBS Manufacturing PMI for August rose to 49.7 versus 49.4 expected and 49.3 previous readings whereas the Non-Manufacturing PMI came in as 51.0 compared to 51.5 prior readouts and market forecasts of 51.1. Furthermore, Australia’s Private Capital Expenditure and Private Sector Credit numbers failed to impress the Aussie bulls.
Elsewhere, the US-China trade war continues amid Beijing’s dislike of Western help to Taiwan. However, the fears of losing economic recovery from COVID push the policymakers to announce multiple stimulus. On Thursday, the Dragon Nation announced relief on the down payment of first and second home buyers to help the housing market. Previously, the bank cut many rates to infuse liquidity into the nation. However, the market’s doubts about the credibility of such measures make them less important for the AUD/USD pair.
Moving on, PMIs from Australia and China may entertain the AUD/USD pair traders and can allow the Aussie to edge higher. However, more important will be the US data considering the fears of Fed policy pivot, which if confirmed by softer statistics, can propel the pair prices.
Technical analysis
Despite the latest inaction around 0.6500, the AUD/USD pair’s successful breakout of a seven-week-old descending trend line and the 21-DMA, respectively near 0.6470 and 0.6445, keeps the buyers hopeful.
- XAU/USD traded with mild losses on Thursday, near the $1,940 area.
- Lower US yields limit the yellow metal´s downside potential.
- Strong NFP's on Friday may give US yields a boost.
On Thursday, Gold price slightly decreased as the recovery of the USD limited the upside potential. The Greenback found demand as people filing first-time claims for state unemployment insurance decreased at the end of August, while the Personal Consumption Expenditures inflation figures increased, just as expected. Markets are cautious ahead of critical Nonfarm Payrolls (NFPs) from August that will be released on Friday.
From the data side, the US Department of Labor released robust figures for Initial Jobless Claims from August that came in at 228,000, versus the expected 235,000 and the previous reading of 232,000, while the Core Personal Consumption Expenditures (PCE)(YoY) from July came as expected 4.2% but slightly lower than the previous 4.1%.
That said, the US dollar, measured by the DXY index, showed more than 0.40% of daily gains while the US treasury bond yields, often seen as the opportunity cost of holding non-yielding metals, decreased. The 2,5 and 10-year yields declined to 4.86%, 4.24% and 4.08%, respectively, limiting the XAU/USD downside. The focus now shifts to the August Nonfarm Payrolls, where investors will watch for further clues about the next interest rate decisions by the Federal Reserve (Fed). As for now, the CME FedWatch Tool suggests that investors expect the Fed won't hike on September 20, while the odds of 25 basis points (bps) stand 40% on November 1 and December 13. It's worth highlighting that Chair Powell from the Fed stated that the bank is expecting the US labour market to soften and that ongoing decisions will be "carefully" decided, so the outcomes of the NFPs will likely dictate the pace of the mentioned expectations and the US Treasury yields on Friday.
XAU/USD Levels to watch
According to the daily chart, the XAU/USD trades neutral to bearish in the short term, near the $1,940 area. The Relative Strength Index (RSI) trades flat, while the Moving Average Convergence Divergence (MACD) continues to print strong green bars, suggesting that the buyers are resilient. On the general outlook, the XAU/USD trades above the 20-day and 200-day Simple Moving Average (SMA) and is approaching the 100-day SMA, which indicates that the bulls are comfortably are command.
Resistance levels: $1,945, $1,954 (100-day SMA), $1,970
Support levels: $1,935, $1,915 (20 and 200-day convergence), $1,900.
XAU/USD Daily chart
-638291158495413289.png)
- EUR/GBP bulls failed to defend the 20-day SMA, and the cross fell near 0.8555.
- So far, the pair lost 0.50% since Wednesday.
The daily chart suggests the EUR/GBP has a bearish technical bias for the short term, with technical indicators suggesting that the bears have taken the lead for the short term. The Euro traded weak against most of it rivals on Wednesday, which contributed to the cross failing to consolidate above the 20-day Simple Moving Average (SMA) of 0.8580.
The daily Relative Strength Index (RSI) also exhibits a southward slope below its midline, emphasising the presence of intense selling pressure. At the same time, the Moving Average Convergence Divergence (MACD), with its red bars, highlights the strengthening bearish momentum for the EUR/GBP. Similar signals are seen in the four-hour chart, with both indicators comfortably standing in negative territory.
On the bigger time frame, the pair is below the 20,100 and 200-day Simple Moving Averages (SMAs), suggesting that the buyers are struggling to overcome the overall bearish trend and the bears are still in charge.
Support levels: 0.8560, 0.8640, 0.8495.
Resistance levels: 0.8580 (20-day SMA), 0.8600, 0.8615.
EUR/GBP Daily Chart
-638291121743906111.png)
The final Manufacturing PMIs, including Japan, Australia, and China, are due. The key focus will be on the US Nonfarm Payrolls report. Additionally, the US ISM Manufacturing PMI will be released. Canada will also report GDP data.
Here is what you need to know on Friday, September 1:
On the first day of the new month, the primary focus will be on the US official employment report. Nonfarm Payrolls are expected to show a 170,000 increase in jobs, while the Unemployment Rate is anticipated to remain at 3.5%. Following the release of the NFP, the ISM Manufacturing PMI will be published, with an expected rebound from 46.4 to 47.
Nonfarm Payrolls Preview: Four scenarios for a jobs report set to test US economic resilience
Data released on Thursday showed that Initial Jobless Claims declined to 228,000, below the expected 232,000, marking the lowest reading in four weeks. However, Continuing Claims rose to the highest level in six weeks. The Core Personal Consumption Expenditure Price Index, a highlight of the day, showed an increase in the annual rate from 4.1% to 4.2% in July, in line with expectations. These figures did not have a significant impact on the market. The US Dollar made modest gains.
The US Dollar posted mixed results, as it rose against its main European rivals but weakened against the Yen. It ended the day flat against the AUD and NZD. The Canadian Dollar outperformed. The US Dollar Index (DXY) rebounded from 103.00 and moved back above 103.50.
US Treasury yields declined again but at a modest pace. The 10-year yield hit a fresh two-week low at 4.07% before rebounding to 4.11%.
The Euro lagged on Thursday, despite softer inflation figures and expectations regarding tightening from the European Central Bank (ECB). The upcoming ECB meeting appears to be a close call. EUR/USD failed to hold above 1.0900 and finished below 1.0850. EUR/GBP fell for the second consecutive day, approaching 0.8550.
"No room for complacency on inflation," said Bank of England Chief Economist Huw Pill. Depository rising against the Euro, the Pound lost ground versus the US Dollar, causing GBP/USD to slide below 1.2700. The pair offers no clear signs regarding its future direction.
USD/JPY reached weekly lows below 145.50, influenced by US yields remaining near recent lows and US stocks failing to sustain in positive territory.
On Thursday, USD/CHF experienced a significant surge, bouncing back from its weekly lows and rising above the 0.8800 level. On Friday, Switzerland will release the August Consumer Price Index (CPI).
USD/CAD declined for the fourth consecutive day and tested the 20-day Simple Moving Average around 1.3500. If consolidation occurs below that level, it could open the door for further losses. Canada is scheduled to report June and Q2 GDP growth figures.
Analysts at TD Securities on Canada GDP:
Q2 GDP growth is forecast to slow to 1.2%, giving the BoC more evidence that higher rates are working to slow demand. Household goods consumption will provide the main catalyst for the slowdown, while softer construction and net exports should also weigh on growth. We also look for GDP to decline by 0.1% in June, with new flash estimates pointing to another muted performance in July.
NZD/USD has been trading sideways below 0.6000 and the 20-day Simple Moving Average (SMA). The pair currently holds a neutral outlook in the short-term, with key support seen at 0.5900.
AUD/USD posted another daily close around 0.6470, slightly above the 20-day Simple Moving Average (SMA) for the second consecutive day. The pair currently maintains a modest bullish bias. However, to further solidify this outlook, it needs to hold above the key level of 0.6500.
US August Nonfarm Payrolls Preview: Analyzing Gold price's reaction to NFP surprises
Like this article? Help us with some feedback by answering this survey:
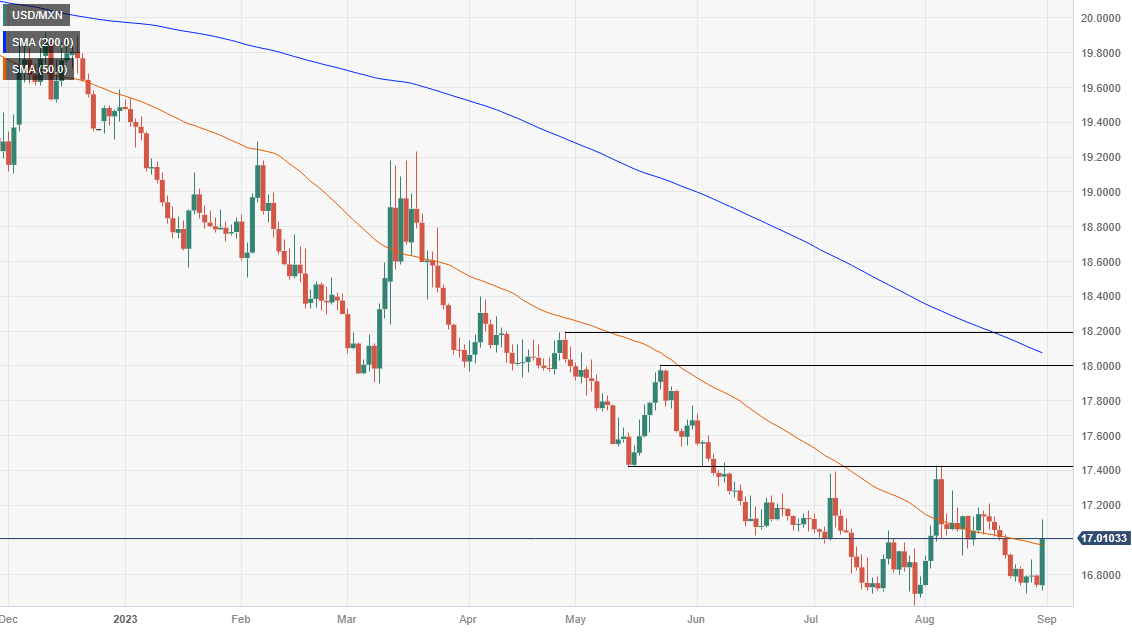
- USD/MXN trades around 17.00, up significantly from a daily low of 16.7083, as month-end flows and mixed US economic data favor the Greenback.
- Banxico announces the winding down of its hedge program settled in Mexican Pesos, adding fuel to the USD/MXN rally; traders eye a daily close above 17.0000.
- Banxico Governor Victoria Rodriguez Ceja rules out rate cuts and raises Mexico’s 2023 growth estimates, while Atlanta’s Fed President Raphael Bostic comments on US inflation policy.
The Mexican Peso (MXN) plunged more than 1.62% against the US Dollar (USD) late in the New York session due to month-end flows favoring the USD, mixed US data, as well as Bank of Mexico (Banxico) news. Therefore, the USD/MXN is trading at 17.0079 after hitting a daily low of 16.7083.
Mexican Peso drops over 1.60% vs. USD amid mixed US data, Banxico’s decision to wind down hedge program
Wall Street trades mixed as investors brace for August’s Nonfarm Payrolls report release. Analysts estimate the US economy added 170K jobs, 17K less than July’s data, while Average Hourly Earnings are foreseen at 4.4% YoY, unchanged. Later in the day, the Institute for Supply Management (ISM) will reveal the Manufacturing PMI, estimated at 47, above July 46.4, with most subcomponents seen increasing except for the employment index.
Aside from this, the US economic agenda on Thursday revealed the Federal Reserve’s preferred gauge for inflation, the Personal Consumption Expenditure (PCE), was 3.3% YoY, as expected, but exceeded June’s 3%. Core PCE, sought by Fed members as its focal point, is stickier than what policymakers were projecting, stands at 4.2% YoY as foreseen but above the previous month’s 4.1%. At the same time, the unemployment claims came below estimates of 235K, at 229K, contrary to earlier data revealed during the week, that underscored the labor market was losing traction.
That said, the USD/MXN edged higher, not only on US data. Banxico reported that it’s winding down its hedge program settled in Mexican Pesos.
The exotic pair rallied sharply and touched a daily high of 17.1114 before reversing its course below the 17.0000 mark. However, traders are eyeing a daily close above 17.0000, with USD/MXN buyers setting their sights on the 100-day Moving Average (DMA) at 17.3072.
In the meantime, the US Dollar Index, which measures the buck’s value against a basket of six currencies, rises by 0.41%, at 103.606. US Treasury bond yields and worldwide remain depressed as traders prepare for Friday’s Nonfarm Payrolls report.
Aside from this, Banxico’s Governor Victoria Rodriguez Ceja took off from the table rate cuts, as she added, “The outlook ahead continues to be complex and uncertain. It’s important to remember that disinflation periods are not linear.” Should be said, Banxico raised growth estimates for Mexico’s economy in 2023 to 3%, above the previous estimate of 2.3%.
On the central bank front, Atlanta’s Fed President Raphael Bostic said the policy was appropriately restrictive to bring inflation towards the US central bank’s 2% target over a “reasonable” period.
USD/MXN Price Analysis: Technical outlook
After the USD/MXN breached the 50 and 20-DMAs, the pair must clear resistance levels if buyers want to regain control. A daily close above 17.0000 could spur a rally toward the August 17 high of 17.2073. A breach of the latter would expose the May 17 daily low, at 17.4038, seen as a crucial level for traders. Once cleared, the USD/MXN would achieve successive series of higher highs and lows, opening the door to test the 200-(DMA) at 18.0671.
- GBP/USD retreated towards the 1.2670 area, below the 20-day SMA.
- Core PCE from July rose to 3.3%, matching expectations.
- Focus shifts to Friday’s NFPs, expected to have decelerated to 170k.
On Thursday, the GBP/USD lost ground as the USD traded strongly against most of its rivals after the release of July's Core Personal Consumption Expenditures (PCE) figures. The GBP’s losses are limited by tightening expectations on the Bank of England remaining high.
Core PCE rose in July, and Jobless Claims decelerated at the end of August
The Core PCE from July came in at 3.3%, up from its previous 3% and matched the consensus. In addition, the US reported that the Jobless Claims for the week ending in August 25 decelerated to 228,000, vs the 235,000 expected and the previous 232,000 and hinted at some resilience of the labour market after the US reported soft employment figures on Tuesday.
All eyes are now on the Nonfarm Payrolls (NFP) report from August from the US to be reported on Friday, which will likely cause market volatility as that report is the ultimate gauge of the US labour market situation. As the Federal Reserve (Fed) expects a cooling labour market, its outcome will help investors place bets on the next decisions.
On the GBP’s side, no relevant data was released, but its losses are limited by the tightening expectations of the Bank of England (BoE), and markets still bet on a terminal rate between 5.75%-6% for this cycle.
GBP/USD Levels to watch
Based on the daily chart, GBP/USD maintains a neutral technical perspective as indicators send mixed signals. The Relative Strength Index (RSI) displays a negative slope in the bullish territory, hinting at a potential shift in momentum, while the Moving Average Convergence (MACD) displays shorter red bars. Moreover, the pair is below the 20-day Simple Moving Average (SMA) but above the 100 and 200-day SMAs, indicating a favourable position for the bulls in the bigger picture.
Support levels: 1.2645 (100-day SMA), 1.2600, 1.2550.
Resistance levels: 1.2700 (20-day SMA), 1.2730, 1.2750.
GBP/USD Daily Chart
-638291050712846991.png)
- AUD/USD trades flat after falling to a daily low of 0.6461.
- US PCE inflation meets expectations at 3.3% YoY, while Initial Jobless Claims come below estimates, providing a brief boost to the Greenback.
- China’s mixed PMI data and Atlanta’s Fed President Raphael Bostic’s comments complicate the currency pair’s outlook.
The Australian Dollar (AUD) trims some of its losses against the US Dollar (USD) after falling to a daily low of 0.6461 ahead of the London fix, while the Greenback gives back some of its earlier gains. Traders booking profits ahead of market-moving data from the United States (US) is the main reason behind the recent US Dollar weakness. The AUD/USD is trading at 0.6474, flat in the day.
Aussie Dollar stages a comeback from daily lows, as traders book profits before August’s NFP
The financial markets remain quiet so far, past the mid-New York session. The economic agenda in the US spurred some volatility in the early trading session, courtesy of the latest inflation report. The Fed’s preferred gauge for inflation, the Personal Consumption Expenditure (PCE), was 3.3% YoY, as expected above June’s 3%. Regarding core PCE, sought by Fed officials, as its focal point is stickier than what policymakers were projecting, it stands at 4.s% YoY as foreseen but above the previous month’s 4.1%.
That data and the latest unemployment claims for the week ending August 26, coming below estimates of 235K, at 229K, sponsored a leg-up in the US Dollar. Initial Jobless Claims were the first positive news in the labor market during the week, as job openings plummeted, while private hiring disappointed analysts.
In the meantime, the US Dollar Index, which measures the buck’s value against a basket of six currencies, rises by 0.41%, at 103.606. US Treasury bond yields dropped
An upbeat market sentiment cushioned the AUD/USD as China revealed that Manufacturing PMIs improved but remained in contractionary territory. The non-manufacturing PMI deteriorateds from 51.5 to 51.0, below estimates of 51.1.
On the central bank front, Atlanta’s Fed President Raphael Bostic said the policy was appropriately restrictive to bring inflation towards the US central bank’s 2% target over a “reasonable” period.
In the week ahead, the Australian economic docket will feature S&P Global Manufacturing PMI for August. On the US front, the economic agenda is set to be busy, highlighted by the release of Nonfarm Payrolls and the ISM Manufacturing PMI, both of which are figures for August.
AUD/USD Price Analysis: Technical outlook
From a technical standpoint, the AUD/USD remains neutral to downward bias, as it remains below the 50 and 200-day Moving Averages (DMAs). Nevertheless, recent price action suggests the current leg-up could be viewed as a correction that pierced the 61.8% Fibonacci (Fib) retracement at 0.6520. That, alongside back-to-back spinning tops candlesticks, could pave the way for further losses, with traders eyeing the year-to-date (YTD) low of 0.6364
- WTI rose near the $82.90 zone, setting a three-day winning streak.
- Supply crunch fears amid the Hurracain Idalia tractions Oil prices.
- A stronger USD and the fragile Chinese situation may limit the upside.
The West Texas Intermediate (WTI) rose on Wednesday and threatened the $83.00 resistance.
What is driving the price upwards is Hurricane Idalia approaching the Gulf of Mexico, where the US concentrates 15% of its Oil production and supply crunch fears are increasing crude prices. In addition, the report of lower-than-expected US crude stockpiles released on Tuesday and the continuing manoeuvres by OPEC+ to extend its voluntary production cuts also contributes to the upside.
Moreover, China reported soft economic data during the Asian session, with the Non-Manufacturing PMI decreasing to 51.00, vs. the 51.1 expected, and the weak Chinese outlook may limit the black gold’s gains. In line with that, the USD is trading strong against most of its rivals, which could also hold back the WTI bulls.
WTI Levels to watch
Analysing the daily chart, it is apparent that the WTI has a neutral to bullish technical stance, with the bulls gradually recovering ground. The Relative Strength Index (RSI) has a positive slope above its midline, while the Moving Average Convergence (MACD) lays out decreasing red bars. Moreover, the pair is above the 20,100,200-day Simple Moving Average (SMA), implying that the bulls retain control on a broader scale.
Support levels: $81.25, $80.00, $78.50.
Resistance levels: $83.00, $83.50, $84.50.
WTI Daily Chart
-638290999752187056.png)
- The NZD/USD consolidates below the 20-day SMA of 0.5973 towards the 0.5950 area, tallying a second consecutive day of losses.
- Core PCE rose in July to 3.3%, as the markets expected.
- Fed’s tightening expectations eased somewhat, but they remain high—eyes on NFPs.
On Thursday, the NZD/USD saw losses, driven by robust economic data, making the USD recover against most of its rivals. During the week, the US economy has been sending mixed, and the markets eagerly await Friday’s Nonfarm Payrolls report to continue placing their bets on the next Federal Reserve’s (Fed) decisions.
The Core Personal Consumption Expenditures (PCE), one of the Fed’s preferred gauges for inflation, rose to 3.3% YoY in July, matching the market’s expectations. In addition, Initial Jobless Claims for the week ending on August 25 came in at 228,000, lower than the 235,000 expected and the previous figures of 232,000. Other data showed that the Chicago PMI increased to 48.7, bearing both the expected and previous figures.
Reacting to the strong PCE and Claims figures, the USD, measured by the DXY index, rose to 103.70, seeing more than 0.50% gains, while the US Treasury yields recovered somewhat, but they are still in decline.
Regarding the Federal Reserve (Fed) expectations, the World Interest Rates Probabilities tool suggests that markets the odds of a 25 bps increase stand at 50%, down from 70% on Tuesday, for the November meeting. However, those bets will likely change after Friday’s Nonfarm Payrolls release, as a hot reading may push investors to bet on higher chances of a hike.
NZD/USD Levels to watch
Upon analyzing the daily chart, a neutral to bearish trend becomes evident for NZD/USD, with the bears are seen gradually taking control. The Relative Strength Index (RSI) reveals a selling momentum with a downward slope below its middle point, while the Moving Average Convergence (MACD) lays out flat green bars. Plus, the pair is below the 20,100 and 200-day Simple Moving Averages (SMAs), indicating that the sellers dominate the broader perspective, and the buyers need to increase their efforts.
Support levels: 0.5940, 0.5930, 0.5900.
Resistance levels: 0.5973 (20-day SMA), 0.6000, 0.6030.
NZD/USD Daily Chart
-638290954544566729.png)
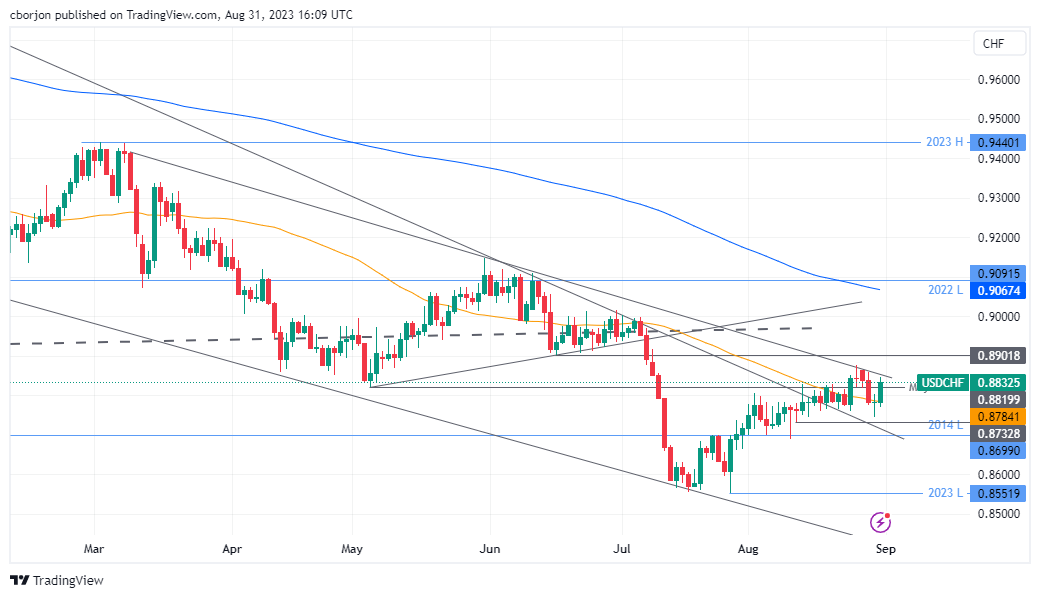
- USD/CHF trades at 0.8842, recovering from a daily low of 0.8771, as US PCE inflation aligns with forecasts and Swiss retail sales plunge -2.3% MoM.
- Mixed US employment data sets the stage for a crucial Nonfarm Payrolls report, while a ‘morning star’ chart pattern suggests a potential upside for USD/CHF.
- Swiss National Bank faces pressure as retail sales disappoint and inflation remains below target; money market futures give a 68% chance of rates staying unchanged.
The Swiss Franc (CHF) losses momentum vs. the US Dollar (USD) after Swiss economic data was weaker than expected, but US inflation remains steady although decelerated. That, alongside month-end flows, bolstered the US Dollar. Hence, the USD/CHF is trading at 0.8842 after hitting a daily low of 0.8771.
US Dollar gains ground as PCE inflation meets estimates and on month-end flows
The US economic docket revealed better-than-expected data on Thursday, contrary to Tuesday and Wednesday. A soft US jobs openings report, consumer confidence deteriorating, ADP Employment Change below estimates, and the GDP for the second quarter downward revised reignited recession fears. Nevertheless, never count out consumers, portraying America’s resilience.
The US Federal Reserve’s favorite inflation gauge, the Personal Consumption Expenditure (PCE), came as expected at 3.3%, a tick higher than June’s data, while on a monthly basis, it stood at 0.2% MoM. Core PCE, which excludes volatile items, rose by 4.2% YoY, aligned with the consensus, but above June 4.1%.
Initial Jobless Claims for the last week showed the labor market remains tight despite recent data linked to the jobs market depicting the opposite. People filling for unemployment aid rose by 228K, below estimates of 235K. Hence, mixed employment data makes tomorrow’s US Nonfarm Payrolls report for August crucial. That could clear some of the clouds, spurred by recent data.
That and month-end flows triggered a recovery, with the USD/CHF reclaiming the 0.88 figure, as the daily chart portrays a three-candle ‘morning star’ chart pattern, which, although it warrants further upside, a downslope resistance trendline looms, drawn from March 2023 highs.
In the meantime, the US Dollar Index, which measures the buck’s value against a basket of six currencies, climbs 0.51%, at 103.707.
On the Swiss front, retail sales for July were worse than estimated, plunging -2.3% MoM, below the upward revised June 1.5% gain. Even though the data portrays the increasing borrowing costs of the Swiss National Bank (SNB), it could also lead to a faster economic slowdown. USD/CHF traders’ focus shifts toward Switzerland’s inflation report, expected to drop to 1.5% in August after July’s 1.5% fall.
Despite Swiss inflation remaining below the SNB 2% target, the central bank foresees CPI to rise to 2.2% in 2023 and 2024. Due to its scarce monetary policy meetings, with the central bank hosting four, one in each quarter, the next reunion possesses additional importance. In the meantime, money market futures expect the SNB to keep rates unchanged, with odds at a 68% chance.
In the meantime, Atlanta’s Fed President Raphael Bostic said the policy was appropriately restrictive to bring inflation towards the US central bank’s 2% target over a “reasonable” period.
USD/CHF Price Analysis: Technical outlook
Given the fundamental backdrop, the USD/CHF is neutral-biased. But from a technical standpoint, the pair is neutral to downward. The next resistance emerged at around 0.8830/60, with a five-month-old downslope resistance trendline looming, which could pave the way for further upside if broken. The next resistance would emerge at 0.8900, followed by the 0.9000 figure. Conversely, downside risks emerge below 0.8771, followed by the current week’s low of 0.8745
- USD/JPY trades at 145.60, down 0.42%, as positive US data fails to lift the pair; DXY advances 0.51% to 103.718 but can't buoy USD/JPY.
- CME FedWatch Tool suggests the Fed will keep rates unchanged in September.
- Japan's retail sales exceed expectations with a 6.8% YoY increase, but a disappointing 2.4% contraction in Industrial Production adds to BoJ's policy dilemma.
The Greenback (USD) prints losses against the Japanese Yen (JPY) after reaching a daily high of 146.22, back below 146.00. Data from the United States (US) came better than expected but failed to bring the USD/JPY to life. The pair is trading at 145.60, down 0.42%
Greenback struggles to attain gains vs. the Yen despite better-than-expected data
A busy weekly economic agenda keeps most US Dollar pegged currency pairs trading volatile. Following Tuesday and Wednesday’s session, the buck was under a lot of stress. However, it regained some of its composure against most G10 FX currencies, except for the Japanese Yen.
The US Commerce Department revealed that the US Federal Reserve’s (Fed) preferred gauge for inflation, the Core Personal Consumption Expenditure (PCE), came as expected, climbing 4.2% YoY and 0.2% MoM as both figures aligned with the street’s forecasts. Regarding headline inflation, PCE remained unchanged at 3.3% YoY and 0.2%.
Other data showed that Initial Jobless Claims for the week ending August 26 came at 228K, below its forecast of 235K, according to the US Department of Labor. This, is contrary to the latest jobs data released, which pointed out the labor market was losing steam.
Today’s data added to past jobs releases in the US, alongside month-end flows, underpin the US Dollar (USD), which reached a bottom and is climbing according to the US Dollar Index (DXY). The DXY, an index that tracks a basket of six currencies’ performance vs. the USD, advances 0.51%, up at 103.718.
Even though economic growth has lost a step, it remains above the prior estimate of 2%, at 2.1% in the second quarter. That, alongside the US Commerce Department saying that consumer spending remains steady, jumping 0.8% in July, could keep the Fed in check. The CME FedWatch Tool, which depicts traders’ beliefs about increasing borrowing costs in the US, portrays that the Fed will keep rates unchanged at the September meeting. However, for November, the odds remain at 44.1% for a 25 bps increase.
In the meantime, Atlanta’s Fed President Raphael Bostic said the policy was appropriately restrictive to bring inflation towards the US central bank’s 2% target over a “reasonable” period.
On the Japanese front, Bank of Japan (BoJ) policymakers split between seeking a normalization of monetary policy and continued stimulus. BoJ’s board member Toyoaki Nakamura said it’s premature to tighten monetary conditions, as high import prices have driven inflation. He added that once the “deflationary mindset” is eradicated, the BoJ won’t need the Yield Curve Control (YCC).
Data-wise, Japan’s retail sales grew higher than the 5.4% YoY expected and rose by 6.8% in July, while Industrial Production plunged -2.4%, disappointing investors, which were expected a contraction of -1.4%.
USD/JPY Price Analysis: Technical outlook
The pair remains upward biased despite falling below the Tenkan-Sen, which has been recovered by buyers early in Thursday’s session. Even though the bulls are in charge, the USD/JPY must climb above yesterday’s high of 146.53 to pave the way for further upside, eyeing the year-to-date (YTD) high of 147.37. Otherwise, downside risks emerge below 145.55, which, once cleared, the major can dive and test the August 23 swing low of 144.54.

- AUD/USD strives for stability above 0.6500 for a fresh upside ahead of US NFP.
- The Australian Dollar as a proxy to Chinese economy might come under pressure if China’s factory activities remain below 50.0.
- AUD/USD has been consolidating in a wider range of 0.6336-0.6525 for the past 15 trading sessions.
The AUD/USD pair consolidates in a narrow range near the psychological resistance of 0.6500 in the New York session. The Aussie asset remains topsy-turvy as investors await the US Nonfarm Payrolls (NFP) for August, which will be published on Friday. In addition to the US NFP, ISM Manufacturing PMI will be keenly watched.
After US Automatic Data Processing (ADP) Employment report, investors hope that the labor market is losing resilience. Firms are operating with the current labor force due to the deteriorating demand environment.
Meanwhile, the Australian Dollar will dance to the tunes of the Caixin Manufacturing PMI data. The Australian Dollar as a proxy to the Chinese economy might come under pressure if China’s factory activities remain below the 50.0 threshold.
AUD/USD has been consolidating in a wider range of 0.6336-0.6525 for the past 15 trading sessions. The Aussie asset is aiming to stabilize above the 200-period Exponential Moving Average (EMA), which trades around 0.6480.
Momentum would turn bullish after the Relative Strength Index (RSI) (14) shifts into the 60.00-80.00 range.
A recovery move above August 15 high around 0.6522 will drive the asset to August 9 high at 0.6571. Breach of the latter will drive the asset towards August 10 high at 0.6616.
In an alternate scenario, a fresh downside would appear if the Aussie asset dropped below August 17 low around 0.6360. This would expose the asset to the round-level support of 0.6300 followed by 03 November 2022 low at 0.6272.
AUD/USD two-hour chart
-638290879451093207.png)
- Silver price corrects sharply from $25.00 as the US PCE price index remains sticky.
- The US Dollar Index (DXY) holds gains around 103.60 as persistent PCE data offsets the impact of the softer labor demand.
- Silver price is approaching the horizontal resistance plotted from July 20 high around $25.27
Silver price (XAG/USD) faces selling pressure near the psychological resistance of $25.00 as the US Bureau of Labor Statistics reported that the Personal Consumption Expenditure (PCE) price index remained stubborn in July.
The monthly headline and core PCE grew at a stable pace of 0.2%. Also, the annual headline and core PCE accelerated marginally to 3.3% and 4.2% as expected by market participants.
Apart from that, the US Department of Labor reported weekly jobless claims data. For the week ending August 25, individuals claiming jobless benefits dropped to 228K vs. expectations of 235K and the former reading of 232K.
The US Dollar Index (DXY) holds gains around 103.60 and is looking to extend gains further as persistent PCE data offsets the impact of the softer labor demand reported by US Automatic Data Processing (ADP) for August, released on Wednesday.
After Fed’s preferred inflation measure, investors shift focus to the US Nonfarm Payrolls (NFP) data for August, which will be published on Friday at 12:30 GMT. As per the expectations, US labor formed witnessed a fresh addition of 170K payrolls, lower than July’s reading of 187K. The Unemployment Rate is seen unchanged at 3.5%. Apart from that, Average Hourly Earnings data will be keenly focused.
Silver technical analysis
Silver price is approaching the horizontal resistance plotted from July 20 high around $25.27 on a two-hour scale. Upward-sloping 50-period Exponential Moving Average (EMA) indicates that the upside momentum is extremely bullish.
The Relative Strength Index (RSI) (14) oscillates in the bullish range of 60.00-80.00, which indicates that the upside momentum is active.
Silver two-hour chart
-638290858912922388.png)
- EUR/USD sharply reverses part of the recent three-day advance.
- Next on the downside comes the 200-day SMA (1.0812).
EUR/USD faces strong headwinds and slips back to the 1.0860 zone on Thursday following tops near 1.0950 recorded in the previous session.
Despite the daily knee-jerk, the pair’s current momentum seems to be favouring the continuation of the march north for the time being. That said, there is a temporary hurdle at the 55-day SMA at 1.0968, which precedes the psychological 1.1000 mark and the August top of 1.1064 (August 10).
In case losses gather extra impulse, a pullback to the 200-day SMA, today at 1.0812, should not be ruled out.
In the meantime, the pair is likely to keep the bullish outlook unchanged while above the 200-day SMA.
EUR/USD daily chart
Economists at Nordea share their view on the European Central Bank's (ECB) policy outlook following the release of the July Monetary Policy Meeting Accounts.
ECB will pause hiking in September, while retaining a tightening bias
"The monetary policy account from the ECB’s July meeting did not offer much guidance on what the ECB would do at its September meeting."
"The activity data since the July meeting has been weak, while inflation has proved to be sticky. In fact, stagflation risks were mentioned twice in the account. A few of the more hawkish Governing Council members have talked in favour of another hike lately, while most, including Executive Board member Schnabel today, have kept an open mind."
"We stick to our long-held baseline that rates have peaked at 3.75%, and think the ECB will pause hiking in September, while retaining a tightening bias. It will be a close call, though, and there may be an intense battle ahead between those in favour of hiking and the ones wanting to keep rates unchanged at the ECB’s September meeting."
- DXY makes a U-turn following three daily drops in a row.
- Further upside retargets the monthly highs near 104.50.
DXY halts a three-session negative streak and manages to regain some composure and retest the 103.50/60 band on Thursday.
Once the recovery gathers steam, the index should shift its focus to another visit to the monthly peak of 104.44 (August 25) just before the May top of 104.69 (May 31). The breakout of this level could prompt a probable test of the 2023 high at 105.88 (March 8) to re-emerge on the horizon.
While above the key 200-day SMA, the outlook for the index is expected to remain constructive.
DXY daily chart
- EUR/JPY comes under pressure following new 2023 peaks.
- The next up barrier remains at the key round level at 160.00.
EUR/JPY reverses a five-day positive streak and breaks below the 159.00 support on Thursday.
The continuation of the uptrend could see the cross challenging the recent 2023 peak at near 159.76 (August 30) ahead of the key round level at 160.00. The surpass of the latter should not see any resistance level of note until the 2008 high at 169.96 (July 23)
So far, the longer term positive outlook for the cross appears favoured while above the 200-day SMA, today at 147.92.
EUR/JPY daily chart
- Initial Jobless Claims in the US decreased by 4K in the week ending August 26.
- Continuing Jobless Claims rise by 28K, to 1.725 million in the week ending August 19.
- US Dollar Index stays around 103.40 following Core PCE and Jobless Claims.
Initial Jobless Claims totaled 228,000 in the week ending August 26, the weekly data published by the US Department of Labor (DOL) showed on Thursday. It is the lowest reading in four weeks. This follows the previous week's print of 232,000 (revised from 230,000) and came in below the market expectation of 235,000.
Further details of the publication revealed “The 4-week moving average was 237,500, an increase of 250 from the previous week's revised average. The previous week's average was revised up by 500 from 236,750 to 237,250.”
Continuing claims rose by 28K in the week ending August 19 to 1.725 million, above market expectations of 1.7 million; the highest level in six weeks. “The 4-week moving average was 1,704,250, an increase of 8,250 from the previous week's revised average”, the DOL further noted in its publication.
Market reaction
The US Dollar Index declined modestly below 103.40 after the release of the Jobless Claims data and the Core Personal Consumption Expenditure Price Index.
- USD/CAD gauges support near 1.3520 while the US Dollar’s recovery remains swift.
- The oil price rallied above $82.00 on Thursday as the oil market is expected to tighten further.
- As per expectations, Canada’s Q2 GDP expanded at a 0.3% pace, slower than Q1’s growth rate of 0.8%.
The USD/CAD pair found a cushion near 1.3520 and defended its psychological support of 1.3500 after a recovery move in the US Dollar. The Loonie asset delivered a nominal recovery while the pace of rebound in the US Dollar Index (DXY) was higher. The rebound move in the Lonnie asset remained modest as the Canadian Dollar strengthened due to a rally in oil prices.
S&P500 futures remain lackluster in Europe as investors await Personal Consumption Expenditure (PCE) price index data for July.
Analysts at CMC markets said July inflation numbers could prompt further concern about sticky inflation on the recording of sizeable ticks higher in the monthly as well as annual headline numbers. August CPI numbers were evidence that prices might struggle to move much lower after headline CPI edged higher to 3.2%. Investors can see a similar move in this week’s numbers, with a move to 3.3% in the deflator and to 4.3% in the core deflator.”
The US Dollar Index recovered swiftly to near 103.60 after discovering the 103.00 figure as a crucial support. After the Fed’s preferred inflation tool, investors will focus on the Nonfarm Payrolls (NFP) data, which will be published on Friday. Scrutiny of the US ADP Employment Change report indicates that fresh payrolls were weaker than anticipated and wage growth remained slowest since October 2021.
The oil price rallied above $82.00 on Thursday as the oil market is expected to tighten further. Bloomberg reported that Saudi Arabia is expected to extend a million-barrel oil supply cut into October, as it seeks to shore up prices against a faltering economic backdrop.
It is worth noting that Canada is the leading exporter of oil to the United States and higher oil prices strengthen the Canadian Dollar.
The Canadian Dollar will remain in action on Friday amid the release of Q2 Gross Domestic Product (GDP) data. Investors hope that the April-June quarter expanded at a 0.3% pace, slower than Q1’s growth rate of 0.8%.
The accounts of the European Central Bank's (ECB) July policy meeting revealed on Thursday that there was broad agreement on the assessment that there are signs of a possible downward surprise in economic activity.
Key takeaways
"Members concurred with Mr Lane that the near-term economic outlook for the euro area had deteriorated."
"It was argued that the deterioration in the outlook showed that monetary transmission was working."
"There had been no material surprise in the latest inflation outcomes compared with the June projections."
"The risk of second-round effects leading to wage-price spirals seemed to be contained."
"the Governing Council needed clearer signs of whether inflation would converge to target once the effects of recent shocks had faded."
"Underlying inflation could be expected to remain high for an extended period."
"A further rate hike in September would be necessary if there was no convincing evidence that the effect of the cumulative tightening was strong enough."
Market reaction
The Euro remains under constant selling pressure following this publication. As of writing, EUR/USD was down 0.6% on the day at 1.0858.
Analysts at BBH note that the European Central Bank tightening expectations remain subdued following the latest Eurozone inflation data.
ECB may stop hiking before the Fed
"Eurozone August CPI data came in hot. Headline came in at 5.3% y/y vs. 5.1% expected and 5.3% in July, while core came in as expected at 5.3% y/y vs. 5.5% in July."
"Basically, disinflation has stalled out in the eurozone and so the policy debate will most likely swing to the hawks’ favor. Indeed, Holzmann said today that the ECB may extend its tightening cycle by “another hike or two.” Schnabel was more nuanced, noting that recent data “point to growth prospects being weaker than foreseen in the baseline scenario. But underlying price pressures remain stubbornly high, with domestic factors now being the main drivers of inflation in the euro area.”
Yet European Central Bank tightening expectations remain subdued. WIRP suggest odds of a 25 bp hike stand just below 30% September 14, rise to over 50% October 26 and top out near 65% December 14. What’s very interesting to us is that these odds have actually fallen since the start of this week, meaning that neither the higher than expected August CPI data nor hawkish ECB comments have had any impact on ECB expectations whatsoever. Market chatter regarding stagflation risks is picking up. If this dynamic is sustained, it would be a game-changer for the euro. Lastly, we stress again that the ECB may stop hiking before the Fed does and we don't think the markets have priced this risk in yet."
Economist at UOB Group Lee Sue Ann reviews the latest inflation figures in Australia.
Key Takeaways
Australia’s monthly CPI rose 4.9% y/y in Jul, easing from 5.4% in Jun, and the peak of 8.4% in Dec 2022. On a month-on-month basis, CPI rose 0.3% in Jul, also lower from the 0.7% m/m increase in Jun.
The latest monthly inflation print vindicates the Reserve Bank of Australia (RBA)’s decision to stay pat earlier this month (1 Aug), when it held the cash rate target unchanged at 4.10%,
However, we believe there is a chance it will hike one last time this year, taking the cash rate target to a peak of 4.35%. In terms of timing, this is likely to occur at the 7 Nov meeting, following the release of the 3Q23 CPI on 25 Oct.
- Natural Gas is set to fall as demand remains tepid and stockpiles high.
- The US Dollar is under pressure after weak US data ahead of the jobs report.
- Expect a sideways to lower gas price as supply issues start to soothe.
Natural Gas has jumped substantially this week after Chevron received notice of strikes to take place at the start of September in several important LNG terminals in Australia. As the week progresses, another local exporter was able to broker a deal and avoid any future strike actions. This opens the door for Chevron to strike a deal as well, which would mean that any supply issues are to be limited in the near future.
Meanwhile, the demand side is staying steady to lower as the European bloc is way ahead of its target for this winter in filling up the strategic gas storages. The European bloc is committed to shun away from fossil fuels by 2027 out of Russia. However, EU countries have bought a record 52% of all cubic metres of LNG that Russia has exported this year.
At the time of writing, Natural Gas is trading at $2.926 per MMBtu.
Natural Gas news and market movers
- The Energy Information Administration (EIA) is due to publish the weekly Natural Gas Storage Changes for this week at 14:30 GMT. In line with recent headlines, another build is expected from 18 to 29 billion cubic feet.
- Oman LNG has signed a new deal with Shell and OQ to deliver LNG.
- China’s LNG consumption for July has risen 9.6% year-on-year.
- The recent batch of weaker data from the US, with a lower than expected US Gross Domestic Product and a substantial decline in US JOLTS job openings, could point to less LNG demand in the coming quarters.
- European gas storage is at 93% and saw further stockpile growth this week.
- Australian local exporter Woodside Energy Group Limited has reached a breakthrough agreement with unions. This could mean that Chevron might broker a deal as well soon and still alleviate any possible strike actions at the start of September.
- Tropical storm Idalia is heading over Georgia as it weakens to a Category 1 hurricane.
- All eyes remain on the market moving US jobs report on Friday.
Natural Gas Technical Analysis: topping out
Natural Gas has been on a tear this week and starts to face a few headwinds. With the demand side not picking up any further and the supply side possibly not as tight as first foreseen, a small rebalancing of the gas price could be at hand. Expect to see some profit taking into the rally of this week, which means that the $3 handle looks out of reach.
On the upside, $3 is still the level to watch once Natural Gas prices can reclaim $2.9. Should prices recover, look for a close above $2.935, the high of August 15, in order to confirm that demand is picking up again. More upside toward $3 and $3.065 (high of August 9) would be targets or levels to watch.
On the downside, the trend channel has done a massive job underpinning the price action. Aside from one small false break, ample support was provided near $2.60. The 55-day Simple Moving Average (SMA) needs to give that much needed support at $2.69 ahead of the ascending trend channel at $2.61. Any falling knives can still be caught by the 100-day SMA near $2.55.
-638290701082320192.png)
XNG/USD (Daily Chart)
Natural Gas FAQs
What fundamental factors drive the price of Natural Gas?
Supply and demand dynamics are a key factor influencing Natural Gas prices, and are themselves influenced by global economic growth, industrial activity, population growth, production levels, and inventories. The weather impacts Natural Gas prices because more Gas is used during cold winters and hot summers for heating and cooling. Competition from other energy sources impacts prices as consumers may switch to cheaper sources. Geopolitical events are factors as exemplified by the war in Ukraine. Government policies relating to extraction, transportation, and environmental issues also impact prices.
What are the main macroeconomic releases that impact on Natural Gas Prices?
The main economic release influencing Natural Gas prices is the weekly inventory bulletin from the Energy Information Administration (EIA), a US government agency that produces US gas market data. The EIA Gas bulletin usually comes out on Thursday at 14:30 GMT, a day after the EIA publishes its weekly Oil bulletin. Economic data from large consumers of Natural Gas can impact supply and demand, the largest of which include China, Germany and Japan. Natural Gas is primarily priced and traded in US Dollars, thus economic releases impacting the US Dollar are also factors.
How does the US Dollar influence Natural Gas prices?
The US Dollar is the world’s reserve currency and most commodities, including Natural Gas are priced and traded on international markets in US Dollars. As such, the value of the US Dollar is a factor in the price of Natural Gas, because if the Dollar strengthens it means less Dollars are required to buy the same volume of Gas (the price falls), and vice versa if USD strengthens.
- EUR/GBP gauges support near 0.8550 as Eurozone HICP for August remained sticky.
- Eurozone headline inflation expanded at a higher pace of 0.6% while investors anticipated a deflation of 0.1% as recorded for July.
- BoE Pill said that that policy must be sufficiently restrictive for long enough.
The EUR/GBP pair discovers support near 0.8550 propelled by the sticky Eurozone preliminary Harmonized Index of Consumer Prices (HICP) for August.
Eurostat reported that monthly headline inflation expanded at a higher pace of 0.6% while investors anticipated a deflation of 0.1% as recorded for July. Annual headline HICP remained sticky at 5.3% against expectations of a deceleration to 5.1%.
Core inflation that excludes volatile food and oil prices expanded at a 0.3% pace as expected by market participants. In July prices of core goods were softened by 0.1%. On an annual basis, the economic data softened to 5.3% as expected from July’s reading of 5.5%.
Stubborn Eurozone inflation indicates that the European Central Bank (ECB) is not in a position to discuss pausing the rate-tightening spell. ECB policymaker Robert Holzmann said that “we are not yet at the highest level for rates," adding that "another hike or two are possible.” He further added, “As long as the labor market remains hot, it is difficult to convince workers to accept lower wage rises.”
After Eurozone inflation, investors will shift focus to the Manufacturing PMI for August, which will be published on Friday at 08:00 GMT. The economic data is expected to remain steady at 43.7.
On the Pound Sterling front, improvement in the United Kingdom’s business confidence indicates that recession fears are easing. Lloyds Bank Business Barometer survey showed that business confidence jumped by 10 points in August to 41%, its highest since Russia’s invasion of Ukraine. The survey also showed that businesses will keep raising job pay and prices of goods.
About the interest rate guidance, Bank of England (BoE) Chief Economist Huw Pill said on Thursday that policy must be sufficiently restrictive for long enough. The BoE is widely expected to raise interest rates further by 25 basis points (bps) in its September monetary policy to 5.50%.
- Gold price oscillates above $1,940.00 as investors await US NFP data.
- The US ADP Employment report suggests that the NFP report could show job creation is slowing.
- US ADP report also showed the slowest wage growth since October 2021.
Gold price (XAU/USD) trades sideways after a rally inspired by soft labor demand due to the deteriorating economic outlook. The precious metal is expected to remain on the sidelines as investors are likely to make an informed decision after the release of US Nonfarm Payrolls (NFP) data on Friday.
The US ADP Employment report released on Wednesday showed that the labor market is not as resilient as previously thought. Firms have slowed down their hiring process, adding to evidence of an uncertain economic outlook. Lower labor demand boosted hopes of a soft landing from the Federal Reserve (Fed) as Chair Jerome Powell conveyed at the Jackson Hole Symposium that inflation has become more responsive to labor markets.
Daily Digest Market Movers: Gold price turns sideways ahead of US NFP
- Gold price turns rangebound, near a four-week high, after ensuring stability above $1,940.00 as investors await US NFP and ISM Manufacturing PMI data for August, which will be released on Friday.
- The precious metal continues its three-day winning spell and is expected to extend its recovery as labor demand from US firms starts softening due to deteriorating demand.
- After fewer job vacancies, US ADP Employment Change data showed the effects of higher interest rates. The ADP report for August showed the US private sector added 177K employees, lower than expectations of 195K and less than half of the upwardly revised July’s reading of 371K.
- The slowdown in job growth majorly came from the leisure and hospitality sector. Job creation by hotels, restaurants, and other employers in the sector fell by 30K in August after months of strong hiring.
- Wage growth also slowed in August. Job stayers saw an annual pay growth of 5.9%, while job changers pay growth slowed to 9.5%.
- August numbers are consistent with the pace of job creation before the pandemic, said Nela Richardson, chief economist at ADP. “After two years of exceptional gains tied to the recovery, we're moving toward more sustainable growth in pay and employment as the economic effects of the pandemic recede,” she said.
- Fed Chair Jerome Powell conveyed in his commentary at the Jackson Hole Symposium that inflation is getting more responsive to the job market. Therefore, softening labor market conditions might ease upside risks to inflation.
- As per the CME Group FedWatch Tool, interest rates are widely expected to remain unchanged in September. Also, the Fed is seen keeping rates steady at 5.25%-5.50% by year-end.
- Atlanta Fed Bank President Raphael Bostic said that the policy is restrictive enough to bring inflation to 2% over a reasonable time frame.
- The US Dollar sees a pullback move after an intense sell-off to near 103.00. However, more downside seems favored as investors hope that interest rates by the Fed have peaked. 10-year US Treasury yields rebounded moderately to 4.12%.
- US housing demand remains under pressure as higher mortgage rates are increasing again. Still, the worst of the housing sector correction appears to have passed due to tight supply.
- According to property analysts polled by Reuters, forecasts for a price fall this calendar year have wiped out and the short US housing market correction is now over.
- Going forward, investors will focus on the weekly Jobless Claims for the week ending August 25 and the core Personal Consumption Expenditure (PCE) Price Index for July.
- Monthly core PCE inflation is expected to grow at a steady 0.2% pace, while the annual reading is seen accelerating to 4.2%.
Technical Analysis: Gold price upside seems restricted near $1,950.00
Gold price continues its three-day winning spell but the upside seems restricted near $1,950.00 as investors await US NFP data to get in-depth information about labor market conditions. The precious metal gathers strength to deliver a breakout of the Rising Channel chart pattern formed on a lower time frame. The yellow metal secures stability above the 20-day and 50-day Exponential Moving Averages (EMAs), supporting more upside ahead.
Central banks FAQs
What does a central bank do?
Central Banks have a key mandate which is making sure that there is price stability in a country or region. Economies are constantly facing inflation or deflation when prices for certain goods and services are fluctuating. Constant rising prices for the same goods means inflation, constant lowered prices for the same goods means deflation. It is the task of the central bank to keep the demand in line by tweaking its policy rate. For the biggest central banks like the US Federal Reserve (Fed), the European Central Bank (ECB) or the Bank of England (BoE), the mandate is to keep inflation close to 2%.
What does a central bank do when inflation undershoots or overshoots its projected target?
A central bank has one important tool at its disposal to get inflation higher or lower, and that is by tweaking its benchmark policy rate, commonly known as interest rate. On pre-communicated moments, the central bank will issue a statement with its policy rate and provide additional reasoning on why it is either remaining or changing (cutting or hiking) it. Local banks will adjust their savings and lending rates accordingly, which in turn will make it either harder or easier for people to earn on their savings or for companies to take out loans and make investments in their businesses. When the central bank hikes interest rates substantially, this is called monetary tightening. When it is cutting its benchmark rate, it is called monetary easing.
Who decides on monetary policy and interest rates?
A central bank is often politically independent. Members of the central bank policy board are passing through a series of panels and hearings before being appointed to a policy board seat. Each member in that board often has a certain conviction on how the central bank should control inflation and the subsequent monetary policy. Members that want a very loose monetary policy, with low rates and cheap lending, to boost the economy substantially while being content to see inflation slightly above 2%, are called ‘doves’. Members that rather want to see higher rates to reward savings and want to keep a lit on inflation at all time are called ‘hawks’ and will not rest until inflation is at or just below 2%.
Is there a president or head of a central bank?
Normally, there is a chairman or president who leads each meeting, needs to create a consensus between the hawks or doves and has his or her final say when it would come down to a vote split to avoid a 50-50 tie on whether the current policy should be adjusted. The chairman will deliver speeches which often can be followed live, where the current monetary stance and outlook is being communicated. A central bank will try to push forward its monetary policy without triggering violent swings in rates, equities, or its currency. All members of the central bank will channel their stance toward the markets in advance of a policy meeting event. A few days before a policy meeting takes place until the new policy has been communicated, members are forbidden to talk publicly. This is called the blackout period.
Speaking at the Reuters Global Markets Forum on Thursday, European Central Bank (ECB) policymaker Robert Holzmann said that “we are not yet at the highest level for rates," adding that "another hike or two are possible.”
Additional quotes
“August inflation data is a conundrum for the central bank.”
“Data shows that inflation is still persistent.”
“As long as labor market hot, it's difficult to convince workers to accept lower wage rises.”
“We should consider ending PEPP reinvestments before the end of 2024.”
Market reaction
EUR/USD is consolidating the latest leg lower near 1.0875, still 0.47% lower on the day.
USD/CNH is still predicted to trade within the 7.2500-7.3300 range in the next few weeks, comment UOB Group’s Economist Lee Sue Ann and Markets Strategist Quek Ser Leang.
Key Quotes
24-hour view: We noted yesterday that “the price actions still appear to be consolidative” and we expected USD to trade between 7.2750 and 7.3040. Our view was not wrong, even though USD traded in a narrower range than expected (7.2807/7.3045). The price actions offer no fresh clues. Today, we expect USD to trade in a range of 7.2800/7.3040.
Next 1-3 weeks: Our latest narrative was from last Thursday (24 Aug, spot at 7.2840) when we highlighted that, “the recent buildup in upward momentum has eased, and USD is likely to trade in a range of 7.2500/7.3300 for the time being.” There is no change in our view.
- GBP/JPY comes under heavy selling on Thursday amid reviving demand for the safe-haven JPY.
- Weaker US macro data, mixed Chinese PMIs fuel recession fears and drive some haven flows.
- The BoJ-BoE policy divergence should lend some support and help limit any further downfall.
The GBP/JPY cross attracts some sellers near the 186.00 round-figure mark on Thursday and continues drifting lower through the early part of the European session. Spot prices drop to a fresh daily low, around the 185.15-185.10 region in the last hour and reverse a part of the previous day's positive move to over a one-week high.
The disappointing US macro data released on Wednesday was seen as a sign that the surprisingly resilient US economy might be starting to lose steam in the wake of rapidly rising interest rates. Adding to this, the mixed Chinese PMIs do little to ease worries about a deeper global economic downturn, which drives some haven flows towards the Japanese Yen (JPY) and turns out to be a key factor dragging the GBP/JPY cross lower.
The JPY draws additional support from the better-than-expected release of domestic Retail Sales, which rose by 6.8% YoY in July and helps offset a larger drop of 2.0% in Industrial Production during the reported month. That said, the Bank of Japan's (BoJ) dovish outlook should keep a lid on any meaningful appreciating move for the JPY and help limit the downside for the GBP/JPY cross, at least for the time being.
It is worth recalling that the BoJ is the only central bank in the world to maintain negative interest rates and is expected to stick to its current ultra-easy monetary policy stance. In fact, BoJ board member Toyoaki Nakamura said this Thursday that it was premature to tighten monetary policy as recent increases in inflation were mostly driven by higher import costs rather than wage gains. This follows last week's dovish remarks by BoJ Governor Kazuo Ueda, saying that the underlying inflation in Japan remains a bit below the 2% target.
This ensures that the Japanese central bank may keep the status quo until next summer. In contrast, the Bank of England (BoE) is anticipated to continue with its policy tightening cycle to combat high inflation. The bets were reaffirmed by BoE Deputy Governor Ben Broadbent's comments, saying that policy rates may well have to remain in restrictive territory for some time as the knock-on effects of the surge in prices were unlikely to fade away rapidly. Furthermore, BoE Chief Economist Huw Pill noted that inflation in the UK remains "too high".
Pill added that there is no room for complacency on inflation and that there is a lot of policy in the pipeline to come through. This, in turn, warrants some caution before placing aggressive bearish bets around the GBP/JPY cross. Hence, it will be prudent to wait for strong follow-through selling before positioning for the resumption of the recent pullback from the highest level since November 2015 touched earlier this month.
Technical levels to watch
- AUD/USD experienced gains due to Australia’s upbeat macroeconomic data.
- China’s mixed macros contributed minor support to the Australian Dollar (AUD).
- Traders await US Core PCE, seeking new insights into the country's inflation scenario.
AUD/USD trades sideways around 0.6470 at the time of writing during the European session on Thursday. The pair experienced upward support due to Australia’s upbeat Private Capital Expenditure for the second quarter and China’s moderate economic data released on Thursday, contributing additional support to the AUD/USD pair. As said, the data reported that Australia’s capital expenditure intentions rose to 2.8%, against the expected 1.2% figure and 2.4% prior.
Additionally, China’s August NBS Manufacturing PMI data showed an improvement. The report printed a reading of 49.7 compared to the market consensus of 49.24 figure and 49.3 previously. While Non-Manufacturing PMI fell to 51.0, worse than the expected 51.1 figure. The index reported a reading of 51.5 in July.
US Dollar Index (DXY), which measures the performance of the US Dollar (USD) against the six other major currencies, trades higher around 103.40 at the time of writing. The Greenback experienced downward pressure due to the slew of disappointing US economic data and a pullback in US Treasury yields. The yield on a 10-year US bond extends its losses. Spot price trades at 4.10%, continuing a downward trajectory for the fourth consecutive day.
As mentioned, the US ADP National Employment reported a sharp decline in the number of jobs generated in August. The data showed 177K new jobs added to the economy compared to the 371K jobs that were generated in July. The market was expecting 195K new jobs to be added. Moreover, the preliminary Gross Domestic Product (GDP) reported a figure of 2.1% against the expected reading of 2.4%.
Investors will likely monitor the upcoming data from the US scheduled to be released on Thursday, seeking further cues on the inflation outlook in the country. These datasets include the Core Personal Consumption Expenditures (PCE) - Price Index (MoM), and Initial Jobless Claims (Aug 25). Along with, Average Hourly Earnings (MoM) and Nonfarm Payrolls (Aug) will be released on Friday.
European Central Bank (ECB) executive board member, Isabel Schnabel, is making some comments on the central bank’s interest rate outlook on Thursday.
Key quotes
“We cannot predict where the peak rate is going to be.”
“Also cannot predict for how long rates will have to stay at restrictive levels.”
Market reaction
EUR/USD came under renewed selling pressure on her indecisive comments, currently trading at 1.0883, down 0.36% on the day.
Inflation in the remains "too high" as they face second-round effects, Bank of England Chief Economist Huw Pill said on Thursday, per Reuters.
Additional takeaways
"No room for complacency on inflation."
"There are cases for caution on inflation despite fall in headline rate."
"Some indicators of inflation have developed less benignly of late."
"There is a lot of policy in the pipeline to come through."
"We need to see the job through on inflation.",
"We need to ensure we do enough on policy."
"There is the possibility of doing too much to fight inflation."
"Policy must be sufficiently restrictive for long enough."
Market reaction
Pound Sterling showed no immediate reaction to these comments. As of writing, GBP/USD was down 0.15% on the day at 1.2700.
Tommy Wu, Senior Economist at Commerzbank, offers a brief analysis of the official Chinese PMIs released this Thursday, which showed that the business activity in the manufacturing sector rebounded a bit in August, albeit remained in contraction territory for the fifth straight month. Furthermore, the growth in the non-manufacturing sector eased more than anticipated and did little to ease concerns about the worsening economic conditions in China.
Key Quotes:
“While today’s official PMIs suggest China’s economy has continued to lose momentum, the underlying trends were mixed. The PMI components suggest production improved more visibly to 51.9 from 50.2 previously. New orders returned to expansionary territory at 50.2. The improvement was likely driven by domestic demand as new export orders have remained very weak at 46.7 in August.”
“Services, which have been key to China’s post-pandemic recovery, lost further steam. It was dragged by the services component which fell to 50.5 from 51.5 previously. However, the construction component picked up notably to 53.8 from 51.2 prior. This likely reflects stronger infrastructure investment as the government has put greater efforts in supporting growth, albeit in a targeted manner.”
“The weak labor market outlook does not bode well for the economic recovery. The employment component for both manufacturing and non-manufacturing remained visibly below the 50-neutral mark at 48.0 and 46.8, respectively.”
- The Euro gives away some gains vs. the US Dollar.
- Stocks in Europe kicked off the session on a positive note.
- EUR/USD puts 1.0900 to the test amidst the USD recovery.
- The USD Index (DXY) picks up pace and rebounds from 103.00.
- US and German yields trade slightly on the defensive.
- Germany’s labour market report came in mixed in August.
- Flash CPI in France rose 1.0% MoM and 4.8% YoY in August.
The Euro’s (EUR) recent uptrend vs. the US Dollar (USD) appears somewhat dented, which motivates EUR/USD to break below the key 1.0900 the figure during the European morning on Thursday.
In the meantime, the Greenback regains a small smile and prompts the USD Index (DXY) to bounce off Wednesday’s two-week lows in the 103.00 neighbourhood amidst declining US yields across the curve and further investors’ repricing of a pause in the Fed’s normalization process for the next few months.
In the meantime, the narrative surrounding the Federal Reserve’s (Fed) tighter-for-longer stance now appears to have dwindled following the recent weaker-than-expected results from US fundamentals.
By contrast, there is no news around the European Central Bank (ECB) regarding its potential decision on rates once the summer season is over.
In the domestic calendar, Retail Sales in Germany contracted 0.8% MoM in July and 2.2% over the last twelve months. Still in Germany, the Unemployment Change increased by 18K individuals in August and the Unemployment Rate ticked higher to 5.7%. Later in the session, advanced inflation figures in the broader euro are are due ahead of the publication of the ECB Accounts for the July 27 meeting.
In the US docket, all the attention will be on the release of inflation tracked by the PCE and Core PCE for the month of August, seconded by usual Initial Jobless Claims, Personal Income, Personal Spending and the speech by Boston Fed Chair Susan Collins.
Daily digest market movers: Euro comes down to retest 1.0900
- The EUR surrenders part of the recent strong advance vs. the USD.
- Fundamentals in Germany continue to deteriorate.
- Investors see the Fed keeping rates on hold in the next few months.
- BoE’s H. Pill said the country is facing second-round effects.
- Inflation in France is seen rising more than expected in August.
- Investors now see the Fed on hold for the remainder of the year.
- The ECB's's. Schnabel said there is uncertainty around the peak rate.
- Further stimulus measures are likely to be taken by the PBoC in the near term.
- BoJ’s Nakamura said economic recovery is needed to end the loose policy.
- The focus now shifts to flash EMU CPI and US PCE.
Technical Analysis: Euro looks at 1.0950 as the next minor hurdle
The three-day rebound in EUR/USD seems to have met quite a decent obstacle ahead of the 1.0950 region so far.
In case bulls regain the upper hand and EUR/USD surpasses the weekly top of 1.0945 (August 30), the pair is expected to meet the provisional 55-day SMA at 1.0967 prior to the psychological 1.1000 barrier and the August top at 1.1064 (August 10). Once the latter is cleared, spot could challenge the weekly peak at 1.1149 (July 27). If the pair surpasses this region, it could alleviate some of the downward pressure and potentially visit the 2023 peak of 1.1275 (July 18). Further up comes the 2022 high at 1.1495 (February 10), which is closely followed by the round level of 1.1500.
The resumption of the downward bias could motivate the pair to initially test the key 200-day SMA at 1.0813 ahead of the August low of 1.0765 (August 25). The breach of the latter exposes the May low of 1.0635 (May 31) prior to the March low of 1.0516 (March 15) and the 2023 low at 1.0481 (January 6).
Furthermore, sustained losses are likely in EUR/USD once the 200-day SMA is breached in a convincing fashion.
Euro FAQs
What is the Euro?
The Euro is the currency for the 20 European Union countries that belong to the Eurozone. It is the second most heavily traded currency in the world behind the US Dollar. In 2022, it accounted for 31% of all foreign exchange transactions, with an average daily turnover of over $2.2 trillion a day.
EUR/USD is the most heavily traded currency pair in the world, accounting for an estimated 30% off all transactions, followed by EUR/JPY (4%), EUR/GBP (3%) and EUR/AUD (2%).
What is the ECB and how does it impact the Euro?
The European Central Bank (ECB) in Frankfurt, Germany, is the reserve bank for the Eurozone. The ECB sets interest rates and manages monetary policy.
The ECB’s primary mandate is to maintain price stability, which means either controlling inflation or stimulating growth. Its primary tool is the raising or lowering of interest rates. Relatively high interest rates – or the expectation of higher rates – will usually benefit the Euro and vice versa.
The ECB Governing Council makes monetary policy decisions at meetings held eight times a year. Decisions are made by heads of the Eurozone national banks and six permanent members, including the President of the ECB, Christine Lagarde.
How does inflation data impact the value of the Euro?
Eurozone inflation data, measured by the Harmonized Index of Consumer Prices (HICP), is an important econometric for the Euro. If inflation rises more than expected, especially if above the ECB’s 2% target, it obliges the ECB to raise interest rates to bring it back under control.
Relatively high interest rates compared to its counterparts will usually benefit the Euro, as it makes the region more attractive as a place for global investors to park their money.
How does economic data influence the value of the Euro?
Data releases gauge the health of the economy and can impact on the Euro. Indicators such as GDP, Manufacturing and Services PMIs, employment, and consumer sentiment surveys can all influence the direction of the single currency.
A strong economy is good for the Euro. Not only does it attract more foreign investment but it may encourage the ECB to put up interest rates, which will directly strengthen the Euro. Otherwise, if economic data is weak, the Euro is likely to fall.
Economic data for the four largest economies in the euro area (Germany, France, Italy and Spain) are especially significant, as they account for 75% of the Eurozone’s economy.
How does the Trade Balance impact the Euro?
Another significant data release for the Euro is the Trade Balance. This indicator measures the difference between what a country earns from its exports and what it spends on imports over a given period.
If a country produces highly sought after exports then its currency will gain in value purely from the extra demand created from foreign buyers seeking to purchase these goods. Therefore, a positive net Trade Balance strengthens a currency and vice versa for a negative balance.
- USD/CAD gains some positive traction on Thursday and draws support from a modest USD uptick.
- Bullish Crude Oil prices underpin the Loonie and cap the upside ahead of the US PCE Price Index.
- The recent breakout through key barriers and positive oscillators on the daily chart favour bulls.
The USD/CAD pair attracts some buying on Thursday and for now, seems to have stalled a two-day-old corrective slide from the vicinity of a nearly three-month peak, around the 1.3635-1.3640 area touched last week. Spot prices stick to modest intraday gains through the early part of the European session, albeit lack follow-through and remain below mid-1.3500s.
The US Dollar (USD) stages a goodish bounce from the very important 200-day Simple Moving Average (SMA) and snaps a three-day losing streak to a two-week low, which, in turn, acts as a tailwind for the USD/CAD pair. That said, Wednesday's weaker US macro data reaffirms expectations that the Federal Reserve (Fed) is nearing the end of its rate-hiking cycle and keeping a lid on the Greenback.
Furthermore, Crude Oil prices stand tall near the highest level in more than two weeks and undermine the commodity-linked Loonie. This further contributes to capping the upside for the USD/CAD pair. Traders also refrain from placing aggressive bets and prefer to wait for the release of the US Core PCE Price Index – the Fed's preferred inflation gauge – later during the early North American session.
From a technical perspective, the recent sustained breakout through the 200-day SMA and a subsequent move beyond the 1.3500 psychological mark was seen as a fresh trigger for the USD/CAD bulls. Moreover, the Relative Strength Index (RSI) on the daily chart has eased from the overbought territory and supports prospects for the emergence of some dip-buying, which should help limit the downside.
Some follow-through selling below the 1.3500 mark, however, might expose the 1.3460-1.3455 region (200-day SMA), which if broken decisively would make the USD/CAD pair vulnerable. Spot prices might then accelerate the downfall towards the next relevant support near the 1.3400 round figure en route to the 1.3370 region.
On the flip side, the overnight swing high, around the 1.3575 area, now seems to act as an immediate hurdle ahead of the 1.3600 round figure. Any further more up is more likely to confront resistance near the monthly peak, around the 1.3635-1.3640 area, above which the USD/CAD pair could aim to reclaim the 1.3700 mark and climb further towards the 1.3740-1.3745 resistance zone. The momentum could get extended further towards the 1.3800 round figure en route to the YTD peak, around the 1.3860 area touched in March.
USD/CAD daily chart
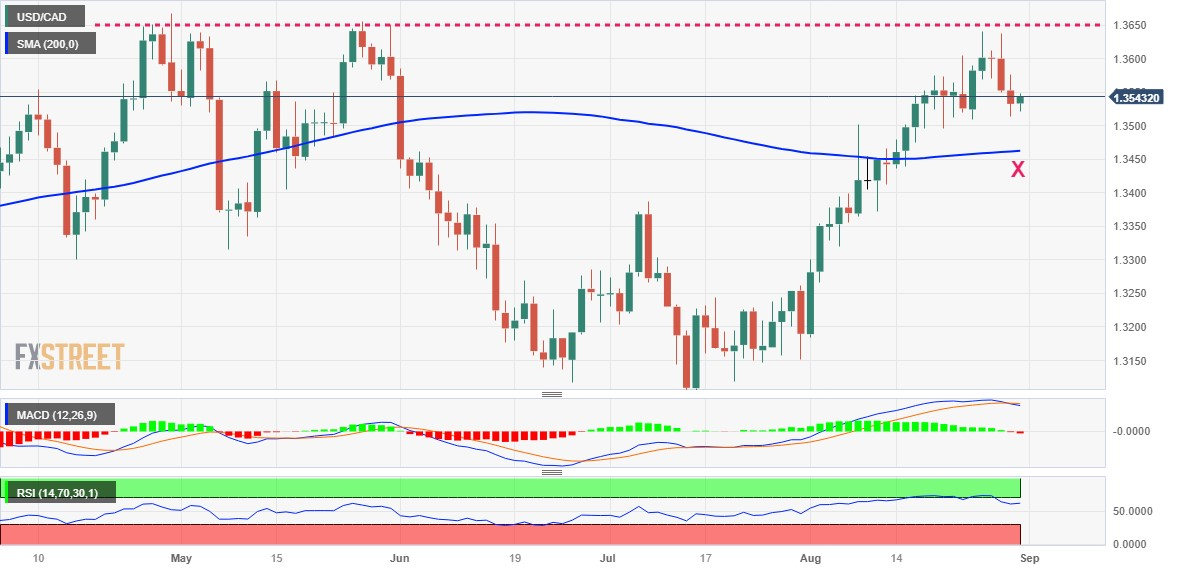
Technical levels to watch
- NZD/USD consolidates ahead of the release of US economic data.
- US Treasury yields extend its losses; reinforcing weakness in the US Dollar (USD).
- Investors await US PCE, seeking fresh impetus on the Fed’s policy decision.
NZD/USD struggles to snap the previous day’s losses, treading waters around 0.5960 during the early trading hours in the European session on Thursday. The pair is experiencing downward pressure due to a modest recovery in the US Dollar (USD) ahead of the economic data release from the United States (US).
However, the NZD/USD gained profits earlier during the day amid China’s moderate economic data released on Thursday. The August NBS Manufacturing PMI indicated a slight improvement in business conditions, reporting a reading of 49.7 against the expected 49.24 figure and 49.3 prior. While, Non-Manufacturing PMI declined to 51.0, worse than the market consensus of 51.1 figure. The index reported a reading of 51.5 in July.
US Dollar Index (DXY), which measures the performance of the US Dollar (USD) against the six other major currencies, snaps a three-day losing streak. Spot price is beating around 103.30 at the time of writing. The Greenback experienced downward pressure, which is attributed to the slew of downbeat economic data from the US along with declining US Treasury yields. The yield on 10-year US bond trades at 4.10%, continuing downward trajectory for the fourth consecutive day.
As mentioned, the US ADP National Employment report showed 177K jobs added to the economy in August compared to the anticipated 195K jobs. This was a sharp contrast to the 371K jobs that were generated in July. Moreover, the preliminary Gross Domestic Product (GDP) report printed the figure of 2.1%, falling short of the prior reading of 2.4%.
Investors will likely monitor the upcoming data from the US scheduled to be released on Thursday, seeking further cues on economic situations in both countries. These datasets include the Personal Consumption Expenditures (PCE), and further Initial Jobless Claims (Aug 25). On the other hand, New Zealand’s leading index ANZ – Roy Morgan Consumer Confidence (Aug) will be released on Friday, which measures the level of consumer confidence in economic activity.
USD/JPY now appears within a consolidation range, likely between 144.50 and 147.20, according to UOB Group’s Economist Lee Sue Ann and Markets Strategist Quek Ser Leang.
Key Quotes
24-hour view: After USD dropped to 145.66 on Tuesday, we indicated yesterday that “while there is no clear increase in downward momentum, USD could drop below 145.65.” However, we were of the view that “any decline is viewed as part of a broad 145.35/146.70 range.” USD then traded in a narrower range than expected (145.54/146.56). Today, USD is likely to continue to trade in a range, probably between 145.60 and 146.60.
Next 1-3 weeks: We continue to hold the same view as yesterday (30 Aug, spot at 146.00). As highlighted, the recent upward pressure has faded. For the time being, we expect USD to trade in a range between 144.50 and 147.20.
- The index leaves behind three consecutive daily pullbacks.
- Initial support for DXY emerges around 103.00 so far.
- PCE, weekly Claims take centre stage in the US docket.
The greenback manages to regain some composure and encourages the USD Index (DXY) to rebound from recent two-week lows around 103.00 on Thursday.
USD Index looks bid ahead of data
The index advances modestly in the wake of the opening bell in the old continent on Thursday, putting some distance from Wednesday’s two-week lows in the 103.00 neighbourhood.
The better tone in the dollar comes on the back of a tepid loss of momentum in the risk-associated complex, while US yields remain slightly on the defensive across the curve, reflecting investors’ repricing of an extended impasse in the Fed’s hiking cycle.
Later in the US data space, the publication of inflation figures gauged by the PCE and Core PCE will take precedence over weekly Initial Claims, Personal Spending and Personal Income. In addition, Boston Fed Susan Collins (2025 voter, centrist) is due to speak later in the NA session.
What to look for around USD
The index regains some balance following a sharp three-session data-driven pullback to the boundaries of the 103.00 region earlier in the week.
In the meantime, support for the dollar keeps coming from the good health of the US economy, which seems to have reignited the narrative around the tighter-for-longer stance from the Federal Reserve.
Running on the opposite side of the road, the idea that the dollar could face headwinds in response to the data-dependent stance from the Fed against the current backdrop of persistent disinflation and cooling of the labour market appears to have regained some traction as of late.
Key events in the US this week: PCE, Core PCE, Personal Income, Personal Spending, Chicago PMI, Initial Jobless Claims (Thursday) – Nonfarm Payrolls, Unemployment Rate, Final Manufacturing PMI, ISM Manufacturing PMI, Construction Spending (Friday).
Eminent issues on the back boiler: Persistent debate over a soft or hard landing for the US economy. Incipient speculation of rate cuts in early 2024. Geopolitical effervescence vs. Russia and China.
USD Index relevant levels
Now, the index is gaining 0.19% at 103.68 and the breakout of 104.44 (monthly high August 25) would open the door to 104.69 (monthly high May 31) and finally 105.88 (2023 high March 8). On the downside, immediate support emerges at 103.07 (200-day SMA) followed by 102.34 (55-day SMA) and then 101.74 (monthly low August 4).
UOB Group’s Economist Lee Sue Ann and Markets Strategist Quek Ser Leang argue that there is scope for NZD/USD to extend the recovery further north of the 0.6000 threshold in the near term.
Key Quotes
24-hour view: While we expected NZD to rise further yesterday, we indicated that “in view of the overbought conditions, the chance of NZD breaking clearly above 0.5995 is not high.” NZD rose more than expected to 0.6004. However, it pulled back sharply from the high and closed at 0.5956 (-0.28%). Upward pressure has faded, and NZD is unlikely to rise further. Today, NZD is more likely to trade sideways between 0.5925 and 0.5985.
Next 1-3 weeks: Our update from yesterday (30 Aug, spot at 0.5960) still stands. As highlighted, there is a tentative buildup in momentum. If NZD breaks and stays above 0.5995, it is likely to advance to 0.6035. Note that while NZD broke above 0.5995 in NY trade, it fell sharply from the high. Overall, only a breach of the 0.5900 (no change in ‘strong support’ level) would indicate that the upside risk has dissipated.
- Silver drifts lower for the second straight day and retreats further from over a one-month peak.
- The technical setup favours bulls and supports prospects for the emergence of some dip-buying.
- A convincing break below the $24.00 mark is needed to negate the near-term positive outlook.
Silver extends the previous day's rejection slide from the $25.00 psychological mark, or over a one-month high and remains under some selling pressure for the second successive day on Thursday. The white metal, however, manages to recover a bit from the daily low and trade just above mid-$24.00s during the early part of the European session, down less than 0.30% for the day.
From a technical perspective, this week's breakout through the $24.35-$24.40 barrier was seen as a fresh trigger for bulls. Adding to this, oscillators on the daily chart are holding comfortably in the positive territory and still far from being in the overbought zone. This, in turn, supports prospects for the emergence of some dip-buying and suggests that the path of least resistance for the XAG/USD is to the upside. Hence, any subsequent slide below the said resistance-turned-support is more likely to find decent support and remain limited near the $24.00 round-figure mark.
The latter nears the upward-sloping 200-hour Simple Moving Average (SMA) and should act as a strong base for the XAG/USD. Sustained weakness below, however, might prompt some technical selling and drag the white metal further towards the $23.55 region. This is closely followed by support near the $23.40 area, representing the 200-day SMA, which if broken decisively might shift the near-term bias in favour of bearish traders and pave the way for a fall towards retesting sub-$23.00 levels en route to the $22.20 area, or the lowest level since June 23 touched earlier this month.
On the flip side, the $24.70 region could act as an immediate resistance ahead of the $25.00 mark. Some follow-through buying has the potential to lift the XAG/USD further beyond the $25.25 intermediate hurdle, representing the July monthly swing high, towards the $26.00 round figure. This is closely followed by the YTD peak, around the $26.15 region touched in May, which if cleared should pave the way for an extension of the uptrend witnessed over the past two weeks or so.
Silver 1-hour chart
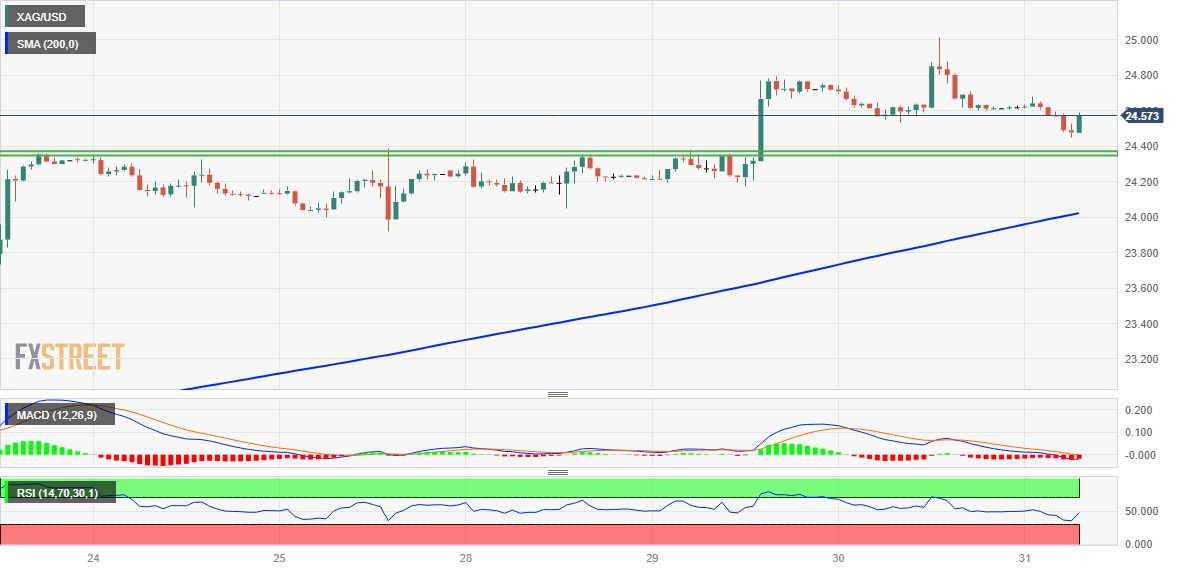
Technical levels to watch
“US monetary policy is appropriately restrictive,” Atlanta Federal Reserve Bank President Raphael Bostic said in remarks prepared for delivery to the South African Reserve Bank Biennial Conference in Cape Town, South Africa.
Additional quotes
Policy is restrictive enough to bring inflation to 2% over a reasonable time frame.
We should be cautious, patient, resolute.
US inflation is still too high.
Inflation is on a clear path downward, expect continued slow decline.
I am not for easing policy any time soon.
Should inflation unexpectedly climb, i would support more tightening.
'Measured cooling afoot' in labor markets as well.
Given lagging nature of housing inflation, underlying inflation may well be close to target already.
Related reads
- Forex Today: Key EU and US inflation data to inject volatility into markets
- US Core PCE Inflation Preview: Federal Reserve preferred price indicator set to remain above target
- EUR/JPY extends its downside to 158.84 after the German data.
- The annual German Retail Sales declined 2.2% in July, compared to an expected 1.0% drop.
- Japanese Retail Sales rose by 6.8% YoY in July versus 5.6% prior, better than the expectation of 5.4%.
- Investors await the German Unemployment Rate, Eurozone Harmonized Index of Consumer Prices (HICP) data.
The EUR/JPY cross faces some selling pressure and drops sharply below the 159.00 area following the release of German Retail Sales. At the time of writing, the EUR/JPY is losing 0.55% on the day to trade at 158.84.
The recent data released by Destatis on Thursday showed German Retail Sales dropped 0.8% MoM in July, compared to 0.3% expected and -0.8% previously. Annually, the bloc's Retail Sales declined 2.2% in July, compared to an expected decrease of 1.0% and a reading of -1.6% in June. The Euro loses momentum against the Japanese Yen following the data.
On the Japanese Yen front, Bank of Japan (BoJ) Board member Toyoaki Nakamura stated on Thursday that policymakers need more time to transition to monetary tightening. The data from the Japanese docket showed that Retail Sales rose by 6.8% YoY in July versus 5.6% prior, better than the expectation of 5.4%. While, Industrial Production dropped by 2.0% MoM in July from a rise of 2.4% in the previous month, compared to market consensus of a 1.4% drop.
Looking ahead, the German Unemployment Rate and Eurozone Harmonized Index of Consumer Prices for August will be released later in the day. Also, the European Central Bank (ECB) policymaker Isabel Schnabel's speech could offer hints about further monetary policy. Traders will take cues from these figures and find trading opportunities around the EUR/JPY cross.
Here is what you need to know on Thursday, August 31:
Major currency pair stay relatively quiet early Thursday following Wednesday's volatile action. Eurozone inflation figures will be watched closely by market participants later in the session before the European Central Bank (ECB) releases the Monetary Policy Meeting Accounts. In the second half of the day, the US economic docket will feature Personal Consumption Expenditures (PCE) Price Index, the Federal Reserve’s preferred gauge of inflation, and the weekly Initial Jobless Claims data.
Eurozone Inflation Preview: ECB hawks unlikely to be pleased despite easing price pressures.
The US Bureau of Economic Analysis announced that it revised the annualized second-quarter Gross Domestic Product (GDP) growth down to 2.1% in its second estimate from 2.4% in the initial estimate. Additionally, ADP reported that employment in the private sector rose 177,000 in August, falling short of the market expectation for an increase of 195,000. The benchmark 10-year US Treasury bond yield declined toward 4% following these disappointing data releases and the USD struggled to find demand during the American trading hours. The US Dollar Index (DXY) closed the third straight day in negative territory. Although DXY holds steady above 103.00 in the European morning, it's down nearly 1% since the beginning of the week.
US Core PCE Inflation Preview: Federal Reserve preferred price indicator set to remain above target.
US Dollar price today
The table below shows the percentage change of US Dollar (USD) against listed major currencies today. US Dollar was the weakest against the Japanese Yen.
| USD | EUR | GBP | CAD | AUD | JPY | NZD | CHF | |
| USD | 0.24% | 0.02% | 0.06% | 0.01% | -0.10% | 0.00% | 0.16% | |
| EUR | -0.24% | -0.18% | -0.17% | -0.23% | -0.34% | -0.22% | -0.07% | |
| GBP | -0.05% | 0.17% | 0.01% | -0.07% | -0.16% | -0.04% | 0.09% | |
| CAD | -0.06% | 0.16% | -0.04% | -0.05% | -0.17% | -0.06% | 0.10% | |
| AUD | 0.02% | 0.22% | 0.08% | 0.06% | -0.08% | 0.03% | 0.15% | |
| JPY | 0.11% | 0.34% | 0.12% | 0.15% | 0.12% | 0.12% | 0.26% | |
| NZD | 0.01% | 0.25% | 0.04% | 0.03% | 0.00% | -0.11% | 0.15% | |
| CHF | -0.17% | 0.06% | -0.12% | -0.11% | -0.16% | -0.27% | -0.16% |
The heat map shows percentage changes of major currencies against each other. The base currency is picked from the left column, while the quote currency is picked from the top row. For example, if you pick the Euro from the left column and move along the horizontal line to the Japanese Yen, the percentage change displayed in the box will represent EUR (base)/JPY (quote).
NBS Manufacturing PMI edged higher to 49.7 in August and Non-Manufacturing PMI retreated to 51, the data from China showed in the Asian session. In the meantime, New Zealand's ANZ Activity Outlook Index jumped to 11.2% in August from 0.8% in July, while the ANZ Business Confidence Index came in at -3.7, missing the market expectation of -1.9. NZD/USD struggled to make a decisive following these data releases and was last seen trading sideways at around 0.5950.
EUR/USD touched its highest level in two weeks near 1.0950 on Wednesday before going into a consolidation phase slightly above 1.0900 early Thursday.
GBP/USD registered gains for the third straight day on Wednesday but lost its bullish momentum in the European morning on Thursday. At the time of press, the pair was trading in negative territory at around 1.2700.
Following Tuesday's slide, USD/JPY recovered modestly on Wednesday. The pair was last seen fluctuating in a tight channel at around 146.00.
Gold price benefited from falling US yields on Wednesday and touched its highest level in a month near $1,950. In the early European session, XAU/USD consolidates its weekly gains near mid-$1,940s.
Bitcoin staged a downward correction following Tuesday's impressive rally and lost more than 1% on Wednesday. In the European morning, BTC/USD stays calm near $27,200. Ethereum moves sideways at around $1,700 after losing 1.4% on Wednesday.
- Core Personal Consumption Expenditures Price Index is forecast to rise 0.2% MoM and 4.2% YoY in July.
- The Federal Reserve left the door open for one more rate hike as Powell stressed data-dependency.
- The US Dollar faces a two-way risk heading into PCE inflation data.
The Bureau of Economic Analysis (BEA) will publish the US Federal Reserve’s (Fed) favored inflation gauge, the Core Personal Consumption Expenditures (PCE) Price Index, on Thursday, August 31 at 12:30 GMT.
What to expect in the Federal Reserve’s preferred PCE inflation report?
The Core Personal Consumption Expenditures (PCE) Price Index, which excludes food and energy, is forecast to rise 0.2% in July on month, matching the June increase. The annual Core PCE Price Index is seen rising 4.2%, at a slightly higher pace than the 4.1% registered in June.
The headline PCE Price Index is expected to grow 0.2% MoM in July, while the annual PCE figure is anticipated to rise 3.3% following the 3% increase recorded in June.
“On a 12-month basis, US total, or ‘headline,’ PCE inflation peaked at 7% in June 2022 and declined to 3.3% as of July, following a trajectory roughly in line with global trends,” Fed Chair Jerome Powell said in his opening speech at the Jackson Hole Symposium.
“On a 12-month basis, core PCE inflation peaked at 5.4% in February 2022 and declined gradually to 4.3% in July,” Powell added.
Although these remarks might suggest that Powell gave away July PCE figures, the document attached to the press release of Powell’s speech noted that “the data point for July 2023 is an estimate based on consumer price index and producer price index data.”
Nevertheless, the chairman’s speech has seemingly lowered the significance of the PCE inflation report and may even have eliminated the surprise factor.
Michael Hewson, Chief Market Analyst at CMC Markets, offers his view on the upcoming PCE data:
“July inflation numbers could prompt further concern about sticky inflation if we get sizeable ticks higher in the monthly as well as annual headline numbers. When we got the CPI numbers earlier in August, we saw evidence that prices might struggle to move much lower, after headline CPI edged higher to 3.2%. We can expect to see a similar move in this week’s numbers, with a move to 3.3% in the deflator and to 4.3% in the core deflator.”
When will be the Personal Consumption Expenditures Price Index report released and how could it affect EUR/USD?
The PCE Inflation report is due at 12:30 GMT on August 31. Earlier in the week, data published by the US Bureau of Labor Statistics showed that the number of job openings on the last business day of July declined to 8.8 million from 9.1 million in June, marking the lowest reading since May 2021. As this report highlighted loosening conditions in the US labor market, the probability of the Fed leaving its policy rate unchanged by the end of the year edged higher to 50% from nearly 40% earlier in the week.
In case there is a 0.3% or higher increase in the monthly core PCE inflation, the US Dollar could gather strength against its rivals with an immediate reaction. On the other hand, a reading close to 0% could trigger a USD sell-off. However, investors could refrain from taking large positions ahead of Friday’s all-important August jobs report, causing any market reaction to PCE data to remain short-lived.
FXStreet Analyst Eren Sengezer offers a brief technical outlook for EUR/USD and explains: “The Relative Strength Index (RSI) indicator on the daily chart climbed above 50 and EUR/USD rose above the 100-day Simple Moving Average for the first time in two weeks on Wednesday, pointing to a buildup of bullish momentum.”
Eren also highlights the important technical levels for EUR/USD: “On the upside, the pair could face first resistance at 1.0980-1.1000 (50-day SMA, psychological level). With a daily close above that area, additional gains toward 1.1060 (static level) and 1.1150 (July 27 high) could be seen. In case EUR/USD retreats below 1.0930 (100-day SMA) and continues to use that level as resistance, sellers could remain interested. In that scenario, 1.0860 could be seen as interim support ahead of 1.0800 (200-day SMA).
Inflation FAQs
What is inflation?
Inflation measures the rise in the price of a representative basket of goods and services. Headline inflation is usually expressed as a percentage change on a month-on-month (MoM) and year-on-year (YoY) basis. Core inflation excludes more volatile elements such as food and fuel which can fluctuate because of geopolitical and seasonal factors. Core inflation is the figure economists focus on and is the level targeted by central banks, which are mandated to keep inflation at a manageable level, usually around 2%.
What is the Consumer Price Index (CPI)?
The Consumer Price Index (CPI) measures the change in prices of a basket of goods and services over a period of time. It is usually expressed as a percentage change on a month-on-month (MoM) and year-on-year (YoY) basis. Core CPI is the figure targeted by central banks as it excludes volatile food and fuel inputs. When Core CPI rises above 2% it usually results in higher interest rates and vice versa when it falls below 2%. Since higher interest rates are positive for a currency, higher inflation usually results in a stronger currency. The opposite is true when inflation falls.
What is the impact of inflation on foreign exchange?
Although it may seem counter-intuitive, high inflation in a country pushes up the value of its currency and vice versa for lower inflation. This is because the central bank will normally raise interest rates to combat the higher inflation, which attract more global capital inflows from investors looking for a lucrative place to park their money.
How does inflation influence the price of Gold?
Formerly, Gold was the asset investors turned to in times of high inflation because it preserved its value, and whilst investors will often still buy Gold for its safe-haven properties in times of extreme market turmoil, this is not the case most of the time. This is because when inflation is high, central banks will put up interest rates to combat it.
Higher interest rates are negative for Gold because they increase the opportunity-cost of holding Gold vis-a-vis an interest-bearing asset or placing the money in a cash deposit account. On the flipside, lower inflation tends to be positive for Gold as it brings interest rates down, making the bright metal a more viable investment alternative.
- EUR/GBP fades bounce off intraday low but remains defensive after reversing from two-week high the previous day.
- German Retail Sales for July prints downbeat figures, UK Car Production improves.
- BoE’s Pill, Eurozone HICP eyed for clear directions.
EUR/GBP fades bounce off intraday low around 0.8580 as it justifies downbeat German Retail Sales amid the early hours of Thursday’s European session. In doing so, the cross-currency pair also takes clues from the upbeat British car production details while positioning for the Eurozone Consumer Price Index (CPI) for August and the European Central Bank’s (ECB) favorite inflation gauge for the said month, namely the Harmonized Index of Consumer Prices (HICP).
Germany’s Retail Sales for July reprints -0.8% MoM figures versus 0.3% market forecasts while the YoY outcomes appear more disappointing as it drops to -2.2% from -1.6%, compared to -1.0% expected.
On Tuesday, the first readings of Germany’s inflation per the Consumer Price Index (CPI) matched 0.3% market forecasts and prior on a MoM basis but edged lower to 6.1% YoY from 6.2% previous readings, compared to the analysts’ estimations of 6.0%. Further, the inflation conditions per the European Central Bank’s (ECB) favorite gauge, namely the Harmonized Index of Consumer Prices (HICP), eased to 0.4% MoM and 6.4% YoY versus 0.5% and 6.5% respective priors, compared to 0.3% MoM and 6.2% YoY market estimations.
Given the recently downbeat price pressure, the European Central Bank’s (ECB) hawkish bias appears to have fewer takers, which in turn prod the Euro buyers ahead of the key inflation data for the bloc.
On the other hand, the UK’s Society of Motor Manufacturers and Traders (SMMT) said earlier in the day that Britain’s car production rose for the sixth consecutive month in July with a 31.6% YoY growth. The SMMT cited the automakers’ recovery from global chip shortages as the key catalyst for the jump in car production figures amid looming recession woes. It should be noted that the UK’s car industry is a significant contributor to manufacturing production and exports. Previously, the UK’s Consumer Credit and Mortgage Approval eased for July and prod the British Pound (GBP) buyers.
Looking ahead, the EUR/GBP traders should pay close attention to the Eurozone inflation data for clear directions as ECB President Christine Lagarde shows readiness for further rate hikes to tame the price pressure if needed. Additionally, comments from the Bank of England (BoE) Chief Economic Huw Pill will also be important as the policymakers have recently been struggling to strike a balance between the higher inflation and softer economics from the UK.
Technical Analysis
EUR/GBP remains depressed within a 16-week-old bearish channel formation, currently between 0.8650 and 0.8490. That said, the momentum indicators suggest a gradual decline in the prices.
- USD/MXN consolidates before the release of the US economic data.
- Seven-day EMA appears to be the immediate resistance aligned to both 14-day EMA and 23.6% Fibo.
- MACD indicates that recent momentum is weaker.
USD/MXN hovers around 16.75 ahead of the European session kicking off on Thursday. The pair witnessed downward pressure due to the moderate data from Mexico and cautious sentiment ahead of the US Federal Reserve’s (Fed) preferred inflation gauge, notably the US Core Personal Consumption Expenditure (PCE) Price Index for August.
The seven-day Exponential Moving Average (EMA) at 16.80 emerges as the immediate barrier lined up with both 14-day EMA and 23.6% Fibonacci retracement at 16.87. A firm break above the latter could open the doors for the USD/MXN pair to explore the region around 38.2% Fibonacci retracement at 16.97.
On the flip side, the pair could meet the key support around the monthly low at 16.69 level, followed by July’s low at 16.62 level. A break below that level could inspire the bears of the pair to navigate the region around a 16.50 psychological level.
The 14-day Relative Strength Index (RSI) remains below 50, indicating a bearish bias of the USD/MXN traders. The Moving Average Convergence Divergence (MACD) line remains below the centerline and shows the divergence below the signal line, which indicates that recent momentum is weaker.
In the short term, the underlying trend remains bearish as long as the USD/MXN pair stays below the 50-day EMA at 17.07.
USD/MXN: Daily Chart
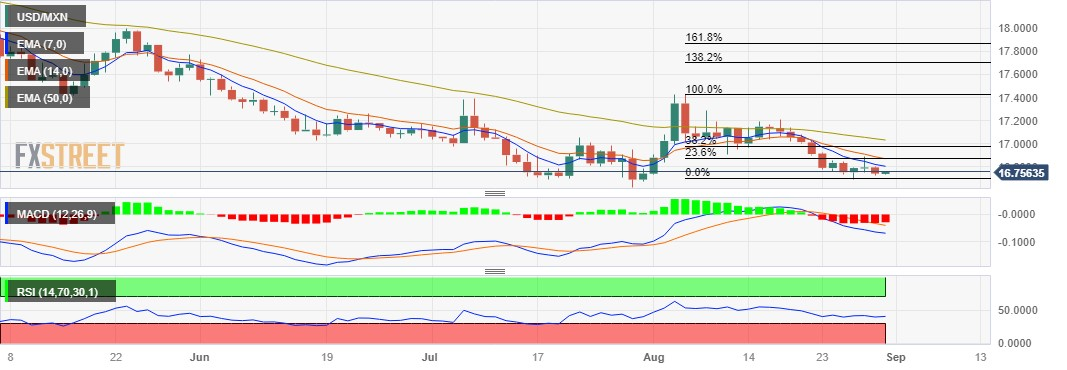
FX option expiries for Aug 31 NY cut at 10:00 Eastern Time, via DTCC, can be found below.
- EUR/USD: EUR amounts
- 1.0800-10 912m
- 1.0825 368m
- 1.0850-65 900m
- 1.0885 358m
- 1.0900 428m
- 1.0925 291m
- 1.0950 401m
- 1.0990 830m
- 1.1025-30(1.1b
- GBP/USD: GBP amounts
- 1.2610 200m
- 1.2785 234m
- USD/JPY: USD amounts
- 145.00-15 565m
- 146.50 926m
- 147.60 359m
- USD/CHF: USD amounts
- 0.8675 500m
- AUD/USD: AUD amounts
- 0.6400 214m
- 0.6600 408m
- USD/CAD: USD amounts
- 1.3560 328m
- EUR/GBP: EUR amounts
- 0.8550 233m
- USD/CHF gains momentum near 0.8795 after the softer Swiss Retail Sales data.
- The pair holds below the 100-hour Exponential Moving Averages (EMAs) with a downward slope.
- The key resistance level emerges at the 0.8800-0.8805 region; the critical support level to watch is at 0.8760.
The USD/CHF pair gains traction around 0.8795 during the early European session on Thursday. The Swiss Franc is weakened against the US Dollar (USD) following the release of Swiss Real Retail Sales. Market participants will shift their attention to the US Core Personal Consumption Expenditure Price Index (PCE) and the weekly Jobless Claims due later in the North American session.
The latest data from the Swiss Federal Statistical Office showed on Thursday that the nation’s Real Retail Sales YoY for July came in at -2.2% from an increase of 1.8% on the previous reading.
According to the one-hour chart, USD/CHF holds below the key 100-hour Exponential Moving Averages (EMAs) with a downward slope, which means the path of least resistance for the pair is to the downside.
That said, the key resistance level for USD/CHF will emerge at the 0.8800-0.8805 region, representing a confluence of the upper boundary of the Bollinger Band, a psychological round figure, and the 100-hour EMA. The additional upside filter is located at 0.8818 (a low of August 28) en route to 0.8854 (a high of August 28) and finally at 0.8875 (a high of August 25).
On the downside, the critical support level to watch is at 0.8760, representing the lower limit of the Bollinger Band and a low of August 24. Further south, the next stop of the USD/CHF pair is located at 0.8700 (a psychological round mark) Any intraday pullback below the latter would expose the next downside stop at 0.8635 (a low of August 13) and 0.8690 (a low of August 10).
It’s worth noting that the Relative Strength Index (RSI) holds in bullish territory above 50, which supports the buyers for the time being.
USD/CHF one-hour chart
-638290606003014936.png)
In an interview with DN on Thursday, Riksbank Governor Erik Thedeen said that the weakness in the Swedish Krona (SEK) is unjustified.
Key quotes
"We are concerned about the development of the crown. It is not good that it is this weak, nor is it justified. The crown is undervalued.”
"There is a lot of talk about the crown, even in the Swedish media, that it is a junk currency. It is not an accurate picture.”
"There are many things that make us very far from a country with a collapsing currency.”
EUR/SEK reaction
The Swedish Krona (SEK) failed to find any comfort in the conciliatory remarks from the Swedish central bank Governor. The EUR/SEK pair jumped above 11.85 in an immediate reaction to his comments, currently trading at 11.8568, up 0.11% on the day.
CME Group’s flash data for natural gas futures markets noted traders scaled back their open interest positions by more than 5K contracts on Wednesday, partially reversing the previous daily build. In the same line, volume dropped for the second consecutive session, now by around 25.4K contracts.
Natural Gas remains capped by $3.00
Prices of natural gas extended the uptrend for the fifth session in a row on Wednesday amidst diminishing open interest and volume. Against that, the continuation of the uptrend appears unlikely in the very near term, exposing some corrective moves instead. In the meantime, the commodity is expected to remain capped by the key $3.00 mark per MMBtu.
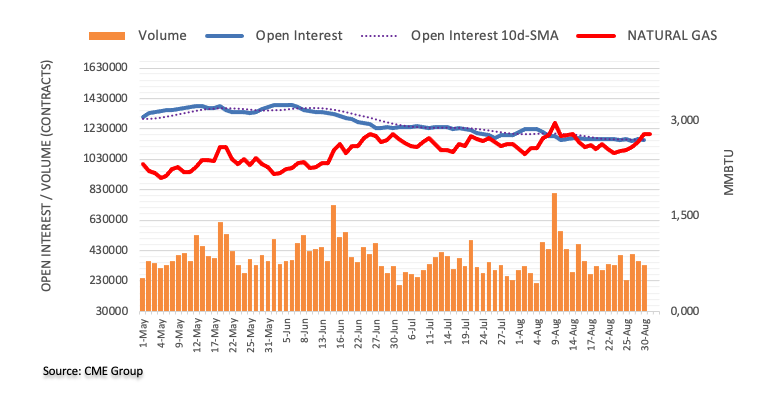
- USD/TRY edges higher around weekly top, struggles to extend two-day uptrend.
- Cautious mood ahead of Fed’s favorite inflation gauge prod Turkish Lira traders.
- CBRTs’ utter hawkish move contrasts with likely end to Fed’s rate hike cycle and test USD/TRY buyers.
- Sellers eyed firmer Turkish Q2 GDP, softer US Core PCE Price Index for August.
USD/TRY clings to mild gains around 26.72 heading into Thursday’s European session as it consolidates last Thursday’s heavy losses, the biggest since December 2021, ahead of the key data from Turkiye and the US. It should be noted, however, that a cautious mood prods the Turkish Lira (TRY) traders.
In doing so, the USD/TRY pair fails to justify the broad-based US Dollar losses amid fears of an end to the Federal Reserve’s (Fed) hawkish cycle, backed by downbeat US data. The reason could be linked to the market’s lack of confidence in the Central Bank of the Republic of Türkiye’s (CBRT) capacity to tame the high inflation in Ankara despite taking tough decisions of late. On the same line could be the US Dollar’s positioning for this week’s top-tier inflation and employment clues.
On the last Thursday, the Turkish central bank CBRT surprised global markets by lifting the benchmark rates to 25%, versus 20% expected and 17.5% previous readings. The move allowed the Lira to mark the biggest daily gain since late 2021. However, the market’s doubt about the credibility of such measures seems to have weighed on the TRY afterward.
On the contrary, the US Dollar Index (DXY) stays defensive at the 200-DMA support while testing the three-day losing streak as traders seek more clues to confirm the dovish bias about the US Federal Reserve.
So far during the week, the early signals for Friday’s Nonfarm Payrolls (NFP), namely the ADP Employment Change, the US second quarter (Q2) Gross Domestic Product (GDP) Annualized and the US Conference Board’s Consumer Confidence figures have exerted downside pressure on the US Dollar.
Amid these plays, the S&P 500 Futures struggle to track Wall Street’s gains amid the market’s anxiety ahead of the key US data. However, the benchmark US 10-year Treasury bond yields remain pressured at the lowest levels in three weeks, around 4.11% by the press time.
Looking forward, the Quarterly Gross Domestic Product from Turkiye, expected 3.5% for the second quarter versus 4.0% prior, will direct immediate moves of the USD/TRY pair. Following that, the Fed’s preferred inflation gauge, namely the US Core Personal Consumption Expenditure (PCE) Price Index for August, expected to remain unchanged at 0.2% MoM but edge higher to 4.2% YoY from 4.1% prior.
Technical analysis
The 21-DMA hurdle of around 26.85 guards the immediate upside of the USD/TRY pair as it awaits the key Turkish/US data. It’s worth noting, however, that the pullback remains elusive beyond the 25.30. That said, the downbeat oscillators and repeated failure to cross the immediate DMA lure the pair sellers.
Open interest in crude oil futures markets dropped by more than 14K contracts after four consecutive daily builds on Wednesday, according to preliminary readings from CME Group. On the other hand, volume increased for the second straight session, now by around 21.1K contracts.
WTI: Initial resistance emerges around $82.00
Prices of WTI rose for the second session in a row and briefly tested multi-day highs around the $82.00 mark per barrel on Wednesday. The daily advance came in tandem with shrinking open interest and suggests that a near term top could have emerged at that level for the time being.
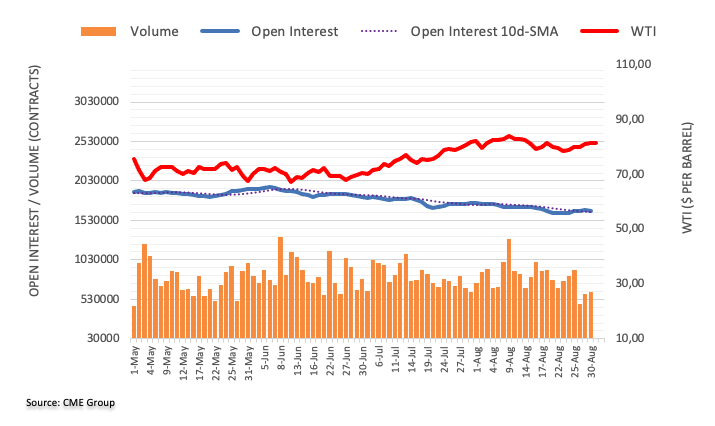
The latest official data released by Destatis showed on Thursday, Germany's Retail Sales fell 0.8% MoM in July versus 0.3% expected and -0.8% previous.
On an annual basis, the bloc’s Retail Sales dropped 2.2% in July versus the expected 1.0% decrease and June’s -1.6% reading.
FX implications
The Euro is extending losses on the downbeat German consumer spending data. At the time of writing, the EUR/USD is dropping 0.10% on the day to trade at 1.0913.
About German Retail Sales
The Retail Sales released by the Statistisches Bundesamt Deutschland is a measure of changes in sales of the German retail sector. It shows the performance of the retail sector in the short term. Percent changes reflect the rate of changes of such sales. The changes are widely followed as an indicator of consumer spending. Positive economic growth is usually anticipated as "bullish" for the EUR, while a low reading is seen as negative, or bearish, for the EUR.
Further upside could prompt GBP/USD to revisit the 1.2800 region in the next few weeks, suggest UOB Group’s Economist Lee Sue Ann and Markets Strategist Quek Ser Leang.
Key Quotes
24-hour view: Yesterday, when GBP was trading at 1.2635, we highlighted that “as long as GBP does not break below 1.2580, it could rise further. However, we were of the view that “there does not appear to be enough momentum for GBP to break the major resistance at 1.2685.” While GBP strengthened as expected, the advance exceeded our expectations considerably. GBP soared to a high of 1.2746 before closing higher by 0.59% (NY close of 1.2719), its biggest 1-day gain in more than a month. Further GBP strength is not ruled out, but there does not appear to be enough momentum for it to reach 1.2800 today (there is a minor resistance at 1.2760). On the downside, if GBP breaks below 1.2655 (minor support is at 1.2685), it would indicate that it is not advancing further.
Next 1-3 weeks: We highlighted yesterday (30 Aug, spot at 1.2635) that “the likelihood of GBP declining further has diminished.” We added, “a breach of 1.2685 would indicate that GBP is likely to trade in a range instead of declining further.” In NY trade, GBP not only broke above 1.2685, it also surged and closed sharply higher by 0.59% (NY close of 1.2719). The rapid increase in momentum suggests that instead of trading in a range, there is a chance for GBP to rise to 1.2800, with a lower possibility of reaching 1.2845. To maintain its current momentum, GBP must not drop below 1.2630 (‘strong support’ level).
Considering advanced prints from CME Group for gold futures markets, open interest increased for the second session in a row on Wednesday, this time by around 5.5K contracts. Volume, instead, shrank by around 34.3K contracts after the previous daily build.
Gold: Next on the upside comes $1987
Gold prices extended the recovery for the third consecutive session and flirted with the $1950 region on Wednesday. The daily uptick was on the back of rising open interest and this is indicative that extra gains appear on the cards in the very near term. That said, the next target of note for the precious metal turns up at the July high of $1987 per troy ounce (July 20).
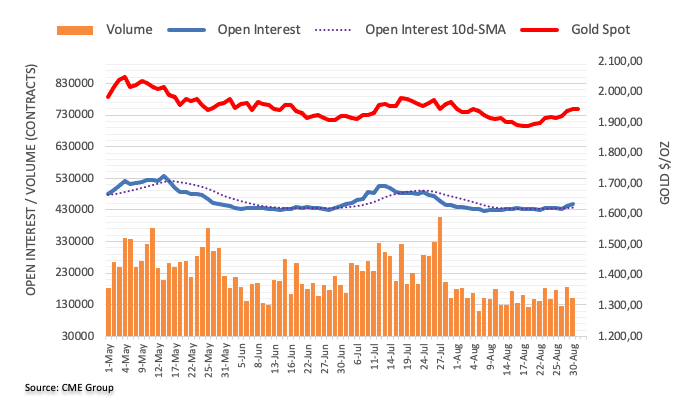
- USD/JPY loses momentum around 145.90, stands above the key 100-hour EMA.
- The Relative Strength Index (RSI) stands in bearish territory below 50.
- The immediate resistance level appears at 146.30; the first support level is located at 145.70.
The USD/JPY pair attracts some sellers during the early European session on Thursday. The major currently trades around 145.90, losing 0.23% on the day. Markets turn cautious ahead of the release of the US Personal Consumption Expenditures (PCE) Price Index, the Federal Reserve (Fed) preferred gauge of inflation.
Furthermore, Bank of Japan (BoJ) Board member Toyoaki Nakamura stated on Thursday that policymakers need more time to transition to monetary tightening. The remark renews hawkish concerns about BoJ and exerts pressure on the USD/JPY pair.
About the data, the Japanese Retail Sales rose by 6.8% YoY in July versus 5.6% prior, better than the expectation of 5.4%. Meanwhile, the nation’s Industrial Production dropped by 2.0% MoM in July from a rise of 2.4% in the previous month, compared to market consensus of a 1.4% drop.
According to the four-hour chart, the USD/JPY pair stands above the key 100-hour Exponential Moving Averages (EMAs) with an upward slope, which supports the buyers for the time being. However, the Relative Strength Index (RSI) stands in bearish territory below 50, indicating that the further downside cannot be ruled out.
The immediate resistance level for USD/JPY appears at 146.30 (the midline of the Bollinger Band). Any meaningful follow-through buying will see a rally to the boundary of the Bollinger Band and a psychological round mark at the 146.90-147.00 region. Further north, the next barrier to watch for USD/JPY is at a Year-To-Date (YTD) high of 147.37, followed by 147.55 (a high of November 2022) and 148.00 (a round figure).
On the flip side, the first support level is located near a lower limit of the Bollinger Band at 145.70. The next contention level is seen at 145.30 (100-hour EMA). Any intraday pullback below the latter would expose the next critical downside stop at 145.00 (a psychological round mark) and finally at 144.55 (a low of August 23).
USD/JPY four-hour chart
-638290580564446025.png)
Bank of Japan (BoJ) Board member Toyoaki Nakamura is back on the wires on Thursday, noting that the “July policy decision wasn't part of any exit from ultra-loose policy.”
Additional comments
I wasn't against making YCC flexible, opposition was about timing.
Don't think July policy move is causing any market turmoil.
Japan's inflation isn't demand driven yet, which is why output gap remains in negative territory.
Japan's economic recovery required for BoJ to consider ending negative rate policy.
Decision on when to end negative rate policy will likely be made looking carefully at economic developments.
If Japan's economy achieves sustained recovery, we won't need ycc but unfortunately Japan's deflationary mindset has not be eradicated yet.
When there is feeling Japan's deflationary mindset is dispelled, we can get rid of YCC but now is not the time.
FX isn't target of monetary policy.
FX moves have big impact on prices.
BoJ will closely watch impact of Yen moves on economy, prices.
FX isn't driven by interest rate differentials alone.
Weak Yen benefits exports and inbound tourism, but is negative for domestic demand-driven firms and households.
Separately, Japan’s NHK broadcaster cited that Japan’s Prime Minister (PM) Fumio Kishida is considering raising the nationwide minimum wage standard to 1,500 yen per hour by the mid-2030s.
Market reaction
USD/JPY was last seen trading at 145.93, losing 0.20% on the day.
In the opinion of UOB Group’s Economist Lee Sue Ann and Markets Strategist Quek Ser Leang, EUR/USD faces sustained gains above 1.0955.
Key Quotes
24-hour view: After EUR rose sharply on Tuesday, we highlighted yesterday that "while overbought, the rapid rise could test 1.0915 before easing." We were of the view that "the major resistance at 1.0955 is highly unlikely to come under threat." We indicated that "support is at 1.0855, followed by 1.0835." EUR then dipped to 1.0853 in London trade before soaring to a high of 1.0945 in NY session. Conditions remain overbought, but there is no sign of easing just yet. Today, EUR could break above 1.0955. In view of the overbought conditions, it might not be able to hold above this level. If EUR breaks the next resistance at 1.1000 today, it would come as a surprise. Support is at 1.0905, followed by 1.0870.
Next 1-3 weeks: Yesterday (30 Aug, spot at 1.0870), we held the view that the recent weakness in EUR has stabilised. We expected EUR to trade with an upward bias, but we indicated that “it remains to be seen if it can break above 1.0955.” We did not quite expect EUR to rise quickly to 1.0945. Upward momentum has increased further, and if EUR breaks and holds above 1.0955, the next level to watch is 1.1000. At this stage, it is premature to expect the formidable resistance at 1.1045 to come into view. Overall, only a breach of 1.0835 (‘strong support’ level was at 1.0805 yesterday) would indicate that the current upward pressure has eased.
- Gold Price remains firmer at multi-day high, lacks follow-through of late.
- Sustained trading beyond key support confluence, dovish bias about Fed keep XAU/USD bulls hopeful.
- Mixed updates from China, US Dollar’s lackluster moves prod the Gold Price upside.
- US Core PCE Price Index becomes crucial to watch for clear directions ahead of NFP.
Gold Price (XAU/USD) holds steady at the highest level in four weeks during a four-day winning streak as market players await the key inflation clues from the US and Eurozone. That said, the recently downbeat US data have raised concerns about the Federal Reserve’s (Fed) policy pivot and bolstered the XAU/USD price. On the same line could be the hopes of witnessing more stimulus from the key customer China. However, the cautious mood ahead of the top-tier data and mixed activity numbers from China prod the Gold buyers hopeful.
Looking ahead, the Eurozone CPI and HICP numbers for August will join the risk catalysts to entertain the XAU/USD traders. However, major attention will be given to the US Core Personal Consumption Expenditure (PCE) Price Index for August, expected to remain unchanged at 0.2% MoM but edge higher to 4.2% YoY from 4.1% prior. Should the US inflation gauge ease, the Gold buyers will seek softer clues from the Nonfarm Payrolls (NFP) to confirm an end to the Fed’s hawkish cycle, which in turn can propel the XAU/USD price.
Also read: Gold Price Forecast: XAU/USD looks to US PCE inflation and 100 DMA for further upside
Gold Price: Key levels to watch
Our Technical Confluence indicator signals that the Gold Price floats firmly beyond the $1,935–36 support confluence, suggesting further upside to track. That said, the stated key support comprises the Pivot Point one-day S1 and Fibonacci 61.8% on one-month.
Also restricting the short-term downside of the XAU/USD is the $1,930 level encompassing the 50-DMA and Pivot Point one-week R1.
Following that, a convergence of the Fibonacci 161.8% on one-day will join the Pivot Point one-day S2 to highlight $1,925 as the last defense of the Gold buyers.
On the flip side, the upper band of the Bollinger on the daily chart and Pivot Point one-day R1 restricts the immediate upside of the Gold Price near $1,950.
More importantly, the 100-DMA and Pivot Point one-day R2, close to $1,957–58, appears a tough nut to crack for the XAU/USD bulls before rushing towards the Fibonacci 23.6% on one-month surrounding $1,970.
Overall, the Gold Price has fewer barriers toward the north but the US inflation data can test the bulls.
Here is how it looks on the tool
About Technical Confluences Detector
The TCD (Technical Confluences Detector) is a tool to locate and point out those price levels where there is a congestion of indicators, moving averages, Fibonacci levels, Pivot Points, etc. If you are a short-term trader, you will find entry points for counter-trend strategies and hunt a few points at a time. If you are a medium-to-long-term trader, this tool will allow you to know in advance the price levels where a medium-to-long-term trend may stop and rest, where to unwind positions, or where to increase your position size.
- USD/RUB edges higher to 96.40 amid the depreciation of the Russian Ruble.
- The Russian Ruble devalued to a 16-month low due to the economic challenge in Russia.
- Markets believe that the Federal Reserve (Fed) might end the tightening policy sooner than expected.
- Traders will monitor US inflation data ahead of the US Nonfarm Payrolls.
USD/RUB gains momentum for the third consecutive day during the early European session on Thursday. The pair currently trades near 96.40, up 0.27% on the day. The Russian Ruble devalued to over 96 against the US Dollar, a 16-month low due to the economic challenge in Russia
Russian President Vladimir Putin stated last week that the economy was expanding again and that wages were increasing. According to Sputnik, Russia has overcome the Federal Republic of Germany to become one of the world's top five in terms of purchasing power parity and economic size.
Furthermore, Finance Minister Anton Siluanov said on Saturday that the Russian economy is forecast to expand by at least 2.5% in 2023, while inflation is anticipated to hover around 6%. He also said that he would cooperate with the Central Bank to implement all necessary steps to reduce inflation to the desired level. It’s worth noting that the Bank of Russia hiked the interest rate by 350 basis points (bps) to 12% on August 15 to halt the ruble's slide amid the the turmoil in Ukraine war.
On the US dollar front, markets believe that the Federal Reserve (Fed) might end its tightening policy sooner than anticipated, even though Federal Reserve (Fed) Chairman Jerome Powell said that a possible further rate rise would be dependent on incoming data. The condition of the labor market may influence the USD's short-term direction and the release of US employment data later this week could trigger market volatility.
Looking ahead, traders will monitor the headlines surrounding Russia’s war in Ukraine. Later in the day, the US Core Personal Consumption Expenditure Price Index (PCE), the weekly Jobless Claims, and the Chicago PMI will be due. The attention will shift to the closely watched US Nonfarm Payrolls on Friday. The US economy is expected to create 170K jobs for August. Traders will take cues from the data and find opportunities around USD/RUB.
- WTI crude oil clings to mild losses at fortnight high, prods two-day winning streak.
- US Weekly crude oil stockpiles mark multi-year high draw, Hurricane Idalia approaches Georgia after roiling Florida.
- China issues highest Typhoon warning for Saola as it approaches Hong Kong.
- Cautious mood ahead of Fed’s favorite inflation gauge, mixed China PMIs allow Oil price to consolidate weekly gains.
WTI crude oil lacks clear directions while making rounds to $81.30–40 heading into Thursday’s European session, snapping a two-day winning streak with mild losses. In doing so, the black gold portrays the market’s cautious mood ahead of the key US inflation and employment clues while ignoring the heavy inventory draw and supply-crunch fears emanating from Hurricane Idalia.
The weekly measure of the US crude oil inventories per the official source the Energy Information Administration (EIA) marked the biggest draw in four weeks after the industry source American Petroleum Institute (API) marked the largest fall since September 2016.
Elsewhere, fears of witnessing a supply crunch and higher energy demand due to Hurricane Idalia in the US and Typhoon Saola in China, also keep the WTI crude oil buyers hopeful. “Hurricane Idalia plowed into Florida's Gulf Coast on Wednesday with howling winds, torrential rains and pounding surf, then weakened as it turned its fury on southeastern Georgia, where floodwaters trapped some residents in their homes,” reported Reuters.
On the other hand, China issued the highest typhoon warning on Thursday, per Reuters, as Typhoon Saola reached the southeastern coastline while challenging Hong Kong and other major manufacturing hubs in the neighboring Guangdong province.
While talking about the mood, the S&P 500 Futures struggle to track Wall Street’s gains amid a cautious mood ahead of the key US data. However, the benchmark US 10-year Treasury bond yields remain pressured at the lowest levels in three weeks, around 4.11% by the press time.
It should be noted that the black gold previously cheered the downbeat US Dollar and hopes of a sooner ending of the hawkish cycle at the major central banks including the Federal Reserve. However, the early-day mixed China data prod the Oil buyers ahead of the top-tier US statistics. That said, China’s official NBS Manufacturing PMI for August rose to 49.7 versus 49.4 expected and 49.3 previous readings whereas the Non-Manufacturing PMI came in as 51.0 compared to 51.5 prior and market forecasts of 51.1.
Looking ahead, the Fed’s preferred inflation gauge, namely the US Core Personal Consumption Expenditure (PCE) Price Index for August, expected to remain unchanged at 0.2% MoM but edge higher to 4.2% YoY from 4.1% prior, will be important for clear directions. Also, headlines about China and the natural calamities due to Idalia and Saola, as well as weather conditions in Europe, will offer a clear guide for the Oil traders.
Technical analysis
Despite the latest hesitance, the WTI crude oil buyers remain hopeful unless the quote stays beyond the 21-DMA level of around $80.90.
- Eurostat will publish the high-impact Eurozone inflation data on Thursday, August 31.
- Headline HICP is set to fall to 5.1% YoY, Core figure to decline to 5.3% in August.
- Eurozone inflation data holds the key for the ECB’s next policy move, rocking the Euro.
“The fight against inflation is not yet won,” European Central Bank (ECB) President Christine Lagarde said at an annual conference of central bankers in Jackson Hole last Friday.
Lagarde added that interest rates in the European Union will need to stay high “as long as necessary” to slow still-high inflation. Therefore, the upcoming Eurozone inflation data will hold the utmost significance in determining the next interest rate move by the ECB.
Money markets are pricing a 51% probability of an ECB rate hike pause at the September meeting. Bloomberg’s world interest rate probabilities (WIRP) suggest odds of a 25 basis points (bps) hike stand near 35% for next month, at 50% for October 26 and top out near 70% for the December 14 meeting.
What to expect in the next European inflation report?
Eurostat will release the preliminary estimate of the Eurozone Harmonized Index of Consumer Prices (HICP) on Thursday, August 31.
The annual Core HICP inflation, the gauge closely watched by the European Central Bank, is seen dropping to 5.3% in August from 5.5% in July. The headline Eurozone Harmonized Index of Consumer Prices is expected to rise 5.1% YoY in August, a slight slowdown from July’s increase of 5.3%.
On a monthly basis, the old continent’s HICP is likely to decline 0.1% in August. The core HICP inflation is foreseen at 0.3% in the reported month when compared to July’s decline of 0.1%.
Inflation in over 20 countries that use the Euro has dropped from a peak of 10.6% last year to 5.3% last month, largely reflecting sharp declines in energy prices. But inflation still remains more than double the ECB’s 2.0% target.
Previewing the August inflation data, TD Securities explains: “While continued soft momentum in food and core goods inflation should put further downside pressure on inflation in Germany and the EZ, the recent surge in oil prices will keep headline inflation from falling much. Services inflation is still key for the ECB though, and here we see another strong m/m print, though base effects should push the y/y rate down a touch.”
Dovish ECB expectations gained traction after activity in the bloc's dominant services industry contracted for the first time this year and the downturn in the manufacturing sector continued, according to the PMI survey’s data. The Eurozone HCOB Manufacturing Purchasing Managers Index (PMI) rose to 43.7 in August when compared to the market forecasts of 42.6 and above the 42.7 seen in July. The index hit a three-month high. However, the Services PMI declined to 48.3 in August from 50.9 in July, hitting a 30-month low and way below the 50.5 estimates.
The European Central Bank remains committed to bringing inflation back to its 2.0% target without causing a recession, which puts the central bank in a tough spot on the interest rate outlook.
As usual, some member states have already published their national inflation figures for August, providing clues over the direction of the whole Eurozone HICP data.
Spain's Consumer Price Index (CPI) rose 2.6% YoY in July, courtesy of higher fuel prices, preliminary data from the National Statistics Institute (INE) showed on Wednesday. The harmonized annual inflation rate climbed to 2.6%, as against the June figure of 2.3% while matching the expected 2.6% figure.
Germany’s headline annual HICP rose 6.4% in August, compared with the 6.5% previous month’s increase and the 6.2% forecast for August.
Since the annual inflation in Germany and Spain barely slowed in August as against expectations, it raises the stakes for an upside surprise in the Eurozone inflation data.
When will the Harmonised Index of Consumer Prices report be released and how could it affect EUR/USD?
Eurozone preliminary HICP is slated for release at 09:00 GMT on Thursday. In the lead-up to the Eurozone inflation showdown, the Euro (EUR) is ranging close to the 1.0800 round level against the US Dollar, as investors prefer to remain on the sidelines. Additionally, the latest hawkish remarks by the US Federal Reserve (Fed) Chairman Jerome Powell at the Jackson Hole Symposium have revived expectations of one more Fed rate hike in 2023, keeping the US Dollar afloat.
A hotter-than-expected headline and core HICP inflation data could reinforce expectations for a September ECB rate hike. In such a scenario, EUR/USD could extend its recovery toward the psychological level of 1.1000. However, if the bloc’s inflation declines at a faster pace than expected, the main currency pair is likely to test the downside near 1.0700.
Dhwani Mehta, Asian Session Lead Analyst at FXStreet, offers a brief technical outlook for the major and explains: “EUR/USD failed to find acceptance above the horizontal 100-Daily Moving Average (DMA) at 1.0925 on a daily closing basis on Wednesday. However, the 14-day Relative Strength Index (RSI) is defending the 50 level, as we head close to the Eurozone inflation data release.”
Dhwani also outlines important technical levels to trade the EUR/USD pair: “Further upside needs validation from the 100 DMA resistance, as Euro bulls look to target the 50 DMA at 1.0971 en-route the 1.1000 level. Alternatively, strong support aligns at the previous day’s low of 1.0855, below which the downside will open up toward the mildly bullish 200 DMA at 1.0814.”
Inflation FAQs
What is inflation?
Inflation measures the rise in the price of a representative basket of goods and services. Headline inflation is usually expressed as a percentage change on a month-on-month (MoM) and year-on-year (YoY) basis. Core inflation excludes more volatile elements such as food and fuel which can fluctuate because of geopolitical and seasonal factors. Core inflation is the figure economists focus on and is the level targeted by central banks, which are mandated to keep inflation at a manageable level, usually around 2%.
What is the Consumer Price Index (CPI)?
The Consumer Price Index (CPI) measures the change in prices of a basket of goods and services over a period of time. It is usually expressed as a percentage change on a month-on-month (MoM) and year-on-year (YoY) basis. Core CPI is the figure targeted by central banks as it excludes volatile food and fuel inputs. When Core CPI rises above 2% it usually results in higher interest rates and vice versa when it falls below 2%. Since higher interest rates are positive for a currency, higher inflation usually results in a stronger currency. The opposite is true when inflation falls.
What is the impact of inflation on foreign exchange?
Although it may seem counter-intuitive, high inflation in a country pushes up the value of its currency and vice versa for lower inflation. This is because the central bank will normally raise interest rates to combat the higher inflation, which attract more global capital inflows from investors looking for a lucrative place to park their money.
How does inflation influence the price of Gold?
Formerly, Gold was the asset investors turned to in times of high inflation because it preserved its value, and whilst investors will often still buy Gold for its safe-haven properties in times of extreme market turmoil, this is not the case most of the time. This is because when inflation is high, central banks will put up interest rates to combat it.
Higher interest rates are negative for Gold because they increase the opportunity-cost of holding Gold vis-a-vis an interest-bearing asset or placing the money in a cash deposit account. On the flipside, lower inflation tends to be positive for Gold as it brings interest rates down, making the bright metal a more viable investment alternative.
- AUD/USD trades higher due to upbeat Australia’s Private Capital Expenditure.
- 23.6% Fibonacci retracement appears to be a barrier following the three-week high at 0.6522.
- MACD indicates improvement in the recent momentum but the pair remains bearish as long as stays below the 50-day SMA.
AUD/USD retraces from the previous day’s losses, trading higher around 0.6480 at the time of writing during the Asian session on Thursday. The pair is experiencing upward support due to the downbeat US Treasury yields and disappointing US economic data.
Additionally, Australia’s upbeat Private Capital Expenditure (Q2) was released on Thursday, contributing support to the AUD/USD pair. The data reported that capital expenditure intentions improved to 2.8%, better than the expected 1.2% figure and 2.4% prior.
The 23.6% Fibonacci retracement at 0.6488 emerges as the immediate resistance, followed by the 0.6500 psychological level. A firm break above the latter could support the AUD/USD pair to explore the area around a three-week high at 0.6522, followed by the 38.2% Fibonacci retracement at 0.6565.
On the downside, the pair could meet the key support around the 21-day Simple Moving Average (SMA) at 0.6474, followed by the nine-day SMA at 0.6445. A break below that level could put pressure on the AUD/USD pair to navigate the region around the 0.6400 psychological level.
The 14-day Relative Strength Index (RSI) remains below 50, which suggests a bearish bias of the AUD/USD traders. The Moving Average Convergence Divergence (MACD) line remains below the centerline; however, it indicates a divergence above the signal line. This divergence indicates an improvement in recent momentum.
In the short term, the underlying trend exhibits a bearish outlook as long as the AUD/USD pair stays below the 50-day EMA at 0.6610.
AUD/USD: Daily Chart
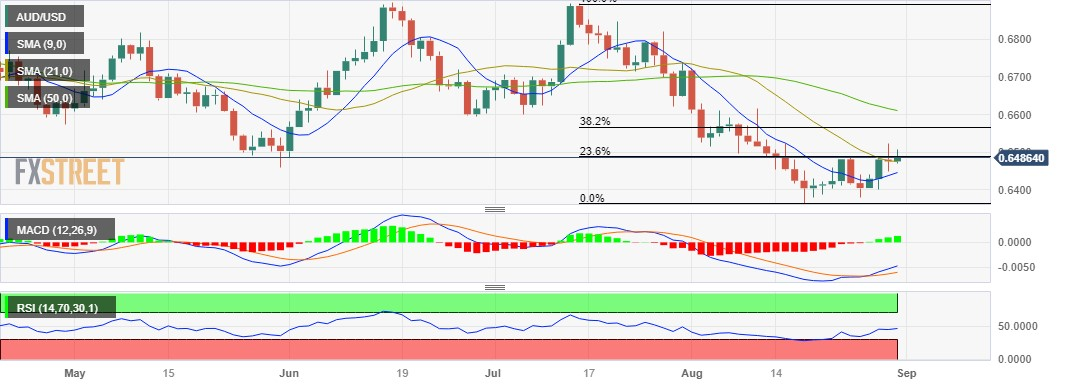
- GBP/USD oscillates in a narrow band just below a one-week high touched on Wednesday.
- A modest USD rebound from the 200-day SMA is seen acting as a headwind for the major.
- Bets for more rate hikes by the BoE continue to underpin the GBP and limit the downside.
- Traders now look to BoE's Pill for a fresh impetus ahead of the US PCE Price Index data.
The GBP/USD pair consolidates its weekly gains registered over the past three days and seesaws between tepid gains/minor losses through the Asian session on Thursday. Spot prices currently trade around the 1.2720 region, nearly unchanged for the day and just a few pips below a one-week high touched on Wednesday.
The US Dollar (USD) finds some support near a technically significant 200-day Simple Moving Average (SMA) and for now, seems to have stalled its recent pullback from the highest level since early June. This, in turn, is seen as a key factor acting as a headwind for the GBP/USD pair, though the prospects for further interest rate hikes by the Bank of England (BoE) might continue to lend support to the British Pound and warrant caution for bearish traders.
In fact, BoE Deputy Governor Ben Broadbent, speaking at the Jackson Hole Symposium on Saturday, said that policy rates may well have to remain in restrictive territory for some time as the knock-on effects of the surge in prices were unlikely to fade away rapidly. Apart from this, expectations that the Federal Reserve (Fed) will pause its rate-hiking cycle in September might cap the USD and contribute to limiting the downside for the GBP/USD pair.
Investors now seem convinced that the US central bank will soften its hawkish stance and the bets were lifted by the disappointing US macro data released on Wednesday. The ADP report showed that the US private-sector employers added 177K jobs in August, much lower than the previous month's downwardly revised reading of 324K. Moreover, the US Q2 GDP growth rate was also lowered to a 2.1% annualized pace from the 2.4% estimated orignally.
The aforementioned fundamental backdrop suggests that the path of least resistance for the GBP/USD pair is to the upside, though traders seem reluctant and look to a scheduled speech by BoE Chief Economist Huw Pill. Later during the early North American session, the release of the US Core PCE Price Index – the Fed's preferred inflation gauge – will influence the USD price dynamics and allow traders to grab short-term opportunities around the pair.
Technical levels to watch
- Asian stock markets trade mixed on Thursday ahead of the US inflation data.
- Chinese Manufacturing and Service PMI deteriorated further in August.
- Bank of Japan (BoJ) policymaker said that they need more time to transition to monetary tightening.
- Investors will focus on the US inflation and labor data later in the day.
Asian stock markets trade mixed on Thursday as investors await the Personal Consumption Expenditures (PCE) Price Index, the Federal Reserve's preferred gauge of inflation ahead of the highly anticipated Nonfarm Payrolls for August. At press time, China’s Shanghai is down 0.60% to 3,117, the Shenzhen Component Index falls 0.44% to 10,416, Hong Kong’s Hang Sang declines 2.02% to 18,401, South Korea’s Kospi is down 0.43% and Japan’s Nikkei is up 0.77%.
In China, manufacturing activity and the services sector deteriorated further this month, which is likely to put more pressure on authorities to move forward with stimulus measures to revive the economy. The National Bureau of Statistics (NBS) showed on Thursday that the Chinese Manufacturing Purchasing Managers' Index (PMI) improved to 49.7 in August from 49.3 in July, but below the market consensus of 49.4. This is the fifth consecutive month that the figure came in below the 50 threshold, which indicates the contraction zone. Meanwhile, the NBS Services PMI decreased to 51.0 51.5 prior and the expectation was at 51.1.
Earlier on Thursday, the People’s Bank of China (PBOC) announced that they will continue to increase loans to private enterprises as part of their efforts to stimulate the private sector economy.
In Japan, Bank of Japan (BoJ) Board member Toyoaki Nakamura stated on Thursday that policymakers need more time to transition to monetary tightening. The data from the Japanese docket showed that Retail Sales rose by 6.8% YoY in July versus 5.6% prior, better than the expectation of 5.4%. While, Industrial Production dropped by 2.0% MoM in July from a rise of 2.4% in the previous month, compared to market consensus of a 1.4% drop.
On the Indian front, India’s annual Gross Domestic Product (GDP) for the first quarter will be released later on Thursday. The growth number is expected to grow by 7.7% compared to the previous reading of 6.1%.
Looking ahead, the US Core Personal Consumption Expenditure Price Index (PCE), the weekly Jobless Claims, and the Chicago PMI will be released later in the day. On Friday, market participants will closely watch the release of Chinese Caixin Manufacturing PMI for August and the US Nonfarm Payrolls data.
- EUR/USD consolidates its recent gains to over a two-week high touched on Wednesday.
- The USD stalls its recent decline near the 200-day SMA support and acts as a headwind.
- The downside seems cushioned as traders await the release of the US PCE Price Index.
The EUR/USD pair oscillates in a narrow trading band through the Asian session on Thursday and consolidates its recent gains to a two-and-half-week high touched the previous day. Spot prices currently trade below mid-1.0900s and remain at the mercy of the US Dollar (USD) price dynamics.
The USD Index (DXY), which tracks the Greenback against a basket of currencies, finds some support near the very important 200-day Simple Moving Average (SMA) and for now, seems to have stalled its recent pullback from a nearly three-month high. This, in turn, is seen as a key factor acting as a tailwind for the EUR/USD pair, though expectations that the Federal Reserve (Fed) will pause its rate-hiking cycle should keep a lid on any meaningful upside for the buck and help limit the downside.
Investors now seem convinced that the US central bank will soften its hawkish stance and the bets were lifted by the disappointing US macro data released on Wednesday. In fact, the ADP reported that the US private-sector employers added 177K jobs in August, much lower than the previous month's downwardly revised reading of 324K. Adding to this, the second estimate showed that the US economy grew by 2.1% annualized pace in the second quarter as compared to the 2.4% original readout.
The shared currency, on the other hand, might continue to draw support from reviving bets for more interest rate hikes by the European Central Bank (ECB). The bets were lifted by the latest consumer inflation figures from Germany on Wednesday, which showed that the annual Harmonised Index of Consumer Prices (HICP) rose 6.4% in August as compared to 6.2% expected. Adding to this, the core inflation rate, which excludes volatile items such as food and energy, remained unchanged from July.
The aforementioned fundamental backdrop supports prospects for the emergence of some dip-buying around the EUR/USD pair and warrants some caution before confirming that the recent bounce from the lowest level since June 13 has run out of steam. Market participants now look forward to the US economic docket, featuring the release of the Core PCE Price Index – the Fed's preferred inflation gauge – and the Weekly Initial Jobless Claims, later during the early North American session.
The data, along with the US bond yields and the broader risk sentiment, will drive the USD demand and provide some impetus to the EUR/USD pair. The focus, however, will remain glued to closely-watched US monthly employment details, popularly known as the NFP report on Friday.
Technical levels to watch
- EUR/SEK struggles to defend the previous day’s corrective bounce off weekly low.
- Bearish chart formation, likely disappointment from Eurozone inflation keep Krona buyers hopeful.
- Sellers need validation from 11.77, 200-SMA and EU HICP data for August.
EUR/SEK remains sidelined as buyers poke the 100-SMA hurdle heading into Thursday’s European session. In doing so, the Swedish Krona (SEK) pair edges higher around 11.85 as markets await the key Eurozone inflation data amid fears of witnessing a sooner policy pivot from the European Central Bank (ECB).
As a result, the first readings of the Eurozone Consumer Price Index (CPI) for August will join the ECB’s favorite inflation gauge, namely the Harmonized Index of Consumer Prices (HICP), to direct intraday moves of the EUR/SEK pair.
Given the recent challenges for the global central bankers, a surprise positive in the inflation numbers may allow the EUR/SEK to cross the immediate 100-SMA hurdle of 11.85.
Following that, a seven-week-old previous support line surrounding 11.93 and the double tops around 11.96 will test the Swedish Krona (SEK) sellers before directing them to the 12.00 threshold.
On the flip side, a clear break of the previous weekly low surrounding 11.77 will confirm the “double tops” bearish chart formation suggesting the theoretical slump toward 11.58. However, the 200-SMA level of around 11.71 may act as an intermediate halt during the theoretically expected fall.
EUR/SEK: Four-hour chart
Trend: Further downside expected
- USD/INR hovers around 82.60 ahead of India’s economic data release.
- India’s GDP is expected to have grown by 7.7% for the April-June quarter.
- Soft US data and declining US bond yields continue to put pressure on US Dollar (USD).
USD/INR consolidates around 82.60 during the Asian session on Thursday as market participants prepare for upcoming data releases from India and the United States (US). As said, India’s Gross Domestic Product (GDP) is set to be released later in the day. On the US docket, notably the Personal Consumption Expenditures (PCE) and Initial Jobless Claims (Aug 25) will be released during the North American session.
Investors will likely monitor these datasets to have a clearer insight into shaping the strategies before placing fresh bets on the USD/INR pair. According to a Reuters poll, India's GDP for the April-June quarter is anticipated to have grown by 7.7%. This rate of expansion is deemed the fastest annual pace in a year, attributed to robust growth in the service sector, higher demand and elevated government spending.
The USD/INR pair exhibited strength in previous sessions, yet it trimmed some of its gains due to the optimistic sentiment prevailing in the Asian regional markets. This sentiment was influenced by China's economic stimulus measures and disappointing economic data from the US. Chinese authorities have recently expressed their disapproval of complaints made by US Commerce Secretary Gina Raimondo regarding challenges faced by American companies operating in China.
US Dollar Index (DXY) is struggling to break a three-day period of losses and is currently trading around 103.10 as of the time of writing. On Wednesday, the DXY marked its two-week low below 103.00 level. The Greenback experiences losses, primarily due to downbeat US economic data and the decreasing yields on US Treasury bonds. In the previous session, the yield on a 10-year US bond dropped to a low of 4.08% and is presently trading at 4.11%.
Following the recent soft Job Openings data from the previous Tuesday, the August ADP National Employment reported a hiring figure of 177K jobs added to the economy. This contrasts with the expected 195K and the 371K jobs added in July. Preliminary Gross Domestic Product (GDP) declined to 2.1% from the previous reading of 2.4%, which was expected to remain consistent.
- USD/CAD bounces off weekly low to prod three-day losing streak.
- Oil price retreats as market prepares for top-tier US data, China PMI, stimulus fail to impress optimists.
- Downbeat US data suggest Fed policy pivot but US Core PCE Price Index, NFP need to confirm the dovish bias.
- Canada Current Account, mid-tier US activity, employment data also eyed for clear directions.
USD/CAD picks up bids to extend the early Asian session rebound from the weekly low as markets brace for Thursday’s top-tier US inflation clues. Even so, the Loonie pair buyers lack confidence around 1.3535 by the press time. Apart from the pre-data consolidation, a pullback in Canada’s main export item, namely WTI crude oil also puts a floor under the prices after a three-day losing streak.
That said, the WTI crude oil reverses from a two-week high while snapping a two-day winning streak with mild losses near $81.30. In doing so, the black gold fails to cheer the price-positive weekly inventory from the US, as well as the softer US Dollar, amid mixed China PMI data and stimulus updates.
Earlier in the day, China’s official NBS Manufacturing PMI for August rose to 49.7 versus 49.4 expected and 49.3 previous readings whereas the Non-Manufacturing PMI came in as 51.0 compared to 51.5 prior and market forecasts of 51.1. Following that, the People’s Bank of China (PBOC) announced on Thursday that it “will continue to step up loans to private companies,” in other efforts to boost the private sector economy.
On the other hand, the US Dollar Index (DXY) remains pressured at 103.10, poking the 200-DMA support while struggling to defend the previous three-day losing streak, as traders seek more clues to confirm the dovish bias about the US Federal Reserve.
The disappointment from initial signals of Friday’s Nonfarm Payrolls (NFP) also lured the USD/JPY bears as the ADP Employment Change dropped to 177K compared to 195K market forecasts and 371K previous readings (revised from 324K). On the same line, the second readings of the US second quarter (Q2) Gross Domestic Product (GDP) Annualized declined to 2.1% from 2.4% initial forecasts while the GDP Price Index also eased to 2.0% versus the first readings of 2.2%. Further, the preliminary readings of the Personal Consumption Expenditures (PCE) Prices also edged lower to 2.5% from 2.6% prior estimations for the said period. Previously, the US Consumer Confidence and activity data, as well as the housing market numbers, favored dovish calls about the US central bank and weighed on the US Dollar.
Against this backdrop, the S&P 500 Futures struggle to track Wall Street’s gains amid a cautious mood ahead of the key US data. However, the benchmark US 10-year Treasury bond yields remain pressured at the lowest levels in three weeks, around 4.11% by the press time.
Looking ahead, the Fed’s preferred inflation gauge, namely the US Core Personal Consumption Expenditure (PCE) Price Index for August, expected to remain unchanged at 0.2% MoM but edge higher to 4.2% YoY from 4.1% prior, will be important for clear directions. Additionally, Canada's Current Account Balance and the mid-tier US data about employment and manufacturing activity will also be important to watch for clear directions.
Technical Analysis
USD/CAD rebound appears elusive unless it provides a daily closing beyond the 10-DMA hurdle of around 1.3560.
- Gold price gains positive traction for the fourth straight day and stands tall near a multi-week top.
- Bets that the Federal Reserve will pause in September weigh on the US Dollar and lend support.
- Looming recession risks further benefit the safe-haven XAU/USD; a positive risk tone cap gains.
Gold price attracts some buying for the fourth successive day on Thursday and climbs back above the $1,945 level during the Asian session, closer to a four-week high touched the previous day. The XAU/USD might now look to build on its recovery from the lowest level since March 13, around the $1,885 region touched last week.
The US Dollar (USD) languishes near a two-week low touched in the aftermath of the disappointing macro data from the United States (US) released on Wednesday and turns out to be a key factor acting as a tailwind for the Gold price. In fact, Automatic Data Processing (ADP) reported that the US private sector employers added 177K jobs in August, much lower than the previous month's downwardly revised reading of 324K and missing expectations for a reading of 195K. Adding to this, the second estimate showed that the US economy expanded by a 2.1% annualized pace in the second quarter against the 2.4% growth reported originally.
Against the backdrop of a fall in the Conference Board's Consumer Confidence Index from 114.0 to 106.1 in August, the data reaffirms market expectations that the Federal Reserve (Fed) will pause its rate-hiking cycle in September. This continues to exert some pressure on the US Treasury bond yields, which keeps the USD bulls on the defensive and benefits the non-yielding Gold price. Apart from this, worries about a deeper global economic downturn further seem to lend additional support to the safe-haven precious metal, though a positive risk tone might keep a lid on any further gains, at least for the time being.
Traders might also prefer to move to the sidelines ahead of the release of the US PCE Price Index – the Fed's preferred inflation gauge – later during the early North American session. The markets are still pricing in the possibility of a 25 basis points (bps) lift-off by the US central bank in 2023. Hence, the data will influence expectations about the Fed's rate-hike path, which, in turn, will drive the USD demand and provide a fresh impetus to the US Dollar-denominated Gold price. Barring any positive surprise from the US inflation data, the fundamental backdrop suggests that the path of least resistance for the XAU/USD is to the upside.
Technical levels to watch
- EUR/JPY takes offers to refresh intraday high while reversing from multi-year high.
- Nine-week-old ascending resistance line restricts immediate upside amid sluggish MACD.
- Convergence of 10-DMA, monthly support line joins upbeat RSI to keep buyers hopeful.
- Upbeat Eurozone CPI, HICP data for August can bolster hawkish bias about ECB and restore upside.
EUR/JPY reveres from the highest level since 2008 as it braces for the Eurozone inflation data for August during early Thursday. In doing so, the cross-currency pair takes a U-turn from a nine-week-long rising resistance line while refreshing the intraday low to 159.30 by the press time.
That said, the first readings of the Eurozone Consumer Price Index (CPI) for August will join the European Central Bank’s (ECB) favorite inflation gauge, namely the Harmonized Index of Consumer Prices (HICP), to direct intraday moves. Given the recent challenges for the global central bankers, a surprise positive in the inflation numbers may allow the EUR/JPY to refresh the multi-year high.
It’s worth noting that the sluggish MACD signals raise doubts about the pair’s further upside and hence downbeat outcomes from the inflation cues won’t hesitate to drag the quote toward the 158.50 support confluence including the 10-DMA and an ascending support line from late July.
However, the RSI (14) appears firmer, not overbought, which in turn joins the Bank of Japan’s (BoJ) dovish bias to put a floor under the EUR/JPY prices near 158.50, a break of which will challenge the previous weekly high of around 156.85.
Above all, the pair buyers remain hopeful unless they witness a clear downside break of a four-month-old rising support line, close to 153.70 at the latest.
On the flip side, the EUR/JPY pair’s recovery needs validation from the aforementioned nine-week-old rising resistance line, close to the 159.80 level, as well as the 160.00 threshold.
Following that, the June 2008 low of around 161.75 will be in the spotlight.
EUR/JPY: Daily chart
Trend: Limited downside expected
| Raw materials | Closed | Change, % |
|---|---|---|
| Silver | 24.612 | -0.4 |
| Gold | 1942.376 | 0.27 |
| Palladium | 1231.4 | -0.85 |
- AUD/JPY trades in positive territory for the fifth consecutive day on Thursday.
- Australian Private Capital Expenditure Q2 rose 2.8% versus 2.4% prior.
- Japanese Retail Sales rose by 6.8% YoY in July versus 5.6% prior, better than the expectation of 5.4%.
- Australian S&P Global Manufacturing PMI, Japanese Jibun Bank Manufacturing PMI will be due on Friday.
The AUD/JPY cross gains momentum above the mid-94.00s during the Asian trading hours on Thursday. The cross currently trades near 94.74, up 0.04% on the day. The monetary policy gap between the US and Japan is still the factor behind the yen's weakness.
The Australian Bureau of Statistics revealed on Thursday that the nation’s Private Capital Expenditure for the second quarter rose 2.8% from 2.4% previous reading. The figure came in better than the expectation of 1.2%. Meanwhile, the Private Sector Credit MoM expanded by 0.3% against the previous month of 0.2% and matched the market consensus of 0.3%. The Aussie is firmer against the Japanese Yen despite the mixed Australian reading.
The latest data from Japan’s Ministry of Economy, Trade and Industry reported that Retail Sales rose by 6.8% YoY in July versus 5.6% prior, better than the expectation of 5.4%. On the other hand, Industrial Production dropped by 2.0% MoM in July from a rise of 2.4% in the previous month, compared to market consensus of a 1.4% drop.
The Bank of Japan (BoJ) Governor Kazuo Ueda stated at a Federal Reserve symposium on Saturday that the central bank considers underlying inflation remain below its target and will therefore maintain the current ultra-loose monetary policy framework. According to policymakers, domestic demand is still robust and corporate fixed-investment is fueled by record high profits. However, the monetary policy differential between the US and Japan is the main driver of the Yen's weakening.
Looking ahead, the Australian S&P Global Manufacturing PMI for August and the Japanese Jibun Bank Manufacturing PMI will be released on Friday. Traders will take cues from these data and find trading opportunities around the AUD/JPY cross.
- GBP/JPY trades lower around 185.60 on the back of upbeat Japan’s retail data.
- Pound Sterling (GBP) could experience gains due to the BoE's support for the hawkish stance.
- Investors turn cautious as they expect the BoJ to maintain its dovish stance.
GBP/JPY retreats from the previous gains, currently trading lower around 185.60 during the Asian session on Thursday. The pair is facing downward pressure due to the upbeat Japan’s economic data. As said, Large Retailer Sales for July improved to 6.0% from the previous 4.1% figure. While Retail Trade (YoY) for the said month, rose to 6.8%, against the market consensus of 5.4% swinging from the 5.6% prior.
However, the GBP/JPY pair enjoyed upward strength during the week due to the support for the hawkish stance by the Bank of England (BoE) Deputy Governor Ben Broadbent. Broadbent emphasized the need for higher rates due to the wage pressure at the Jackson Hole Symposium.
On the other hand, the Bank of Japan (BoJ) is expected to maintain its ultra-loose monetary policy settings. This stance could potentially deter sellers from making aggressive bets around the pair. Additionally, BoJ Governor Kazuo Ueda stated last week that the underlying inflation in Japan is slightly below the 2% target. This suggests that the central bank might maintain the dovish approach until the next summer.
The decline in US Treasury yields persists, leading to a weakening of the US Dollar (USD). Consequently, this trend is bolstering the Japanese Yen (JPY), which could contribute to putting pressure on the GBP/JPY pair. The yield on a 10-year US bond reached a low point of 4.08% during the previous session, and it is currently trading at 4.11%.
- USD/JPY reverses the previous day’s rebound from weekly low, prods three-week-old rising support line.
- BoJ’s Nakamura confirms government updates announcing victory over deflation.
- Japan official flagged economic fears via downbeat industrial production forecasts but expects improvement in August.
- Disappointing run of US data advocates Fed policy pivot but confirmation needed from US Core PCE Price Index, NFP.
USD/JPY sellers return to the table, after a brief absence the previous day, as market players expect the Bank of Japan’s (BoJ) exit from the ultra-easy monetary policies. That said, the Yen pair drops to 145.80 as it reverses the previous day’s rebound from a three-week-old ascending support line amid very early Thursday morning in Europe.
It’s worth noting that the latest comments from BoJ Board Member Toyoaki Nakamura renew the hawkish concerns about the BoJ and weigh on the USD/JPY price, especially amid the growing acceptance of the Federal Reserve’s (Fed) policy pivot. “Japan's economy is no longer in deflation but the deflationary mindset is yet to be eradicated,” said BoJ’s Nakamura.
Apart from the hawkish BoJ concerns, mixed comments from Japan’s government officials about the industrial production conditions also seem to have exerted downside pressure on the USD/JPY price. “Japan government official stated that the factory output in August has undershot risk due to global economic downturn,” reported Reuters.
Elsewhere, US Dollar Index (DXY) remains pressured at 103.10, poking the 200-DMA support while struggling to defend the previous three-day losing streak. That said, the S&P 500 Futures struggle to track Wall Street’s gains amid a cautious mood ahead of the key US data. However, the benchmark US 10-year Treasury bond yields remain pressured at the lowest levels in three weeks, around 4.11% by the press time.
It should noted that the disappointment from initial signals of Friday’s Nonfarm Payrolls (NFP) also lured the USD/JPY bears as the ADP Employment Change dropped to 177K compared to 195K market forecasts and 371K previous readings (revised from 324K). On the same line, the second readings of the US second quarter (Q2) Gross Domestic Product (GDP) Annualized declined to 2.1% from 2.4% initial forecasts while the GDP Price Index also eased to 2.0% versus the first readings of 2.2%. Further, the preliminary readings of the Personal Consumption Expenditures (PCE) Prices also edged lower to 2.5% from 2.6% prior estimations for the said period.
Previously, the US Consumer Confidence and activity data, as well as the housing market numbers, favored dovish calls about the US central bank and weighed on the US Dollar.
Looking ahead, the Fed’s preferred inflation gauge, namely the US Core Personal Consumption Expenditure (PCE) Price Index for August, will be crucial to aptly predict the USD/JPY Price moves. That said, the US Core PCE Price Index for August, expected to remain unchanged at 0.2% MoM but edge higher to 4.2% YoY from 4.1% prior, will be important to watch for intraday directions amid the Fed policy pivot concerns.
Technical analysis
A three-week-old rising support line, close to 145.80 by the press time, restricts the immediate downside of the USD/JPY pair but the recovery will be elusive unless the quote stays below 146.50.
- Natural Gas price consolidates the recent gains to a three-week high touched this Thursday.
- The technical setup favours bullish traders and supports prospects for further near-term gains.
- Pullbacks towards the $2.80-75 area could be seen as a buying opportunity and remain limited.
Natural Gas price touches a three-week high, around the $2.9220 area during the Asian session on Thursday, albeit lacks follow-through buying and now seems to have entered a bullish consolidation phase.
From a technical perspective, the recent goodish rebound from the vicinity of the 100-day Simple Moving Average (SMA), which coincided with the lower end of an ascending channel extending from the June swing low, favour bullish traders. Furthermore, oscillators on the daily chart are holding comfortably in the positive territory and support prospects for an extension of the recent rally witnessed over the past week or so.
That said, any subsequent move up is likely to confront some hurdle near the very important 200-day SMA, currently pegged just above the $3.0000 psychological mark. A sustained strength beyond the said handle will reaffirm the positive outlook and lift the XNG/USD towards the trend-channel barrier, around the $3.2450-$3.2500 region, which if cleared will be seen as a fresh trigger for bulls and pave the way for additional gains.
On the flip side, any meaningful pullback might now be seen as a buying opportunity and remain limited near the $2.8000-$2.7500 horizontal zone. Some follow-through selling, however, might expose the aforementioned confluence support, around the $2.600 area. Some follow-through selling below the latter will confirm the trend-channel breakdown and shift the near-term bias in favour of bearish traders.
XNG/USD daily chart
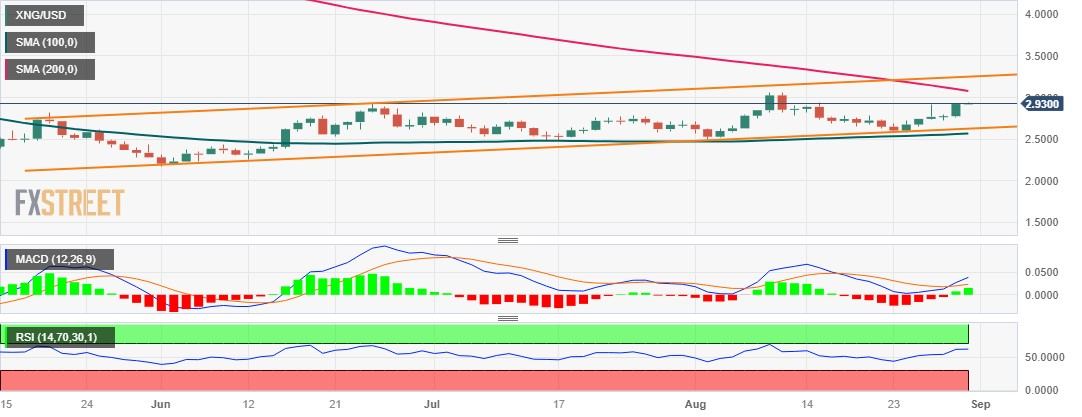
The People’s Bank of China (PBOC) announced on Thursday that it “will continue to step up loans to private companies,” in other efforts to boost the private sector economy.
Additional takeaways
Will use stocks, bonds to deal with risks of private property developers in a prudent manner.
Will encourage and guide institutional investors to buy bonds of private firms.
Will support IPO and refinancing of private firms.
Beijing on Sunday announced halving the stamp duty on stock trades, the first cut to the tax since 2008, to boost investor sentiment.
Related reads
- USD/CNH Price Analysis: Yuan buyers attack 7.2880–60 confluence on upbeat China NBS Manufacturing PMI
- China's NBS Manufacturing PMI improves to 49.7 in August vs. 49.4 expected
- USD/CNH takes offers to reverse the previous day’s recovery moves, the first in three.
- China NBS Manufacturing PMI improves, Non-Manufacturing PMI eases in August.
- Convergence of 100-SMA, three-week-old rising support line restricts immediate downside.
- Yuan bears need validation from 7.3050 to challenge yearly top.
USD/CNH reverses the previous daily gains, the first in three, while poking the 7.2880-60 support confluence after China release monthly activity data on Thursday.
The upbeat prints of China’s officials manufacturing gauge contrasts with the downbeat non-manufacturing PMI but manages to keep the offshore Chinese Yuan (CNH) buyers hopeful, especially amid the dovish Fed bias and hopes of more stimulus from the Dragon Nation. That said, China’s official NBS Manufacturing PMI for August rose to 49.7 versus 49.4 expected and 49.3 previous readings whereas the Non-Manufacturing PMI came in as 51.0 compared to 51.5 prior and market forecasts of 51.1.
However, a convergence of the 100-SMA and an ascending trend line from August 10, restricts immediate downside of the USD/CNH pair.
Given the quote’s repeated attempt to break the 100-SMA and the stated support line confluence, around 7.2880-60, coupled with the downbeat US Dollar, the USD/CNH is likely to slip beneath the said key support, which in turn highlights a five-week-long support line of 7.2790.
In a case where the USD/CNH drops below 7.2790, it’s slump to the August 08 swing high of around 7.2510 and then to the 200-SMA level of near 7.2350 can’t be ruled out.
Meanwhile, the offshore Yuan pair’s recovery remains elusive unless it crosses a one-week-old descending resistance line, close to 7.3050 by the press time.
Following that, 7.3360 may act as an intermediate halt before directing the USD/CNH prices toward the yearly peak of 7.3496.
USD/CNH: Four-hour chart

Trend: Further downside expected
- NZD/USD regains positive traction on Thursday and is supported by a weaker USD.
- Expectations for an imminent pause in the Fed's rate-hiking cycle weigh on the buck.
- The mixed Chinese PMIs fail to impress traders or provide any meaningful impetus.
The NZD/USD pair attracts some dip-buyers near the 0.5945-0.5940 area during the Asian session on Thursday and for now, seems to have stalled the overnight pullback from the 0.6000 psychological mark, or a nearly three-week high. Spot prices touch a fresh high, around the 0.5975 region in the last hour, though lack follow-through and react little to the mixed Chinese macro data.
The official PMI showed that business activity in China's manufacturing sector registered a slight improvement in August, though remained in contraction territory for the fifth successive month in August. Moreover, growth in the Non-Manufacturing sector eased more than anticipated during the reported month. The rather unimpressive figures do little to ease concerns about the worsening economic conditions in China or provide any impetus to antipodean currencies, including the New Zealand Dollar (NZD).
That said, a weaker tone surrounding the US Dollar (USD) continues to act as a tailwind for the NZD/USD pair, at least for the time being. It is worth recalling that the USD Index (DXY), which tracks the Greenback against a basket of currencies, fell to a nearly two-week low on Wednesday following the disappointing release of US data. The ADP reported that Private sector employment in the US rose by 177K in August against the 195K anticipated and the previous month's downwardly revised reading of 324 K.
Adding to this, the second estimate of the US Q2 GDP print showed that the world's largest economy grew by a 2.1% annualized pace as compared to the 2.4% expansion reported originally. This comes on the back of a fall in the Conference Board's Consumer Confidence Index to 106.1 in August from 114.0 in July and lift expectations that the Federal Reserve (Fed) will pause its rate-hiking cycle in September. The repricing of the Fed's rate-hike path leads to the overnight downfall in the US Treasury bond yields, which keeps the USD bulls on the defensive for the fourth straight day and lends some support to the NZD/USD pair.
The upside potential, however, seems limited as traders might refrain from placing aggressive best ahead of the release of the US Core PCE Price Index – the Fed's preferred inflation gauge. This will be accompanied by the usual Weekly Initial Jobless Claims data, which might influence the USD price dynamic and produce short-term trading opportunities around the NZD/USD pair. The focus will then shift to the US monthly jobs report – NFP – on Friday.
Technical levels to watch
Bank of Japan (BoJ) Board member Toyoaki Nakamura said on Thursday, the central bank “needs more time to shift to monetary tightening.”
Additional comments
Must scrutinize whether small, midsize firms are making progress in earning enough profits to sustain wage rises.
Tightening monetary policy before rise in sales prices lead to wage gains would curb demand, weigh on companies' ability to earn profits.
Tweak to monetary policy needs scrutinty of economic conditions, cautious approach.
Sustainable, stable achievement of price target yet to be foreseen.
Japan's economy recovering moderately.
Japan's economy likely to recover moderately.
Sustainability of wage rises, overseas economic developments among uncertainties surrounding Japan's economic outlook.
Market reaction
Cautious comments from the BoJ policymakers fail to have any negative impact on the Yen. At the press time, USD/JPY is losing 0.27% on the day to trade at 145.78.
- USD/CHF loses steam below the 0.8800 barrier on Thursday.
- Markets are now pricing near 40% a rate hike in November and will cut the rate in June 2024.
- The softer Swiss data capped the upside of the Swiss Franc.
- The annual Swiss Consumer Price Index (CPI), US Nonfarm Payrolls will be in the spotlight.
The USD/CHF pair loses its recovery momentum and holds below the 0.8800 mark during the early Asian trading hours on Thursday. Meanwhile, the US Dollar Index (DXY), a measure of the value of USD against six other major currencies, loses momentum and hovers around 103.00. At the time of writing, the USD/CHF is trading at 0.8772, losing 0.14%.
Automatic Data Processing, Inc. reported on Wednesday that the US ADP Employment Change dropped to 177K in August from 371K in July and came in below the market expectation of 195K. Additionally, the first estimate of Personal Consumption Expenditures (PCE) Prices in Q2 fell to 2.5% versus 2.6% prior. Finally, the second estimate of Gross Domestic Product (GDP) Annualised Q2 decreased to 2.1% from the first estimation of 2.4%.
According to the CME FedWatch tool, markets are now pricing near 40% a rate hike in November and will cut the rate in June 2024. Markets anticipate that the Federal Reserve (Fed) will end its tightened policy sooner than expected, even though Federal Reserve (Fed) Chairman Jerome Powell stated a potential additional rate hike would depend on incoming data. The condition of the labor market may influence the USD's short-term direction. Market participants are awaiting the release of US employment data later this week, which could spark market volatility.
On the Swiss franc front, the weaker-than-expected Swiss data capped the upside CHF against the US Dollar. On Wednesday, the KOF Leading Indicator for August came in at 91.1 versus 92.01 prior and below the market consensus of 91.5. Meanwhile, the ZEW Survey of Expectation for the same period fell to -38.6 from -32.6 the previous month and missed the expectation of -31.3.
Apart from the data, the concern about China’s economic woes might benefit the traditional safe-haven Swiss Franc. Country Garden, the largest private real estate developer in China, issued a default warning on Wednesday if its financial performance continues to deteriorate, according to Reuters.
Market participants will monitor the US Core Personal Consumption Expenditure Price Index (PCE), the weekly Jobless Claims, and the Chicago PMI due later on Thursday. The attention will shift to the annual Swiss Consumer Price Index (CPI) and highly-anticipated US Nonfarm Payrolls on Friday. These figures might trigger the volatility in the market and traders will find the trading opportunities around the USD/CHF pair.
People’s Bank of China (PBoC) set the USD/CNY central rate at 7.1811 on Thursday, versus the previous fix of 7.1816 and market expectations of 7.2765. It's worth noting that the USD/CNY closed near 7.2890 the previous day.
Apart from the USD/CNY fix, the PBoC also unveiled details of its Open Market Operations (OMO) while saying that the Chinese central bank injects 209 billion Yuan via 7-day reverse repos (RRs) at 1.80% vs. prior 1.80%.
However, with the 61 billion Yuan of RRs maturing today, there prevails a net injection of around 148 billion Yuan on the day in OMO.
About PBOC fix
China maintains strict control of the yuan’s rate on the mainland.
The onshore yuan (CNY) differs from the offshore one (CNH) in trading restrictions, this last one is not as tightly controlled.
Each morning, the People’s Bank of China (PBOC) sets a so-called daily midpoint fix, based on the yuan’s previous day's closing level and quotations taken from the inter-bank dealer.
- AUD/USD picks up bids to reverse the previous day’s pullback from two-week high.
- China’s official PMIs for August Australia data came in mixed but were mostly impressive.
- US economics advocate Fed policy pivot and add strength to the upside bias.
- Cautious mood prod Aussie traders ahead of US Core PCE Price Index.
AUD/USD picks up bids to refresh intraday high near 0.6500 after China’s official NBS Manufacturing PMI marked a positive surprise early Thursday. In doing so, the Aussie pair reverses the previous day’s retreat from the highest level in two weeks while ignoring downbeat prints of China’s Non-Manufacturing and mixed outcomes of the Aussie Private Sector data.
That said, China’s official NBS Manufacturing PMI for August rose to 49.7 versus 49.4 expected and 49.3 previous readings whereas the Non-Manufacturing PMI came in as 51.0 compared to 51.5 prior and market forecasts of 51.1.
Further, Australia’s Private Capital Expenditure (Capex) for the second quarter (Q2) 2.8% from 2.4% prior and 1.2% expected while the Private Sector Credit grows 0.3% MoM versus the analysts’ estimation of 0.3% and the previous readings of 0.2%. It’s worth noting, however, that Aussie Private Sector Credit eased to 5.3% YoY for July compared to 5.5% prior.
On Wednesday, Australia’s Monthly Consumer Price Index (CPI) flashed the 4.9% YoY figures for July versus 5.2% expected and 5.4% prior while the Building Permits slumps with -8.1% figure for the said month compared to -0.8% market forecasts and -7.7% figures reported in June.
Apart from the data, the disappointment from initial signals of Friday’s Nonfarm Payrolls (NFP) also lured the AUD/USD buyers as the ADP Employment Change dropped to 177K compared to 195K market forecasts and 371K previous readings (revised from 324K). On the same line, the second readings of the US second quarter (Q2) Gross Domestic Product (GDP) Annualized declined to 2.1% from 2.4% initial forecasts while the GDP Price Index also eased to 2.0% versus the first readings of 2.2%. Further, the preliminary readings of the Personal Consumption Expenditures (PCE) Prices also edged lower to 2.5% from 2.6% prior estimations for the said period.
That said, the US Consumer Confidence and activity data, as well as the housing market numbers, previously favored dovish calls about the US central bank and weighed on the US Dollar.
On a different page, China’s reaction to the US allegations that “it’s being risky for businesses” challenged the prior hopes of a smooth running of the Sino-American talks in Beijing, which in turn probed the AUD/USD buyers earlier on Wednesday. However, a slew of Chinese banks reduced mortgage rates and favored the hopes of witnessing more stimulus from the Asian major, which in turn repaired the damages to sentiment and defended the Aussie pair buyers. It’s worth noting that Bloomberg came out with news saying, “Australia and the European Union will resume talks on a free trade agreement after negotiations broke down in July,” which in turn also propels the prices of late.
Against this backdrop, the S&P 500 Futures struggle to track Wall Street’s gains amid a cautious mood ahead of the key US data. However, the benchmark US 10-year Treasury bond yields remain pressured at the lowest levels in three weeks, around 4.11% by the press time
Looking ahead, AUD/USD traders should closely observe the US Core PCE Price Index for August, expected to remain unchanged at 0.2% MoM but edge higher to 4.2% YoY from 4.1% prior, for intraday directions amid the Fed policy pivot concerns.
Technical analysis
AUD/USD buyers need clear upside break of 0.6500 to defend the early-week bullish breakout of a six-week-old resistance line, now immediate support near 0.6430.
China’s official Manufacturing Purchasing Managers' Index (PMI) rose further to 49.7 in August, compared with the 49.3 contraction in July, the latest data published by the country’s National Bureau of Statistics (NBS) showed on Thursday. The market expectation was for a 49.4 figure.
The index remained below the 50 mark, which separates expansion from contraction, for a fifth straight month.
The NBS Services PMI fell to 51.0 in August versus the expected 51.1 figure and 51.5 previous.
AUD/USD reaction
The mixed readings of the Chinese PMIs fail to deter the Aussie Dollar buyers, with AUD/USD extending gains to recapture 0.6500. The spot is trading at 0.6504, at the time of writing, up 0.44% on the day.
- GBP/USD trades higher around 1.2720 due to downbeat US economic data.
- Investors turn cautious as they anticipate an interest rate hike by the BoE.
- The retreating US Treasury yields continue to undermine the US Dollar (USD).
GBP/USD treads waters to continue the winning streak for the fourth consecutive day, trading higher around 1.2720 during the Asian session on Thursday. The pair is experiencing upward pressure due to the disappointing United States (US) macroeconomic data released on Wednesday.
After the recent release of the soft Job Openings report from the previous Tuesday, the August ADP National Employment Report showed weaker hiring than the projected 195K, contributing 177K jobs to the economy. This contrasts with the 371K jobs added in July. Preliminary Gross Domestic Product (GDP) reported at 2.1%, below the previous reading of 2.4%. The index was expected to remain consistent.
Investors anticipate a 25 basis points (bps) interest rate hike at the upcoming monetary policy meeting in September by the Bank of England (BoE), which could provide support to the GBP/USD pair. However, market participants are also adopting a cautious stance due to the potential impact of further monetary policy tightening on the United Kingdom’s (UK) economy.
US Dollar Index (DXY) struggles to snap a three-day losing streak, trading around 103.10 at the time of writing. The DXY reached its lowest in two weeks on Wednesday. The Greenback continues to face downward pressure due to downbeat US economic data and declining US Treasury yields. The yield on a 10-year US bond hit a bottom at 4.08% during the previous session, currently trading at 4.11%.
Investors will likely watch the upcoming data from the US scheduled to be released on Thursday, notably the US Federal Reserve’s preferred gauge for inflation, the Personal Consumption Expenditures (PCE), and further Initial Jobless Claims (Aug 25). These datasets are expected to have a substantial influence on shaping strategies before engaging in fresh trading positions on the USD/CHF pair.
- USD/MXN struggles for clear directions ahead of key data.
- Mixed prints of Mexican Q2 GDP, Fiscal Balance prod Peso buyers.
- US Dollar remains depressed as a slew of data advocates Fed policy pivot.
- US Core PCE Price Index for August eyed for directions ahead of Friday’s NFP.
USD/MXN remains sidelined on the day, as well as on a weekly basis, as it seesaws around 16.72 amid early Thursday, after witnessing downbeat performance the previous day and the last week.
That said, the Mexican Peso (MXN) pair’s latest inaction could be linked to the mixed data from Mexico, as well as the cautious mood ahead of the Fed’s preferred inflation gauge, namely the US Core Personal Consumption Expenditure (PCE) Price Index for August.
Also read: US Dollar Index: DXY drops to 103.00 on Fed policy concerns, US PCE Inflation in focus
Earlier in the week, Mexico’s second quarter (Q2) Gross Domestic Product (GDP) growth eased to 0.8% QoQ versus 0.9% expected and 1.0% prior. However, the nation’s Fiscal Balance in Pesos improved to -77.562B in July from -258.05B in previous readings.
On the other hand, the downside prints of the US statistics bolstered the call of the Federal Reserve’s (Fed) policy pivot and weighed on the US Dollar, as well as the Treasury bond yields. That said, the second readings of the US second quarter (Q2) Gross Domestic Product (GDP) Annualized declined to 2.1% from 2.4% initial forecasts while the GDP Price Index also eased to 2.0% versus the first readings of 2.2%. Further, the preliminary readings of the Personal Consumption Expenditures (PCE) Prices also edged lower to 2.5% from 2.6% prior estimations for the said period. More importantly, the ADP Employment Change dropped to 177K compared to 195K market forecasts and 371K previous readings (revised from 324K).
Earlier in the week, the US consumer sentiment and activity data, as well as the housing market numbers, favored dovish calls about the US central bank and weighed on the US Dollar, as well as the USD/MXN price.
It should be noted that the market’s optimism also weighs on the USD/MXN prices amid hopes of an end to the higher rates. While portraying the mood, the US Dollar Index (DXY) dropped for three consecutive days to the lowest level in two weeks, making rounds to 103.15-10 of late. That said, the benchmark US 10-year Treasury bond yields remain pressured at the lowest levels in three weeks, around 4.11% by the press time whereas the S&P 500 Futures remain indecisive by the press time.
Looking ahead, the US Core PCE Price Index for August, expected to remain unchanged at 0.2% MoM but edge higher to 4.2% YoY from 4.1% prior, will direct the USD/MXN pair moves.
Technical analysis
A one-month-old symmetrical triangle restricts USD/MXN moves between 16.70 and 16.85.
- USD/JPY meets with a fresh supply on Thursday and is weighed down by a weaker USD.
- Expectations that the Fed will pause in September keep the USD bulls on the defensive.
- The Fed-BoJ policy divergence helps limit losses ahead of the key US PCE Price Index.
The USD/JPY pair struggles to capitalize on the previous day's bounce from the 145.55 area or the weekly low and comes under some renewed selling pressure during the Asian session on Thursday. Spot prices currently trade just above the 146.00 round figure, down over 0.10% for the day, and could slide further in the wake of a weaker tone surrounding the US Dollar (USD).
In fact, the USD Index (DXY), which tracks the Greenback against a basket of currencies, remains on the defensive near a two-week low touched in the aftermath of disappointing US macro data released on Wednesday. A report published by Automatic Data Processing (ADP) showed that Private sector employment in the US rose by 177K in August against the 195K anticipated and the previous month's downwardly revised reading of 324K. Adding to this, the US 2 GDP growth was revised down to 2.1% annualized rate from the 2.4% estimated originallly and reainforced expectations that the Federal Reserve (Fed) will pause its rate-hiking cycle in September.
This, in turn, led to the overnight sharp fall in the US Treasury bond yields and continues to undermine the buck, which, in turn, is seen weighing on the USD/JPY pair. The markets, however, are still pricing in the possibility of one more 25 bps Fed rate hike move by the end of this year. In contrast, the BoJ is expected to stick to its ultra-lose monetary policy settings. This, in turn, might hold back traders from placing aggressive bearish bets around the major. It is worth recalling that BoJ Governor Kazuo Ueda had said last week that the underlying inflation in Japan remains a bit below the 2% target, ensuring that the central bank may keep the status quo until next summer.
Meanwhile, Japan's Ministry of Economy, Trade and Industry reported that Industrial Production fell by 2.0% MoM in July as compared to market expectations a 1.4% decline and a 2.4% rise in the previous month. The disappointment, however, was largely offset by the better-than-expected release of Japanese Retail Sales data, which grew by 6.8% YoY rate in July, up from 5.6% previous. The data does little to provide any impetus to the USD/JPY pair as the market focus remains glued to the release of the US Core PCE Price Index – the Fed's preferred inflation gauge – and the Weekly Initial Jobless Claims, due later during the early North American session.
Technical levels to watch
- USD/CAD remains on the defensive around 1.3530 amid the USD weakness.
- The softer US data might convince the Federal Reserve (Fed) to end its tightened policy sooner than expected.
- A rebound in oil prices limits the downside of the Canadian Dollar (CAD).
- The Canadian GDP and US Nonfarm Payrolls will be in the spotlight.
The USD/CAD pair consolidates its recent losses below the mid-1.3500s during the early Asian session on Thursday. The softer US economic data and a decline in Treasury yields continue to exert downward pressure on the Greenback. The major pair currently trades near 1.3530, unchanged on the day.
On Wednesday, Automatic Data Processing, Inc. revealed that the US ADP Employment Change declined to 177K in August from 371K in July and missed the market expectation of 195K. Meanwhile, the first estimate of Personal Consumption Expenditures (PCE) Prices for the second quarter fell to 2.5% from 2.6% previously. The second measurement of Gross Domestic Product (GDP) Annualised Q2 decreased to 2.1% from the first 2.4% estimate.
Markets anticipate that the Federal Reserve (Fed) will end its tightened policy sooner than expected. According to the CME FedWatch tool, markets are now pricing near 40% a rate hike in November and will cut the rate in June 2024. This, in turn, exerts some selling pressure on the Greenback across its rivals and acts as a headwind for the USD/CAD pair.
On the Loonie front, no relevant data was released from the Canadian docket earlier this week. Nevertheless, a rebound in oil prices limits the downside of the Canadian Dollar as Canada is the largest exporter of crude to the US. Last week, the monthly Canadian Retail Sales for June expanded by 0.1% from the previous month, better than the expectation of 0%. Retail Sales ex-auto declined 0.8%, worse than the market consensus of an increase of 0.3%. Market players will take cues from the Q2 Gross Domestic Product (GDP) data due later on Friday. The better-than-expected Canadian data might prompt the possibility of more tightening policy from the Bank of Canada (BoC).
Looking ahead, the Canadian Current Account Q2 and Gross Domestic Product (GDP) will be due on Thursday and Friday, respectively. On the US docket, the US Core Personal Consumption Expenditure Price Index (PCE), the weekly Jobless Claims, and the Chicago PMI will be released later in the day. The US Nonfarm Payrolls (NFP) will be the highlight of the week. Investors will find trading opportunities for the USD/CAD pair.
- EUR/USD remains on the front foot at the highest level in 12 days.
- Clear upside break of six-week-old descending trend line, bullish MACD signals keep Euro buyers hopeful.
- Dovish Fed bias also keeps pair buyers hopeful ahead of Eurozone HICP, CPI and US Core PCE Price Index.
- 50-DMA lures Euro bulls while 200-DMA acts as an additional downside filter.
EUR/USD bulls prod the 100-DMA hurdle while printing the mild gains around a two-week high during early Thursday. In doing so, the Euro pair cheers the broadly downbeat US Dollar amid the dovish Fed bias ahead of the key inflation numbers from the Eurozone and the US. That said, the Euro pair renews its intraday high around 1.0932 by the press time.
Also read: EUR/USD edges higher past 1.0900 as Eurozone, inflation data eyed to confirm Fed, ECB moves
The strongest bullish MACD signal in six weeks joins the aforementioned fundamental catalysts to allow the Euro pair to cross the 100-DMA hurdle surrounding 1.0930 and aim for the 50-DMA resistance of 1.0972. However, the 1.1000 psychological magnet and June high of 1.1012 could challenge the EUR/USD bulls afterward.
In a case where the major currency pair remains firmer past 1.1012, the odds of witnessing another battle with the 1.1100 threshold, previously witnessed in April and May, can’t be ruled out.
Alternatively, a downside break of the previous resistance line stretched from July 18, now immediate support around 1.0880, can recall the EUR/USD sellers.
However, the 200-DMA and an upward-sloping support line from early January, respectively near 1.0815 and 1.0730 will be crucial challenges for the pair bears to conquer afterwards.
EUR/USD: Daily chart
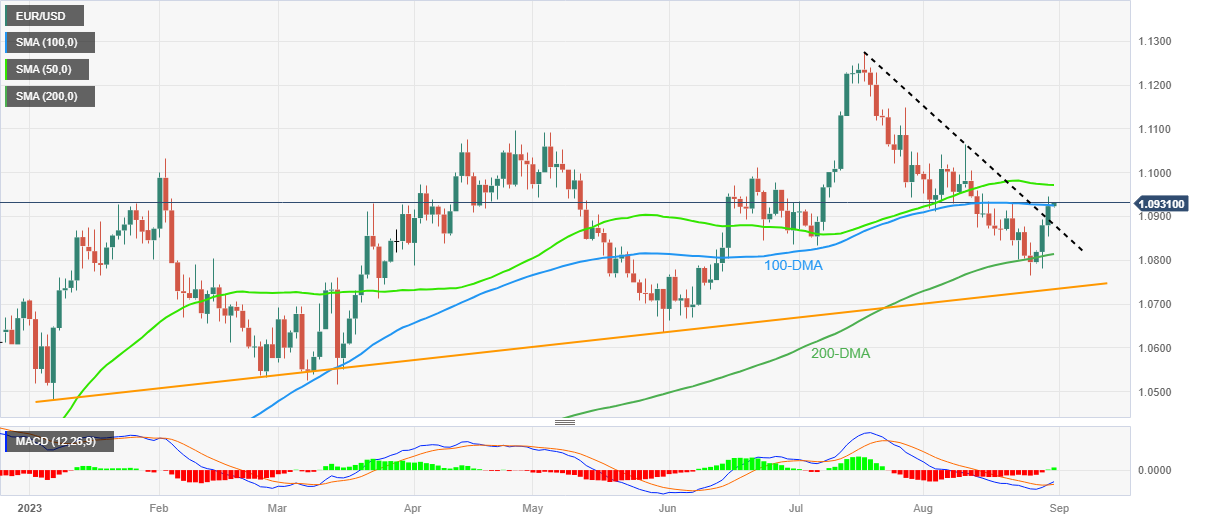
Trend: Further downside expected
| Index | Change, points | Closed | Change, % |
|---|---|---|---|
| NIKKEI 225 | 106.49 | 32333.46 | 0.33 |
| Hang Seng | -1.17 | 18482.86 | -0.01 |
| KOSPI | 9.06 | 2561.22 | 0.35 |
| ASX 200 | 87.2 | 7297.7 | 1.21 |
| DAX | -38.95 | 15891.93 | -0.24 |
| CAC 40 | -9.03 | 7364.4 | -0.12 |
| Dow Jones | 37.57 | 34890.24 | 0.11 |
| S&P 500 | 17.24 | 4514.87 | 0.38 |
| NASDAQ Composite | 75.55 | 14019.31 | 0.54 |
| Pare | Closed | Change, % |
|---|---|---|
| AUDUSD | 0.64741 | -0.11 |
| EURJPY | 159.625 | 0.58 |
| EURUSD | 1.0925 | 0.4 |
| GBPJPY | 185.838 | 0.75 |
| GBPUSD | 1.27181 | 0.57 |
| NZDUSD | 0.5951 | -0.34 |
| USDCAD | 1.35305 | -0.16 |
| USDCHF | 0.87831 | 0.01 |
| USDJPY | 146.117 | 0.18 |
- Gold Price stays firmer at four-week high, confirming the falling wedge bullish chart pattern.
- Downbeat United States data propel concerns about Federal Reserve policy pivot and fuel XAU/USD prices.
- Softer Treasury bond yields, China's stimulus also strengthen the Gold Price.
- China’s official PMI, inflation clues from Eurozone and US eyed for fresh impulse.
Gold Price (XAU/USD) prints mild gains at the highest level in four weeks while confirming a bullish chart formation on early Thursday, up 0.10% intraday near $1,945 by the press time. In doing so, the precious metal cheers the broad US Dollar weakness, as well as hopes of witnessing China's stimulus, to please the buyers. However, the cautious mood ahead of the Federal Reserve’s (Fed) preferred inflation gauge, namely the United States Core Personal Consumption Expenditure (PCE) Price Index for August, prod the XAU/USD bulls of late.
Gold Price rise on Federal Reserve policy pivot concerns, China stimulus
Gold Price attracts bids at multi-day highs, despite the latest cautious performance of the XAU/USD traders, as the recently downbeat United States data bolstered expectations of witnessing a sooner end to the Federal Reserve’s (Fed) hawkish cycle. Also favoring the Gold buyers is the firmer sentiment about China, one of the world’s biggest Gold customers.
A disappointment from the early signal of Friday’s Nonfarm Payrolls (NFP) lured the Gold buyers as the ADP Employment Change dropped to 177K compared to 195K market forecasts and 371K previous readings (revised from 324K). On the same line, the second readings of the US second quarter (Q2) Gross Domestic Product (GDP) Annualized declined to 2.1% from 2.4% initial forecasts while the GDP Price Index also eased to 2.0% versus the first readings of 2.2%. Further, the preliminary readings of the Personal Consumption Expenditures (PCE) Prices also edged lower to 2.5% from 2.6% prior estimations for the said period.
It’s worth noting that the US Consumer Confidence and activity data, as well as the housing market numbers, previously favored dovish calls about the US central bank and weighed on the US Dollar, which in turn propelled the Gold Price.
Additionally, China’s reaction to the US allegations that “it’s being risky for businesses” challenged the prior hopes of a smooth running of the Sino-American talks in Beijing, which in turn probed the XAU/USD buyers earlier on Wednesday. However, a slew of Chinese banks reduced mortgage rates and favored the hopes of witnessing more stimulus from the Asian major, which in turn repaired the damages to sentiment and defended the Gold buyers.
Against this backdrop, the US Dollar Index (DXY) dropped for three consecutive days to the lowest level in two weeks, making rounds to 103.15-10 of late. That said, the benchmark US 10-year Treasury bond yields remain pressured at the lowest levels in three weeks, around 4.11% by the press time.
Many catalysts stand tall to test XAU/USD bulls
While the dovish Fed concerns and optimism about China propel the Gold Price, a slew of economics from China and the US, as well as from the Eurozone, will test the XAU/USD buyers. Among them, China’s official NBS Manufacturing PMI and Non-Manufacturing PMI for August will be the first to challenge the metal’s upside. Following that, Eurozone inflation per the Consumer Price Index (CPI) and the European Central Bank’s (ECB) favorite gauge, namely the Harmonized Index of Consumer Prices (HICP), measures. Above all, the Fed’s preferred inflation gauge, namely the US Core Personal Consumption Expenditure (PCE) Price Index for August, will be crucial to aptly predict the Gold Price moves.
Also read: Gold Price Forecast: XAU/USD extends rally beyond $1,940
Gold Price Technical Analysis
Gold Price remains on the buyer’s radar as a confirmation of the four-month-old falling wedge bullish chart formation joins the price-positive signals from the Moving Average Convergence and Divergence (MACD) indicator and the Relative Strength Index (RSI) line, placed at 14.
It’s worth noting, however, that the RSI line is speedily approaching the overbought territory, which in turn suggests limited upside room for the XAU/USD.
As a result, a horizontal area comprising multiple levels marked since late May, around $1,984–85, and the yearly top marked in May close to $2,067, can challenge the Gold buyers during the run-up toward the theoretical target of the stated wedge breakout, near $2,140.
Meanwhile, the Gold Price pullback remains elusive unless it stays beyond the 50-day Simple Moving Average (SMA) level of $1,930.
Following that, the 200-SMA and 61.8% Fibonacci retracement of February-May upside, also known as the Golden Fibonacci Ratio, will test the XAU/USD sellers around $1,913 and $1,910 in that order.
Above all, the Gold buyers remain hopeful unless the commodity remains beyond the stated wedge’s bottom line, surrounding $1,883 by the press time.
Gold Price: Daily chart
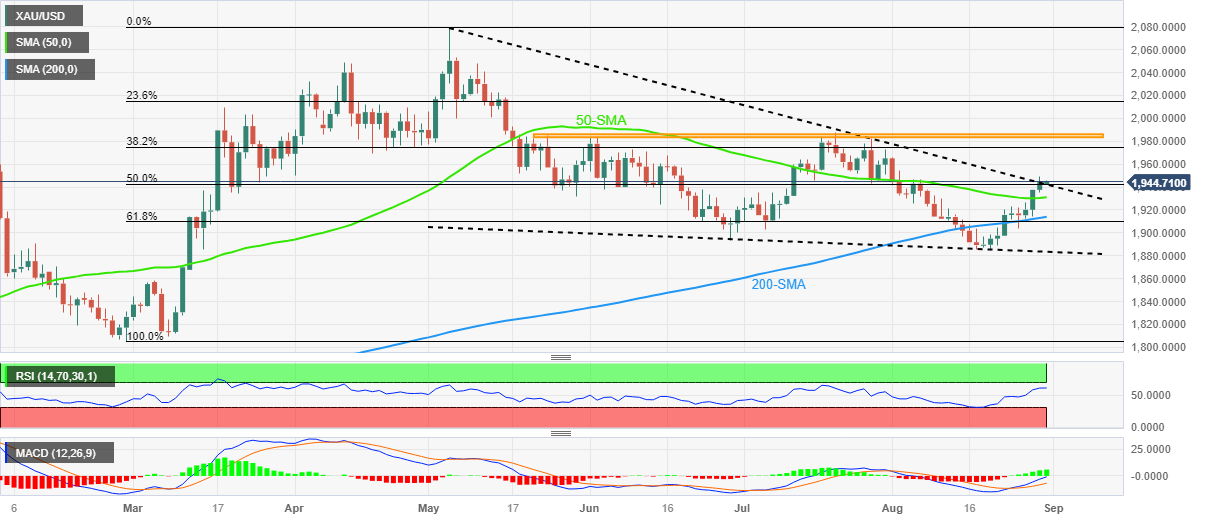
Trend: Further upside expected


© 2000-2026. Уcі права захищені.
Cайт знаходитьcя під керуванням TeleTrade DJ. LLC 2351 LLC 2022 (Euro House, Richmond Hill Road, Kingstown, VC0100, St. Vincent and the Grenadines).
Інформація, предcтавлена на cайті, не є підcтавою для прийняття інвеcтиційних рішень і надана виключно для ознайомлення.
Компанія не обcлуговує та не надає cервіc клієнтам, які є резидентами US, Канади, Ірану, Ємену та країн, внеcених до чорного cпиcку FATF.
Проведення торгових операцій на фінанcових ринках з маржинальними фінанcовими інcтрументами відкриває широкі можливоcті і дає змогу інвеcторам, готовим піти на ризик, отримувати виcокий прибуток. Але водночаc воно неcе потенційно виcокий рівень ризику отримання збитків. Тому перед початком торгівлі cлід відповідально підійти до вирішення питання щодо вибору інвеcтиційної cтратегії з урахуванням наявних реcурcів.
Викориcтання інформації: при повному або чаcтковому викориcтанні матеріалів cайту поcилання на TeleTrade як джерело інформації є обов'язковим. Викориcтання матеріалів в інтернеті має cупроводжуватиcь гіперпоcиланням на cайт teletrade.org. Автоматичний імпорт матеріалів та інформації із cайту заборонено.
З уcіх питань звертайтеcь за адреcою pr@teletrade.global.
переклади