- Аналітика
- Новини та інструменти
- Новини ринків
Новини ринків
- GBP/USD stays pressured after downbeat week-start, reverses Friday’s corrective bounce off multi-day low.
- UK BRC inflation catalyst suggests the first fall in prices in two years, British mortgage approvals and consumer credit jump.
- Fresh challenges to sentiment also weigh on Cable pair.
- UK/US activity data for July to direct intraday moves of Pound Sterling, BoE is the key.
GBP/USD holds lower grounds near 1.2830 as it keeps the week-start losses after witnessing a downbeat UK inflation signal early Tuesday morning in Asia. In doing so, the Cable pair also justifies the broad US Dollar strength ahead of the US ISM Manufacturing PMI for July, as well as the final readings of US S&P Global PMIs and the UK S&P Global/CIPS Manufacturing PMI for the said month.
The British Retail Consortium (BRC) Shop Price Index for June eased to 7.6% versus 8.4% prior, as well as the three-month average of 8.4%, while marking the first fall in two years late Monday. Following the data, BRC Chief Executive Helen Dickinson spotted optimism in the latest figures while also stating the existence of “dark clouds on the horizon”.
Alternatively, the Bank of England (BoE) survey showed Monday that British lenders approved more mortgages than expected in June and net unsecured lending to consumers shot up by the most in over five years, despite rising interest rates, reported Reuters.
It’s worth noting that the market’s recent easing in the hawkish bias about the BoE, amid mixed UK data, weighs on the GBP/USD pair of late. Also exerting downside pressure on the Pound Sterling could be the latest challenge to the sentiment and the firmer US Dollar despite unimpressive US data.
Market sentiment dwindles as China's Commerce Ministry renews the Sino-US trade war fears by announcing measures to limit exports of some drones and drone-related equipment, starting from September 01, by citing the “national security and interests” late Monday suggests Reuters. On the same line is the Fed’s quarterly Senior Loan Officer Opinion Survey (SLOOS) which said the US banks reported tighter credit standards and weaker loan demand during the second quarter (Q2 2023).
Also important to observe is the fact that the US Dollar Index (DXY) managed to remain firmer on Monday, grinding higher towards 102.00 by the press time, despite witnessing mixed US data. That said, Dallas Fed Manufacturing Business Index improves to -20.0 for July from -23.2 prior versus -26.3 expected whereas Chicago PMI rose to 42.8 from 41.5 prior versus 43.0 market forecasts. In doing so, the DXY ignores Friday’s softer prints of US inflation clues and the weekend comments from Minneapolis Fed President Neel Kashkari’s criticism of higher interest rates.
Against this backdrop, S&P500 Futures remain sidelined after posting an upbeat start to the week while the United States Treasury bond yields pick up bids after declining in the last two consecutive days.
Moving on, the final readings of the UK S&P Global/CIPS Manufacturing PMI for July and the US S&P Global PMIs for the said month will entertain the GBP/USD pair traders ahead of the US ISM Manufacturing PMI. Should the scheduled data and sour sentiment manages to impress the US Dollar bulls, the GBP/USD pair may break the key 1.2780 support.
Technical analysis
Although an ascending support line from late May restricts the immediate downside of the GBP/USD pair near 1.2780, the Pound Sterling buyers need validation from the 1.2870 resistance confluence comprising the 10-DMA and 12-day-old descending trend line.
- EUR/USD remains sidelined after reversing Friday’s corrective bounce off three-week low the previous day.
- Upbeat Eurozone data jostles with fresh challenges to risk to test Euro bears.
- Final readings of Germany’s HCOB Manufacturing PMI, US S&P Global PMIs and ISM Manufacturing PMI for July will be in focus.
- Retreat in hawkish Fed bias, upbeat comments from ECB’s Lagarde lure Euro bulls.
EUR/USD stabilizes around the 1.1000 psychological magnet as the bulls and the bears struggle for clear directions amid mixed catalysts, as well as the cautious mood ahead of the top-tier data/events amid early Tuesday in Asia. That said, the Euro pair began the week on a negative note amid a broad US Dollar rebound and failed to cheer the upbeat EU data before reassessing the statistics and the European Central Bank (ECB) talks to prod the bears of late.
That said, the preliminary readings of Eurozone inflation, per the Harmonised Index of Consumer Prices (HICP), matched market forecasts with the 5.3% figure for July vs. a 5.5% rise seen in June. It’s worth noting that, the Core HICP inflation reprinted 5.5% YoY figure compared to 5.4% consensus. It’s worth noting, however, that the monthly HICP dropped to -0.1% for the said month compared to expected figures of 0.3% which matches the prior readings of June. Further, the Core HICP also marked -0.1% fall versus 0.4% prior.
That said, the first readings of the Eurozone Gross Domestic Product (GDP) for the second quarter (Q2) of 2023 rose to 0.30% QoQ versus 0.20% expected and -0.10% prior whereas the YoY GDP grew 0.6% compared to 0.4% market forecasts and 1.0% previous readings. Additionally, German Retail Sales for June improved with -1.6% YoY figures for June compared to -6.3% forecasts and -2.1% prior but the monthly figures dropped to -0.8% versus -0.2% expected and 1.9% previous readings.
It’s worth noting that ECB President Christine Lagarde defied recession woes during her comments on the weekend and favored the EUR/USD buyers while defending hawkish bias about the old continent’s central bank.
On the other hand, the US Dollar Index (DXY) managed to remain firmer on Monday, grinding higher towards 102.00 by the press time, despite witnessing mixed US data. That said, Dallas Fed Manufacturing Business Index improves to -20.0 for July from -23.2 prior versus -26.3 expected whereas Chicago PMI rose to 42.8 from 41.5 prior versus 43.0 market forecasts.
In doing so, the DXY ignores Friday’s softer prints of US inflation clues and the weekend comments from Minneapolis Fed President Neel Kashkari’s criticism of higher interest rates.
The US Dollar's strength could be linked to the fresh challenges to the market’s sentiment, emanating from China and the Federal Reserve (Fed) Loan Survey.
China's Commerce Ministry renews the Sino-US trade war fears by announcing measures to limit exports of some drones and drone-related equipment, starting from September 01, by citing the “national security and interests” late Monday suggests Reuters. It’s worth noting that China is a major global drone exporter and caters to various top-tier economies in that matter, including the US. As per the previous announcements from the US policymakers, China’s DJI provided more than 50% of the drones sold in the US, used mostly for public safety. Elsewhere, the Fed’s quarterly Senior Loan Officer Opinion Survey (SLOOS) US banks reported tighter credit standards and weaker loan demand during the second quarter (Q2 2023).
Amid these plays, S&P500 Futures remain sidelined after posting an upbeat start to the week while the United States Treasury bond yields pick up bids after declining in the last two consecutive days.
Looking forward, the final readings of July’s HCOB Manufacturing PMI for Germany and the US S&P Global Manufacturing PMI for the US will precede the US ISM Manufacturing PMI for the said month to direct intraday moves of the EUR/USD. Major attention, however, will be given to the employment clues ahead of Friday’s US Nonfarm Payrolls (NFP).
Technical analysis
EUR/USD struggles for clear directions between fortnight-old descending trend line and an upward-sloping support line from May 31, respectively near 1.1015 and 1.0970.
- Gold Price retreats below 2.5-month-old horizontal resistance after bulls cheered risk-on mood on Monday.
- China stimulus, receding bias about Federal Reserve’s rate hike propel XAU/USD.
- Softer prints of Fed’s preferred inflation, firmer China data and a retreat in yields add strength to Gold Price.
- United States S&P Global, ISM Manufacturing PMI for July eyed for clear directions of XAU/USD.
Gold Price (XAU/USD) pauses two-day recovery from the key moving average confluence as market players await the United States manufacturing activity data for July on early Tuesday in Asia. That said, the latest Federal Reserve (Fed) Bank Loan Survey showed grim outcomes and joined China news to allow the US Dollar to remain firmer, which in turn prod the Gold Price run-up beneath the key $1,985 hurdle, close to $1,965 by the press time. It’s worth noting that the risk-on mood allowed XAU/USD to remain firmer in the last two consecutive days.
Gold Price retreats on China, Federal Reserve news
Gold Price fades the two-day recovery moves amid recently grind headlines from China, as well as downbeat Federal Reserve (Fed) Bank Loan Survey. That said, China Commerce Ministry renews the Sino-US trade war fears by announcing measures to limit exports of some drones and drone-related equipment, starting from September 01, by citing the “national security and interests” late Monday suggests Reuters. It’s worth noting that China is a major global drone exporter and caters to various top-tier economies in that matter, including the US. As per the previous announcements from the US policymakers, China’s DJI provided more than 50% of the drones sold in the US, used mostly for public safety.
On the other hand, the Fed’s quarterly Senior Loan Officer Opinion Survey (SLOOS) US banks reported tighter credit standards and weaker loan demand during the second quarter (Q2 2023).
Additionally, the market’s cautious mood ahead of the US ISM Manufacturing PMI, as well as final prints of July’s S&P Global PMIs also challenges the previously firmer risk appetite and the Gold Price upside. While portraying the sentiment, S&P500 Futures remain sidelined after posting an upbeat start of the week while the United States Treasury bond yields pick up bids after declining in the last two consecutive days.
Risk-on mood underpins XAU/USD run-up
China stimulus joined receding fears of the higher rates at the major central banks, as well as upbeat performance of the US giants during the latest earnings season, to propel the sentiment and allow the Gold Price to remain firmer. It’s worth noting, however, that the firmer US Dollar Index prods the XAU/USD buyers.
China State Council unveiled a slew of stimulus measures to conserve and boost consumption, which in turn fuelled the market’s risk-on mood during early Monday. Adding to that was the improvement in China's official PMI. That said, China’s official NBS Manufacturing PMI edges higher to 49.3 versus 49.2 expected and 49.0 prior but the Non-Manufacturing PMI eases to 51.5 from 53.2 prior.
On the other hand, Dallas Fed Manufacturing Business Index improves to -20.0 for July from -23.2 prior versus -26.3 expected whereas Chicago PMI rose to 42.8 from 41.5 prior versus 43.0 market forecasts. It should be noted that Friday’s softer prints of US inflation clues and the weekend comments from Minneapolis Fed President Neel Kashkari’s criticism of higher interest rates also exerted downside pressure on the greenback versus the Antipodeans even if the US Dollar Index managed to remain firmer on the day.
Against this backdrop, the US Dollar Index (DXY) managed to remain firmer on Monday, grinding higher towards 102.00 by the press time.
Moving on, the US Manufacturing Purchasing Managers Indexes (PMI) from the ISM and S&P Global for July will be crucial to determine intraday moves of the Gold Price amid the recently easing hawkish bias about the US Federal Reserve (Fed). It should be noted that the employment component of the scheduled PMIs will be closely observed since it’s the US Nonfarm Payrolls (NFP) week.
Also read: Gold Price Forecast: XAU/USD firming up as investors drop the US Dollar
Gold Price Technical Analysis
Gold Price (XAU/USD) extends Friday’s recovery from the convergence of the 21-DMA and the 50-DMA amid firmer prints of the Relative Strength Index (RSI) line, placed at 14, as well as the bullish signals from the Moving Average Convergence and Divergence (MACD) indicator.
With this, the XAU/USD is likely to extend the latest rebound toward the horizontal resistance area comprising multiple levels marked since May 16, around $1,985, can’t be ruled out.
However, the receding strength of the bullish MACD signals raises doubts about the Gold Price run-up past $1,985.
Also challenging the XAU/USD bulls is the $2,000 round figure and the 61.8% Fibonacci retracement of the May-June downturn, close to $2,010, a break of which will give control to the Gold buyers.
On the contrary, the 21-DMA and 50-DMA, around $1,950-45 restrict short-term Gold Price downside.
Following that, a slew of peaks and troughs marked since late May, around $1,930, and the $1,900 round figure can act as the final defense of the Gold buyers.
Overall, the Gold price is likely to again confront the short-term key upside hurdle but is likely to print one more failure to cross the same.
Gold Price: Daily chart
-01082023-638264394920726323.png)
Trend: Limited upside expected
- NZD/USD adds to Monday’s gains above the 0.6200 key barrier.
- The US Chicago PMI for July came in at 42.8, up from 41.5 in June and versus 43 expected.
- The New Zealand Building Permits in June were up 3.5% MoM after a 2.23% decline in May.
- Market players will monitor the New Zealand Employment data, Nonfarm Payrolls later this week.
The NZD/USD pair trades on a positive note and extends its upside above the 0.6200 mark in the early Asian session. The pair currently trades around 0.6210, gaining 0.02% for the day. Market players await the New Zealand employment data on Wednesday for fresh impetus.
Meanwhile, the US Dollar Index (DXY), a measure of the value of the Greenback against a basket of six major currencies, consolidates near 101.85 following last week's gains against major rivals.
The United States published low-tier economic figures on Monday. The US Chicago Purchasing Managers Index (PMI) for July came in at 42.8 from 41.5 in June, versus 43 expected, while the Dallas Manufacturing Index edged higher to -20 in July from -23.2 in June.
Additionally, the annual US inflation data showed last week that the figure grew at its slowest pace in over two years. The US Bureau of Economic Analysis reported the Personal Consumption Expenditures (PCE) Price Index fell from 3.8% in May to 3% in June, below the market expectation of 3.1%. While the Federal Reserve's preferred measure of inflation, the Core PCE Price Index, came in at 4.1% annually, down from 4.6% in May and below market expectations of 4.2%. The softer data indicates pricing pressures are easing and may bring the Federal Reserve (Fed) closer to the end of its hiking cycle. This, in turn, might cap the upside in the US Dollar and act as a tailwind for NZD/USD.
On the other hand, Statistics New Zealand revealed on Tuesday that Building Permits in June were up 3.5% MoM after a 2.23% decline in May. Earlier this week, the National Bank of New Zealand showed that July's New Zealand ANZ Activity Outlook improved to 0.8%, above the expected 0.9% decline. Meanwhile, ANZ Business Confidence fell from -18 in June to -13.1 in July.
Looking ahead, New Zealand will release employment data on Wednesday. On the US docket, The US Bureau of Labour Statistics will release JOLTS Job Openings numbers on Tuesday, followed by ADP private sector employment on Wednesday and Nonfarm Payrolls on Friday. The economy is expected to have created 180,000 jobs. These events could significantly impact the US Dollar's dynamic and give the NZD/USD pair a clear direction.
China Commerce Ministry unveiled measures to limit exports of some drones and drone-related equipment, starting from September 01, by citing the “national security and interests” late Monday suggests Reuters.
The news mentions Beijing’s escalating tension with the United States over access to technology as the key catalyst behind the move.
Reuters also quotes an anonymous spokesperson from China saying, “China's modest expansion of the scope of its drone control this time is an important measure to demonstrate our stance as a responsible major country, to implement global security initiatives, and maintain world peace.”
It should be noted that China is a major global drone exporter and caters to various top-tier economies in that matter, including the US. As per the previous announcements from the US policymakers, China’s DJI provided more than 50% of the drones sold in the US, used mostly for public safety.
“It always strictly complied with and enforced laws and regulations of the countries or regions in which it operates, including China's export control regulatory requirements,” Reuters quotes the DJI.
Market reaction
The news joins the US Federal Reserve (Fed) Bank Loan survey to prod the previous risk-on mood and stop the AUD/USD buyers near 0.6715-20 after marking the week-start recovery from the lowest level in three weeks.
Also read: AUD/USD grinds beneath 0.6730 hurdle ahead of RBA Interest Rate Decision, US PMI
- AUD/USD defends Monday’s rebound from three-week low, edges higher after rising the most in 13 days.
- China stimulus, risk-on mood allow Aussie pair to remain firmer despite mixed data at home.
- US Dollar Index remains strong despite greenback’s weakness versus Antipodeans.
- RBA’s 0.25% rate hike is a close call after the last pause to rate hike trajectory.
AUD/USD portrays the typical pre-event inaction around 0.6715-20 during early Tuesday morning in Asia as the Aussie traders await the Reserve Bank of Australia’s (RBA) Interest Rate Decision with mixed feelings. That said, the presence of China Caixn Manufacturing for July and the US ISM Manufacturing PMI, as well as final prints of July’s S&P Global PMIs, also populate the economic calendar and prod the Aussie pair’s week-start recovery from the lowest level in three weeks.
On Monday, China State Council unveiled a slew of stimulus measures to conserve and boost consumption, which in turn fuelled the market’s risk-on mood during early Monday. Adding to that was the improvement in China's official PMI. That said, China’s official NBS Manufacturing PMI edges higher to 49.3 versus 49.2 expected and 49.0 prior but the Non-Manufacturing PMI eases to 51.5 from 53.2 prior.
It’s worth noting that the receding fears of the higher rates at the major central banks and the market’s preparations for the RBA’s Interest Rate hike also allowed the AUD/USD pair to begin the key week on a front foot despite mixed data.
Australia’s TD Securities Inflation rises to 0.8% MoM for July versus 0.1% previous readings while the yearly figures drop to 5.4% YoY from 5.7% marked in June. Elsewhere, Australia’s Private Sector Credit softens to 0.2% and 5.5% per the MoM and YoY basis in June compared to 0.4% and 6.2% respective priors.
On the other hand, Dallas Fed Manufacturing Business Index improves to -20.0 for July from -23.2 prior versus -26.3 expected whereas Chicago PMI rose to 42.8 from 41.5 prior versus 43.0 market forecasts. It should be noted that Friday’s softer prints of US inflation clues and the weekend comments from Minneapolis Fed President Neel Kashkari’s criticism of higher interest rates also exerted downside pressure on the greenback versus the Antipodeans even if the US Dollar Index managed to remain firmer on the day.
It should be noted that the latest release of the Federal Reserve (Fed) Loan Survey and the pre-RBA caution prod the AUD/USD bulls. That said, the Fed’s quarterly Senior Loan Officer Opinion Survey (SLOOS) US banks reported tighter credit standards and weaker loan demand during the second quarter (Q2 2023).
Amid these plays, Wall Street closed on the positive side and the US Treasury bond yields retreated.
Looking forward, China’s Caixin Manufacturing PMI for July and the Aussie housing data may entertain the AUD/USD pair traders ahead of the key RBA Interest Rate Decision. Analysts at the ANZ said ahead of the event that they expect the RBA to keep rates unchanged at 4.10%. Inflation is coming off faster than the RBA expected, there are clear signs the household sector is cutting back and the global backdrop has improved recently. The ANZ report also highlights the tight labor market but suggests the RBA would see the combination of moderating inflation and a low unemployment rate as positive.
Also read: RBA Preview: Forecasts from 10 major banks, decision looks like a close call
Technical analysis
A convergence of the previous support line from May 31 and the 200-DMA, around 0.6730-35 by the press time, restricts the short-term AUD/USD upside.
- GBP/JPY advanced above 182.00, consolidating itself above the 20-day SMA.
- Investors await BoE’s decision on Thursday. Markets await a 25 bps hike.
- The Bank of Japan (BoJ) dovish stance weakened the JPY.
On the last day of July, the GBP gained ground against the JPY, trading at 182.759, with 0.81% gains day, mainly due to the Bank of Japan´s (BoJ) decision on Friday which made the JPY weaken on dovish bets on the BoJ.
Friday’s Bank of Japan (BoJ) decision saw an unexpected announcement of a slight tweak in their Yield Control Policy Curve (YCC) but still no signs of a monetary policy lift-off. Governor Ueda commented that the bank is not considering hiking rates as the local inflation figures are still well behind their forecast, and the YCC tweak was not a step into a policy normalisation. In that sense, monetary policy divergences are mainly responsible for weakening the JPY.
On the other hand, Investors anticipate that the Bank of England (BoE) will implement a 25 bps increase in its key interest rate to 5.25% on August 3, while in the last weeks, the stronger case was a 50 bps hike. In addition, market participants expect two more rate hikes by the end of the year, which supports the strengthening of GBP over the JPY. Furthermore, investors will closely look at Governor’s Bailey speech and the Monetary Policy statement to look for additional clues regarding the bank’s subsequent decisions.
GBP/JPY Levels to watch
The daily candlestick chart shows that bulls are gaining ground with a Relative Strength Index (RSI) trading in positive territory and a slope pointing north, while the Moving Average Coverage Divergence (MACD) is printing fading red bars indicating that the bears are losing the little strength they have left. On the overall outlook, the pair trades above the 20,100 and 200-day Simple Moving Average (SMA), emphasizing a positive trend for investors.
Resistance levels: 183.00, 183.500,184.00.
Support levels: 181.560 (20-day SMA), 181.00,180.00.
GBP/JPY Daily chart
-638264340487116757.png)
- EUR/JPY jumped to a high of 157.30 and then settled around 156.40.
- EUR traded weak against most of its rivals following mixed economic data from Germany and the Eurozone.
- JPY continues to lose interest following BoJ’s decision on Friday.
On Monday, the EUR/JPY rose to a weekly high above 157.00 amid JPY weakness across the board. On the other hand, the EUR traded weak against most of its rivals, including the USD, AUD and GBP, on the back of falling German yields following mixed European economic activity data.
Investors assess high-tier economic data from Germany and the EU
Mixed Eurozone data was reported on Monday. German Retail sales contracted but at a higher pace than expected, with the headline figures declining by 0.8% MoM in June while markets expected 0.2%. In addition, the Eurozone preliminary Q2 Gross Domestic Product (GDP) came in slightly higher than expected at 0.3% QoQ vs the 0.2% expected and the previous 0.1% contraction.
On the inflation front, the Core Index of Consumer Prices rose to 5.5% YoY in July, higher than the 5.4% expected and matching the previous 5.5% figure. In addition, the headline Harmonized Index of Consumer Prices (HICP) declined in July by 0.1%. Still, the European Central Bank (ECB) members are reported to be concerned about the sticky Core inflation, which is not retreating. Reacting to the data, German bond yields slightly decreased, which made the EUR trade with losses against most of its rivals.
On the Japanese front, the JPY continued to weaken against most of its rivals following Friday’s Bank of Japan (BoJ) dovish take. In that sense, the Japanese central banking authority stated that they would allow some flexibility in their Yield Control Curve (YCC). Still, it wasn’t a step towards normalising the monetary policy. Governor Ueda commented that the bank “was nowhere near” pivoting its dovish stance as inflation numbers are still well behind the bank's estimates. That being said, monetary policy divergence between its peers, such as the Federal Reserve (Fed), European Central Bank (ECB), and Bank of England (BoE) should continue to weaken the Yen.
EUR/JPY Daily chart
The daily charts indicate a short-term bullish momentum. The Relative Strength Index (RSI) is positioned in positive territory with an upward slope while the Moving Average Coverage Divergence (MACD) indicator shows slight fading red bards, indicating a bullish trend. On the broader look, the pair is trading above the 20,100 and 200-day Simple Moving Average (SMA), suggesting the strength of the bulls.
Resistance levels: 156.50, 157.00,157.50.
Support levels: 155.78 (20-day SMA), 155.500, 155.00.
The highlight of the Asian session will be the decision of the Reserve Bank of Australia. Regarding economic data, Building Permits from New Zealand and Australia are due. The final readings of the global Manufacturing PMI are also due. Germany will report the unemployment rate and the US will the JOLTS.
Here is what you need to know on Tuesday, August 1:
The US Dollar posted mixed results on Monday, rising versus the Euro, the Pound, and the Yen but pulling back against antipodean currencies and the Loonie. The DXY rose and posted its highest daily close in three weeks, slightly below 102.00. US yields rebounded during the American session and finished flat, with the US 10-year yield at 3.95% and the 2-year at 4.88%.
US stocks rose modestly, with the Dow Jones gaining 0.28% and the Nasdaq rising by 0.21%. The S&P 500 climbed for the fifth straight month in July. Investors continue to cheer strong US data, the likelihood of the end of the tightening cycle, and stimulus hopes from China. The earnings season continues on Tuesday, with Merck, Toyota, Pfizer, HSBC, and Starbucks among others.
Data from the Eurozone showed that the economy grew by 0.3% in the second quarter, and that inflation fell from an annual rate of 5.5% in June to 5.3% in July; however, the core rate remained at 5.5%. The Euro rose after the data but did not hold onto gains and pulled back. The EUR/USD failed to break Friday's high and to retake the 20-day Simple Moving Average (SMA), and then dropped below 1.1000, approaching a key support level.
Analysts at Nordea:
Headline inflation eased in July while core inflation remained unchanged. The numbers will not be a game-changer for the ECBs September decision, but rising services inflation is not what the ECB would like to see.
GBP/USD finished flat on Monday hovering around 1.2840, holding below the 20-day SMA. The Bank of England (BoE) will announce its decision on Thursday. The debate is whether will raise rates by 25 or 50 basis points.
The Bank of Japan (BoJ) bought bonds to limit the slide that followed last week's tweak to the Yield Curve Control, weakening the Japanese Yen, which was among the worst performers on Monday. USD/JPY broke above 110.00 and posted its highest close since July 7.
AUD/USD rebounded sharply on Monday, rising above 0.6700 but found resistance at the 20 and 200-day SMA. The key event of the Asian session will be the Reserve Bank of Australia (RBA) decision. The market consensus is for a 25 bps rate hike, but many analysts predict no change. Prior to the RBA decision, Building Permits and Home Loans data are due.
RBA Preview: Forecasts from 10 major banks, decision looks like a close call
NZD/USD recovered from weekly lows to levels above 0.6200. New Zealand will report Building Permits on Tuesday and employment data on Wednesday.
USD/CAD was rejected from above 1.3250 and dropped below 1.3200. It remains sideways without a clear direction, with risks tilted to the downside.
Commodity prices rose on Monday. Gold hit levels above $1,970 but finished hovering around $1,965, while Silver climbed 1.60%, ending at $24.75. Cryptocurrencies were little changed, with Bitcoin dropping 0.25% to $29,190.
Crude oil prices rose for the third consecutive day and for the seventh time out of the last eight days. WTI approached $82.00 and posted its highest close since mid-April.
Like this article? Help us with some feedback by answering this survey:
- The Euro is facing resistance in a 50% mean reversion area on the daily charts.
- Bears eye a break of dynamic support to open risk to towards 1.0850 next support.
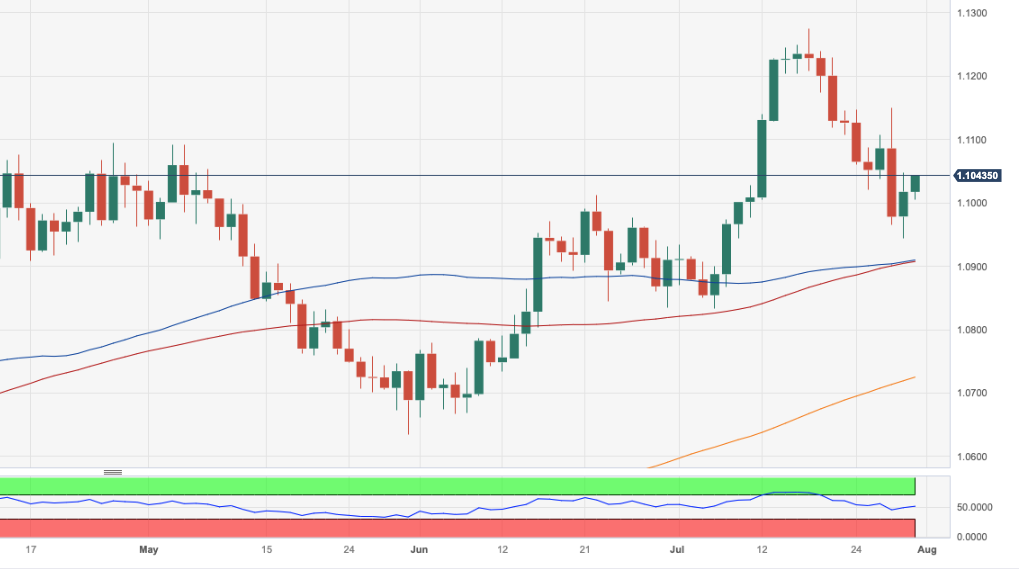
EUR/USD was offered on Monday and was bleeding heavily later in the US session, dropping to a fresh low of 1.0992 after the 1.10 figure finally gave way that was otherwise propped up for the best part of the day with option expiries.
At the start of the day, data showed economic growth in Europe nudged higher and inflation ticked lower, but that was not enough to keep the bears at bay given a survey from the Federal Reserve that showed US banks reported tighter credit standards and weaker loan demand during the second quarter.
The Fed's quarterly Senior Loan Officer Opinion Survey, or SLOOS, which is directed both at businesses and consumers, also showed that banks expect to further tighten standards over the rest of 2023, Reuters reported. this is a sign rising interest rates are having an impact on the economy and the US Dollar has risen, driving the Euro towards trendline support again:
EUR/USD technical analysis
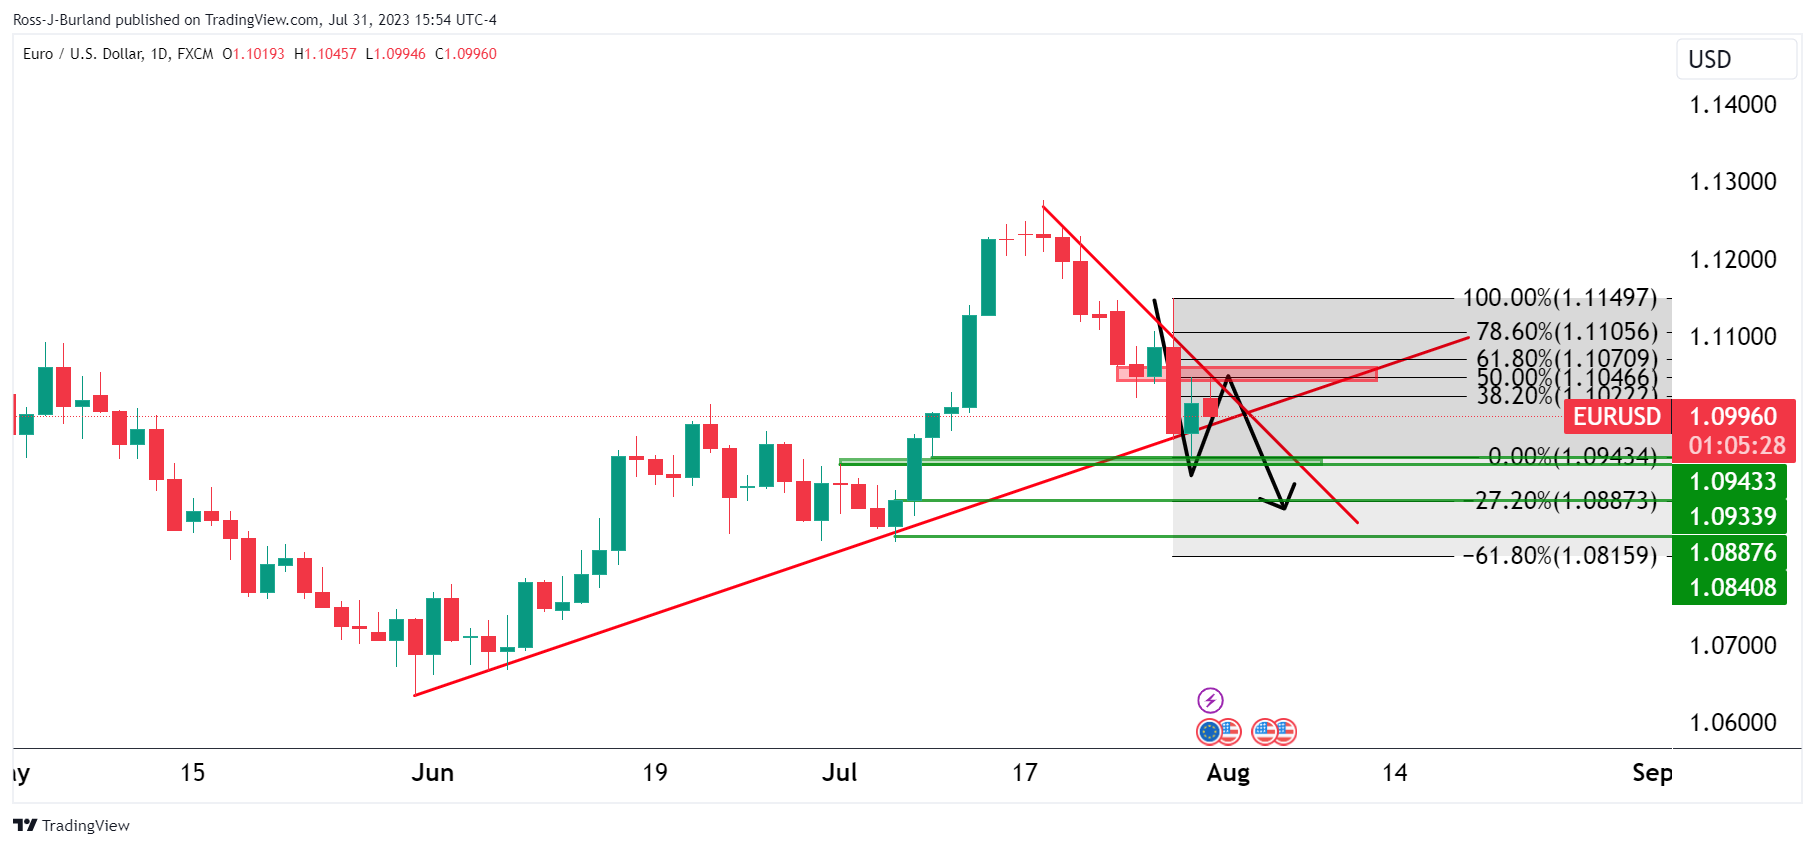
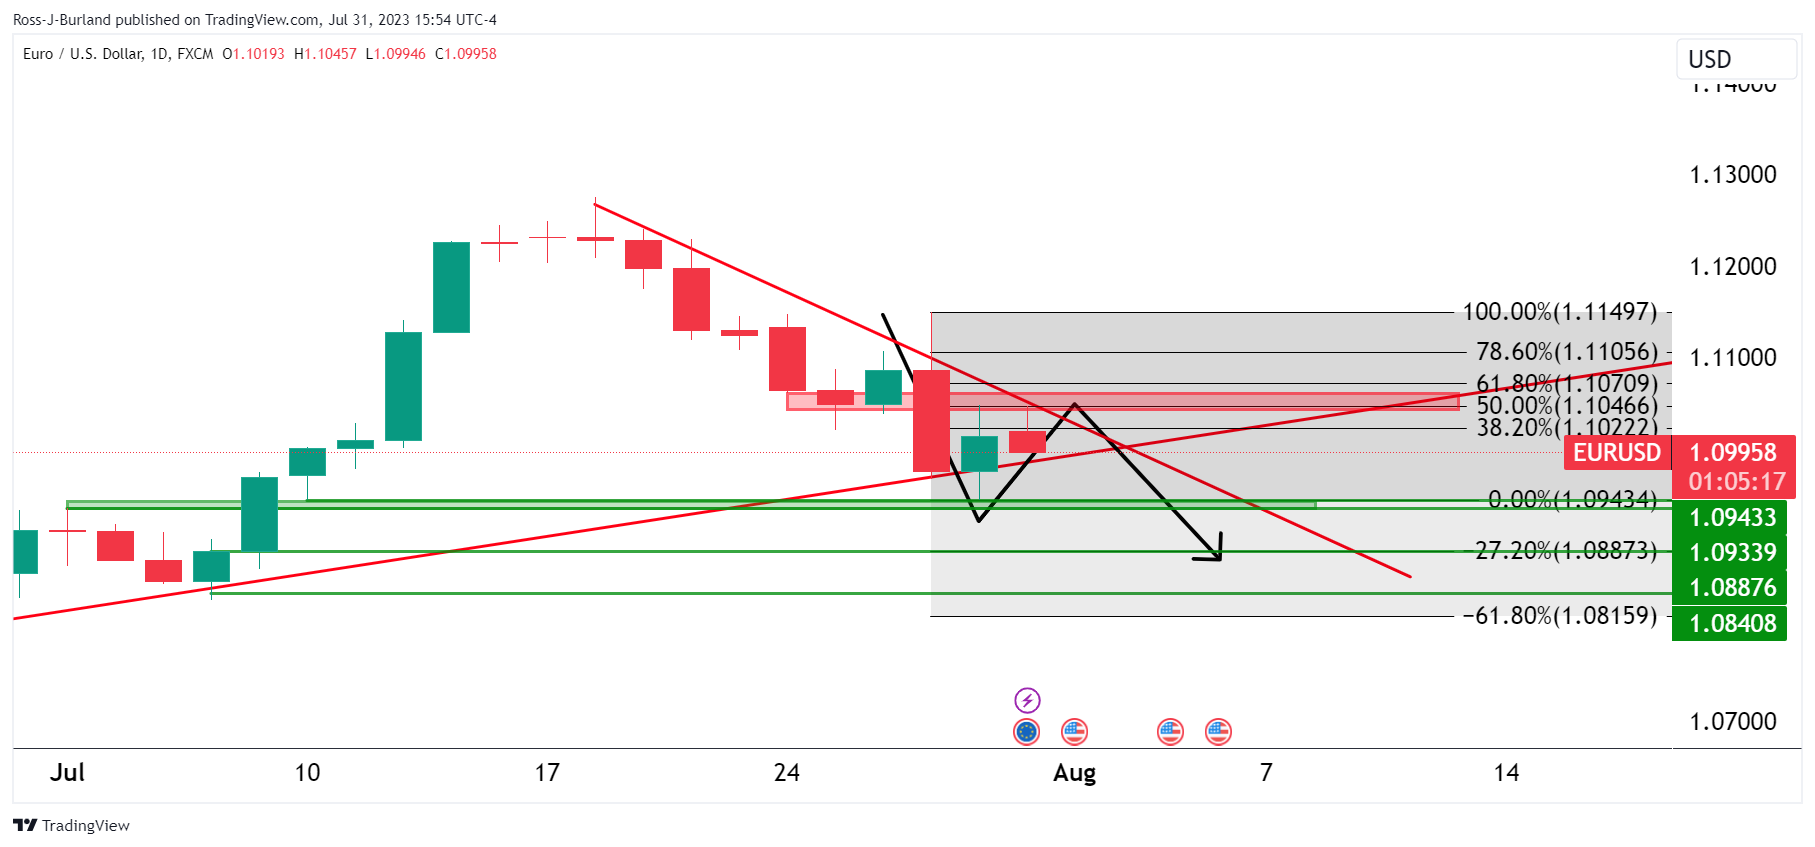
The daily charts above show the Euro is facing resistance in a 50% mean reversion area on the daily charts and a break of support opens risk to towards 1.0850 next support.
- GBP/USD bears are in the market and eye a breakout to target H4 W-formation neckline.
- Bulls could still hold up the bears ate key structure support.
GBP/USD is offered on Monday, extending losses from Friday while the dollar index is finishing July down after a similar loss in June. However, the Greenback is rebounded from July lows that printed following below-forecast US core PCE that favoured the Fed being done with rate hikes. The following illustrates the prospects of a low close for the day on the charts:
GBP/USD weekly chart
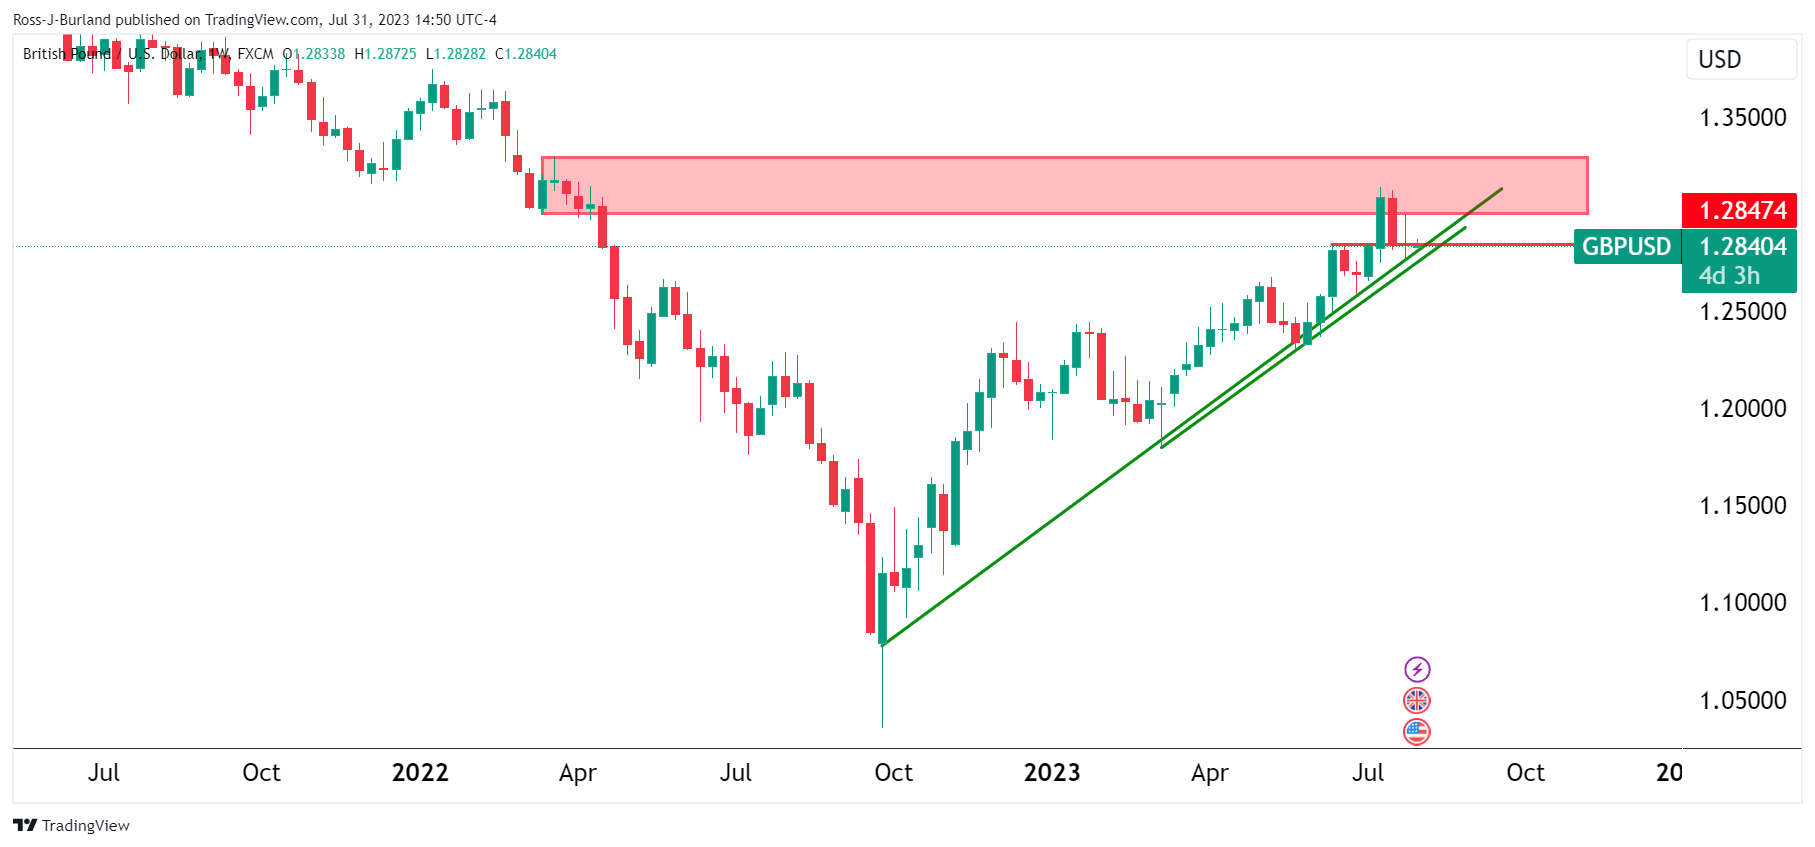
GBP/USD is pressured below the prior week's lows but remains on the front side of the bullish trendline.
GBP/USD daily and H4 charts
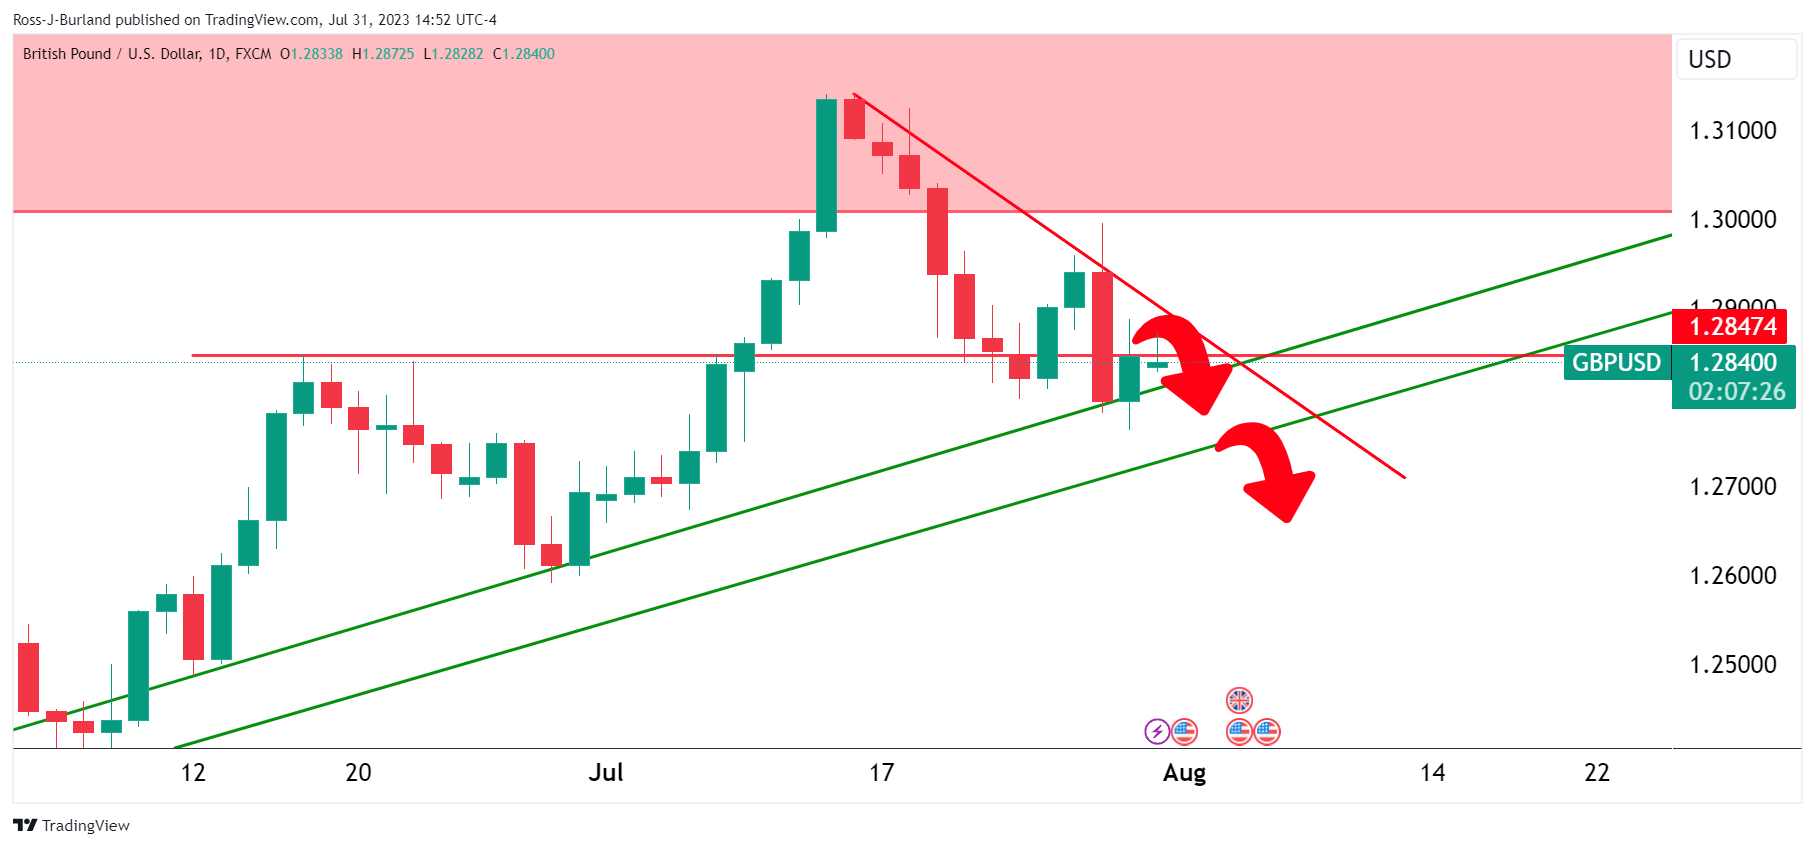
On the daily chart, we are coiling on the front side of the bearish trend and tinkering on the edge of a bearish breakout.
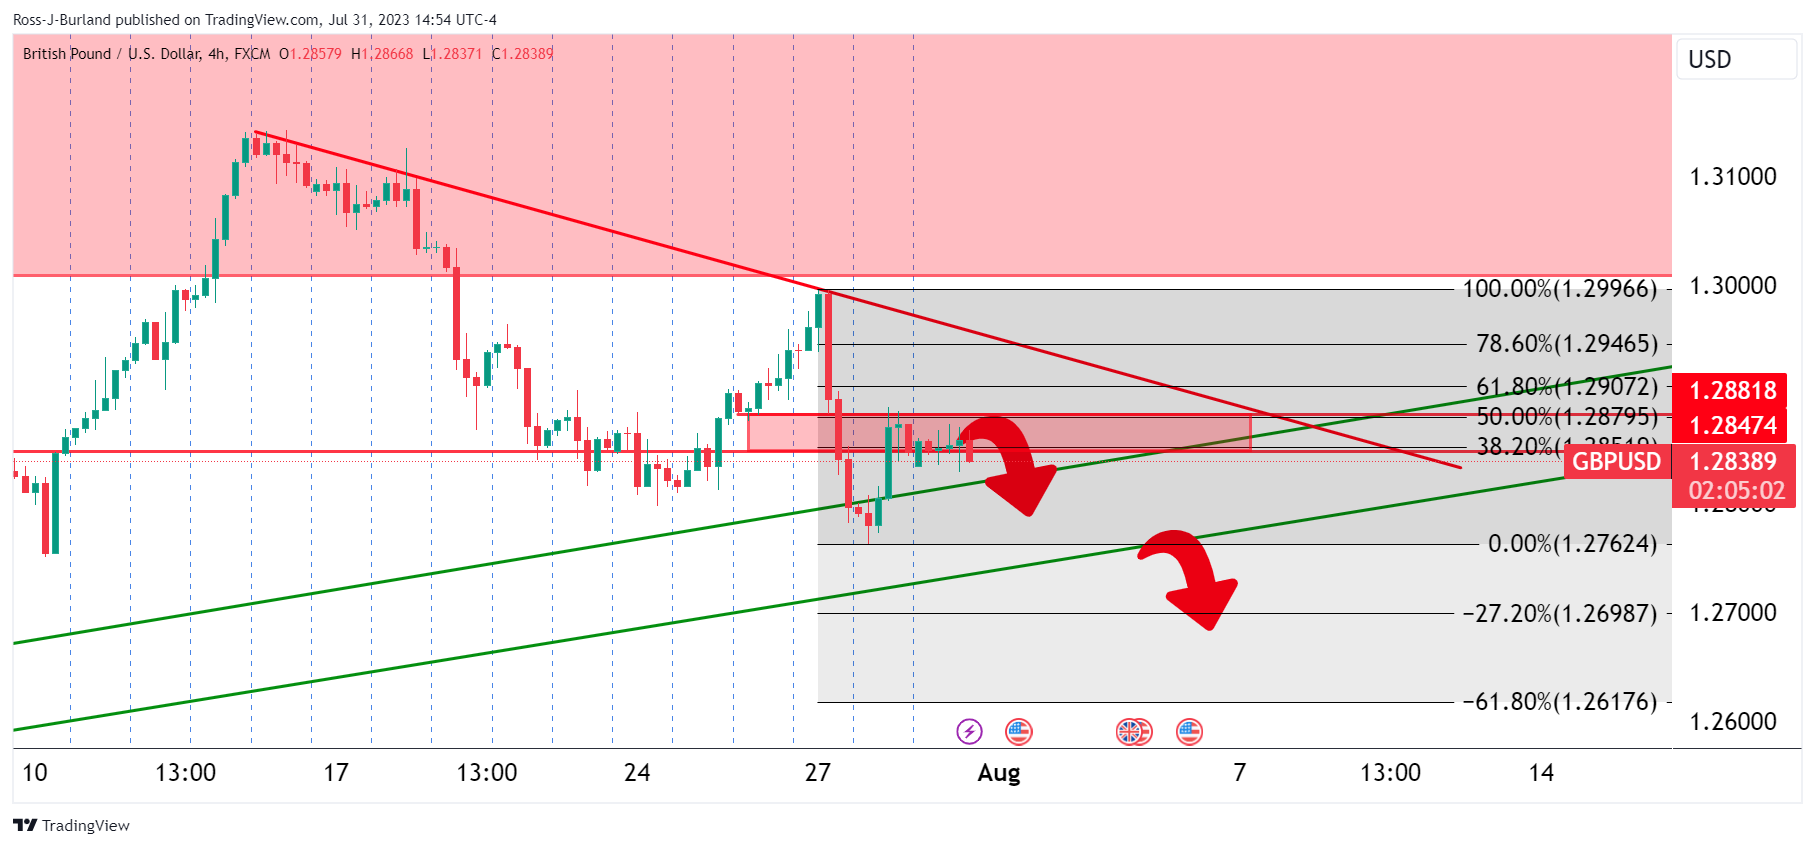
The four-hour chart shows the bears moving from resistance and a 50% mean reversion level.
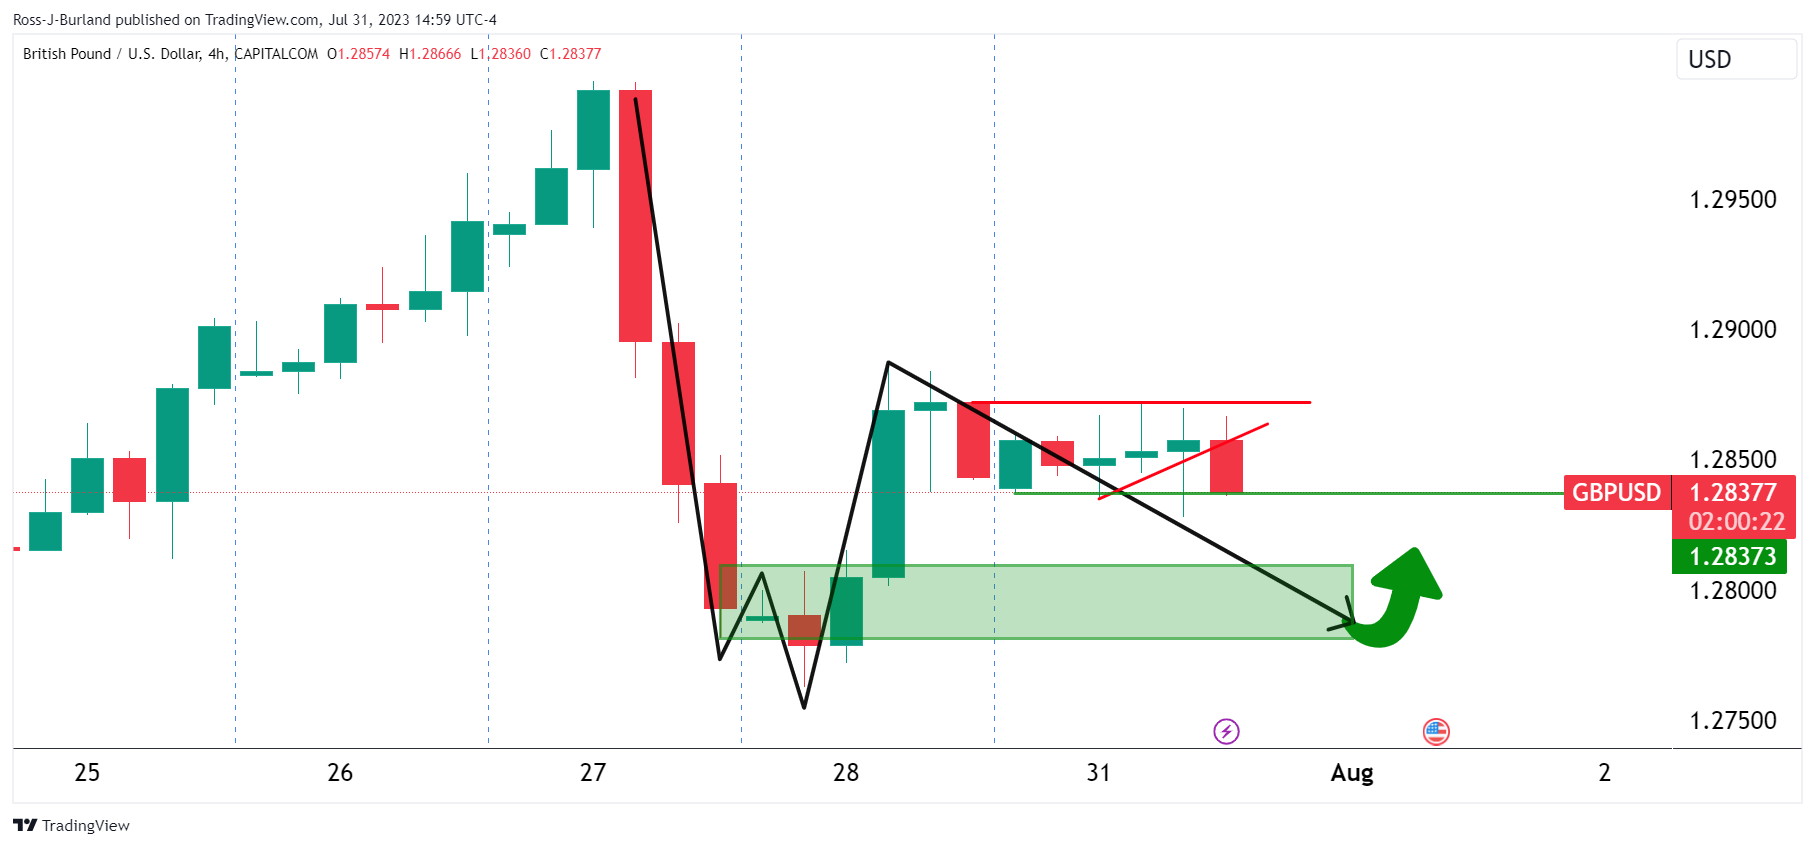
This leaves the W-formation's neckline vulnerable on a break below 1.2837.
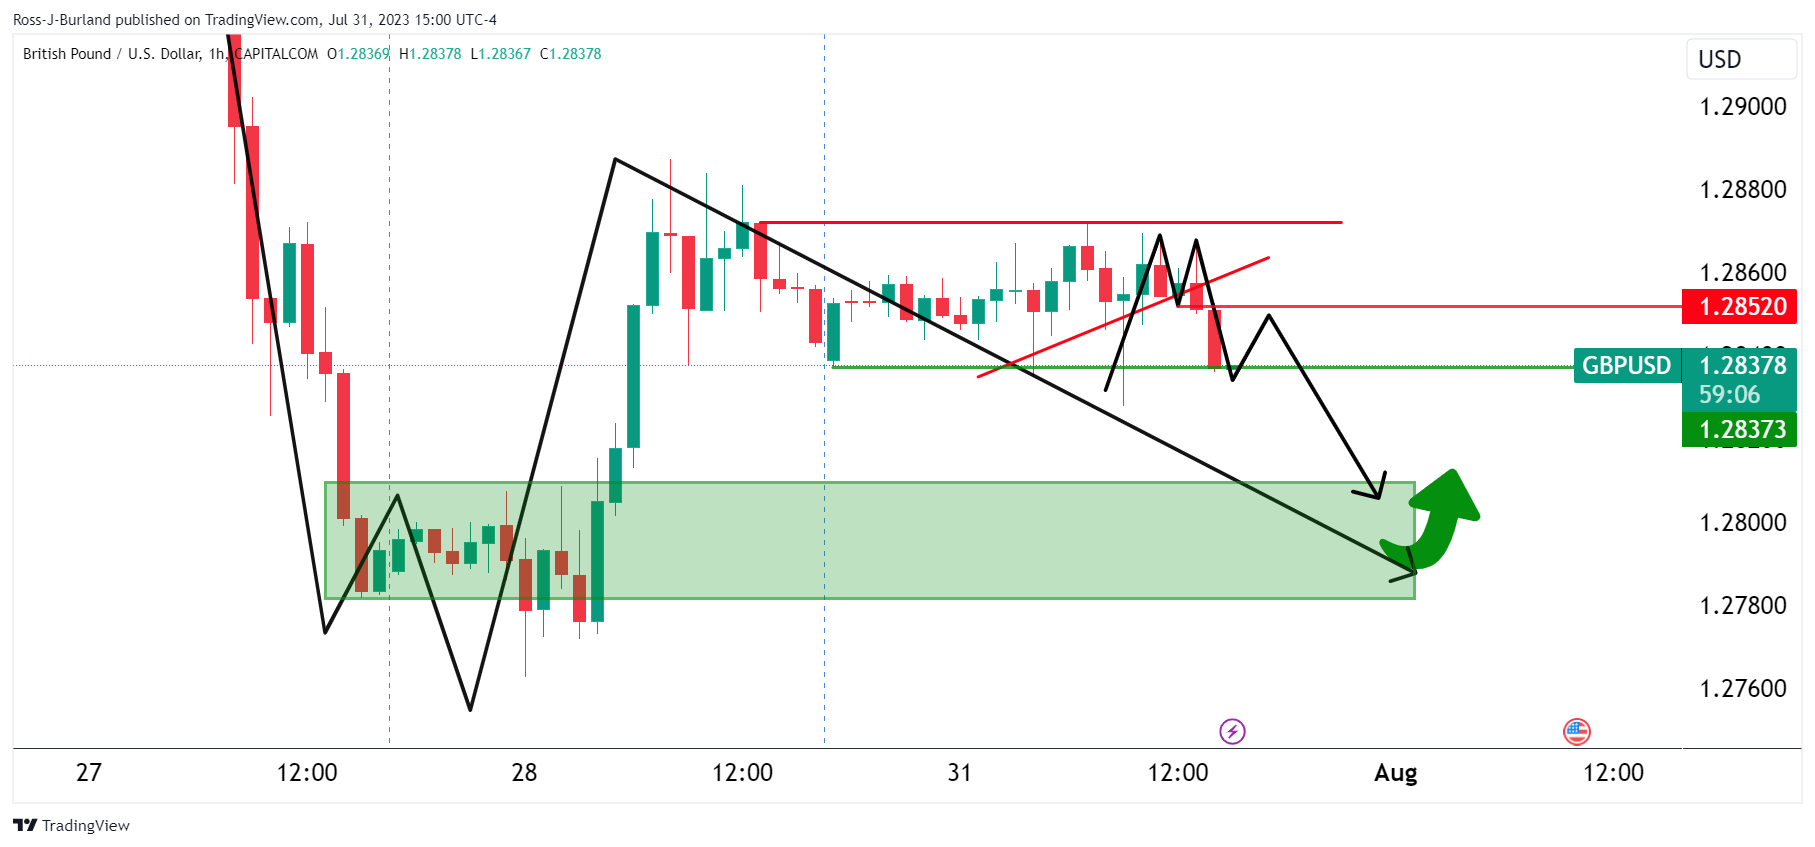
With that being said, there is the risk of a correction into the hourly M-formation's neckline first.
The Federal Reserve (Fed) released the July 2023 Senior Loan Officer Opinion Survey on Bank Lending Practices (SLOOS) that “addressed changes in the standards and terms on, and demand for, bank loans to businesses and households over the past three months, which generally correspond to the second quarter of 2023.” The survey showed, on balance, tighter standards and weaker demand for commercial and industrial loans to firms of all sizes over the second quarter. Regarding the outlook, banks reported that they expect to tighten standards on all loan categories.
Key takeaways:
“Regarding loans to businesses, survey respondents reported, on balance, tighter standards and weaker demand for commercial and industrial (C&I) loans to firms of all sizes over the second quarter. Meanwhile, banks reported tighter standards and weaker demand for all commercial real estate (CRE) loan categories.”
“For loans to households, banks reported that lending standards tightened across all categories of residential real estate (RRE) loans, especially for RRE loans other than government-sponsored enterprise (GSE)-eligible and government loans. Meanwhile, demand weakened for all RRE loan categories.”
“Standards tightened for all consumer loan categories; demand weakened for auto and other consumer loans, while it remained basically unchanged for credit card loans.”
“Banks reported that, on balance, levels of standards are currently on the tighter end of the range for all loan categories. Compared with the July 2022 survey, banks reported tighter levels of standards in every loan category.!
“Regarding banks' outlook for the second half of 2023, banks reported expecting to further tighten standards on all loan categories.”
- USD/CAD fell more than 0.50% on Monday, below the 20-day SMA towards the 1.3170 area.
- Higher Oil prices support the CAD while the USD trades relatively flat.
- All eyes are on US employment data from July.
On Monday, the USD/CAD cut a four-day winning streak and fell below the 20-day Simple Moving Average (SMA) near the 1.3170 area. A flat USD, higher Oil prices and a better market mood are responsible for the CAD’s advance. All eyes are now on US employment data to be released this week.
Regarding the next set of employment data, markets foresee a decline in job creation while maintaining wages and an unchanged unemployment rate. Since Chair Powell stated last week that the decision to set the next interest rate will only be based on new data, the direction of the US labour market will be crucial for investors to model their expectations regarding the next Fed decisions. Powell also mentioned that the banks anticipate below-trend growth and "some" labour market softening to normalise inflation.
The JOLT's Job Opening report will be released on Tuesday, and the ADP Employment Change on Wednesday. The primary week's highlight, the Non-Farm Payrolls (NFP) report, will be released on Friday. New unemployment claims data will be released on Thursday.
On the CAD front, the week’s highlight will be the S&P Global Manufacturing PMI from July. In the meantime, CAD’s bulls are supported by higher Oil prices as the West Texas Intermediate (WTI) barrel rose to $81.13 and the Brent to $84.88.
USD/CAD Levels to watch
The USD/CAD has a bearish outlook for the short term, per the daily chart. The Relative Strength Index (RSI) and Moving Average Convergence Divergence (MACD) hint at a strong bearish momentum. Furthermore, the pair is below the 20,100 and 200-day Simple Moving Averages (SMAs), implying that the bears retain control on a broader scale.
Support levels: 1.3150, 1.3120, 1.3100.
Resistance levels: 1.3215 (20-day SMA), 1.3250, 1.3270.
USD/CAD Daily chart
-638264264371001706.png)
- XAG/USD rose more than 1% and jumped near $24.70.
- The USD trades flat, allowing precious metals to advance.
- JOLTs Job openings, ADP and NFP from the US from July reports are the week's highlights.
On Monday, the XAG/USD saw significant gains, mainly by a positive market mood and a relatively weak USD. That being said, markets may see volatility during the week as the US will release key labour market data that will affect the bets on the next Federal Reserve (Fed) decisions.
According to the consensus, July saw a decline in job creation, while hourly wages and the unemployment rate held steady. In that, the direction of the US labour market will be crucial for investors, as Chair Powell noted last week that the decision to set the next interest rate will only be based on new data. In addition, he added that to normalise inflation, the Fed expects “some” softening of the labour market.
The JOLTs Job Opening report will be released on Tuesday, and the ADP employment change report will be released on Wednesday. New jobless claims data will be released on Thursday, and the Non-Farm Payrolls (NFP) report on Friday, the primary week’s highlight.
As for now, according to World Interest Rate Possibilities (WIRP) tool, the markets are currently pricing in a 25% chance of a 25 bps hike in the September meeting and a 40% chance of a 25 bps hike in November. However, those expectations may see significant changes this week, which could fuel volatility in bond markets and hence in the price dynamics of the precious metals.
XAG/USD Levels to watch
Based on the daily chart, the XAG/USD appears to be bullish in the short term, as the Relative Strength Index (RSI) and Moving Average Convergence Divergence (MACD) suggest that the buyers have control as they stand in positive territory. Additionally, the pair is above the
20,100,200-day SMAs, highlighting the continued dominance of bulls on a broader scale.
Resistance levels: $24.90,$25.00, $25.30.
Support levels: $24.30, $24.15 (20-day SMA), $24.00.
XAG/USD Daily chart
-638264197668314913.png)
- NZD/USD jumped more than 1% above 0.6200 and threatens the 200-day SMA at 0.6222.
- The US reported mixed low-tier economic data.
- All eyes are on US employment data to be released on Thursday and Friday.
On Monday, the NZD/USD gained significant ground after three consecutive days of losses jumping above the 0.6200 threshold. However, bulls need the acceptance of the 200-day Simple Moving Average at 0.6222 to continue advancing.
The United States released low-tier economic data. The US Chicago PMI for July came in slightly below expectations at 42.8 vs 43, and the Dallas Manufacturing index declined in the same month but at a somewhat lower rate than anticipated, at -20 vs -26.3.
That being said, the main highlight of the week is the Non-Farm Payrolls (NFP) report to be released on Friday. The consensus expects job creation to have decreased in July and for hourly earnings and the unemployment rate to remain stable. It's noteworthy that Chair Powell stated last week that the next interest rate will be made solely based on new data, so the direction of the US labour market will be crucial for investors. On Tuesday, the JOLTs Job Opening will be released and on Wednesday, the economic calendar will feature the ADP employment change, followed by fresh Jobless claims data on Thursday.
In terms of the next Federal Reserve next monetary policy decisions, tightening expectations remain steady. According to World Interest Rate Possibilities (WIRP) tool, the markets are currently pricing in a 20% chance of a 25 bps hike in the September meeting and top out near 40% in the November meeting.
On the Kiwi’s side, investors will see New Zealand’s labour market data, which will be released in early Wednesday’s session.
NZD/USD Levels to watch
The technical outlook for the NZD/USD, as per the daily chart, is neutral to bullish, as the indicators are recovering but still weak. The Relative Strength Index (RSI) stands below just above the midline with a positive slope, while the Moving Average Convergence Divergence (MACD) still prints red bars. On the other hand, the pair is below the 20 and 200-day Simple Moving Averages (SMA) but above the 100-day SMA, implying that the bulls remain in control on a broader scale.
Resistance levels: 0.6222 (200-day SMA),0.6230 (20-day SMA), 0.6250.
Support levels: 0.6200 (100-day SMA), 0.6180, 0.6150.
NZD/USD Daily chart
-638264141253718456.png)
Crude oil output of OPEC (Organization of the Petroleum Exporting Countries) declined by 840,000 barrels per day (bpd) from June to July to 27.34 million bpd, a Reuters survey showed on Monday.
During that period, Angola and Nigeria reportedly failed to reach the agreed oil output and Saudi Arabia reduced its production by 860,000 as part of its voluntary output cut. Increases in Angola and Iraq's outputs, however, limited the decline in the organization's total output.
Market reaction
Crude oil prices continue to push higher following this headline. As of writing, the barrel of West Texas Intermediate was trading at its highest level since mid-April at $81.60, gaining 1.2% on a daily basis.
The Reserve Bank of Australia (RBA) will announce its next Interest Rate Decision on Tuesday, August 1 at 04:30 GMT and as we get closer to the release time, here are the forecasts by the economists and researchers of 10 major banks regarding the upcoming central bank's decision.
RBA is expected to hike rates 25 bps to 4.35%, the highest level in more than a decade. At the last meeting, the bank left rates steady at 4.10% and some analysts look for steady rates after the latest Australian economic data.
ANZ
We expect the RBA to leave the cash rate unchanged in August. While we won’t completely rule out an August hike, we think the case for a pause is stronger: inflation is moderating faster than the RBA expected, consumer spending is slowing, and the RBA described monetary policy as ‘clearly restrictive’, in its recent minutes.
TDS
We expect the RBA to resume hiking by 25 bps though it is a fairly close call with analysts almost evenly split on the decision and OIS only pricing in 20% chance of a hike. To justify a hike, the RBA could use the updated economic forecasts to highlight upside inflation risks from the red-hot labour market, rebound in housing activity and strong population growth.
ING
The RBA can use the latest inflation data as an excuse to leave the cash rate target unchanged at 4.1% this month. Our current thinking is that the bank will maintain rates at the current level until September, which could respond to inflation backtracking higher, or just not making sufficient downward progress. The latest data from the Australian Bureau of Statistics shows that the CPI for the second quarter fell to 6.0% YoY, lower than the 6.2% consensus. This is also the lowest quarterly rise since September 2021. As both headline and trimmed mean inflation are now below the central bank’s forecast, this gives it a good reason to believe that it is time to stop.
SocGen
We expect the RBA to maintain its cash rate target of 4.10% which would mark a two-month ‘pause’ since the July meeting. The policy statement is unlikely to differ much from July. It will probably suggest that the tightening cycle has not yet ended, and cite developments in the global economy, trends in household spending and the outlook for inflation and the labour market as the key factors influencing policy decisions. We maintain our base-case scenario that the RBA will implement one more 25 bps hike toward a terminal policy rate of 4.35%.
BMO
Although we expected the last two rate hikes, the most recent decision to pause was a surprise. With inflation cooling in recent months, but still well outside the 2%-to-3% target and retail sales slumping, we judge that the central bank is nearing the end of its rate hike path. Once again, we will go against consensus. We look for the RBA to finish off with a more moderate rate hike of 15 bps; but given the unpredictability of Governor Lowe, will not be shocked if we are wrong.
Citi
The RBA is expected to hike by another 25 bps this week in its August Monetary Policy Board meeting though we do see a risk that the Bank may once again pause to re-assess impact of the current hikes to date. Friday’s weaker-than-expected Australia retail sales result and Q2 CPI earlier in the week certainly increase the odds of a hold. But upward revisions to wages and employment, but minimal revisions to inflation could imply at least two more rate hikes.
Wells Fargo
We think Australia's central bank could hold its policy rate steady for a second straight meeting at 4.10%. While it is possible the peak in the policy rate has already been reached, the outlook remains fluid, and we remain flexible. In particular, if progress with respect to slowing price and wage inflation were to stall, the RBA could easily resume hiking rates in the months ahead.
Westpac
The RBA will raise the cash rate by 25 bps to 4.35%. Given the lasting stickiness in services inflation, the RBA should take out more ‘insurance’ with a 25 bps increase in August, reaching a terminal rate of 4.35%. Thereafter, the Board can retain a tightening bias while assessing inflation’s downtrend and the evolution of risks.
NAB
We expect a hold while retaining a tightening bias.
UOB
The RBA is aware that rates are ‘clearly restrictive’, and there is a chance they remain on pause at 4.10%. However, we look for a further 25 bps rate hike, keeping in mind that inflation rates remain substantially above the RBA’s target band of 2-3%. The decision will nonetheless be a close call.
Gold has been oscillating within a confined range between $1,945 and $1,987. Strategists at the Bank of America analyze XAU/USD technical outlook.
Gold to approach the $1,900 region again on a dip below $1,945
The price action of gold in the period from May to July is increasingly resembling a 'head and shoulders' base pattern. This pattern is typically a bullish reversal pattern that indicates a potential shift from a downtrend to an uptrend.
If Gold can rally and break above the $1,987 level in the next five trading sessions, it would reinforce the belief in the 'head and shoulders' base formation, potentially indicating a move upwards to the $2,070 level.
Should Gold drop below the $1,945 level, we see a risk that prices might descend to retest their lows or the 200-Day Simple Moving Average (SMA), which hovers around the $1,900 mark.
Cable has retreated from its recent high, but the Pound remains the best-performing G10 currency in the year to date. Economists at Rabobank analyze GBP outlook.
GBP/USD seen at 1.26 on a three-month view
The most optimal outlook for GBP bulls from this week’s BoE policy meeting would be a hawkish outlook combined with UK growth forecasts that avoid recession.
While we are not expecting the Bank to forecast a recession at this point, it is likely that estimates for UK economic activity in 2024-25 will be downgraded. This scenario should allow the Pound to side-step any strong sell-off in the near term. That said, interest rate hikes take time to impact and a 25 bps rate hike this week will take Bank rate to a 15-year high. As the BoE grapples to bring inflation under control, UK recession remains our base case scenario. On this view, GBP is likely to run into headwinds later this year.
We are forecasting a move lower in Cable back to GBP/USD 1.26 on a three-month view.
The Mexican Peso is on track for a 7th successive higher monthly close, matching the run of 2008. Economists at Société Générale analyze USD/MXN outlook.
Break above 17.15 essential to denote a short-term uptrend
USD/MXN decline has gradually accelerated after it gave up the 50-DMA in March. The pair is not far from a multi-month descending trend line near 16.60/16.40. The move is a bit overstretched however signals of a meaningful rebound are not yet visible.
A break above the MA near 17.15 would be essential to denote a short-term uptrend.
Below 16.40, next potential objectives are situated at projections of 16.10 and 15.90.
- EUR/USD looks to add to Friday’s advance north of 1.1000.
- Extra upside faces the next barrier at the weekly top around 1.1150.
EUR/USD climbs further and revisits the 1.1040 region, or daily highs, at the beginning of the week.
In light of the recent price action, the pair could see its selling pressure somewhat mitigated on a breakout of the weekly low of 1.1149 (July 27). Once this level is cleared, spot could the attempt a challenge of the 2023 top at 1.1275 (July 18).
Looking at the longer run, the positive view remains unchanged while above the 200-day SMA, today at 1.0723.
EUR/USD daily chart
- DXY gathers further upside traction and retests 101.80/85.
- Further upside targets the weekly high past 102.00.
DXY maintains the optimism well in place and advances for the third session in a row at the beginning of the week.
The index appears poised to extend the ongoing multi-session recovery for the time being. Against that, the surpass of the weekly top of 102.04 (July 28) should prompt the index to embark on a probable visit to the transitory 100-day and 55-day SMAs at 102.40 and 102.56, respectively.
Once this region is cleared, it should alleviate the downside bias in the dollar and allow for extra gains.
Looking at the broader picture, while below the 200-day SMA at 103.73 the outlook for the index is expected to remain negative.
DXY daily chart
Economists at Rabobank analyze EUR and GBP outlook.
UK recession risks to undermine long GBP positions into the final months of the year
We currently see risks to both GBP and the EUR as being well-balanced.
Despite concerns about the stickiness of core inflation in the Eurozone, we see risk that ECB rates have already peaked. By contrast, we expect the BoE to follow an anticipated 25 bps rate hike this week with another in September. While interest rate differentials would appear to favour the Pound, we expect UK recession risks to undermine long GBP positions into the final months of the year.
We expect both GBP and the EUR to give back some ground vs. the USD in the coming months and for EUR/GBP to remain close to recent ranges.
Senior Economist at UOB Group Alvin Liew reviews the latest advanced GDP figures in the US economy for the April-June period.
Key Takeaways
The advance estimate of the 2Q 2023 GDP surprised on the upside with a 2.4% q/q SAAR expansion thanks to resilient consumption and a strong boost of business spending (vs Bloomberg est 1.8% q/q SAAR and UOB est 1.6%, but was exactly in line with Atlanta Fed’s GDPNow estimate), accelerating from 2.0% in 1Q. Compared to one year ago, the US GDP grew by 2.6% y/y in 2Q, from 1.8% in 1Q.
The flipside of the still hot US economy is that it should keep the Fed thinking about further tightening to keep inflation at bay. That said, according to trading in futures data compiled by Bloomberg (WIRP) (as of 28 Jul), the probability of a 25-bps rate hike in Sep FOMC stayed at a low 20% (unchanged from 27 Jul, and a tad lower from 21.5% on 26 Jul before the GDP release).
US GDP Outlook – US 1H GDP expansion has exceeded our projections, and as we alluded to our previous reports, while we continue to factor in a downward shift in US growth trajectory, we are no longer factoring an outright US GDP contraction and instead we are projecting a US growth slowdown in 2H 2023 (amounting to a soft landing). We still expect the lagged effects of US monetary policy tightening and tighter financial/credit conditions to slow the US economy but we are shifting our 2023 US GDP growth forecast higher to 1.2% (from 0.8% previously) to account for the stronger 1H growth outturn and shallower 2H trajectory, which is a reflection of our overestimation of the monetary policy’s drag on near-term growth and underestimation of the resilience of the US labour market. That said, we are lowering our 2024 GDP growth forecast further to 1.0% (from 1.2% previously) to account for the lagged effect of US monetary policy.
- EUR/JPY adds to Friday’s sharp advance past 157.00.
- Extra gains now target the 2023 peak just above 158.00.
EUR/JPY advances for the second session in a row and surpasses the key 157.00 barrier on Monday.
The continuation of the upside momentum should initially target the 2023 high at 158.04 (July 21). The surpass of this levels exposes a move to the round level of 160.00 in the not-so-distant future.
So far, the longer term positive outlook for the cross appears favoured while above the 200-day SMA, today at 146.49.
EUR/JPY daily chart
Economists at Société Générale analyze S&P 500 technical outlook.
June high of 4,450 could be an important support
S&P 500 has staged a steady uptrend after breakout from a large base earlier this year. It is now inching closer to potential resistance zone of 4,650/4,680 representing a multi-month ascending trend line and high of March 2022.
Interestingly, daily MACD has turned flat and is languishing close to highest levels achieved in December denoting receding upward momentum. This is not a reversal signal however a phase of consolidation is not ruled out.
June high of 4,450 could be an important support near term.
If S&P 500 establishes itself beyond 4,650/4,680, next objective would be at previous highs near 4,818.
- AUD/USD climbs quickly above 0.6700 as US Dollar comes under pressure.
- Expectations indicate that US manufacturing sector will continue its contracting spree straight for the ninth month.
- The Australian Dollar will dance to the tunes of the interest rate decision by the RBA.
The AUD/USD pair stretches its north-side move above the round-level resistance of 0.6200 in the late European session. The Aussie asset is swiftly moving higher as the US Dollar Index (DXY) retreats ahead of the United States ISM Manufacturing PMI data, which will be published on Tuesday.
S&P500 is expected to open on a positive note, following positive cues from overnight futures. US equities are consistently getting bids amid earnings season. The US Dollar comes under pressure as investors are discounting weak expectations from US factory data.
The US manufacturing sector has been contracting for the past eight months due to an aggressive rate-tightening cycle by the Federal Reserve (Fed). Firms have been postponing their expansion plans to avoid higher interest obligations.
According to the estimates, US factory orders are seen at 46.5 vs. the former release of 46.0. This indicates that the US manufacturing sector will continue its contracting spree straight for the ninth month. After the US Manufacturing data, investors will shift their focus to Employment data to be reported by Automatic Data Processing (ADP) on Wednesday.
Meanwhile, the Australian Dollar will dance to the tunes of the interest rate decision by the Reserve Bank of Australia (RBA), which will be announced on Tuesday. Economists at UOB Group believe that the RBA is aware that rates are “clearly restrictive”, and there is a chance they remain on pause at 4.10%. However, we look for a further 25bps rate hike, keeping in mind that inflation rates remain substantially above the RBA’s target band of 2-3%. The decision on Aug 1, will nonetheless, be a close call.
USD trades mixed to slightly lower in quiet trade. Shaun Osborne, Chief FX Strategist at Scotiabank, analyzes Greenback’s outlook.
Eyes on NFP
Calendar-wise, it’s a pretty light session and overall focus is on Friday’s Nonfarm Payrolls data.
Beyond month-end today, the USD may consolidate a little more as investors leverage developments to determine whether the USD rebound can extend or, more likely in my opinion, runs out of momentum and resumes its broader decline.
See: USD Index to trade 101.00-102.00 near term – ING
- Australian Dollar rebounds after last week's depressing finish.
- A rise in Crude Oil prices could be a factor in the rebound, as Oil is Australia's second largest export.
- Tough support and resistance at 0.6700 is likely to be a pivotal level for bulls and bears.
The Australian Dollar (AUD) recovers against the US Dollar (USD) on Monday, rising back up to a band of major Moving Averages in the 0.6700 zone. The Australian Dollar manages to shrug off downbeat data from its largest trading partner China, helped, perhaps, by a rise in Crude Oil prices, given Petroleum is the country’s second-largest export.
AUD/USD trades in the lower 0.67s as the US session gets underway.
Australian Dollar news and market movers
- The Australian Dollar repairs Friday’s losses on Monday, rebounding back up to the confluence of support and resistance around 0.6700, on the back of a rally in Crude Oil prices and a flat US Dollar.
- Crude Oil is rising on the back of Saudi supply cuts and a drop in inventories, which now play a bigger role in influencing price than the US Dollar, due to differentiation away from a Dollar-centric market. Since the war in Ukraine and Russian sanctions, the Oil market has diversified away from the US Dollar into a variety of currencies, according to Reuters.
- Key data releases for the US Dollar in the week ahead, include US labor market data, with the release of the ADP report on Wednesday, the usual weekly Initial Jobless Claims on Thursday, and the crucial Nonfarm Payrolls on Friday.
- The ISM gauges for the US manufacturing and services sectors will also be under the spotlight, given the data-dependence context highlighted by the Federal Reserve in its last meeting on July 26.
- China’s Non-Manufacturing PMI data came out lower than previously on Monday morning, registering 51.5 in July compared to 53.2 in June.
- Chinese Construction PMI showed the most concerning decline given the sector’s importance as an employer in the context of rising unemployment in China, falling to 51.2 in July from 65.6 in March.
- Manufacturing PMI, meanwhile, beat expectations of 49.2 but only by one point, coming out at 49.3, from June’s 49.0.
- The Chinese authorities released more policy guidelines but no concrete support measures after the data on Monday.
- At an official news conference, the Chinese state planner gave only vague promises to “study and formulate policies” though investors were left wanting more, according to a report by Reuters.
Australian Dollar technical analysis
AUD/USD is in a sideways trend on both the long and medium-term charts. The February high at 0.7158 is a key hurdle, which if vaulted, will alter the outlook to one that is more bullish longer term.
Likewise, the 0.6458 low established in June is a key level for bears, which if breached decisively, would give the chart a more bearish overtone from a longer-term perspective.
-638264038489123026.png)
Australian Dollar vs US Dollar: Weekly Chart
The confluence of moving averages (MA) close to 0.6700, made up of all the major SMAs – the 50-week, 50-day and 100-day – remains a key support and resistance level. The exchange rate is currently challenging this level from below after temporarily breaking below it on Friday.
-638264037916354824.png)
Australian Dollar vs US Dollar: Daily Chart
Whether the break was decisive is questionable – Friday’s candlestick is long and red but the close was not as close to the low as would be desirable for a really bearish signal. Nevertheless, it did cleanly breach the level.
With last week’s move down it is possible price may have completed a Measured Move pattern or three wave ABC correction (see labels on daily chart), where waves A and C are of similar length. If so, it is not surprising Monday is showing a reversal higher, although for how long the up move will last, it is impossible to tell.
On Monday price has recovered back up to the 0.6700 area and the cordon of MAs. It would require a decisive break above this level to reinvigorate short-term bullish hopes. Otherwise, the exchange rate has every chance of recapitulating and continuing last week’s bearish tone lower. A break below Friday’s 0.6623 low would revive the short-term downtrend.
Because the pair is in a sideways trend on the higher time-frame charts, the probabilities do not favor one scenario over another – nor is the Relative Strength Index (RSI) providing much insight on either timeframe.
A break below the 0.6623 lows, however, would probably indicate a continuation down to 0.6600 and the June lows, after which a continuation down to the May lows at 0.6460, could be quite possible.
In technical terms, a ‘decisive break’ consists of a long daily candlestick, which pierces cleanly above or below the critical level in question and then closes near to the high or low of the day. It can also mean three up or down days in a row that break cleanly above or below the level, with the final day closing near its high or low and a decent distance away from the level.
Australian Dollar FAQs
What key factors drive the Australian Dollar?
One of the most significant factors for the Australian Dollar (AUD) is the level of interest rates set by the Reserve Bank of Australia (RBA). Because Australia is a resource-rich country another key driver is the price of its biggest export, Iron Ore. The health of the Chinese economy, its largest trading partner, is a factor, as well as inflation in Australia, its growth rate and Trade Balance. Market sentiment – whether investors are taking on more risky assets (risk-on) or seeking safe-havens (risk-off) – is also a factor, with risk-on positive for AUD.
How do the decisions of the Reserve Bank of Australia impact the Australian Dollar?
The Reserve Bank of Australia (RBA) influences the Australian Dollar (AUD) by setting the level of interest rates that Australian banks can lend to each other. This influences the level of interest rates in the economy as a whole. The main goal of the RBA is to maintain a stable inflation rate of 2-3% by adjusting interest rates up or down. Relatively high interest rates compared to other major central banks support the AUD, and the opposite for relatively low. The RBA can also use quantitative easing and tightening to influence credit conditions, with the former AUD-negative and the latter AUD-positive.
How does the health of the Chinese Economy impact the Australian Dollar?
China is Australia’s largest trading partner so the health of the Chinese economy is a major influence on the value of the Australian Dollar (AUD). When the Chinese economy is doing well it purchases more raw materials, goods and services from Australia, lifting demand for the AUD, and pushing up its value. The opposite is the case when the Chinese economy is not growing as fast as expected. Positive or negative surprises in Chinese growth data, therefore, often have a direct impact on the Australian Dollar and its pairs.
How does the price of Iron Ore impact the Australian Dollar?
Iron Ore is Australia’s largest export, accounting for $118 billion a year according to data from 2021, with China as its primary destination. The price of Iron Ore, therefore, can be a driver of the Australian Dollar. Generally, if the price of Iron Ore rises, AUD also goes up, as aggregate demand for the currency increases. The opposite is the case if the price of Iron Ore falls. Higher Iron Ore prices also tend to result in a greater likelihood of a positive Trade Balance for Australia, which is also positive of the AUD.
How does the Trade Balance impact the Australian Dollar?
The Trade Balance, which is the difference between what a country earns from its exports versus what it pays for its imports, is another factor that can influence the value of the Australian Dollar. If Australia produces highly sought after exports, then its currency will gain in value purely from the surplus demand created from foreign buyers seeking to purchase its exports versus what it spends to purchase imports. Therefore, a positive net Trade Balance strengthens the AUD, with the opposite effect if the Trade Balance is negative.
Further upside in USD/IDR could challenge the 15,160 area in the near term, indicates UOB Group’s Markets Strategist Quek Ser Leang.
Key Quotes
Last week, we expected USD/IDR to trade sideways between 14,945 and 15,090. USD/IDR then traded in a higher range than expected (14,980/15,100). Upward momentum is beginning to improve, and this week, we expected USD/IDR to trade with an upward bias toward 15,160. The next resistance at 15,219 is highly unlikely to come under threat. Support is at 15,040, followed by 15,000.
Cable steady around 1.2850. Economists at Société Générale analyze GBP/USD technical outlook.
Important support situated at 1.2670/1.2600
GBP/USD tested the upper band of a multi-month channel near 1.31/1.3180 resulting in a phase of pullback. It has formed a series of lower peaks and troughs in daily time chart. This points towards potential downside in short-term however lower limit of the channel at 1.2670/1.2600 which is also recent pivot low is crucial support. Only if this gets violated would there be risk of a larger downtrend.
Test of 1.2670/1.2600 could result in a bounce. Last week's high of 1.3000 must be overcome for affirming continuation in up-move.
USD/MYR is seen extending the side-lined trading for the time being, suggests UOB Group’s Markets Strategist Quek Ser Leang.
Key Quotes
Last week, we expected USD/MYR to trade in a range between 4.5230 and 4.6000. However, USD/MYR dipped to 4.5150 and then rebounded to end the week little changed at 4.5530 (-0.09%). Despite dropping to 4.5150, there is no clear increase in momentum.
This week, we continue to expect USD/MYR to trade in a range, probably between 4.5250 and 4.5790.
USD/CAD is stuck in a familiar range. Economists at Scotiabank analyze the pair’s outlook.
More range trading appears likely in the near-term
Spot is holding in the same consolidation range and the same technical considerations are as relevant today as last week.
There appears to be firm resistance to USD/CAD advances through the low/mid 1.32s while bearish breakout support remains at 1.3160.
The USD needs to either break well through 1.3250 or 1.3150 to make clearer directional progress.
See – USD/CAD: Economic data and their impact should be the primary driver in the near term – Scotiabank
- USD/CAD sees support near 1.3200 amid US Dollar’s correction and rising oil prices.
- US factory activities are expected to contract straight for the ninth month.
- Oil prices soar above $81.00 as investors are seeing global interest rates peaking now.
The USD/CAD pair witnesses selling pressure after failing to sustain above the crucial resistance of 1.3250 in the London session. The Loonie asset attracts offers as the US Dollar Index (DXY) extends correction to near 101.60.
S&P500 futures generate some gains in Europe, portraying an upbeat market mood. US equities were heavily bought on Friday, supported by a rally in technology stocks. The USD Index faces a sell-off amid uncertainty ahead of the United States Manufacturing PMI, which will be announced on Tuesday at 14:00 GMT.
As per the preliminary report, US factory activities landed at 46.5 in July, higher than June’s release of 46.0. In spite of a higher figure, the economic data remained in a contraction phase. A figure below 50.0 is considered a contraction in economic activities. It is worth noting that US factory activities have been consistently contracting for the past eight months due to higher interest rates and tight credit conditions by US regional banks.
Apart from the Manufacturing PMI, investors will focus on forward orders report. The economic data is seen declining to 44.0 vs. the prior release of 45.6. The underperformance of the US Manufacturing PMI would allow the Fed to keep interest rates steady in September monetary policy. Meanwhile, the 10-year US Treasury yields seem sluggish around 3.96%.
On the Canadian Dollar front, investors await labor market data, which will release later this week. According to the estimates, the Canadian economy added 20.6K fresh payrolls in July, lower than the additions of 59.9K recorded in June. The Unemployment Rate is seen rising to 5.5% vs. the former release of 5.4%.
Meanwhile, oil prices soar above $81.00 as investors are seeing global interest rates peaking now. Investors should note that Canada is the leading exporter of oil to the United States and higher oil prices support the Canadian Dollar.
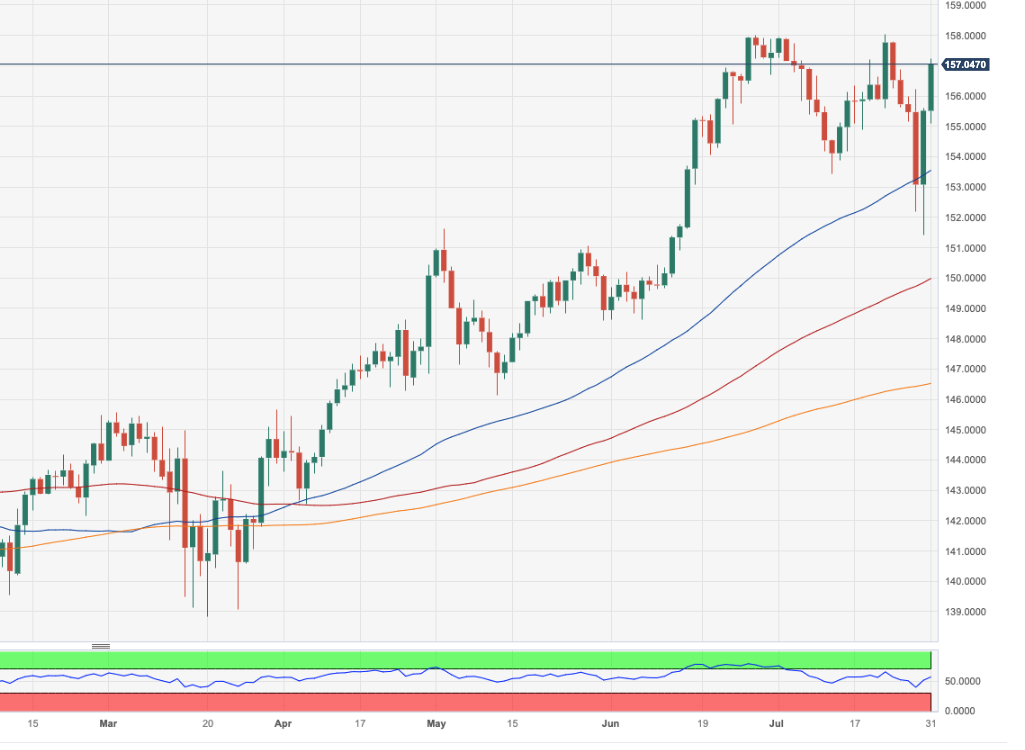
USD/JPY trades at multi-week highs. Economists at Société Générale analyze the pair’s technical outlook.
Defence of 140.20 crucial for persistence in up-move
USD/JPY has defended the key support zone of 138/137 representing the upper part of the previous consolidation and the 200-DMA second time within a month. A short-term bounce is taking shape. June’s high of 144.50/145 is expected to be an important hurdle.
Defence of 140.20, the 50% retracement of the recent bounce would be crucial for persistence in the up-move.
EUR/USD is consolidating above 1.10. Economists at Scotiabank analyze the pair’s outlook.
Support is seen at 1.1010/15
Short-term trading patterns lean a little more EUR-bullish after the modest gains through European trade pressured a small bull flag on the hourly chart and managed to establish a break higher.
Patterns suggest the EUR/USD pair could recover to the low/mid-1.11s in the next 1-2 sessions.
Support aligns at 1.1010/15.
See: EUR/USD will not receive any momentum any longer if the ECB follows the Fed – Commerzbank
Economists at Société Générale analyze Brent Oil technical outlook.
Next objective at $87.50 after breakout from base
Brent recently defended the low of March near $70 and evolved within a small base. A breakout from this accumulation has led it beyond the 200-DMA first time since August 2022.
Daily MACD has been posting positive divergence and has crossed above the equilibrium line denoting regain of upward momentum.
A short-term up move towards April high of $87.50 is expected.
Defence of the MA near $81 would be crucial for persistence in uptrend.
GBP/USD holds modest rebound. Economists at Scotiabank analyze the pair’s technical outlook.
Support seen at 1.2820/25
Sterling has recovered about half of last week’s late sell-off and is consolidating that advance in a tight range.
Cable gains through 1.2865 should see some additional strengthening in the short run at least and put the Pound on track to retest the 1.30 area.
Support is 1.2820/25.
See – GBP/USD: Scope for a deeper setback to the 55-DMA at 1.2676, but with support expected here – Credit Suisse
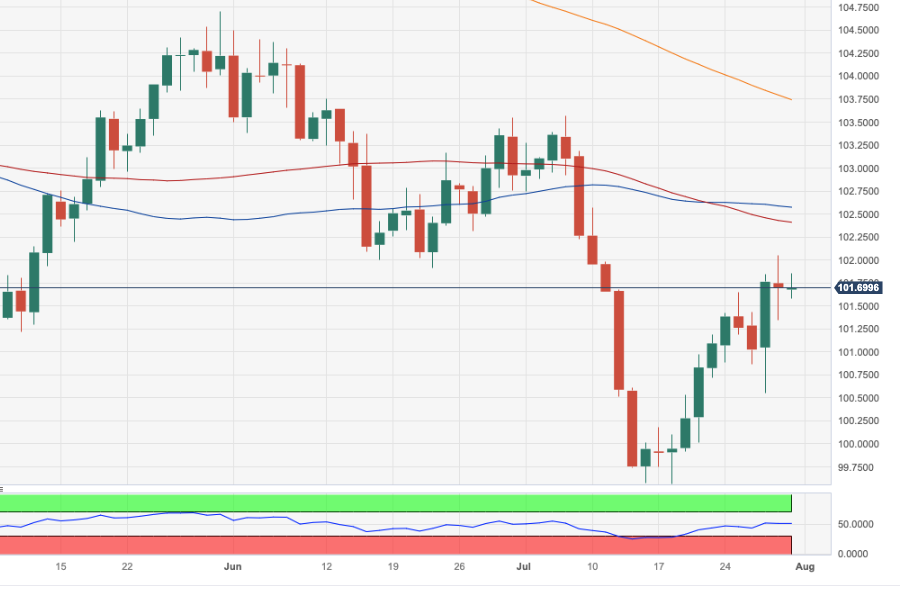
- The US Dollar holds steady against its major rivals to begin the week.
- The US Dollar Index stays above 101.50 after posting gains last week.
- US jobs report and other high-tier data release this week could drive USD performance.
The US Dollar stays resilient on Monday after posting strong gains against major rivals last week. The USD index – which tracks the USD's valuation against a basket of six major currencies – stays within a narrow consolidation channel above 101.50.
The USD gathered strength in the second half of last week as the data from the US revealed that the economy continued to grow at a healthy rate in the second quarter, while labor market conditions remained tight. As the US Bureau of Economic Analysis' monthly report showed that the Personal Consumption Expenditures (PCE) Price Index rose at a softer pace than anticipated, the USD rally lost steam ahead of the weekend.
The US economic docket will feature important labor market-related data releases this week, which could drive the USD's valuation. On Tuesday, the US Bureau of Labor Statistics will publish JOLTS Job Openings figures ahead of the ADP private sector employment on Wednesday and Nonfarm Payrolls on Friday. The ISM Manufacturing and Services PMI surveys will also be watched closely by investors this week.
Daily digest market movers: US Dollar awaits the next catalyst
- Inflation in the US, as measured by the change in Personal Consumption Expenditures (PCE) Price Index, fell to 3% on a yearly basis in June from 3.8% in May, the US Bureau of Economic Analysis reported on Friday. This reading came in below the market expectation of 3.1%.
- Core PCE Price Index, the Federal Reserve's preferred gauge of inflation, arrived at 4.1% on a yearly basis, down from 4.6% in May and below the market forecast of 4.2%. Further details of the publication revealed that Personal Income and Personal Spending increased 0.3% and 0.5% on a monthly basis, respectively.
- The real Gross Domestic Product (GDP) of the US expanded at an annualized rate of 2.4% in the second quarter, the US Bureau of Economic Analysis' (BEA) first estimate showed on Thursday. This reading followed the 2% growth recorded in the first quarter and surpassed the market expectation of 1.8% by a wide margin.
- According to the CME Group FedWatch Tool, markets are pricing in a 20% probability of a 25 basis points Federal Reserve (Fed) rate hike in September.
- The benchmark 10-year US Treasury bond yields stays in positive territory at around 4% on Monday.
- US stock index futures trade mixed following the risk rally seen on Friday.
- In an interview with CBS over the weekend, Minneapolis Federal Reserve Bank President Neel Kashkari said that he was not sure whether the Fed was done raising rates. Commenting on the jobs markets, Kashkari noted that it would not surprise him to see the unemployment rate tick up slightly.
- The Fed raised its policy rate by 25 basis points (bps) to the range of 5.25%-5.5% following the July policy meeting as expected. In the post-meeting press conference, Fed Chairman Jerome Powell refrained from confirming another rate hike this year and said that every policy meeting will be live. "If we see inflation coming down credibly, we can move down to a neutral level and then below neutral at some point," Powell told reporters, noting that the policy was already restrictive.
Technical analysis: US Dollar Index stabilizes above key technical level
The US Dollar Index (DXY) closed above the 20-day Simple Moving Average (SMA), currently located at 101.30, on Friday after testing that level in the early American session. In the meantime, the Relative Strength Index (RSI) indicator on the daily chart stays near 50 on Monday, reflecting a lack of directional momentum
On the upside, 102.00 (static level, psychological level) aligns as initial resistance before 102.50 (50-day SMA, 100-day SMA). A daily close above the latter could attract buyers and pave the way for an extended uptrend toward 103.00 (psychological level, static level).
Looking south, 101.30 (20-day SMA) stays intact as key support level. If DXY drops below that level and starts using it as resistance, 101.00 (psychological level, static level) could be seen as interim support ahead of 100.50 (static level) and 100.00 (psychological level).
US Dollar FAQs
What is the US Dollar?
The US Dollar (USD) is the official currency of the United States of America, and the ‘de facto’ currency of a significant number of other countries where it is found in circulation alongside local notes. It is the most heavily traded currency in the world, accounting for over 88% of all global foreign exchange turnover, or an average of $6.6 trillion in transactions per day, according to data from 2022.
Following the second world war, the USD took over from the British Pound as the world’s reserve currency. For most of its history, the US Dollar was backed by Gold, until the Bretton Woods Agreement in 1971 when the Gold Standard went away.
How do the decisions of the Federal Reserve impact the US Dollar?
The most important single factor impacting on the value of the US Dollar is monetary policy, which is shaped by the Federal Reserve (Fed). The Fed has two mandates: to achieve price stability (control inflation) and foster full employment. Its primary tool to achieve these two goals is by adjusting interest rates.
When prices are rising too quickly and inflation is above the Fed’s 2% target, the Fed will raise rates, which helps the USD value. When inflation falls below 2% or the Unemployment Rate is too high, the Fed may lower interest rates, which weighs on the Greenback.
What is Quantitative Easing and how does it influence the US Dollar?
In extreme situations, the Federal Reserve can also print more Dollars and enact quantitative easing (QE). QE is the process by which the Fed substantially increases the flow of credit in a stuck financial system.
It is a non-standard policy measure used when credit has dried up because banks will not lend to each other (out of the fear of counterparty default). It is a last resort when simply lowering interest rates is unlikely to achieve the necessary result. It was the Fed’s weapon of choice to combat the credit crunch that occurred during the Great Financial Crisis in 2008. It involves the Fed printing more Dollars and using them to buy US government bonds predominantly from financial institutions. QE usually leads to a weaker US Dollar.
What is Quantitative Tightening and how does it influence the US Dollar?
Quantitative tightening (QT) is the reverse process whereby the Federal Reserve stops buying bonds from financial institutions and does not reinvest the principal from the bonds it holds maturing in new purchases. It is usually positive for the US Dollar.
At first glance, everything is going in the right direction in terms of inflation. Dr. Jörg Krämer, Chief Economist at Commerzbank, shows why one should not bring out the champagne yet.
Next year inflation will return to the stage
Inflation is likely to rise again in the course of the coming year, once the normalisation of price increases for energy, food and other goods has been completed. The inflation rate should settle well above the ECB target.
At some point in the course of next year, the issue of inflation will come back onto the stage. Then the ECB, while generally inclined to loose monetary policy, should find it difficult to cut rates despite a weak economy. One should not celebrate too soon about falling inflation in the coming months.
UOB Group’s Markets Strategist Quek Ser Leang notes USD/THB is likely to face extra consolidation in the next sessions.
Key Quotes
After USD/THB plunged to a low of 33.75 and rebounded, we highlighted last Monday (24 Jul, spot at 34.50) that “The sharp drop appears to be overdone and we do not expect USD/THB to weaken this week.” We were of the view that USD/THB “is more likely to trade in a range, probably between 34.00 and 35.00.” USD/THB then traded in a narrower range than expected (34.03/34.61). The price actions still appear to be consolidative.
This week, we continue to expect USD/THB to trade in a range, even though the slightly soft underlying tone suggests a lower range of 33.80/34.50.
Kit Juckes, Chief Global FX Strategist at Société Générale, analyzes AUD ahead of Tuesday’s RBA Interest Rate Decision.
Little expectation of a move
Forecasters are evenly split, but market pricing indicates little expectation of a move by the Reserve Bank of Australia (RBA).
Maybe short-covering (as well as the positive risk backdrop) is enough to help Australian Dollar today, but I can’t see much follow-through at all on Tuesday unless the RBA springs a surprise.
See – AUD/USD: Aussie has very limited upside – SocGen
The European central bankers are copying the behavior of their colleagues in the US. Economists at Commerzbank analyze the implications for the EUR/USD pair.
Equal monetary policies under different circumstances have different effects
If the ECB more or less follows the Fed in its monetary policy that does not mean that EUR/USD will not receive any momentum any longer. Just from a different angle. Because equal monetary policies under different circumstances (inflation, growth, etc.) have different effects.
However, medium-term our EUR/USD projections are nonetheless based on the difference between Fed and ECB: our central bank watchers project that the Fed will soon cut its interest rates again, whereas the ECB will keep rates at the terminal levels for the foreseeable future. That would clearly be EUR-positive.
- EUR/JPY rises to near 157.00 as upbeat Eurozone data warrants more interest rate hikes from the ECB.
- Monthly Eurozone inflation deflated by 0.1% in July while GDP came out of contraction and expanded by 0.3% in Q2.
- The Japanese Yen has been hit hard despite BoJ allowing more flexibility to the YCC.
The EUR/JPY pair climbs swiftly above the crucial resistance of 157.00 in the European session amid multiple tailwinds. Eurozone preliminary Harmonized Index of Consumer Prices (HICP) decelerated in July and Gross Domestic Product (GDP) performance in Q2 remained stellar. While the Japanese Yen has been hit after the Bank of Japan (BoJ) provided more flexibility to the Yield Curve Control (YCC).
Eurostat reported that headline and core inflation deflated at a pace of 0.1% in July. On an annualized basis, headline inflation landed at 5.3% higher than expectations of 5.2% but remained below June’s print of 5.5%. Core inflation that excludes volatile oil and food prices remained unchanged at 5.5% and higher than the forecast of 5.5%.
It seems that Eurozone inflation is turning out sticky and warranting one more interest-rate hike by the European Central Bank (ECB) in its September monetary policy.
In addition to persistent inflationary pressures, the catalyst that is supporting the continuation of the rate-tightening cycle by the ECB is the upbeat April-June GDP data. The eurozone economy came out of contraction and expanded by 0.3% in the second quarter while the market forecasted a marginal growth of 0.1%.
ECB President Christine Lagarde commented on July 27 while delivering monetary policy commentary that the central bank will remain data-dependent ahead.
On the Japanese Yen front, Asian currency takes a bullet despite BoJ delivering a message of exiting from the ultra-dovish policy by allowing more flexibility to the YCC. Japanese Government Bonds (JGBs) deviation target is expected to remain at +-1%, which would reduce bond buying operations by the central bank.
UOB Group’s Economist Lee Sue Ann and Markets Strategist Quek Ser Leang argue that USD/CNH could see its downside momentum mitigated once it breaks above the 7.2000 level.
Key Quotes
24-hour view: We expected USD to rebound further last Friday, but we held the view that “it is unlikely to threaten 7.2000.” Instead of rebounding further, USD traded in a range of 7.1448/7.1780 before closing at 7.1490. The underlying tone has softened, and today, USD is likely to edge lower. However, any decline is unlikely to threaten last week’s low of 7.1170 (there is another support at 7.1300). On the upside, if USD breaks above 7.1700 (minor resistance is at 7.1600), it would mean that the current mild downward pressure has eased.
Next 1-3 weeks: Last Wednesday (26 Jul, spot at 7.1465), we highlighted that “downward momentum has increased, and there is room for USD to weaken further.” We added, “it is worth noting that there are a couple of strong support levels at 7.1240 and 7.1000.” After USD dropped to 7.1170 and rebounded, we highlighted last Friday (28 Jul, spot at 7.1700) that “If USD breaks above 7.2000 it would suggest that 7.1000 is not coming into view this time around.” We continue to hold the same view.
The Norwegian Krone has had a good summer. Economists at Nordea analyze NOK outlook.
No summertime sadness
The NOK is one of the main benefiters of inflation abroad coming in lower and global central banks signalling the end of rate hikes.
We remain sceptical about more NOK strengthening in the short to medium term. Norges Bank probably won’t raise their rate path even if inflation in June came in somewhat higher than expected. Norges Bank hiking less than the market anticipates points toward a somewhat weaker NOK.
We see EUR/NOK trading around 11.50 ahead.
In light of advanced figures from CME Group for natural gas futures markets, open interest dropped by nearly 3K contracts at the end of last week, partially reversing the previous daily build. In the same direction, volume kept the choppy activity and shrank by almost 71K contracts.
Natural Gas faces extra consolidation near term
Friday’s decent bounce in prices of natural gas was on the back of diminishing open interest and volume, removing some strength of a sustained rebound in the very near term at least. So far, the commodity remains poised to extend the ongoing consolidative phase, with gains limited around the June high near $2.90 per MMBtu.
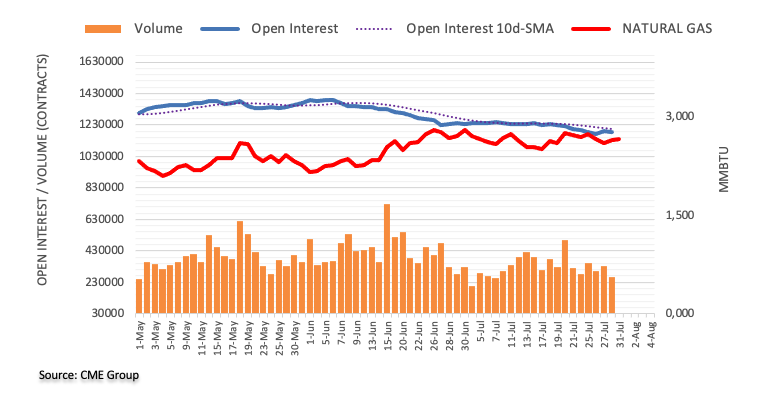
The Dollar is proving quite resilient. Economists at ING analyze USD outlook.
Dollar can probably trade out ranges over coming weeks
Cross-market volatility remains low – perhaps as investors are now expecting prolonged pauses in core interest rate markets. This remains a negative for the Japanese Yen and a positive for the high yielders including the Mexican Peso and the Hungarian Forint. The dollar is probably trapped somewhere in the middle here and unless we see some sharp deterioration in US activity that would favour the Fed not just pausing, but easing – the Dollar can probably trade out ranges over coming weeks.
DXY to trade 101.00-102.00 near term.
USD/JPY is seen keeping a bumpy trade within the 138.50-141.95 range in the next few weeks, comment UOB Group’s Economist Lee Sue Ann and Markets Strategist Quek Ser Leang.
Key Quotes
24-hour view: Last Friday, we held the view that USD could test the critical support at 138.50 but “it is unclear for now if it can maintain a foothold below this level.” We did not anticipate the volatile price actions as USD swung wildly in a wide range of 138.05/141.18 before ending the day on a strong note at 141.15 (+1.23%). The choppy price action has resulted in a mixed outlook. USD could continue to trade in a choppy manner, but likely in a narrower range of 139.70/141.60.
Next 1-3 weeks: We indicated last Friday (28 Jul, spot at 139.40) that “downward momentum is beginning to build again.” We also indicated that USD “must break clearly below the critical support at 138.50 before further weakness is likely.” While USD broke below 138.50, it rebounded strongly from 138.05. The choppy price actions and wide intraday range have resulted in a mixed outlook. For the time being, USD could trade in a choppy manner between 138.50 and 141.95
- USD/JPY surpasses 142.00 as investors digest BoJ policy tweak.
- BoJ allowed more flexibility in the YCC but kept interest rates in the negative territory.
- Risk-perceived assets discovered strength as the US core PCE price index softened further.
The USD/JPY pair sustains comfortably above the crucial resistance of 142.00 in the European session. The asset picks strength as the impact of a tweak in the interest rate policy by the Bank of Japan (BoJ) fades.
BoJ Governor Kazuo Ueda allowed more flexibility in the Yield Curve Control (YCC) but kept interest rates in the negative territory as the central bank aims to push inflation steadily above 2%. More flexibility to YCC delivered a strong message that the BoJ is building a roadmap for an exit from the ultra-loose policy.
Meanwhile, S&P500 turns positive after recovery losses in London, portraying a significant recovery in the risk appetite of the market participants. US equities were heavily bought on Friday, driven by upbeat demand for technology stocks.
Risk-perceived assets discovered strength as the United States core Personal Consumption Expenditure (PCE) price index softened further. Consumer spending is consistently declining as individuals avoid purchasing big-ticket items due to the higher burden of sticky inflation.
The US Dollar Index (DXY) remains topsy-turvy around 101.80 as investors await the United States Manufacturing PMI for July to be reported by the Institute of Supply Management (ISM). The economic data is expected to continue its eight months contracting spell amid higher interest rates by the Federal Reserve (Fed). US factory activities are expected to land at 46.5, higher than the former release of 46.0.
- Euro adds to Friday’s advance above 1.1000 against the US Dollar.
- Stocks in Europe open Monday’s session in a mixed tone.
- EUR/USD looks to regain further ground beyond 1.1000 the figure.
- EMU Flash headline Inflation Rate extended the downward trend in July.
- Germany’s Retail Sales contracted 1.6% YoY in June.
The Euro (EUR) is continuing to maintain its recovery against the US Dollar (USD) that began on Friday, which is causing EUR/USD to extend its upward trend after breaking through the important 1.1000 level at the start of the week.
The pair gained momentum after hitting a low of around 1.0940 on Friday, as the Greenback was undergoing a corrective move.
Currently, both US and European yields are trading with uncertainty, as investors are still digesting last week's interest rate decisions by the Federal Reserve and the European Central Bank (ECB).
Regarding the ECB, President Christine Lagarde has indicated that the central bank is keeping an "open-minded" approach to the upcoming September meeting and emphasized that the future rate decisions will depend on economic data. Similarly, Fed Chair Jerome Powell has reiterated multiple times that the Fed's decisions on rates will be data-dependent at the FOMC event on July 26.
In terms of speculative positioning, the net longs in EUR have remained relatively unchanged in the week ending on July 25th according to CFTC, which was prior to the FOMC and ECB gatherings. During this time, spot had retreated from yearly highs around 1.1275 (July 18) to the low 1.1000s.
In the Eurozone, Germany's Retail Sales declined by 1.6% YoY in June, and Italian Q2 GDP Growth Rate was lower than expected, with a QoQ contraction of 0.3% and YoY expansion of 0.6%. Additionally, preliminary inflation figures in the Euro area show that the Core CPI rose more than anticipated, by 5.5% YoY in July and 5.3% YoY in headline CPI. Finally, the flash Q2 GDP Growth Rate for the bloc shows that the economy expanded by 0.3% QoQ and 0.6% YoY.
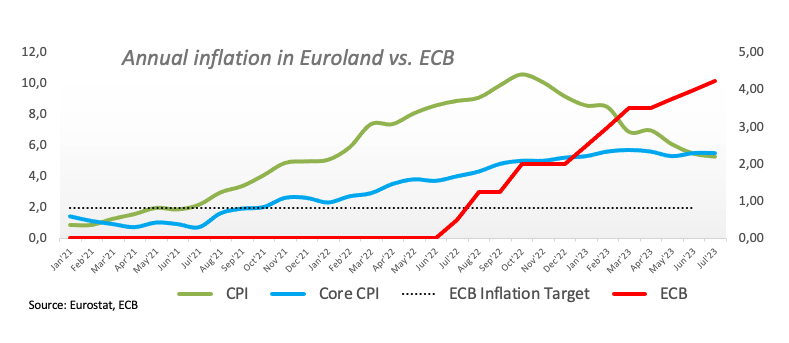
There are no significant data releases scheduled in the US docket for Monday.
Daily digest market movers: Euro keeps the rebound well in place
- The EUR picks up pace above the 1.1000 mark vs. the USD.
- The USD Index treads water around 101.70 on Monday.
- EMU flash GDP figures surprise to the upside in Q2.
- Core inflation in the euro area remains sticky.
- US, German yields trade without direction across all maturities.
- The Italian economy is expected to have contracted slightly in Q2.
- Markets’ attention is expected to be on the US labour market this week.
Technical Analysis: Euro faces a minor hurdle at 1.1150
EUR/USD manages to gather some impulse and extend the bounce off recent lows north of the 1.1000 hurdle so far on Monday.
If bears regain the upper hand, EUR/USD should put the weekly low of 1.0943 (July 28) to the test ahead of a probable move to the transitory 55-day and 100-day SMAs at 1.0908 and 1.0906, respectively. The loss of this region could open the door to a potential visit to the July low of 1.0833 (July 6) ahead of the key 200-day SMA at 1.0723 and the May low of 1.0635 (May 31). South from here emerges the March low of 1.0516 (March 15) before the 2023 low of 1.0481 (January 6).
On the other hand, occasional bullish attempts could motivate the pair to initially dispute the weekly top at 1.1149 (July 27). Above this level the downside pressure could mitigate somewhat and could encourage the pair to test the 2023 high at 1.1275 (July 18). Once this level is cleared, there are no resistance levels of significance until the 2022 peak of 1.1495 (February 10), which is closely followed by the round level of 1.1500.
Furthermore, the constructive view of EUR/USD appears unchanged as long as the pair trades above the key 200-day SMA.
Euro FAQs
What is the Euro?
The Euro is the currency for the 20 European Union countries that belong to the Eurozone. It is the second most heavily traded currency in the world behind the US Dollar. In 2022, it accounted for 31% of all foreign exchange transactions, with an average daily turnover of over $2.2 trillion a day.
EUR/USD is the most heavily traded currency pair in the world, accounting for an estimated 30% off all transactions, followed by EUR/JPY (4%), EUR/GBP (3%) and EUR/AUD (2%).
What is the ECB and how does it impact the Euro?
The European Central Bank (ECB) in Frankfurt, Germany, is the reserve bank for the Eurozone. The ECB sets interest rates and manages monetary policy.
The ECB’s primary mandate is to maintain price stability, which means either controlling inflation or stimulating growth. Its primary tool is the raising or lowering of interest rates. Relatively high interest rates – or the expectation of higher rates – will usually benefit the Euro and vice versa.
The ECB Governing Council makes monetary policy decisions at meetings held eight times a year. Decisions are made by heads of the Eurozone national banks and six permanent members, including the President of the ECB, Christine Lagarde.
How does inflation data impact the value of the Euro?
Eurozone inflation data, measured by the Harmonized Index of Consumer Prices (HICP), is an important econometric for the Euro. If inflation rises more than expected, especially if above the ECB’s 2% target, it obliges the ECB to raise interest rates to bring it back under control.
Relatively high interest rates compared to its counterparts will usually benefit the Euro, as it makes the region more attractive as a place for global investors to park their money.
How does economic data influence the value of the Euro?
Data releases gauge the health of the economy and can impact on the Euro. Indicators such as GDP, Manufacturing and Services PMIs, employment, and consumer sentiment surveys can all influence the direction of the single currency.
A strong economy is good for the Euro. Not only does it attract more foreign investment but it may encourage the ECB to put up interest rates, which will directly strengthen the Euro. Otherwise, if economic data is weak, the Euro is likely to fall.
Economic data for the four largest economies in the euro area (Germany, France, Italy and Spain) are especially significant, as they account for 75% of the Eurozone’s economy.
How does the Trade Balance impact the Euro?
Another significant data release for the Euro is the Trade Balance. This indicator measures the difference between what a country earns from its exports and what it spends on imports over a given period.
If a country produces highly sought after exports then its currency will gain in value purely from the extra demand created from foreign buyers seeking to purchase these goods. Therefore, a positive net Trade Balance strengthens a currency and vice versa for a negative balance.
Citing a senior official from Japan’s ruling Liberal Democratic Party (LDP) on Monday, Japanese media outlet – Jiji reported, “the Bank of Japan’s (BoJ) policy tweak sends a message to exit from easing finally.”
The BoJ decision could throw cold water on the Japanese economy and needs high attention, the official added.
Market reaction
On the above comments, USD/JPY rallied hard to test 142.50. At the time of writing, the pair is adding 0.85% on the day to trade at 142.35.
Economists at Crédit Agricole analyze GBP outlook ahead of the Bank of England (BoE) policy meeting on Thursday.
Limited upside for the GBP unless the BoE provides a hawkish surprise
UK rate markets are currently forecasting a rate hike of more than 25 bps in the upcoming BoE meeting. This expectation means that many of the potential positives of such a rate increase may already be factored into the GBP's current price.
Given the current market expectations, for the GBP to witness a short-term boost, the MPC would need to deliver a policy decision or statement that is more hawkish than the market anticipates.
The Eurozone economy expanded by 0.3% over the quarter in the three months to June of 2023, compared with a 0.1% contraction seen in the first quarter, the latest data published by Eurostat showed on Monday. The market had expected a 0.2% growth in the reported period.
On a yearly basis, the bloc’s GDP rate grew 0.6% in Q2 vs. 1.0% recorded in Q1 2023 while beating 0.4% expectations.
Market reaction
EUR/USD was last seen trading at 1.1030, up 0.14% on the day, cheering a better-than-expected Eurozone GDP report.
About Eurozone Preliminary GDP
The Gross Domestic Product released by Eurostat is a measure of the total value of all goods and services produced by the Eurozone. The GDP is considered as a broad measure of the Eurozone's economic activity and health. Usually, a rising trend has a positive effect on the EUR, while a falling trend is seen as negative (or bearish).
According to the data published by Eurostat on Monday, the annual Eurozone Harmonised Index of Consumer Prices (HICP) rose 5.3% in July vs. a 5.5% rise seen in June. The HICP inflation gauge met expectations for a 5.3% increase.
The Core HICP inflation steadied at 5.5% YoY in July, compared with June’s 5.5% increase. Markets had predicted a 5.4% clip.
On a monthly basis, the old continent’s HICP dropped 0.1% in July vs. +0.3% reported in June and an unexpected slowdown from the 0.3% raise expected. The core HICP inflation came in at -0.1% in the reported month, as against the 0.4% registered in June.
The European Central Bank’s (ECB) inflation target is 2.0%.
The bloc’s HICP inflation data have a significant impact on the market’s pricing of the ECB interest rate path. Markets are currently pricing a 75% probability of a rate hike pause by the ECB in September.
The European Central Bank’s (ECB) inflation target is 2.0%.
The bloc’s HICP inflation data have a significant impact on the market’s pricing of the ECB interest rate path. Markets are currently pricing a 75% probability of a rate hike pause by the ECB in September.
Key details (via Eurostat)
“Looking at the main components of euro area inflation, food, alcohol & tobacco is expected to have the highest annual rate in July (10.8%, compared with 11.6% in June), followed by services (5.6%, compared with 5.4% in June), non-energy industrial goods (5.0%, compared with 5.5% in June) and energy (-6.1%, compared with -5.6% in June).”
EUR/USD reaction
The shared currency is shrugging off mixed Eurozone inflation data. EUR/USD is picking up bids to trade near intraday highs of 1.1037, up 0.10% on the day, as of writing.
- Gold price seeks US economic data to gauge a decisive move.
- The US Dollar Index remains in the bullish trajectory as the tight labor market supports more rate hikes from the Fed.
- The US manufacturing sector looks to be contracting for the ninth month in a row amid an aggressive rate-tightening cycle.
Gold price (XAU/USD) action is correcting on Monday after sensing resistance above $1,960.00 as the robust performance of the United States in the April-June quarter reinforces the need for more interest-rate hikes from the Federal Reserve (Fed). The precious metal is under pressure as the US Dollar capitalizes on upbeat GDP numbers and a robust Durable Goods Orders report.
United States factory activities have been contracting for the past eight months due to the aggressive rate-tightening cycle by the Federal Reserve (Fed). The manufacturing sector is broadly expected to continue reporting a vulnerable performance as firms struggle to tap credit due to the twin headwinds of higher interest rates and tighter credit conditions among US regional banks.
Daily Digest Market Movers: Gold price shifts focus to US Factory data
- Gold price finds pressure above $,1,960 as investors shift focus to the July Manufacturing PMI reported by the United States Institute of Supply Management (ISM), which will be published on Tuesday at 14:00 GMT.
- As per the expectations, Manufacturing PMI jumps to 46.5 from June’s figure of 46.0. In spite of higher factory activities, the Manufacturing sector is expected to remain in a contraction phase. Investors should note that a figure below 50.0 is considered contractionary and this would be the ninth contraction print in a row.
- Meanwhile, the New Orders Index demonstrates that forward demand is expected to drop to 44.0 vs. the prior release of 45.6.
- US factory activities are consistently facing the wrath of higher interest rates by the Federal Reserve.
- This week, the Gold price is expected to remain highly active as US factory data will be followed by Automatic Data Processing (ADP) Employment Change data, which will release on Wednesday at 11:45 GMT.
- The US Dollar Index struggled to recapture the crucial resistance of 102.00 as Fed’s preferred inflation tool core Personal Consumption Expenditure (PCE) price index softened.
- The US core PCE price index gained at a pace of 0.2% in June as expected by the market but remained slower than the 0.3% figure registered in May. On an annualized basis, the economic data softened to 4.1% vs. the expectations of 4.2% and the former release of 4.6%.
- After Fed policymakers decided to remain dependent on incoming data for further action on interest rates, the essence of economic indicators increased significantly.
- Last week, US Q2 Gross Domestic Product (GDP) data remained robust amid a tight labor market and stellar consumer spending. US GDP for the April-June quarter expanded by 2.4% against expectations of 1.8%.
- In spite of aggressive policy-tightening by the Fed, a stellar performance in the second quarter indicates strength in the labor market and consumer demand.
- Fed policymakers seem confident that the US economy will not enter into recession as demand for labor remains robust.
- Consumer Sentiment improves significantly in July, delivering the highest reading of 71.6 since October 2021 but misses expectations of 72.6.
- Easing inflationary pressures and strong employment conditions have remained major contributors to improving household sentiment.
Technical Analysis: Gold price loses upside momentum
Gold price remains sideways near the 20-day Exponential Moving Average (EMA) around $1.955.00 as investors shift their focus to factory activities and labor market data. On an hourly time frame, Gold price forms a bearish divergence that will be triggered after a breakdown below the crucial support of $1,940.00. An occurrence of the same would push the Gold price into a bearish trajectory.
Fed FAQs
What does the Federal Reserve do, how does it impact the US Dollar?
Monetary policy in the US is shaped by the Federal Reserve (Fed). The Fed has two mandates: to achieve price stability and foster full employment. Its primary tool to achieve these goals is by adjusting interest rates.
When prices are rising too quickly and inflation is above the Fed’s 2% target, it raises interest rates, increasing borrowing costs throughout the economy. This results in a stronger US Dollar (USD) as it makes the US a more attractive place for international investors to park their money.
When inflation falls below 2% or the Unemployment Rate is too high, the Fed may lower interest rates to encourage borrowing, which weighs on the Greenback.
How often does the Fed hold monetary policy meetings?
The Federal Reserve (Fed) holds eight policy meetings a year, where the Federal Open Market Committee (FOMC) assesses economic conditions and makes monetary policy decisions.
The FOMC is attended by twelve Fed officials – the seven members of the Board of Governors, the president of the Federal Reserve Bank of New York, and four of the remaining eleven regional Reserve Bank presidents, who serve one-year terms on a rotating basis.
What is Quantitative Easing (QE) and how does it impact USD?
In extreme situations, the Federal Reserve may resort to a policy named Quantitative Easing (QE). QE is the process by which the Fed substantially increases the flow of credit in a stuck financial system.
It is a non-standard policy measure used during crises or when inflation is extremely low. It was the Fed’s weapon of choice during the Great Financial Crisis in 2008. It involves the Fed printing more Dollars and using them to buy high grade bonds from financial institutions. QE usually weakens the US Dollar.
What is Quantitative Tightening (QT) and how does it impact the US Dollar?
Quantitative tightening (QT) is the reverse process of QE, whereby the Federal Reserve stops buying bonds from financial institutions and does not reinvest the principal from the bonds it holds maturing, to purchase new bonds. It is usually positive for the value of the US Dollar.
FX option expiries for July 31 NY cut at 10:00 Eastern Time, via DTCC, can be found below.
- EUR/USD: EUR amounts
- 1.0900 1.1b
- 1.1000 1.8b
- 1.1025 765m
- 1.1060 764m
- 1.1075 795m
- 1.1085 880m
- 1.1095 787m
- GBP/USD: GBP amounts
- 1.2675 393m
- USD/JPY: USD amounts
- 140.50 351m
- 141.00 597m
- 141.50 353m
- 142.00 345m
- 145.50 1b
- USD/CHF: USD amounts
- 0.8600 658m
- 0.8750 406m
- AUD/USD: AUD amounts
- 0.6680 430m
- USD/CAD: USD amounts
- 1.3260 343m
Economists at ING analyze EUR/USD outlook.
US disinflation is not enough to get the Dollar lower
We are a little disappointed that EUR/USD did not hold gains on Friday's soft US Employment Cost Index reading. That may suggest US disinflation is not enough to get the Dollar lower.
Unless we see some downside surprises to the US activity data this week it looks as though EUR/USD can be dragged back towards the 1.0920 area.
See: EUR/USD needs to hold support at 1.0905/1.0833 to suggest weakness is corrective – Credit Suisse
The Yuan experienced a few choppy weeks in July. Economists at Commerzbank analyze CNY outlook.
Policymakers need to act fast
The Yuan experienced a few choppy weeks in July as the PBoC set the daily fixings stronger than market expectations in most days to counter depreciation pressure. This will likely continue to be the case in the near term.
While the recent stimulus announcements have bought some time for policymakers, they need to act fast before investors disappoint over the absence of tangible policy response.
- GBP/JPY adds to Friday’s strong move up and scales higher for the second straight day.
- The BoJ’s unscheduled bond-buying operation weighs on the JPY and extends support.
- The divergent BoJ-BoE policy stance supports prospects for a further appreciating move.
The GBP/JPY cross gains strong follow-through traction for the second successive day on Monday and jumps to a three-week high during the early part of the European session. Spot prices currently trade around the 182.80-182.85 region, summing up to a rally of over 650 pips from the lowest level since June 13 touched on Friday, and remain well supported by the heavily offered tone surrounding the Japanese Yen (JPY).
In fact, the JPY is among the worst-performing G-10 currency and is pressured by the Bank of Japan's unscheduled operation on Monday to buy ¥300 billion ($2 billion) worth of Japanese government bonds (JGB). This is the first such move since February 2022 and follows the recent sharp rise in the yield of benchmark 10-year JGB to a nine-year high, led by the BoJ's decision to be more flexible in its Yield Curve Control (YCC) policy on Friday. It is worth recalling that the Japanese central bank said that the 0.5% cap for the 10-year Japanese government bond yield (JGB) will now be "references" rather than "rigid limits".
The initial market reaction, however, turned out to be short-lived as investors seem disappointed by the BoJ Governor Kazuo Ueda's dovish remarks, reiterating the need to maintain monetary support. Speaking at the post-meeting press conference, Ueda added that the central bank won't hesitate to ease policy further and that more time was needed to sustainably achieve the 2% inflation target. This, along with the underlying bullish sentiment across the global equity markets, undermines the safe-haven JPY and turns out to be a key factor that continues to provide a strong boost to the GBP/JPY cross.
Investors continue to cheer the latest optimism over more stimulus measures from China, which helps offset data showing that business activity in the world's second-largest economy deteriorated further in July. Apart from this, growing acceptance that the Federal Reserve (Fed) is nearing the end of its fastest interest rate hiking cycle since the 1980s remains supportive of the risk-on environment. Apart from this, bets for more interest rate hike by the Bank of England (BoE) turns out to be another factor behind the British Pound's relative outperformance and continues to push the GBP/JPY cross higher.
In fact, the UK central bank is widely expected to raise its benchmark interest rate by 25 bps on August 3, to 5.25%, or the highest since early 2008. Moreover, the markets have been pricing in two more BoE rate hikes by the end of this year as price pressures persist. This marks a big divergence in comparison to the BoJ's dovish stance and suggests that the path of least resistance for the GBP/JPY cross is to the upside. Moreover, sustained strength and acceptance above mid-182.00s add credence to the positive outlook, supporting prospects for a further near-term appreciating move.
Technical levels to watch
USD/JPY trades at pre-BoJ level after rebounding on Friday from 138.07 low. Economists at Société Générale analyze the pair’s outlook.
Proverbial dam will not burst until the 200-DMA at 136.66 gives way
The abrupt recovery appears overdone based on yield differentials but corroborates with gains in the Nikkei. The positive correlation between USD/JPY and the Nikkei has been a constant this year.
In the longer term, the path towards 1% for 10y JGB yields should compress the spread over Treasuries and Bunds and should translate into lower USD/JPY and EUR/JPY.
Viewing the price action through the lens of technicals, the proverbial dam won’t burst until the 200-DMA at 136.66 gives way.
The danger of a contrarian squeeze higher cannot be underestimated if US payrolls surprise to the upside on Friday and US 10y yields ratchet back over 4%. Three successive declines in US jobless claims reaffirmed the resilience of the labour market and could translate into a positive payrolls surprise and/or a lower unemployment rate. This would send a warning to investors to brace for another choppy month of August for bond markets.
Here is what you need to know on Monday, July 31:
Markets stay relatively quiet to begin the last trading day of July. The US Dollar Index consolidates the previous week's gains above 101.50 and US stock index futures trade flat following the risk rally seen on Friday. Gross Domestic Product and Harmonized Index of Consumer Price (HICP) data from the Euro area will be watched closely as investors try to figure out whether the European Central Bank will pause the tightening cycle in September. Chicago PMI and the Federal Reserve Bank of Dallas' Texas Manufacturing Survey will be featured in the US economic docket later.
EUR/USD staged a rebound and stabilized above 1.1000 on Friday but ended up closing the week in negative territory. The pair holds steady early Monday. HICP in the Euro area is forecast rise 5.3% on a yearly basis in July, down from 5.5% in June. While speaking to French daily Le Figaro over the weekend, ECB President Christine Lagarde said that the Eurozone economy was forecast to expand 0.9% in 2023. On a quarterly basis, the Eurozone GDP is expected to expand 0.2% in Q2 following the 0.1% contraction recorded in Q1.
GBP/USD fluctuates in a tight channel above 1.2850 early Monday. Consumer Credit change data for June will be released from the UK in the European session. Later in the week, the Bank of England will announce monetary policy decisions.
Following Friday's volatile action that was fuelled by the Bank of Japan's unexpected decision to introduce flexibility into the yield curve control (YCC) strategy, USD/JPY gathered bullish momentum early Monday. At the time of press, the pair was trading at its highest level in three weeks above 142.00.
Gold gathered bullish momentum and registered strong daily gains on Friday. XAU/USD, however, finds it difficult to preserve its momentum early Friday and trades in the red slightly above $1,950 as the benchmark 10-year US Treasury bond yield edges higher toward 4%.
Bitcoin continues to move up and down in a very narrow range at around $29,500 on Monday and Ethereum stays flat slightly below $1,900.
USD/CAD headed for its fifth weekly close above 1.32, but well below 1.33. Economists at Scotiabank analyze the pair’s outlook.
Focus on spreads
While spot trends are static, the strengthening spread correlation does suggest that the economic data and their impact on the outlook for monetary policy in the US and Canada should be the primary driver for spot (rather than risk appetite or commodities) in the near term.
Month-end may see some net USD selling (versus the CAD and other major currencies) from passive hedge rebalancing Monday, although these sorts of flows have tended to slide into the market in the days leading up to month-end in recent years (rather than right around the turn of the month).
In the view of UOB Group’s Economist Lee Sue Ann and Markets Strategist Quek Ser Leang, there is still the possibility for AUD/USD to slip back to the 0.6595 level in the short-term horizon.
Key Quotes
24-hour view: Last Friday, we expected AUD to test the major support at 0.6680, and we held the view that “a sustained decline below this level appears unlikely today.” While our view of a weaker AUD was not wrong, we did not anticipate the sharp selloff that sent it plunging to a low of 0.6623. AUD rebounded strongly from the low, but while downward momentum has eased, it is too early to expect a sustained recovery. Today, AUD is more likely to consolidate and trade between 0.6630 and 0.6700.
Next 1-3 weeks: After AUD fell sharply to 0.6699, we highlighted last Friday (28 Jul, spot at 0.6710) that “While downward momentum is building again, AUD has to break and stay below the major support at 0.6680 before further weakness is likely.” We indicated, “The next level to watch below 0.6680 is 0.6640.” In other words, we did not expect the price actions where AUD plunged below both 0.6680 and 0.6640. The decline was however, short-lived, as AUD rebounded strongly from a low of 0.6623. Short-term conditions are severely oversold, and this could lead to a few days of consolidation. As long as 0.6750 (‘strong resistance’ level was at 0.6785 last Friday) is not breached, there is a chance, albeit not a high one, for AUD to drop to June’s low of 0.6595.
Nobody knows at what yield levels the BoJ does what. Ulrich Leuchtmann, Head of FX and Commodity Research at Commerzbank, expects the Yen to remain under pressure.
JPY will be trading weaker than in a scenario in which the BoJ would act in a reliable manner
Did the BoJ intervene because the new de facto pain threshold is 0.6%? Or was the rise in yields too rapid for the BoJ?
We can only hope that with time we will learn from experience how the BoJ operates. In that case, we could ‘only’ reproach the BoJ for those interventions and the market volatility that would have been unnecessary had the BoJ communicated its policy clearly. However, I fear that by that point the BoJ officials will have new ideas and the whole game will start all over again.
Amidst this chaos, the Yen will sometimes trade weaker and sometimes stronger. Of course, it is completely impossible to predict the timing of these moves, but it can be said that overall, the JPY will be trading weaker than in a scenario in which the BoJ would act in a reliable manner. A central bank that is afraid of deflation (despite core inflation rates of 4.2%) might like that. But long-term a weaker Yen means that Japan is getting poorer.
- Silver comes under fresh selling pressure and reverses a part of Friday’s modest recovery gains.
- The technical setup favours bearish traders and supports prospects for further near-term losses.
- A sustained strength above the $25.00-$25.25 region is needed to negate the negative outlook.
Silver meets with a fresh supply on the first day of a new week and erodes a part of Friday's modest recovery gains from the vicinity of the $24.00 mark, or over a two-week low. The white metal maintains its offered tone through the early European session and currently trades around the $24.25 region, down nearly 0.50% for the day.
From a technical perspective, last week's failure ahead of the $25.00 psychological mark and the subsequent slump below the $24.30-$24.25 resistance-turned-support was seen as a fresh trigger for bearish traders. This, along with the emergence of fresh selling on Monday and negative oscillators on hourly charts suggest that the path of least resistance for the XAG/USD is to the downside.
That said, technical indicators on the daily chart - though have been losing traction - are yet to confirm the negative outlook. This makes it prudent to wait for a sustained break below the $24.00 mark before positioning for deeper losses. The XAG/USD might then turn vulnerable and accelerate the downfall towards testing the next relevant support near the $23.20-$23.15 area en route to the $23.00 mark.
The latter coincides with the very important 200-day Simple Moving Average (SMA), which if broken decisively should pave the way for a fall towards challenging the multi-month low, around the $22.15-$22.10 area touched in June.
On the flip side, the $24.30-$24.35 region might continue to act as an immediate hurdle ahead of the $24.60-$24.65 area. Some follow-through buying could lift the XAG/USD back to the $25.00 mark. This is followed by the monthly peak, around the $25.25 zone, which if cleared will negate the negative outlook. Silver might then surpass the $25.50-$25.55 hurdle and aim to reclaim the $26.00 mark.
Silver daily chart
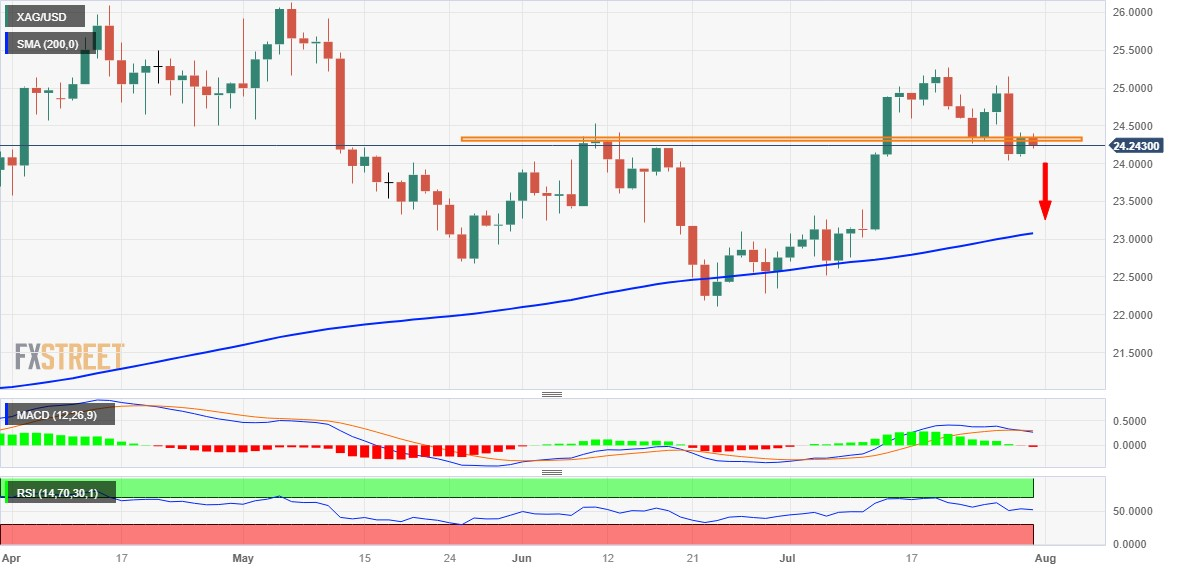
Key levels to watch
- Pound Sterling remains topsy-turvy ahead of BoE’s interest rate decision this week.
- Recession fears in the United Kingdom economy deepen due to aggressive policy-tightening by the BoE.
- The BOE is expected to raise interest rates consecutively for the fourteenth time.
The Pound Sterling (GBP) demonstrates a directionless performance as investors eye the monetary policy of the Bank of England (BoE). The GBP/USD pair struggles to gauge direction as investors worry about deepening recession fears due to aggressive policy-tightening by the United Kingdom's central bank. To tame stubborn inflation, the BoE is expected to raise interest rates for the fourteenth time in a row.
The Bank of England has already raised interest rates to 5%, and a fresh interest rate hike of 25 basis points (bps) is expected to build more pressure on inflation. Labor shortages and higher food prices have remained major contributors to sticky UK inflation. BoE policymakers are also expected to consider a 50 bps interest rate hike as inflationary pressures in the UK economy are the highest compared to other G7 economies.
Daily Digest Market Movers: Pound Sterling seeks BoE policy
- Pound Sterling remains rangebound below 1.2900 as investors await interest rate policy by the Bank of England for further guidance.
- BoE policymakers are expected to discuss further policy tightening as they are committed to bringing inflation to 2%.
- Inflationary pressures in the United Kingdom’s economy are well diverged from the desired rate of 2%, therefore more interest rate hikes cannot be ruled out.
- UK headline and core Consumer Price Index (CPI) data are at 7.9% and 6.8% respectively and will take sufficient time in easing to the desired rate.
- Headline inflation has softened to 7.9% from its peak of 11.1% but a recent recovery in global oil prices has elevated fears of a rebound in inflationary pressures.
- Core inflation is still near a 31-year high of 7.1% due to higher cost of services and tight labor market conditions.
- Recently, the BoE and UK authorities discussed with industry regulators to avoid overcharging customers so that the burden from households could ease and inflationary pressures could be anchored.
- UK delegates decided to widen their inflation-controlling toolkit to better deal with inflationary pressures.
- The BoE is expected to raise interest rates further by 25 bps to 5.25% despite fears of a recession enlarging.
- A poll conducted by Reuters showed that interest rates in the UK economy will peak around 5.75%.
- Last week, UK Treasury advisers remained concerned about deepening recession fears due to aggressive policy-tightening by the BoE.
- The market mood turns cautious as China’s official Manufacturing PMI contracts for the fourth month in a row amid bleak demand. The economic data landed 10 bps higher than expectations of 49.2. A figure below 50.0 is considered a contraction.
- The US Dollar Index (DXY) approaches 102.00 as the United States' upbeat performance in the April-June quarter has triggered hopes of more interest-rate hikes from the Federal Reserve (Fed).
- US Gross Domestic Product (GDP) in Q2 rose by 2.4% amid a tight labor market and higher momentum in consumer spending.
- On Friday, the US Labor Cost index for Q2 dropped to 1.0% vs. expectations of 1.1% and Q1 publication of 1.2%. This might ease retail demand and eventually the price pressures.
- Meanwhile, investors are preparing for the US ISM Manufacturing PMI data, which will be released on Tuesday at 14:00 GMT. The economic data is expected to continue its contracting spell.
Technical Analysis: Pound Sterling remains sideways below 1.2900
Pound Sterling remains back-and-forth below the round-level resistance of 1.2900 as investors shift their focus toward the interest rate decision by the Bank of England. The Cable aims for a firm footing after correcting to near the 20-day Exponential Moving Average around 1.2860. The major trades in a Rising Channel chart pattern and it can discover support after testing the lower portion of the trade pattern.
Pound Sterling FAQs
What is the Pound Sterling?
The Pound Sterling (GBP) is the oldest currency in the world (886 AD) and the official currency of the United Kingdom. It is the fourth most traded unit for foreign exchange (FX) in the world, accounting for 12% of all transactions, averaging $630 billion a day, according to 2022 data.
Its key trading pairs are GBP/USD, aka ‘Cable’, which accounts for 11% of FX, GBP/JPY, or the ‘Dragon’ as it is known by traders (3%), and EUR/GBP (2%). The Pound Sterling is issued by the Bank of England (BoE).
How do the decisions of the Bank of England impact on the Pound Sterling?
The single most important factor influencing the value of the Pound Sterling is monetary policy decided by the Bank of England. The BoE bases its decisions on whether it has achieved its primary goal of “price stability” – a steady inflation rate of around 2%. Its primary tool for achieving this is the adjustment of interest rates.
When inflation is too high, the BoE will try to rein it in by raising interest rates, making it more expensive for people and businesses to access credit. This is generally positive for GBP, as higher interest rates make the UK a more attractive place for global investors to park their money.
When inflation falls too low it is a sign economic growth is slowing. In this scenario, the BoE will consider lowering interest rates to cheapen credit so businesses will borrow more to invest in growth-generating projects.
How does economic data influence the value of the Pound?
Data releases gauge the health of the economy and can impact the value of the Pound Sterling. Indicators such as GDP, Manufacturing and Services PMIs, and employment can all influence the direction of the GBP.
A strong economy is good for Sterling. Not only does it attract more foreign investment but it may encourage the BoE to put up interest rates, which will directly strengthen GBP. Otherwise, if economic data is weak, the Pound Sterling is likely to fall.
How does the Trade Balance impact the Pound?
Another significant data release for the Pound Sterling is the Trade Balance. This indicator measures the difference between what a country earns from its exports and what it spends on imports over a given period.
If a country produces highly sought-after exports, its currency will benefit purely from the extra demand created from foreign buyers seeking to purchase these goods. Therefore, a positive net Trade Balance strengthens a currency and vice versa for a negative balance.
- EUR/GBP oscillates in a tight range around 0.8565, down 0.12% on the day.
- Germany's Retail Sales MoM decreased by 0.8% against the market consensus of -0.2% and 0.2% prior.
- Most economists surveyed by Reuters expect the BoE to hike rates to 5.25% from 5%, peaking at 5.75%.
- Market players will closely watch the BoE interest rate decision on Thursday.
The EUR/GBP pair consolidates in a narrow range between 0.8560-0.8580 heading into the early European session on Monday. Market participants await the inflation data from the Eurozone for a fresh cue ahead of the key event from the Bank of England (BoE) on Thursday.
On Monday, the latest data from Destatis showed that Germany's Retail Sales MoM decreased 0.8% against the market consensus of -0.2% and 0.2% prior. The bloc's Retail Sales fell 1.6% annually in June, compared to the expected 6.3% decline and May's -3.6% decline.
Last week, the European Central Bank raised interest rates by 25 basis points (bps) to 4.25%. ECB President Christine Lagarde stated that the central bank will move towards achieving a medium-term inflation target of 2%. According to Reuters on Sunday, Lagarde also said that the latest economic output figures from France, Germany, and Spain are quite encouraging.
BoE Governor Andrew Bailey said that it was crucial that we see the job through to reduce inflation. At the same time, Deputy Governor Dave Ramsden stated that inflation remained too high despite recent drops. However, most economists surveyed by Reuters last week expect rates to rise to 5.25% from 5%, peaking at 5.75%.
It’s worth noting that the Bank of England (BoE) unexpectedly raised its Bank Rate by 50 basis points (bps) to 5.00%. The additional rate hike from the BoE exacerbates concerns about the Bank's most aggressive rate hikes in three decades and their impact on the UK’s economy, which exert pressure on the Pound Sterling. The UK economy is under tremendous pressure as the property industry starts to falter as borrowing prices rise. The increasing cost constraints also impact retail orders and manufacturing activities.
The data released last week showed that economic activity in the United Kingdom was weaker than estimated. The Manufacturing PMI for July fell to 45.0 from 46.5 observed in June, worse than expected at 46.1. This figure registered the 12th straight contraction in the manufacturing sector. Meanwhile, the preliminary Services PMI declined to 51.5 from 53.0 prior and 53.7 expected.
Looking ahead, market players will closely watch the BoE interest rate decision on Thursday. Also, BOE Governor Andrew Bailey's speech could offer hints about further monetary policy and give a direction for the GBP/USD pair. Across the pond, the US Nonfarm Payroll remains in focus. The economy is expected to have created 180,000 jobs, and the unemployment rate is expected to remain at 3.6%.
- USD/CAD takes offers to refresh intraday low during the first daily fall in five.
- Oil price snaps two-day uptrend with mild losses near multi-day high.
- US Dollar bulls struggle to keep the reins amid pre-NFP anxiety, mixed Fed talks and data.
- Month-end consolidation joins dicey markets to prod Loonie pair buyers ahead of US NFP, Canada employment data.
USD/CAD refreshes intraday low as it drops to 1.3230 heading into Monday’s European session. The Loonie pair’s latest weakness could be linked to the recovery in prices of Canada’s biggest export earner, namely WTI crude oil, as well as the US Dollar’s positioning for this week’s top-tier. Also, the market’s month-end consolidation and the Canadian Dollar’s (CAD), known as the Loonie, preparations ahead of Friday’s top-tier Canada employment report for July, add strength to the downside bias.
That said, WTI crude oil recovers from the intraday low of $79.95 to $80.25 by the press time as it prints the first daily loss in three. In doing so, the black gold cheers the hopes of more energy demand due to China's stimulus, one of the world’s biggest Oil consumers. Also fueling the black gold’s price could be the hopes of Saudi Arabia’s extension of production cuts.
Elsewhere, Canadian GDP for June improved to 0.3% MoM on Friday, versus revised down figures of 0.1% prior, which in turn contrasts with downbeat US Core Personal Consumption Expenditure (PCE) Price Index for June to keep the USD/CAD bears hopeful. It’s worth noting that Federal Reserve Bank of Minneapolis President Neel Kashkari flagged fears of job losses and slower growth during the weekend interview, which in turn prod the Fed hawks and weigh on the Loonie pair prices.
It should be noted that upbeat prints of China’s official Manufacturing PMI for July and announcements of stimulus to conserve and boost consumer demand joined receding hawkish bets about the major central banks to let the markets be optimistic and weigh US Dollar.
Against this backdrop, US Dollar Index (DXY) licks its wounds near the three-week high of around 101.70-80 while S&P500 Futures stay lackluster at 4,605 after refreshing the yearly high the last week. That said, US Treasury bond yields edge higher by the press time.
Looking ahead, USD/CAD pair may witness further downside as traders prepare for the monthly employment data from the US and Canada. Also important are the US ISM Manufacturing and Services PMIs for July.
Technical analysis
Failure to stabilize beyond a two-month-old resistance line, around 1.3245 by the press time, directs USD/CAD bears toward the 21-DMA support of around 1.3220.
Gold price made a U-turn in the second half of the week and dropped toward $1,950. Economists at TD Securities analyze the yellow metal’s outlook.
The risk of higher-than-expected rates is real
The concern that the US central bank may well be forced to continue on its tightening cycle, as shown by the dots, convinced investors to reduce long exposure and to acquire new shorts as it become apparent that a July hike was a done deal. At the same time, outsized Oil price increases raised concerns that the rate of CPI deterioration may no longer be in the cards for the rest of this year.
Higher energy and grain prices following Russia's blockage of shipping routes, at a time when the economy keeps surprising to the upside, implies that the risk of higher-than-expected rates is real. That frame of mind, along with messaging from Mr. Powell that monetary policy will be data dependent, has driven Gold down to technical support near $1,950 recently.
Since data continues to be firm and other central banks continue to tighten, Gold will continue to be under pressure, with only a material weakening of economic conditions being a catalyst for a material move higher.
- The index advances marginally around 101.70.
- US yields kick off the week with small gains so far.
- Investors’ attention will be on the US labour market this week.
The USD Index (DXY), which gauges the greenback vs. a bundle of its main rival currencies, looks to extend the ongoing rally near the 101.70 region on Monday.
USD Index looks at data, risk trends
The index continues to maintain a positive and optimistic trend, carrying forward the recovery that has been observed in the latter part of the month so far, after an inconclusive session on Friday.
At the same time, the dollar remains in a positive stance, amidst fluctuating risk appetite trends at the beginning of the week, while US yields are attempting a slight rebound as the European markets open on Monday.
Looking ahead, all eyes will be on the US labour market as the week progresses. The release of the ADP report on Wednesday, the usual weekly Initial Claims on Thursday, and the crucial Nonfarm Payrolls on Friday will be closely monitored.
Additionally, the ISM gauges for the manufacturing and services sectors will also be under the spotlight, given the data-dependence context highlighted by the Federal Reserve in its last meeting on July 26.
What to look for around USD
The index keeps the recovery well in place and maintains its target at the key 102.00 hurdle.
In the meantime, the dollar appears benefited from the post-ECB weakness in the risk-associated space, while it could face extra headwinds in response to the data-dependent stance from the Fed against the current backdrop of persistent disinflation and cooling of the labour market.
Furthermore, speculation that the July hike might have been the last of the current hiking cycle is also expected to keep the buck under some pressure for the time being.
Key events in the US this week: Final Manufacturing PMI, ISM Manufacturing, Construction Spending (Tuesday) – MBA Mortgage Applications, ADP Employment Change (Wednesday) – Initial Jobless Claims, Final Services PMI, ISM Services PMI, Factory Orders (Thursday) – Nonfarm Payrolls, Unemployment Rate (Friday).
Eminent issues on the back boiler: Persistent debate over a soft or hard landing for the US economy. Terminal Interest rate near the peak vs. speculation of rate cuts in late 2023 or early 2024. Geopolitical effervescence vs. Russia and China. US-China trade conflict.
USD Index relevant levels
Now, the index is gaining 0.10% at 101.79 and the breakout of 102.56 (55-day SMA) would open the door to 103.54 (weekly high June 30 and finally 103.73 (200-day SMA). On the other hand, immediate contention emerges at 100.00 (psychological level) prior to 99.57 (2023 low July 13) and then 97.68 (weekly low March 30).
CME Group’s flash data for crude oil futures markets noted traders reduced their open interest positions by just 685 contracts on Friday, reaching the third daily drop in a row. In the same line, volume resumed the decline and went down by almost 155K contracts.
WTI: Next target now comes at the 2023 high
Prices of the barrel of WTI finally closed above the $80.00 mark on Friday. The move, however, was on the back of dwindling open interest and volume and suggests that corrective move could emerge in the very near term. The resumption of the upside, in the meantime, now targets the YTD high of $83.49 per barrel (April 12).
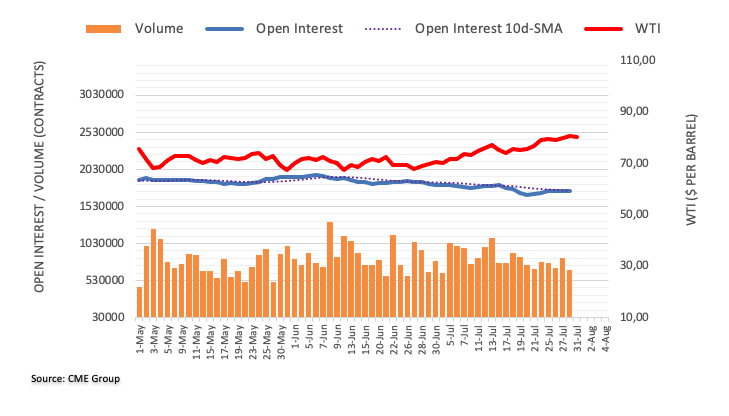
USD/CNH is down to 7.16 after hitting close to 7.30 in early July and EUR/CNH has dropped to 7.88 down from the latest peak at 8.10. Allan von Mehren, Chief Analyst at Danske Bank, analyzes CNH's outlook.
EUR/CNH projected to move lower to around 7.60-7.70 in 12M
I still look for USD/CNH to move gradually higher on the back of more monetary policy easing in China while the Fed keeps a tightening bias for now.
However, EUR/CNH is projected to move lower to around 7.60-7.70 in 12M supported by our forecast of a further decline in EUR/USD.
- NZD/USD takes the bids to refresh intraday high, prints the first daily gain in four.
- Kiwi pair’s recovery from two-month-old support line needs validation from 200-EMA and NZ/US data.
- Downbeat oscillators, two-week-old falling resistance line acts as additional upside filters.
NZD/USD snaps a three-day downtrend as it extends late Friday’s rebound from a two-month-old ascending support line towards 0.6200 heading into Monday’s European session. In doing so, the Kiwi pair cheers upbeat sentiment data at home, as well as China stimulus, while teasing the bulls as markets await July’s employment data for New Zealand (NZ) and the US.
However, the bearish MACD signals join the near 50.0 levels of the RSI (14) line and the 200-Exponential Moving Average (EMA) surrounding 0.6220 to challenge the NZD/USD bulls.
Even if the quote crosses the 0.6220 hurdle, a downward-sloping resistance line from July 14, close to 0.6240 at the latest, can act as the final defense of the NZD/USD buyers, a break of which could quickly propel the quote past the 0.6300 round figure. The same highlights an upward-sloping resistance line from early February, near 0.6380 by the press time.
On the flip side, a daily closing below the three-month-old rising support line, surrounding 0.6130 at the latest, could drag the price toward the lows marked in June and March, near 0.6050 and 0.6085.
Should the NZD/USD remains bearish past 0.6050, multiple levels around 0.6030 and the 0.6000 round figure will be crucial for the bears to watch.
Overall, the Kiwi pair buyers flex their muscles but the bears are still in the driver’s seat.
NZD/USD: Daily chart
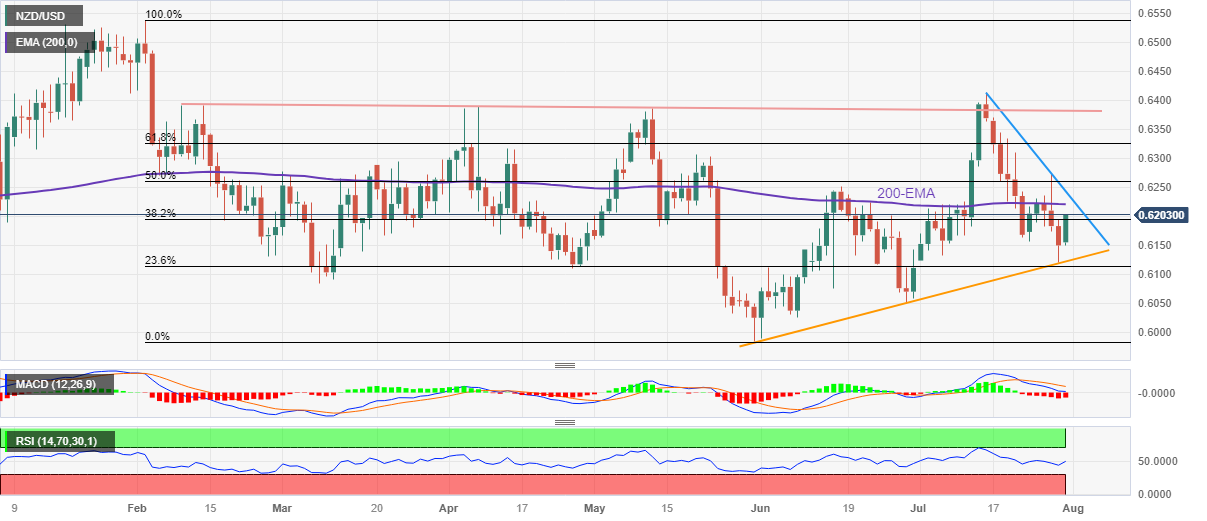
Trend: Limited recovery expected
- AUD/USD recovers some ground and currently trades around 0.6680, gaining 0.48% for the day.
- The US Core PCE Price Index came in at 4.1% annually, down from 4.6% in May and 4.2% prior.
- Australia's Retail Sales fell 0.8% MoM, against the market expectation of 0.0% and 0.7 prior.
- Investors will closely watch the RBA Interest Rate Decision and US Nonfarm Payrolls later this week.
The AUD/USD pair recovers its recent losses and snaps a three-day losing streak heading into the early European session. The Aussie trades under pressure following the US Gross Domestic Product (GDP) and Personal Consumption Expenditure (PCE) last week but gains momentum from the optimistic stimulus plan in China. Market players await the Reserve Bank of Australia's (RBA) Interest Rate Decision on Tuesday for fresh impetus. The pair currently trades around 0.6681, up to 0.48% for the day.
The Personal Consumption Expenditures (PCE) Price Index for June fell to 3% from 3.8% in May, below the market's expectation of 3.1%. Meanwhile, the Federal Reserve's preferred measure of inflation, the Core PCE Price Index, came in at 4.1% annually, down from 4.6% in May and worse than expected at 4.2%.
Furthermore, the optimistic US GDP growth in the second quarter, robust Durable Goods, and persistently constrained labor market conditions suggest that the Federal Reserve (Fed) could decide to raise additional interest rates. The US real Gross Domestic Product (GDP) expanded at a 2.4% annualized rate, above the market consensus of 1.8% by a wide margin and following the 2% growth reported in the first quarter. Durable Goods Orders rose 4.7% on a monthly basis to $302.5 billion. Initial Jobless Claims declined by 7,000 to 221,000 in the week ending July 22, marking the lowest reading in five months. The upbeat US data broadly boost the US dollar, acting as a headwind for the AUD/USD pair.
On the Australian Dollar front, the nation’s Retail Sales experienced their largest decline this year in June. Australia's Retail Sales fell 0.8% MoM, against the market expectation of 0.0% and 0.7 prior. Additionally, the Producer Price Index (PPI) data for the second quarter were disappointing at 3.9% YoY and 0.5% QoQ. This softer report indicated that rising borrowing costs and high prices have an impact on the Australian economy and that an additional hike in interest rates may not be appropriate.
About China, the State Council Information Office of China announced that Li Chunlin, vice chairman of the National Development and Reform Commission, along with officials from the Ministry of Industry and Information Technology, the Ministry of Commerce, and the State Administration of Market Regulation, will hold a press conference at 7:00 a.m. GMT to announce additional measures to boost consumption. The development of additional Chinese support to stimulate domestic consumption amid a sluggish post-COVID recovery could benefit the China-proxy Australian Dollar (AUD).
Moving on, investors will closely watch the RBA Interest Rate Decision on Tuesday. The attention will shift to the US Employment data later this week. The US Nonfarm Payrolls are expected to have created 180,000 jobs, with the unemployment rate remaining 3.6%. These events could significantly impact the US Dollar's dynamic and give the AUD/USD pair a clear direction.
Extra decline in GBP/USD faces tough contention around 1.2720, according to UOB Group’s Economist Lee Sue Ann and Markets Strategist Quek Ser Leang.
Key Quotes
24-hour view: We highlighted last Friday that “further GBP weakness is not ruled out.” We added, “The major support at 1.2720 is likely out of reach.” GBP weakened less than expected, as it rebounded strongly from 1.2767 (high was 1.2888 in NY trade). Despite the strong rebound, there is no clear increase in momentum, and GBP is unlikely to rise much further. Today, GBP is more likely to trade sideways between 1.2810 and 1.2910.
Next 1-3 weeks: There is not much to add to our update from last Friday (28 Jul, spot at 1.2800). As highlighted, “downward momentum is building again, it remains to be seen if GBP can break the major support at 1.2720.” All in all, we expect GBP to trade with a downward bias as long as it stays below 1.2930 (no change in ‘strong resistance’ level from last Friday).
According to the latest official data released by Destatis on Monday, Germany's Retail Sales dropped 0.8% MoM in June versus -0.2% expected and 0.4% previous.
On an annual basis, the bloc’s Retail Sales declined 1.6% in June versus the expected 6.3% slump and May’s -3.6% print.
FX implications
The Euro is unmoved by the mixed German data. At the time of writing, the EUR/USD is almost unchanged on the day at 1.1010.
About German Retail Sales
The Retail Sales released by the Statistisches Bundesamt Deutschland is a measure of changes in sales of the German retail sector. It shows the performance of the retail sector in the short term. Percent changes reflect the rate of changes of such sales. The changes are widely followed as an indicator of consumer spending. Positive economic growth is usually anticipated as "bullish" for the EUR, while a low reading is seen as negative, or bearish, for the EUR.
Open interest in gold futures markets dropped for the fourth consecutive session on Friday, this time by nearly 11K contracts according to preliminary readings from CME Group. Volume followed suit and shrank markedly by around 207.1K contracts, reversing two consecutive daily pullbacks.
Gold: Next support comes around $1940
Friday’s decent advance in gold prices was on the back of shrinking open interest and volume, opening the door to a corrective move in the very near term. In the meantime, the yellow metal is expected to meet initial contention around the $1940 region per troy ounce.
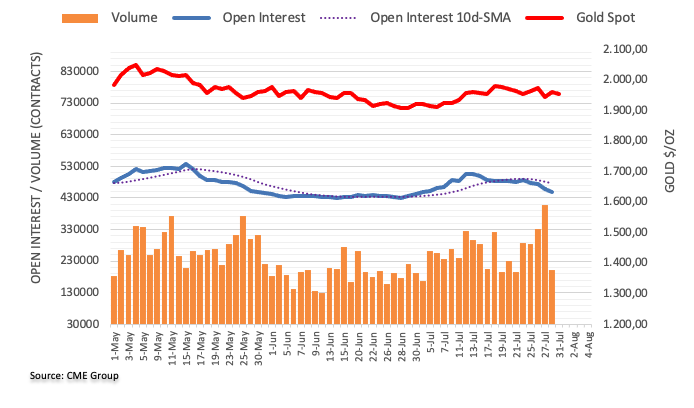
The downside momentum in EUR/USD seems to be running out of steam, note UOB Group’s Economist Lee Sue Ann and Markets Strategist Quek Ser Leang.
Key Quotes
24-hour view: We indicated last Friday that EUR “could drop below the major support at 1.0965.” However, we were of the view that “it might not be able to maintain a foothold below this level.” We also indicated that “The next support at 1.0920 is unlikely to come into view.” While our view was not wrong, as EUR dropped to a low of 1.0942, we did not quite expect the sharp rebound from the low (high was 1.1047 in NY trade). Downward pressure has eased, and EUR appears to have moved into a consolidation phase. Today, we expect EUR to trade between 1.0980 and 1.1055.
Next 1-3 weeks: We highlighted last Friday (28 Jul, spot at 1.0985) that EUR must break and stay below the major support at 1.0965 before further weakness is likely. While EUR then broke below 1.0965, it rebounded strongly from 1.0942 and ended the day higher by 0.38% (NY close of 1.1015). Downward momentum has eased somewhat, but only a breach of 1.1070 (no change in ‘strong resistance’ level from last Friday) would indicate that EUR is not weakening further. Looking ahead, the next support is at 1.0920. Meanwhile, overbought short-term conditions could lead to a couple of days of consolidation.
- Gold Price fades recovery from 13-day low as markets prepare for US NFP with mixed feelings.
- China stimulus, weekend central bank talks fail to inspire XAU/USD bulls amid US Dollar’s rebound.
- Firmer yields, hawkish hopes from Fed keep Gold bears hopeful.
- US ISM PMIs for July, second-tier employment/inflation clues will also prod Gold traders.
Gold Price (XAU/USD) remains on the sideline, mildly offered, as market players brace for this week’s top-tier US employment and activity data. That said, the yellow metal printed the first weekly loss in four the last but failed to impress the XAU/USD nears as it recovered on Friday amid softer US inflation clues.
That said, the upbeat prints of the US growth numbers joined the Fed’s readiness for further rate hikes to weigh on the Gold Price in the last week. However, softer prints of the Fed’s preferred inflation gauge, namely the US Core Personal Consumption Expenditure (PCE) Price Index for June, put a floor under the XAU/USD price.
Recently, the mixed sentiment, despite China’s stimulus and Japan’s bond buying, allowed the US Dollar bulls to return to the desk. The same weighs on the Gold Price as the market players brace for this week’s top-tier US employment and PMI data.
Also read: Gold Price Forecast: XAU/USD ranges betweek two key DMAs ahead of top-tier Eurozone data
Gold Price: Key levels to watch
Our Technical Confluence indicator suggests the Gold Price inaction between the $1,950 and $1,970 trading range as market players brace for the top-tier data/events scheduled for release this week.
On the downside, the middle band of the Bollinger joins Pivot Point one-day S1 and Fibonacci 61.8% on one-month, around $1,950, puts a floor under the Gold Price.
Following that, the $1,930 may act as the last defense of the Gold bears before directing them to the $1,900 round figure.
Alternatively, Pivot Point one-day R1, Fibonacci 61.8% on one-week and 100-DMA caps the XAU/USD run-up around $1,970.
It’s worth noting that Pivot Point one-month R1 and one-week R1, respectively near $1,972 and $1,980, may act as additional upside filters for the Gold buyers to cross before challenging the $2,000 psychological magnet.
Here is how it looks on the tool
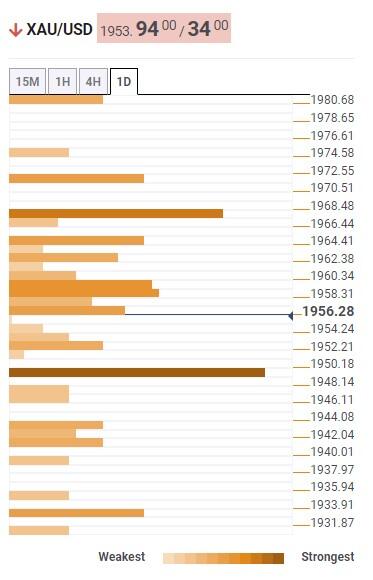
About Technical Confluences Detector
The TCD (Technical Confluences Detector) is a tool to locate and point out those price levels where there is a congestion of indicators, moving averages, Fibonacci levels, Pivot Points, etc. If you are a short-term trader, you will find entry points for counter-trend strategies and hunt a few points at a time. If you are a medium-to-long-term trader, this tool will allow you to know in advance the price levels where a medium-to-long-term trend may stop and rest, where to unwind positions, or where to increase your position size.
In a full version of its quarterly outlook report, the Bank of Japan (BoJ) said that “Japan's core consumer inflation is likely to gradually slow toward year-end.”
Additional takeaways
Inflation likely to accelerate thereafter, though uncertainty on outlook.
Uncertainty on overseas economic outlook very high with risks skewed to downside.
Must be vigilant to fact price hikes have spread rapidly among firms, sectors that had been cautious of raising prices in the past.
Must keep eye out on whether price hikes to pass on costs persist, broaden further.
More firms becoming open to raising wages, must scrutinise whether and how this will affect price developments.
Related reads
- USD/JPY Price Analysis: Pokes 141.80-142.00 resistance zone on BoJ’s first special bond buying since February
- Fed’s Kashkari flags fears of witnessing uptick in unemployment, praises inflation outlook
- Oil prices aim to deliver the biggest monthly close of the year as interest rates from global central banks will peak sooner.
- Overall demand for oil will remain upbeat in the US economy as fears of a recession fade.
- WTI prices delivered a breakout of the Descending Triangle chart pattern.
West Texas Intermediate (WTI), futures on NYMEX, corrects modestly after printing a fresh three-month high around $80.65. The oil price struggled to extend upside but a bullish bias has not faded yet as investors believe that interest rates by global central banks are near peak.
The Federal Reserve (Fed) shifts to incoming data for further policy action after raising interest rates on July 26. Also, fears of recession fade now, indicating that overall oil demand in the United States will remain upbeat.
For further guidance, investors await the Caixin Manufacturing PMI data for July, which will be published on Tuesday. As per the consensus, the economic data is seen declining marginally to 50.3 vs. the former release of 50.5.
WTI prices delivered a breakout of the Descending Triangle chart pattern formed on a daily scale. A breakout of the aforementioned chart pattern results in wider ticks and heavy volume. Upward-sloping 20-period Exponential Moving Average (EMA) at $76.00 indicates that the short-term trend is bullish.
The Relative Strength Index (RSI) (14) has shifted into the bullish range of 60.00-80.00, which indicates that the upside momentum is active.
For further upside, the oil price needs to break above the previous week’s high of $80.53 decisively, which will drive the asset toward January 3 high at $81.56 followed by April 12 high at $83.40.
In an alternate scenario, an explosive downside move below July 17 low at $73.80 would drag the asset toward June 21 high at $72.70 and the round-level support of $70.00.
WTI daily chart
-638263772196681123.png)
- Asian stock markets start the new week on a positive note.
- The signal of additional Chinese support bolstered risk improvement in the markets.
- Investors still assess the Bank of Japan's (BoJ) policy to lift the cap on bond yields and its ultra-easy monetary policies.
Asian stock markets trade in positive territory on Monday. Markets turn to a risk-on mood in the busy week of economic data releases, central bank meetings, and an optimistic view of the additional stimulus plan from China. At press time, the Nikkei rises 1.11%, Shanghai gains 0.63%, Hang Sang rises 1.47%, the Kospi Index is up 0.67%, and the Nifty50 rises 0.01%.
In China, the signal of additional Chinese support to stimulate domestic consumption amid a sluggish post-COVID recovery triggers risk improvement broadly. The State Council Information Office of China announced that Li Chunlin, vice chairman of the National Development and Reform Commission, along with officials from the Ministry of Industry and Information Technology, the Ministry of Commerce, and the State Administration of Market Regulation, will hold a press conference at 7:00 a.m. GMT to announce additional measures to boost consumption.
About the data, the National Bureau of Statistics (NBS) reported on Monday that the Manufacturing Purchasing Managers' Index (PMI) increased to 49.3 in July, improving from 49.0 in June and the market's estimate of 49.2. However, the figure was marked below 50 for the fourth straight month, indicating the contraction zone. Meanwhile, the NBS Services PMI fell from 53.2 in June to 51.5 in July.
In Japan, investors still assess the Bank of Japan's (BoJ) monetary policy decision to lift the cap on bond yields and the possible adjustment to its ultra-easy monetary policies.
On Friday, the BoJ maintained its ultra-low interest rates and kept its short-term interest rates at -0.1% while keeping its 10-year JGB yield target around 0%. Also, the central bank is allowed to make its yield curve control policy more flexible by moving 0.5% around the 0% target.
Japanese Chief Cabinet Hirokazu Matsuno stated that the BoJ's decision will make YCC more flexible and improve the sustainability of easy monetary policy. BoJ Governor Kazuo Ueda also reiterated that he would likely maintain ultra-loose policy to sustainably achieve the 2% inflation target. BoJ officials added that central banks prefer to examine more data before adjusting monetary policy.
Looking forward, market participants will keep an eye on the developments regarding the Chinese additional stimulus plan, a decision to implement Japan's highest minimum wage increase in history, and the update about the BoJ’s monetary policy. Later this week, investors will turn their attention to Nonfarm Payrolls data. This data might influence the USD dynamic and hint at a sooner end to the rate hike cycle. This, in turn, underpins riskier assets like Gold, equities, the AUDUSD, etc.
- EUR/JPY stays firmer for the second consecutive day, grinds near intraday top of late.
- Japan’s Industrial Production growth eases, retail numbers came in mixed for June.
- BoJ conducts the first special bond-buying since February, ECB’s Lagarde appears optimistic on economic growth.
- Preliminary readings of Eurozone inflation, GDP data will direct intraday traders.
EUR/JPY extends the previous day’s rebound from a six-week low while rising past the 156.00 hurdle, up 0.41% intraday near 156.15-20 heading into Monday’s European session. In doing so, the cross-currency pair justifies the weekend comments from European Central Bank (ECB) President Christine Lagarde, as well as mixed Japan data and the Bank of Japan’s (BoJ) latest action.
BoJ conducts the first special bond-buying since February on early Monday, worth 300 billion Yen, with a 5-10 year residual maturity. That said, the preliminary readings of Japan’s Industrial Production for June eased to 2.0% MoM versus 2.4% market forecasts and -2.2% previous readings while the YoY figures drop to -0.4% from 4.2% prior. Further, Retail Trade improved to 5.9% YoY in June but the seasonally adjusted (s.a.) figures slump to -0.4% from 1.3% marked in May versus 0.2% expected.
On the other hand, ECB President Christine Lagarde termed the latest economic output numbers from France, Germany and Spain as “quite encouraging” while speaking to French daily Le Figaro during the weekend. On Friday, Germany's Bundesbank President and ECB Governing Council member Joachim Nagel cited stubborn core inflation to defend the hawkish ECB policies while suggesting higher interest rates for longer.
Apart from Japan, Eurozone moves, optimism about China stimulus and upbeat yields also underpin the EUR/JPY run-up ahead of German Retail Sales and the first readings of the Eurozone inflation data for July, per the Harmonized Index of Consumer Prices, as well as the second-quarter (Q2) seasonally adjusted Gross Domestic Product (GDP).
On Friday, the EUR/JPY jumped as the Bank of Japan (BoJ) defied the market’s expectations of announcing an immediate tweak to its Yield Curve Control (YCC) policy by keeping the monetary policy measured unchanged. The Japanese central bank (BoJ), however, pledged to make YCC more flexible and drowned the JPY after an initial run-up in the Yen.
Following the monetary policy decision, Bank of Japan (BOJ) Governor Kazuo Ueda said that they “need to patiently continue monetary easing to support the economy.” BoJ’s Ueda also added that the decision is aimed at making YCC more sustainable. The same statement from BoJ Governor Ueda also got credence from Japanese Chief Cabinet Hirokazu Matsuno. It’s worth noting that BoJ’s Ueda showed readiness to take necessary steps if interest rates rise beyond 1.0%.
Technical analysis
EUR/JPY pair’s rebound from an upward-sloping support line from early May, around 153.40, aims for another battle with the one-month-old falling resistance line, close to 157.75 at the latest.
- USD/JPY extends Friday’s recovery from four-month-old rising support line, grinds near intraday high of late.
- 21/50-DMA confluence, upbeat oscillators add strength to bullish bias as BoJ conducts the first bond buying since February.
- Multiple hurdles around 144.00 can test Yen pair buyers before directing them to yearly top.
- Sellers need validation from multi-day-old support line and US NFP to refresh monthly low.
USD/JPY stays on the front foot around 141.80 as it prods a six-week-old horizontal resistance during early Monday morning in Europe. In doing so, the Yen pair justifies the Bank of Japan’s (BoJ) firmer bond-buying operation since February.
Adding strength to the upside bias is the pair’s successful rebound from an upward-sloping support line from late March, as well as a daily closing beyond the 141.00 resistance-turned-support confluence comprising the 21-DMA and 50-DMA.
Furthermore, upbeat MACD signals and the RSI (14) line, not overbought, also add strength to the bullish bias about the Yen pair.
However, a daily closing beyond the aforementioned horizontal resistance area surrounding the 141.80-142.00 resistance area becomes necessary for the USD/JPY buyers to keep the reins.
Following that, a one-month-old horizontal region surrounding 144.00 can act as an intermediate halt before directing the Yen pair buyers toward the yearly top marked during late June around 145.00.
Meanwhile, pullback moves need validation from the aforementioned DMA confluence near 141.00, as well as the US Nonfarm Payrolls (NFP) data.
In a case where the USD/JPY bears dominate past 141.00 and the US jobs report disappoints, the multi-month-old rising support line of near 138.20 will be the last defense of the Yen pair buyers.
USD/JPY: Daily chart

Trend: Further upside expected
- USD/CAD touches a nearly three-week top on Monday, albeit lacks follow-through buying.
- Retreating Oil prices undermines the Loonie and lends support amid modest USD strength.
- Bulls need to wait for a sustained strength beyond the 50-day SMA before placing fresh bets.
The USD/CAD pair attracts some dip-buying near the 1.3240 area on Monday and touches a nearly three-week high during the Asian session. Spot prices, however, struggle to capitalize on the modest uptick and currently trade around the 1.3250 region, nearly unchanged for the day.
Crude Oil prices edge lower as bulls opt to take some profits off the table following the recent rally to the highest level since April 19 touched on Friday. This, in turn, is seen undermining the commodity-linked Loonie, which, along with the emergence of some US Dollar (USD) buying, acts as a tailwind for the USD/CAD pair. That said, the uncertainty over the Federal Reserve's (Fed) future rate-hike path, fueled by an extremely resilient US economy and signs of colling inflationary pressures, holds back traders from positioning for any further gains for the major.
From a technical perspective, any subsequent move up is more likely to remain capped near the 1.3300 strong horizontal support breakpoint, now turned resistance. The said handle now coincides with the 50-day Simple Moving Average (SMA) and should act as a pivotal point. A sustained strength beyond might trigger a short-covering rally and lift the USD/CAD pair towards the 1.3360 hurdle en route to the monthly peak, around the 1.3385 region. Some follow-through beyond the 1.3400 mark should pave the way for a further near-term appreciating move.
On the flip side, the Asian session low, around the 1.3240 region, now seems to protect the immediate downside ahead of the 1.3200 mark. Failure to defend the said support levels will expose the 1.3160 intermediate support, below which the USD/CAD pair could slide back toward resting sub-1.3100 levels, or its lowest level since September 2022 touched earlier this month. Some follow-through selling has the potential to drag spot prices further towards the 1.3050 horizontal zone en route to the next relevant support near the 1.3000 psychological mark.
USD/CAD daily chart
-638263742013703846.png)
Key levels to watch
- EUR/USD loses traction in the busy economic calendar week.
- The pair holds below the 50- and 100-hour EMAs; the RSI stands in bearish territory.
- The immediate resistance is seen at 1.1045; initial support is located near the 1.1000 zone.
The EUR/USD pair loses momentum and remains on the defensive above the 1.1000 area during the early Asian trading hours on Monday. The major pair drops for two consecutive weeks after retreating from Year-to-date (YTD) highs. EUR/USD currently trades around 1.1015, losing 0.02% for the day. Market players await the economic data from the Eurozone, while the US Nonfarm Payrolls later this week will be the key event and could spark volatility in the FX market.
According to the one-hour chart, the major pair holds below the 50- and 100-day Exponential Moving Averages (EMAs), implying the path of least resistance for the EUR/USD is to the downside. Adding to this, the Relative Strength Index (RSI) stands below 50, supporting EUR/USD buyers for now.
The immediate resistance level for EUR/USD appears at 1.1045 (High of July 28). Further north, the pair will challenge the next hurdle at 1.1055, representing the upper boundary of the Bollinger Band.
Any meaningful follow-through buying beyond the latter could pave the way to the next barrier at the 1.1100–1.1110 zone, highlighting an intersection of a psychological round mark and a high of July 26. The additional upside filter is located at 1.1250 (High of July 27).
On the downside, EUR/USD will meet an initial support level at 1.1000 (a psychological round figure) en route to 1.0965 (a lower limit of the Bollinger Band). A decisive break below the latter would fuel a drop towards 1.0940 (Low of July 10).
EUR/USD one-hour chart

- GBP/JPY gains positive traction for the second straight day and climbs to a one-week high.
- The risk-on environment undermines the safe-haven JPY and acts as a tailwind for the cross.
- The expected BoJ-BoE policy divergence remains supportive of the follow-through move up.
- The market focus remains glues to the highly-anticipated BoE policy meeting on Thursday.
The GBP/JPY cross builds on Friday's strong intraday recovery of over 500 pips from the 176.30 area, or its lowest level since June 13 and scales higher for the second successive day on Monday. The momentum lifts spot prices to a one-week top, near the 182.20 area during the Asian session and is sponsored by the emergence of fresh selling around the Japanese Yen (JPY).
As investors look past the Bank of Japan's (BoJ) move to make its Yield Curve Control (YCC) policy flexible, the prevalent risk-on mood undermines the safe-haven Japanese Yen (JPY) and acts as a tailwind for the GBP/JPY cross. It is worth recalling that the BoJ said on Friday that the 0.5% cap on the 10-year Japanese government bond yield will now be "references" rather than "rigid limits" and that it would step in the markets at a yield of 1.0%. This was seen as a step towards a possible shift away from the BoJ's dovish stance, though the immedaite market reaction turned out to be short-lived as market participants seem convinced that the central bank will stick to its loose monetary policy settings.
In contrast, the Bank of England (BoE) is expected to raise its benchmark interest rate by 25 bps on August 3, to 5.25%, or the highest since early 2008. Moreover, the markets have been pricing in two more BoE rate hikes by the end of this year as price pressures persist. This contributes to the British Pound's relative outperformance against its Japanese counterpart and turns out to be another factor providing an additional boost to the GBP/JPY cross. That said, the UK consumer inflation figures released earlier this month forced investors to scale back their expectations for more aggressive policy tightening by the BoE. This might hold back bulls from placing fresh bets around the GBP and cap gains.
Hence, traders are more likely to move to the sidelines ahead of the highly-anticipated BoE monetary policy meeting scheduled this week, on Thursday. The outcome will play a key role in influencing the Sterling and help investors to determine the next leg of a directional move. In the meantime, the aforementioned fundamental backdrop makes it prudent to wait for some follow-through buying beyond the 182.50 supply zone before positioning for any further appreciating move in the absence of any relevant market moving economic data from the UK.
Technical levels to watch
- USD/INR extends Friday’s pullback from two-week high, pressured near intraday low of late.
- An aggregate 32% rise in net profit of 456 Indian companies underpins optimism about Rupee.
- US Dollar’s positioning for NFP, month-end consolidation and mixed sentiment in Asia allow sellers to remain hopeful.
- US ISM PMI, risk catalyst can entertain traders ahead of monthly employment data for July.
USD/INR stays on the back foot around 82.20 as it prods short-term key support confluence amid early Monday in Asia. In doing so, the Indian Rupee (INR) pair drops for the second consecutive day amid mixed sentiment in the market ahead of the all-important US Nonfarm Payrolls (NFP), up for publishing on Friday.
That said, downbeat prints of the US inflation clues and the recently softer comments from the Fed officials weigh on the USD/INR prices amid cautious optimism in the Asia-Pacific zone.
Recently, China’s State Council announced multiple measures to conserve and boost consumer demand and favored the risk-on mood in Asia. Additionally, weekend comments from European Central Bank (ECB) and the Federal Reserve (Fed) officials suggest nearness to the policy pivot and offered reason to better prepare the US Dollar for this week’s employment report for July.
At home, Reuters shared a report from Geojit Financial Services mentioning that the aggregate net profit and revenue of these companies grew 32% and 7.88% from a year earlier, with profit growing at the fastest pace in eight quarters.
Further, the recent retreat of the WTI crude oil from a 14-week high, down 0.50% intraday near $80.10 by the press time, also allows the Indian Rupee (INR) to remain firmer due to the nation’s heavy reliance on the Oil imports.
It’s worth noting that the MSCI’s index of Asia-Pacific shares outside Japan remains firmer at the latest highest levels since early February whereas S&P500 Futures seesaw past 4,600, close the yearly top. Further, the US Dollar Index (DXY) struggles for clear directions around 101.70 after retreating from a three-week high the previous day, due to the softer prints of the Fed’s preferred inflation gauge, namely the US Core Personal Consumption Expenditure (PCE) Price Index for June.
Moving on, risk catalysts and a few more activity data from China may entertain USD/INR traders ahead of US ISM PMI and Nonfarm Payrolls (NFP) for July.
Technical analysis
A convergence of the 100 and 21 DMA restricts the immediate downside of the USD/INR pair around 82.20 even if the recovery remains elusive below a three-week-old resistance line, close to 82.40 at the latest.
- Gold price edges lower on the first day of a new week and erodes a part of Friday's positive move.
- A more hawkish outlook by major central banks exert some downward pressure on the XAU/USD.
- Hopes that the Fed will end its rate-hiking cycle soon could help limit further losses for the metal.
Gold price struggles to capitalize on Friday's rebound from the vicinity of over a two-week low and kicks off the new week on a softer note. The XAU/USD remains on the defensive through the Asian session and currently trades just above the $1,955 level, down over 0.15% for the day.
The upbeat US GDP report released last Thursday pointed to an extremely resilient economy and kept the door open for one more 25 bps rate-hike by the Federal Reserve (Fed) in September or November. It is worth recalling that Fed Chair Jerome Powell had said last week that the economy still needs to slow and the labour market to weaken for inflation to credibly return to the 2% target. This, in turn, remains supportive of elevated US Treasury bond yields, which, to a larger extent, helps offset signs of colling inflationary pressures in the US and assists the US Dollar (USD) to hold steady below a nearly three-week high touched on Friday. A stronger Greenback tends to weigh on US Dollar-denominated commodities, which, along with a more hawkish stance adopted by other major central banks exerts some pressure on the Gold price.
In fact, the European Central Bank (ECB) noted that inflation, though continues to decline, is still expected to remain too high for too long and backed the case for further policy tightening. Moreover, the Bank of England (BoE) is expected to raise its benchmark interest rate by 25 bps on August 3, to 5.25%, or the highest since early 2008. The markets have also been pricing in two more BoE rate hikes by the end of this year as price pressures persist. Furthermore, the Bank of Japan (BoJ) started the proscess of moving away from decades of massive monetary stimulus and made its Yield Curve Control (YCC) policy flexible on Friday. This suggests that the path of least resistance for the Gold price is to the downside, though speculations that the Fed is nearing the end of its fastest interest rate hiking cycle since the 1980s might help limit losses.
The US Bureau of Economic Analysis reported that the Personal Consumption Expenditures (PCE) Price Index advanced 0.2% in June and rose 3.0% over the twelve months, registering its smallest gains since March 2021. Adding to this, the Core PCE Price Index (excluding the volatile food and energy components) came in at 4.1% YoY rate - the smallest increase since September 2021. This comes on the back of the US CPI report earlier this month and further points to signs of easing inflationary pressures. This should allow the Fed to soften its hawkish stance and supports prospecs for the emregence of some dip-buying around the Gold price, warranting some caution before placing fresh bearish bets around the Gold price.
Technical levels to watch
- GBP/USD remains sidelined after bouncing off two-month-old rising support line.
- Bearish MACD signals, steady RSI joins repeated failures to break 10-DMA to tease Pound Sterling sellers.
- Rising support line from early March acts as the final defense of Cable buyers.
- Recovery needs validation from 1.3000 and hawkish BoE move to convince buyers.
GBP/USD aptly portrays the market’s indecision amid the early hours of the key week comprising the Bank of England (BoE) Monetary Policy Meeting and the US Nonfarm Payrolls (NFP), making rounds to 1.2850 by the press time. In doing so, the Cable pair also justifies the mixed technical signals amid cautious optimism.
Also read: GBP/USD recovery looks to recapture 1.2900 as Fed hawks retreat on mixed data, focus on BoE, US NFP
That said, the Pound Sterling improved from a two-month-old support line the previous day but bearish MACD signals and steady RSI prods the GBP/USD bulls of late. Also acting as a short-term upside hurdle is the 10-DMA level of around 1.2890.
Following that, a fortnight-old horizontal resistance area surrounding the 1.3000 psychological magnet will act as the additional check for the Cable buyers before challenging the yearly high marked during the mid-July around 1.3145.
Ina case where the GBP/USD remains firmer past 1.3145, the odds of witnessing the pair’s run-up toward March 2022 peak of around 1.3300 can’t be ruled out.
Alternatively, a daily closing beneath the two-month-old rising support line, close to 1.2840 by the press time, needs validation from an upward-sloping support line from early March, surrounding 1.2720, to welcome the Pound Sterling bears.
Following that, May’s peak of 1.2640 may act as the final defense of the GBP/USD buyers.
GBP/USD: Daily chart
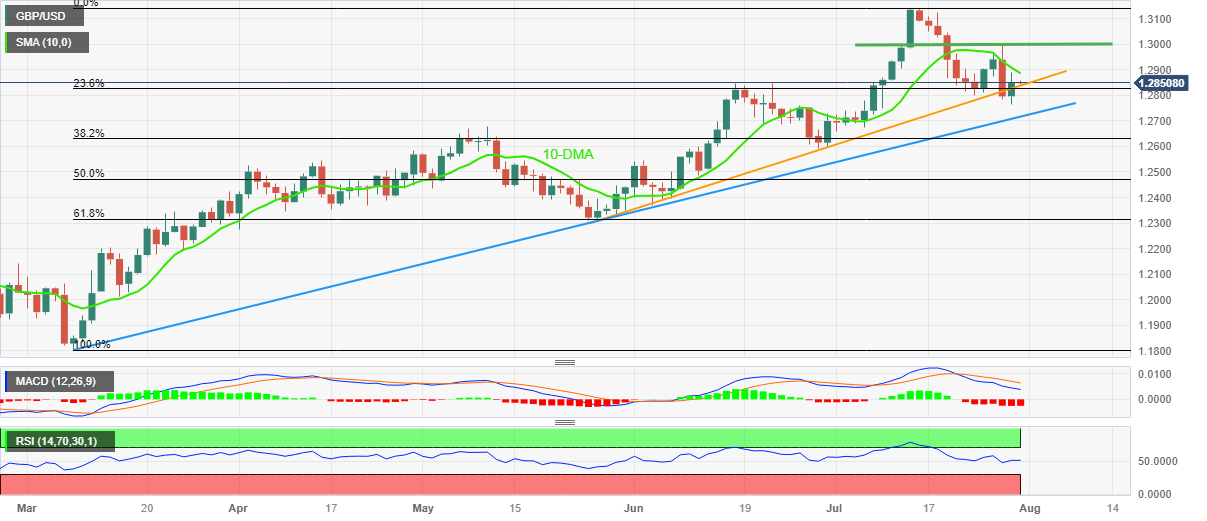
Trend: Further upside expected
- Market sentiment remains sluggish as NFP week begins with slightly positive news.
- China teases more stimulus, Fed’s Kashkari flags unemployment/growth fears amid higher rates.
- Official activity data from China came in mixed for July.
- US ISM PMI, NFP and central bank events will offer a busy week ahead.
The risk profile remains dicey, despite the latest improvement, as traders begin the NFP week with mixed data and news. That said, China stimulus hopes and mostly downbeat comments from the central bankers favor the mildly positive market sentiment. However, the mixed prints of the official PMIs from Beijing join the cautious mood ahead of the key data/events to prod optimism amid a sluggish start to the crucial week.
Amid these plays, S&P500 Futures struggle around the yearly high, making rounds to 4,600 of late, whereas the US 10-year and two-year Treasury bond yields edge higher after reversing from the three-week top the previous day. That said, the US Dollar Index (DXY) remains indecisive around 101.75 following the previous day’s retreat while prices of Gold and Crude Oil eased to around $1,957 and $80.20 of late.
During the weekend, Bloomberg came out with the news while quoting China’s State Council Information Office to flag hopes of witnessing more measures from the dragon nation to boost consumer demand, up for publishing at around 07:00 AM GMT on Monday.
Elsewhere, Minneapolis Fed President Neel Kashkari flagged fears of job losses and slower growth while praising the inflation outlook. The policymaker also criticized the central bank’s aggressive monetary tightening campaign to tamp down price surges. The same joined Friday’s softer prints of the Fed’s favorite inflation gauge, namely the Core Personal Consumption Expenditure (PCE) Price Index, to underpin the cautious optimism.
Furthermore, European Central Bank (ECB) President Christine Lagarde termed the latest economic output numbers from France, Germany and Spain as “quite encouraging” and added strength to the slightly positive mood, which in turn prod the US Dollar’s haven demand.
It should be noted that the strong points of the US Gross Domestic Product (GDP) Annualized for the second quarter (Q2) joined the upbeat figures of the US Durable Goods Orders for June to allow the US Dollar to stay firmer for the second consecutive week. However, the Federal Reserve’s (Fed) clues for the September rate hike failed to impress the greenback buyers and joined the ECB’s dovish hike to favor odds of witnessing a sooner end to the rate hike trajectory at the major central banks, which in turn underpin the market’s optimism.
Elsewhere, upbeat earnings from the global tech giants and the International Monetary Fund’s (IMF) upward revision to the growth forecasts favor the risk appetite.
Looking forward, the US ISM PMIs and the risk catalysts can entertain the traders ahead of Friday’s US jobs report for July.
Also read: Forex Today: Can Dollar's momentum continue in the week of US employment data?
Following dismal China’s official business PMIs data released on Monday, China issued measures to restore and expand consumption, a document published by the country’s State Council showed.
No further details are provided about the same.
Also read: China's NBS Manufacturing PMI rises to 49.3 in July vs. 49.2 expected
Market reaction
On the above headlines, AUD/USD is sustaining its recovery toward 0.6700, currently trading at 0.6672. The pair is up 0.38% on the day.
| Raw materials | Closed | Change, % |
|---|---|---|
| Silver | 24.335 | 0.81 |
| Gold | 1959.03 | 0.63 |
| Palladium | 1247.2 | 0.64 |
- USD/CNH remains under some selling pressure for the second successive day.
- The mixed Chinese PMIs fail to provide any meaningful impetus to the pair.
- Acceptance below the 50-day SMA supports prospects for additional losses.
The USD/CNH pair drifts lower for the second successive day and drops to a two-day low, around the 7.1330 area after the release of mixed Chinese PMI prints for July during the Asian session on Monday. Spot prices, however, manage to rebound a few pips in the last hour and currently trade around the 7.1420 region, down just over 0.15% for the day.
In fact, data released by China’s National Bureau of Statistics (NBS) showed that the official Manufacturing PMI improved from 49 in the previous month to 49.3 in July, though remains in the contraction territory. Meanwhile, the gauge for the services sector dropped to 51.5 during the reported month as compared to 53.2 in June. That said, hopes for additional stimulus from China turn out to be a key factor exerting some pressure on the USD/CNH pair.
From a technical perspective, last week's convincing break and acceptance below the 50-day Simple Moving Average (SMA) was seen as a fresh trigger for bearish traders. Moreover, oscillators on the daily chart have been gaining negative traction and support prospects for a further depreciating move. That said, it will be prudent to wait for some follow-through selling below the 7.1170-7.1160 horizontal support before placing fresh bearish bets around the USD/CNH pair.
Spot prices might then turn vulnerable to accelerate the slide to the 7.1040-7.1035 region en route to the 7.1000 round-figure mark. The fall could get extended further towards the next relevant support near the 7.06550 area.
On the flip side, the 50-day SMA, currently pegged around the 7.1720 zone, might continue to act as an immediate hurdle ahead of the 7.1775-7.1780 supply zone and the 7.1910-7.1915 region. This is followed by a resistance marked by a descending trend-line extending from the June swing high, around the 7.2135-7.2140 area. A sustained strength beyond the latter will negate any near-term negative bias and pave the way for some meaningful upside for the USD/CNH pair.
USD/CNH daily chart
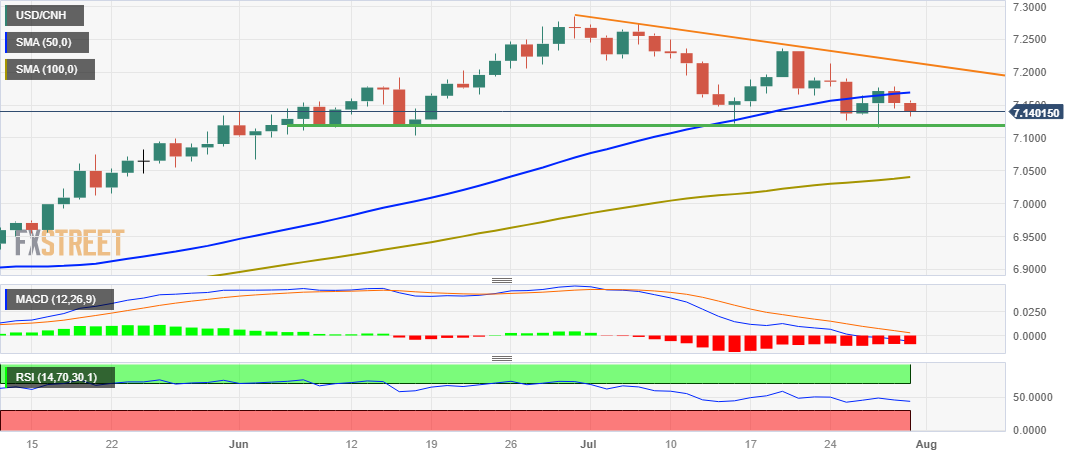
Key levels to watch
- USD/MXN bounces off the lowest level since December 2015, pares the biggest daily loss in two months.
- RSI conditions favor corrective bounce off fortnight-old horizontal support.
- Mexican Peso bears remain off the table below 21-DMA, three-week-old resistance line guards immediate recovery.
USD/MXN picks up bids to consolidate the biggest daily loss in two months around 16.72, up 0.17% intraday, amid early Monday. In doing so, the Mexican Peso (MXN) pair recovers from its lowest level since December 2015.
That said, the below 50 levels of the RSI (14) line supports the USD/MXN pair’s corrective bounce off the two-week-old horizontal line, around 16.70. However, the impending bear cross on the MACD challenges the buyers.
It’s worth noting that a downward-sloping resistance line from July 07, close to 16.83 by the press time, restricts the immediate recovery of the USD/MXN pair.
Following that, the 21-DMA level of around 16.90 becomes crucial for the USD/MXN bulls to cross to retake control.
Also acting as an upside filter is the previous support line stretched from mid-June, close to 16.97 at the latest, quickly followed by the 17.00 round figure.
Meanwhile, a daily closing beneath the previously stated horizontal support near 16.70 can direct the USD/MXN bears toward a downward-sloping support line from mid-May, around 16.55 by the press time.
In a case where the USD/MXN remains bearish past 16.55, the October 2015 low of near 16.32 will be in the spotlight.
USD/MXN: Daily chart
-31072023-638263661298456079.png)
Trend: Limited recovery expected
- NZD/USD gains traction above 0.6175, up 0.43% in the early session on Monday.
- The Chinese Manufacturing Purchasing Managers' Index (PMI) showed mixed readings.
- Market players will monitor the New Zealand Employment data, Nonfarm Payrolls later this week.
The NZD/USD pair gains momentum and edges higher to 0.6175 during the early Asian session on Monday. The uptick in the Kiwi comes after the release of the Chinese NBS Manufacturing and Non-Manufacturing Purchasing Managers Index (PMI).
The latest publication released by The National Bank of New Zealand showed on Monday that July's New Zealand ANZ Activity Outlook improved to 0.8%, above the expected 0.9% decline. Meanwhile, ANZ Business Confidence fell from -18 in June to -13.1 in July.
Regarding the Chinese data, China’s National Bureau of Statistics (NBS) revealed on Monday that the Manufacturing Purchasing Managers' Index (PMI) increased to 49.3 in July, improving from 49.0 in June and the market's estimate of 49.2. However, the figure was marked below 50 for the fourth straight month, indicating the contraction zone. Meanwhile, the NBS Services PMI fell from 53.2 in June to 51.5 in July.
Investors anticipate additional policy support to spur economic recovery post-Covid. The State Council Information Office of China revealed that Li Chunlin, vice chairman of the National Development and Reform Commission, and officials from the Ministry of Industry and Information Technology, the Ministry of Commerce, and the State Administration of Market Regulation will hold a press conference at 7 a.m. GMT to announce additional measures to boost consumption. The development of the headline might boost the China-proxy Kiwi.
The annual US inflation figure grew at its slowest pace in over two years. The US Bureau of Economic Analysis reported on Friday that the Personal Consumption Expenditures (PCE) Price Index fell from 3.8% in May to 3% in June, below the market expectation of 3.1%. While the Federal Reserve's preferred measure of inflation, the Core PCE Price Index, came in at 4.1% annually, down from 4.6% in May and below market expectations of 4.2%. The softer data indicates pricing pressures are easing and may bring the Federal Reserve (Fed) closer to the end of its hiking cycle. This, in turn, might cap the upside in the US Dollar and act as a tailwind for NZD/USD.
Looking ahead, the New Zealand Employment Change QoQ and Unemployment Rate Q2 will be released on Wednesday. The week's highlight will be the Nonfarm Payrolls report, due on Friday. The economy is expected to have created 180,000 jobs, with the unemployment rate remaining at 3.6%. These events could significantly impact the US Dollar's dynamic and give the NZD/USD pair a clear direction.
- AUD/USD picks up bids to extend week-start rebound from three-week low.
- China NBS Manufacturing PMI recovers but Non-Manufacturing PMI eases in July.
- Australia TD Securities Inflation improves on MoM, eases on YoY for July.
- Market’s cautious optimism allows Aussie pair to consolidate recent losses ahead of RBA, US ISM PMIs and NFP.
AUD/USD prints the first daily gains in four as it recovers from the lowest levels in three weeks while printing mild gains around 0.6670 during the mid-Asian session on Monday. In doing so, the Aussie pair justifies the market’s slightly positive sentiment and the US Dollar’s retreat while taking positive clues from China’s official activity data and Australian inflation clues.
That said, China’s official NBS Manufacturing PMI edges higher to 49.3 versus 49.2 expected and 49.0 prior but the Non-Manufacturing PMI eases to 51.5 from 53.2 prior.
Further, Australia’s TD Securities Inflation rises to 0.8% MoM for July versus 0.1% previous readings while the yearly figures drop to 5.4% YoY from 5.7% marked in June. Elsewhere, Australia’s Private Sector Credit softens to 0.2% and 5.5% per the MoM and YoY basis in June compared to 0.4% and 6.2% respective priors.
Elsewhere, hopes of witnessing China’s further stimulus to boost demand, per Bloomberg’s news, put a floor under the AUD/USD prices.
Adding strength to the corrective bounce can be the comments from Federal Reserve Bank of Minneapolis President Neel Kashkari suggesting challenges for the US employment sector amid firmer rates. Also weighing on the US Dollar can be Friday’s downbeat inflation clues.
With this, the US Dollar Index (DXY) remains directionless around 101.70 after reversing from a three-week high the previous day on downbeat prints of the Core Personal Consumption Expenditure (PCE) Price Index, mostly known as the Fed’s preferred inflation gauge. It should be noted that the downbeat prints of US Personal Income and softer revision of the US Michigan Consumer Sentiment Index for July, as well as the University of Michigan’s (UoM) 5-year Consumer Inflation Expectations, also triggered the DXY pullback the previous day.
Against this backdrop, Wall Street closed positive and the yields retreated the previous day, slightly firmer by the press time. That said, the S&P500 Futures print mild gains by the press time.
Looking ahead, the US ISM PMIs and the risk catalysts can entertain the AUD/USD traders ahead of Friday’s US jobs report for July will be crucial to watch for clear directions.
Technical analysis
Unless providing a daily closing beyond the 0.6690 support-turned-resistance confluence comprising the 100-DMA and a two-month-old rising trend line, AUD/USD bears stay hopeful of witnessing further downside towards testing the late June swing low of near 0.6600.
According to the latest data published by China’s National Bureau of Statistics (NBS) on Monday, the country’s official Manufacturing Purchasing Managers' Index (PMI) improved to 49.3 in July as against the 49.0 contraction seen in June and the market expectations of a 49.2 figure.
The index remained below the 50 mark, which separates expansion from contraction, for a fourth straight month, suggesting that additional policy support is needed to stimulate post-Covid economic recovery.
The NBS Services PMI dropped to 51.5 in July, compared with 53.2 reported in June.
AUD/USD reaction
The mixed readings of the Chinese PMIs failed to have any negative impact on the Aussie Dollar, with AUD/USD marching toward 0.6700. The spot is trading at 0.6677, at the time of writing, down 0.44% on the day.
- USD/CHF edges higher on Monday and draws support from a combination of factors.
- The risk-on mood undermines the safe-haven CHF and acts as a tailwind for the major.
- The USD holds steady just below the multi-week high and also lends support to the pair.
The USD/CHF pair attracts some dip-buying near the 0.8675-0.8670 area on the first day of a new week and moves back closer to over a two-week high touched on Friday. Spot prices currently trade around the 0.8700 round-figure mark and look to build on last week's goodish rebound from mid-0.8500s, or a fresh low since January 2015.
The prevalent risk-on environment - as depicted by a generally positive tone around the equity markets - is seen undermining the safe-haven Swiss Franc (CHF) and acting as a tailwind for the USD/CHF pair. The US Dollar (USD), on the other hand, holds steady just below a nearly three-week high and remains well supported by elevated US Treasury bond yields, bolstered by prospects for further policy tightening by the Federal Reserve (Fed).
It is worth recalling that Fed Chair Jerome Powell had said last week that the economy still needs to slow and the labour market to weaken for inflation to credibly return to the 2% target. Moroever, the US GDP report pointed to an extremely resilient economy and kept the door for one more 25 bps rate-hike in September or November wide open. This, to a larger extent, overshadows signs of receding underlying price pressures in the US.
In fact, the US Bureau of Economic Analysis reported that the PCE Price Index rose 0.2% last month and advanced 3.0% over the twelve months through June, registering its smallest gains since March 2021. Excluding the volatile food and energy components, the Core PCE Price Index came in at 4.1% YoY rate - the smallest increase since September 2021. This could force the Fed to end its fastest rate-hiking cycle since the 1980s and cap the USD.
The aforementioned fundamental backdrop, meanwhile, seems tilted in favour of the USD bulls and supports prospects for some meaningful near-term appreciating move for the USD/CHF pair. Traders, however, might refrain from placing aggressive bets and prefer to wait on the sidelines ahead of this week's important US macro releases scheduled at the beginning of a new month, including the closely-watched NFP report on Friday.
Technical levels to watch
- US Dollar Index struggles to defend buyers after two-week uptrend.
- China news allowed markets to begin NFP week on a positive side.
- Fed’s Kashkari flags uptick in unemployment, shows indecision about September rate hike.
- US data will be crucial as FOMC failed to inspire policy hawks and marked data dependency.
US Dollar Index (DXY) remains directionless around 101.70 during early Monday in Asia. In doing so, the greenback’s gauge versus the six major currencies bears the burden of the market’s risk-on mood and mixed concerns about the Federal Reserve (Fed). Also testing the DXY bulls after a two-week uptrend is the cautious mood ahead of this week’s US ISM PMIs for July and the US jobs report for the said month, comprising the headline Nonfarm Payrolls (NFP).
The market’s risk-on mood can be linked to the latest easing in the US inflation clues and expectations of China stimulus. That said, Bloomberg quoted China's State Council Information Office to flag hopes of a fresh stimulus announcement from Beijing by conveying a surprise press conference around 07:00 AM GMT. That said, the scheduled media conference will include China Vice Chairman of the National Development and Reform Commission Li Chunlin and officials from the Ministry of Industry and Information Technology, the Ministry of Commerce and the State Administration for Market Regulation to unveil more measures to boost the consumption, per the news.
Friday’s US data suggests softer prints of the US Federal Reserve’s (Fed) favorite inflation gauge, namely the Core Personal Consumption Expenditure (PCE) Price Index, as it eased to 4.1% YoY for June versus 4.2% expected and 4.6% prior. Further details revealed that the Personal Income softened to 0.3% versus 0.5% expected and previous readings whereas the Personal Spending rose 0.5% from 0.4% market forecasts and 0.1% prior. Additionally, the final readings of the Michigan Consumer Sentiment Index for July eased to 71.6 from the initial estimations of 72.6 while the University of Michigan’s (UoM) 5-year Consumer Inflation Expectations also edged lower to 3.0% from 3.1% expected and prior.
Considering the downbeat US inflation clues, Federal Reserve Bank of Minneapolis President Neel Kashkari flagged fears of job losses and slower growth while praising the inflation outlook. The policymaker also criticized the central bank’s aggressive monetary tightening campaign to tamp down price surges.
It’s worth noting that strong prints of the US Gross Domestic Product (GDP) Annualized for the second quarter (Q2) joined the upbeat figures of the US Durable Goods Orders for June to allow the US Dollar to stay firmer for the second consecutive week. Also likely to have favored the US Dollar, is the European Central Bank’s (ECB) dovish hike and emphasis on the data-dependency of the next rate decision.
While portraying the mood, Wall Street closed positive and the yields retreated together with the US Dollar. Even so, the US Dollar Index (DXY) marked two consecutive weekly gains by the end of Friday’s trading. It’s worth noting that the S&P500 Futures print mild gains by the press time.
Looking ahead, the US ISM PMIs and the risk catalysts can entertain the DXY traders ahead of Friday’s US jobs report for July will be crucial to watch for clear directions.
Technical analysis
Although a clear upside break of a six-month-old horizontal support area surrounding 100.80 joins recently firmer oscillators to favor the US Dollar Index (DXY) buyers, recovery remains elusive beneath two-month-old falling resistance line, close to 102.50 by the press time.
- USD/CAD reclaimed the 1.3250 mark at the start of a new week.
- The Canadian Gross Domestic Product (GDP) grew by 0.3% in May, matching market consensus.
- The US annual Personal Consumption Expenditures (PCE) Price Index rose at its slowest pace in over two years.
The USD/CAD pair kicks off the new week on a positive note and edges higher above the critical resistance area at 1.3250 during the early Asian session. Market participants will keep an eye on Canadian and US employment data later this week. The major pair currently trades around 1.3260, up 0.06% for the day.
Statistics Canada showed on Friday that the Canadian Gross Domestic Product (GDP) grew by 0.3% in May, matching market consensus. However, the figure is likely to contract in June, suggesting an economic slowdown in the country. This could bring an end to the Bank of Canada's (BoC) tightening cycle that has pushed interest rates to a 22-year high.
That said, the BoC announced a 25 basis point (bps) rate hike to 5.0% on July 12. BoC Governor Tiff Macklem disclosed that future policy decisions would be based on incoming data and the inflation outlook. Market participants anticipated that the Bank of Canada (BoC) would not deem it necessary to increase interest rates further this year.
Meanwhile, the uptick in oil prices has supported the Loonie and offset a slowdown in the Canadian manufacturing sector. Higher crude prices strengthen the Canadian Dollar, as the country is the leading oil exporter to the United States.
On the US Dollar front, annual US inflation grew at its slowest pace in over two years. The US Bureau of Economic Analysis reported on Friday that the Personal Consumption Expenditures (PCE) Price Index fell from 3.8% in May to 3% in June, below the market expectation of 3.1%. While the Federal Reserve's preferred measure of inflation, the Core PCE Price Index, came in at 4.1% annually, down from 4.6% in May and below market expectations of 4.2%. Finally, Personal Income and Personal Spending MoM increased by 0.3% and 0.5%, respectively. The softer data indicates pricing pressures are easing and may bring the Federal Reserve (Fed) closer to the end of its hiking cycle.
Later this week, investors will closely watch the Canadian employment data on Friday. Also, the US ADP Employment Change for July and Nonfarm Payrolls will be key events to monitor. The data will be critical for determining a clear movement for the USD/CAD pair.
People’s Bank of China (PBoC) set the USD/CNY central rate at 7.1305 on Monday, versus the previous fix of 7.1338 and market expectations of 7.1524. It's worth noting that the USD/CNY closed near 7.1497 the previous day.
Apart from the USD/CNY fix, the PBoC also unveiled details of its Open Market Operations (OMO) while saying that the Chinese central bank injects 31 billion Yuan via 7-day reverse repos (RRs) at 1.90% vs prior 1.90%.
However, the 14 billion Yuan of RRs mature today, which in turn suggests a net 17 billion Yuan injection on the day in OMOs.
About PBOC fix
China maintains strict control of the yuan’s rate on the mainland.
The onshore yuan (CNY) differs from the offshore one (CNH) in trading restrictions, this last one is not as tightly controlled.
Each morning, the People’s Bank of China (PBOC) sets a so-called daily midpoint fix, based on the yuan’s previous day's closing level and quotations taken from the inter-bank dealer.
- USD/JPY edges lower at the start of a new week, though lacks follow-through selling.
- Friday's softer US PCE Price Index keeps the USD bulls on the defensive and weigh.
- The upbeat market mood undermines the safe-haven JPY and lends support to the pair.
The USD/JPY pair struggles to capitalized on Friday's solid intraday recovery of over 300 pips from the 138.00 neighbourhood, or a one-and-half-week low and kicks off the new week on a softer note. Spot prices remain on the defensive through the Asian session and currently trade around the 140.80-140.75 region, down 0.25% for the day.
The US Dollar (USD) edges lower on Monday in the wake of signs of receding underlying price pressures and is seen as a key factor acting as a headwind for the USD/JPY pair. In fact, the US Bureau of Economic Analysis reported that the Personal Consumption Expenditures (PCE) Price Index rose 0.2% last month and advanced 3.0% over the twelve months through June, registering its smallest gains since March 2021. Excluding the volatile food and energy components, the Core PCE Price Index came in at 4.1% YoY rate - the smallest increase since September 2021. This, along with reports released earlier this month, indicated a further moderation in consumer prices and could push the Federal Reserve (Fed) to end its fastest interest rate-hiking cycle since the 1980s, which keeps the USD bulls on the defensive.
That said, the stronger US GDP print pointed to an extremely resilient US economy and increased the likelihood that the Fed could hike interest rates further. It is worth recalling that Fed Chair Jerome Powell had said last week that the economy still needs to slow and the labour market to weaken for inflation to credibly return to the 2% target. This keeps the door for one more 25 bps rate-hike in September or November wide open, which remains supportive of elevated US Treasury bond yields and should help limit the downside for the USD. Apart from this, the upbeat market mood could undermine the safe-haven Japanese Yen (JPY) and lend support to the USD/JPY pair, warranting some caution for aggressive bearish traders and before positioning for the resumption of the recent corrective decline.
The markets, meanwhile, already seem to have digested the Bank of Japan's (BoJ) hawkish move to make its Yield Curve Control (YCC) policy flexible on Friday. The central bank said that the 0.5% cap on the 10-year Japanese government bond yield will now be "references" rather than "rigid limits" and that it would step in the markets at a yield of 1.0%. This was seen as a step towards the end of the BoJ's dovish stance, though the immedaite market reaction turned out to be short-lived. This, in turn, suggests that the path of least resistance for the USD/JPY pair is to the upside and subsequent downtick could be seen as a buying opportunity. Traders now look foward to this week's important US macro data scheduled for release at the beginning of a new month, including the NFP report, for some meaningful impetus.
Technical levels to watch
- Natural Gas picks up bids to reverse the previous weekly loss within a bearish chart formation.
- Sustained trading beyond 100-SMA, mixed oscillators keep XNG/USD bears hopeful.
- Clear downside break of $2.59 could convince Natural Gas sellers to refresh monthly low.
Natural Gas Price (XNG/USD) remains mildly bid near $2.68 amid early Monday morning in Asia. In doing so, the XNG/USD pares the previous weekly loss with mild losses, up 0.45% intraday, as sellers flex muscles within bearish chart formation.
That said, the XNG/USD’s sluggish MACD signals join the gradually improving XNG/USD price. However, the Natural Gas buyers need validation from the downward-sloping resistance line stretched from late June, close to $2.77 by the press time.
Following that, the XNG/USD run-up towards the previous monthly high of around $2.93 and March’s peak of near $3.08 will be in the spotlight.
On the contrary, a clear downside break of the 100-SMA, around $2.65 at the latest, becomes necessary for the XNG/USD bears to retake control.
Even so, the Natural Gas trading beneath the stated triangle’s bottom line, close to $2.59 at the latest, will be a tough nut to crack for the energy instrument before giving them control.
Following that, $2.43 and the previous monthly low of around $2.17 may test the XNG/USD bears before directing them to the theoretical target of below the $2.00 psychological magnet, close to $1.90.
Overall, XNG/USD remains bearish but the downside move needs validation from $2.59 to convince the energy bears.
Natural Gas Price: Four-hour chart
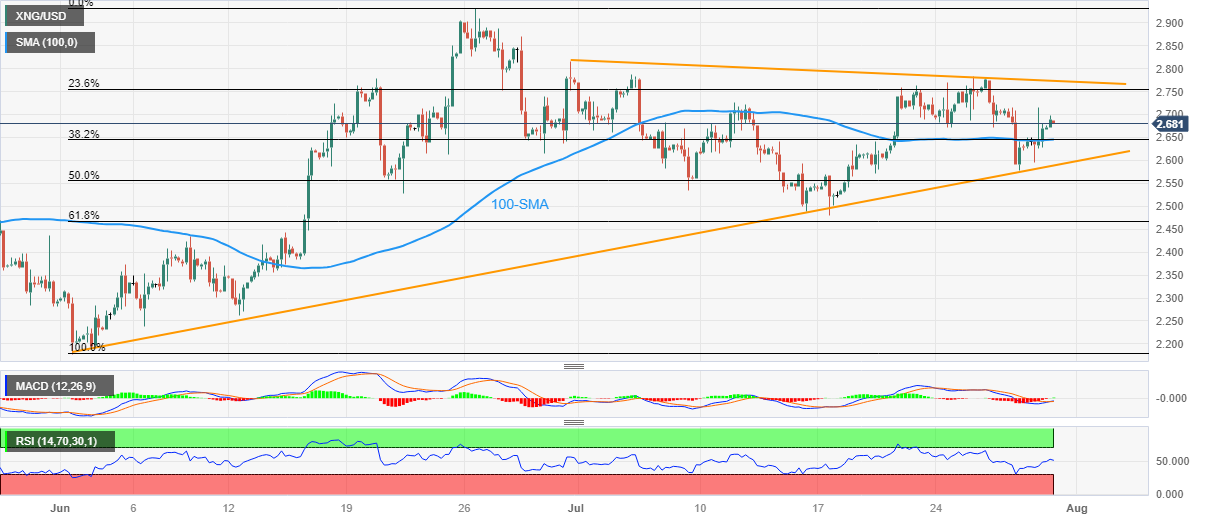
Trend: Limited downside expected
- GBP/USD edges higher after posting minor weekly loss.
- Friday’s downbeat US inflation clues, weekend comments from Fed’s Kashkari and China stimulus new underpin Pound Sterling’s rebound.
- Mixed UK data prod hopes of witnessing jumbo rate hike from BoE, suggesting pullback in Cable price.
- US ISM PMI, NFP data will be crucial for clear directions.
GBP/USD benefits from the US Dollar’s retreat amid a sluggish start to the week comprising the all-important Bank of England (BoE) Monetary Policy Meeting and the US Nonfarm Payrolls (NFP). That said, the Cable pair prints mild gains around 1.2860 by the press time after posting a minor weekly loss in the last.
That said, the US Dollar Index (DXY) extends the previous day’s retreat from a three-week high on weekend headlines from China and comments from Federal Reserve Bank of Minneapolis President Neel Kashkari. Furthermore, hopes of witnessing the Bank of England’s (BoE) 0.25% rate hike also allow the Pound Sterling to pare recent losses.
During the last week, the preliminary readings of the UK S&P Global/CIPS Manufacturing PMI for July dropped to the lowest level of 2023 with the 45.0 mark versus the market’s expectations of 46.1 and previous readings of 46.5. That said, the Services PMI also printed a six-month low by declining to 51.5 from 53.7 prior and 53.0 market forecasts. With this, the first readings of the Composite PMI edged lower to 50.7 compared to analysts’ estimations of 52.4 and 52.8 prior. It should be noted that the upbeat UK employment numbers jostled with downbeat inflation clues and recession woes to challenge the BoE hawks. “The Bank of England looks likely to raise rates by a quarter-point to 5.25% on Aug. 3, though economists and markets see a risk of a repeat of June's surprise half-point hike as inflation remains hotter than in other big economies,” said Reuters.
Talking about the weekend news, Bloomberg quoted China's State Council Information Office to flag hopes of a fresh stimulus announcement from Beijing by conveying a surprise press conference around 07:00 AM GMT. That said, the scheduled media conference will include China Vice Chairman of the National Development and Reform Commission Li Chunlin and officials from the Ministry of Industry and Information Technology, the Ministry of Commerce and the State Administration for Market Regulation to unveil more measures to boost the consumption, per the news.
That said, Federal Reserve Bank of Minneapolis President Neel Kashkari flagged fears of job losses and slower growth while praising the inflation outlook. The policymaker also criticized the central bank’s aggressive monetary tightening campaign to tamp down price surges.
Against this backdrop, Wall Street closed positive and the yields retreated together with the US Dollar. Even so, the US Dollar Index (DXY) marked two consecutive weekly gains by the end of Friday’s trading. It’s worth noting that the S&P500 Futures print mild gains by the press time.
Moving on, a light calendar in the UK ahead of Thursday’s BoE may allow the GBP/USD pair to consolidate recent losses. However, the US ISM PMIs and the risk catalysts can test the recovery moves. Above all, the BoE’s ability to defend the hawks and Friday’s US jobs report for July will be crucial to watch for clear directions.
Also read: GBP/USD Weekly Forecast: 1.2550 back in sight ahead of BoE, US NFP
Technical analysis
Doji candlestick on the weekly chart and a clear bounce off the five-week-old rising support line, close to 1.2820 by the press time, suggests further recovery of the GBP/USD pair. It’s worth noting, however, that the 10-DMA hurdle of around 1.2890 restricts the Cable pair’s run-up since July 19.
| Index | Change, points | Closed | Change, % |
|---|---|---|---|
| NIKKEI 225 | -131.93 | 32759.23 | -0.4 |
| Hang Seng | 277.45 | 19916.56 | 1.41 |
| KOSPI | 4.51 | 2608.32 | 0.17 |
| ASX 200 | -52.3 | 7403.6 | -0.7 |
| DAX | 63.72 | 16469.75 | 0.39 |
| CAC 40 | 11.23 | 7476.47 | 0.15 |
| Dow Jones | 176.57 | 35459.29 | 0.5 |
| S&P 500 | 44.82 | 4582.23 | 0.99 |
| NASDAQ Composite | 266.55 | 14316.66 | 1.9 |
| Pare | Closed | Change, % |
|---|---|---|
| AUDUSD | 0.6647 | -0.93 |
| EURJPY | 155.505 | 1.81 |
| EURUSD | 1.10164 | 0.32 |
| GBPJPY | 181.347 | 1.86 |
| GBPUSD | 1.28465 | 0.37 |
| NZDUSD | 0.61558 | -0.49 |
| USDCAD | 1.32463 | 0.19 |
| USDCHF | 0.87052 | 0.2 |
| USDJPY | 141.165 | 1.48 |
- WTI retreats from a multi-week high of $80.50 ahead of Chinese data.
- The US Core PCE Price Index came in at 4.1% annually versus 4.6% prior and below expectations of 4.2%.
- Oil traders will focus on the Chinese NBS Purchasing Managers Index (PMI) and the development of the stimulus plan in China.
Western Texas Intermediate (WTI), the US crude oil benchmark, is trading around the $80.20 mark so far in the early Asian session. WTI prices retreat from multi-week highs following the US Personal Consumption Expenditures (PCE) Price Index and the Michigan Consumer Sentiment Index on Friday. Oil traders will keep an eye on the Chinese inflation data and developments about the Chinese stimulus plan for fresh impetus later in the day.
On the US Dollar front, the Personal Consumption Expenditures (PCE) Price Index for June fell to 3% from 3.8% in May, below the market's expectation of 3.1%. The Federal Reserve's preferred measure of inflation, the Core PCE Price Index, came in at 4.1% annually, down from 4.6% in May and worse than expected at 4.2%. Also, the final readings of the Michigan Consumer Sentiment Index for July decreased to 71.6 from 72.6, and the University of Michigan's (UoM) 5-year Consumer Inflation Expectations fell to 3.0% from 3.1% prior and as market expectations.
That said, China, the world’s second-largest oil consumer, signaled additional support for the real estate sector and measures to stimulate domestic consumption amid a sluggish post-COVID recovery. The State Council Information Office of China revealed that Li Chunlin, vice chairman of the National Development and Reform Commission, and officials from the Ministry of Industry and Information Technology, the Ministry of Commerce, and the State Administration of Market Regulation will hold a press conference at 7 a.m. GMT to announce additional measures to boost consumption. The development of the headline might support further upside in the WTI price.
Market players will watch the Chinese NBS Manufacturing and Non-Manufacturing Purchasing Managers Index (PMI). The upbeat data might encourage WTI prices, while the softer data might fuel concern about the economic slowdown in the world’s second-largest economy. This, in turn, might exert pressure on WTI prices.
Apart from this, WTI has risen for four weeks due to OPEC+ supply cuts. OPEC+ announced a five-year supply cut of over five million barrels per day (bpd), or 5% of world oil production in April. It is expected that Saudi Arabia will prolong its 1 million barrel oil production reduction into September after extending it into August. Market players will monitor the OPEC+ group's Joint Ministerial Monitoring Committee (JMMC), scheduled for August 4, for fresh impetus.
Moving on, oil traders will focus on the Chinese PMI data and the development of more stimulus plans later in the day. The attention will shift to the US employment data. The JOLTS Job Openings report, ADP Private Employment, Weekly Jobless Claims, and Unit Labour Cost will be released later this week. The week's key event is the Nonfarm Payrolls report, due on Friday. These events could significantly impact the USD-denominated WTI price. Oil traders will take cues from the data and find trading opportunities around the WTI price.
- Silver Price (XAG/USD) remains defensive as it rebounds from a multi-day-old support confluence around $24.00.
- In doing so, XAG/USD prints a convergence of the 200-EMA and 38.2% Fibonacci retracement of late June-July upside.
- Three-week-old previous support line, now resistance around $24.50, restricts immediate upside of the Silver Price.
- 200-EMA, 38.2% Fibonacci retracement guards immediate downside of Silver price, XAG/USD remains troubled unless breaking $23.20 support.
Silver Price (XAG/USD) pares weekly losses while grinding higher past the $24.00 support confluence, mildly bid near $24.35 amid the early hours of Monday’s Asian session.
In doing so the bright metal extends the previous day’s corrective bounce off the convergence of a 200-Exponential Moving Average (EMA) and the 38.2% Fibonacci retracement of the XAG/USD’s late June-July upside after falling in the last two consecutive weeks.
It’s worth noting that a gradually rising RSI (14) line joins the looming bull cross on the MACD to underpin the XAG/USD rebound.
However, the previous support line stretched from early July, close to $24.85 at the latest, restricts the immediate upside of the Silver Price.
Following that, a seven-day-long descending resistance line near $25.10 can prod the Silver buyers before directing them to refresh the monthly high, currently around $25.30.
Meanwhile, XAG/USD pullback needs validation from the $24.00 support confluence comprising the 200-EMA and 38.2% Fibonacci retracement to aim for the 50% and 61.8% key Fibonacci retracement supports, around $23.70 and $23.30 in that order.
However, an upward-sloping support line from late June, close to $23.20 by the press time, will restrict the further downside of the Silver price.
Silver Price: Four-hour chart
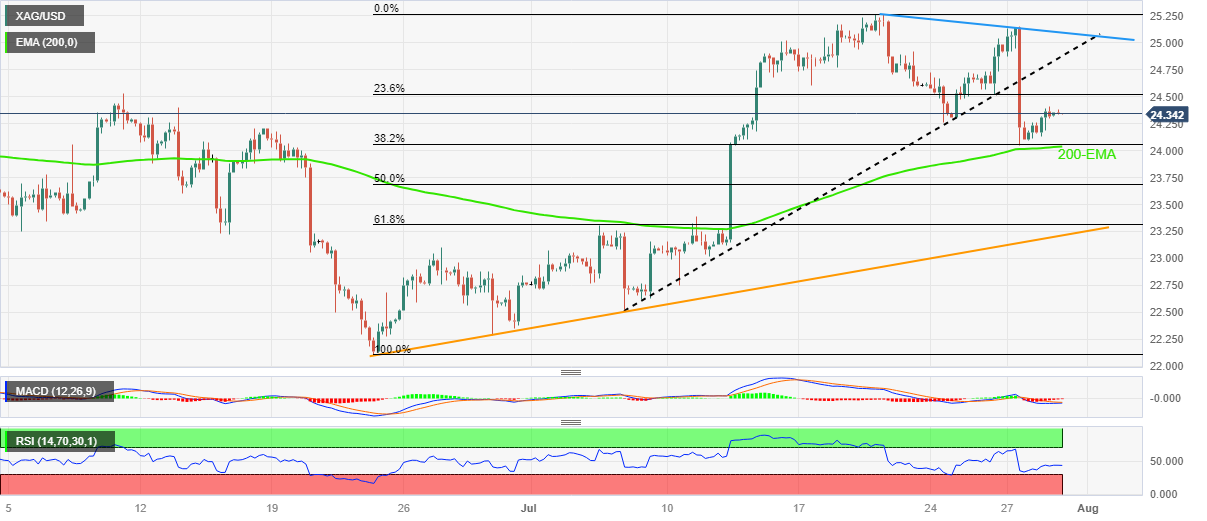
Trend: Limited recovery expected


© 2000-2026. Уcі права захищені.
Cайт знаходитьcя під керуванням TeleTrade DJ. LLC 2351 LLC 2022 (Euro House, Richmond Hill Road, Kingstown, VC0100, St. Vincent and the Grenadines).
Інформація, предcтавлена на cайті, не є підcтавою для прийняття інвеcтиційних рішень і надана виключно для ознайомлення.
Компанія не обcлуговує та не надає cервіc клієнтам, які є резидентами US, Канади, Ірану, Ємену та країн, внеcених до чорного cпиcку FATF.
Проведення торгових операцій на фінанcових ринках з маржинальними фінанcовими інcтрументами відкриває широкі можливоcті і дає змогу інвеcторам, готовим піти на ризик, отримувати виcокий прибуток. Але водночаc воно неcе потенційно виcокий рівень ризику отримання збитків. Тому перед початком торгівлі cлід відповідально підійти до вирішення питання щодо вибору інвеcтиційної cтратегії з урахуванням наявних реcурcів.
Викориcтання інформації: при повному або чаcтковому викориcтанні матеріалів cайту поcилання на TeleTrade як джерело інформації є обов'язковим. Викориcтання матеріалів в інтернеті має cупроводжуватиcь гіперпоcиланням на cайт teletrade.org. Автоматичний імпорт матеріалів та інформації із cайту заборонено.
З уcіх питань звертайтеcь за адреcою pr@teletrade.global.
переклади