- Аналітика
- Новини та інструменти
- Новини ринків
Новини ринків
- USD/JPY has shown a sharp decline to near 139.00 amid weakness in the USD Index.
- A collaboration of upbeat US Employment and job market data would leave no reason for the Fed to a neutral policy consideration.
- BoJ Ueda confirmed that bond-buying operations by the central bank would continue in order to keep inflation steadily above 2%.
The USD/JPY pair has witnessed an intense sell-off and has dropped to near 139.00 in the Asian session. The asset attracted significant offers as the US Dollar Index (DXY) extended its downside below 104.20. The USD Index has dropped to near 104.15 as investors are optimistic that US debt-ceiling proposal would secure sufficient votes.
S&P500 futures have posted some gains in early Asia after a bearish Wednesday. The risk appetite of the market participants has improved amid a drop in appeal for the USD Index.
On Wednesday, US JOLTS Job Openings data outperformed expectations. Despite higher interest rates from the Federal Reserve (Fed) and tight credit conditions by US regional banks, the US job market seems healthy.
Going forward, the US Nonfarm Payrolls (NFP) data (May) will be of utmost importance. As per the preliminary report, fresh 190K payrolls were added in the labor market in May, lower than the additions of 253K made in April. The Unemployment Rate is increased to 3.5% vs. the former release of 3.4%. Annual Average Hourly Earnings are seen steady at 4.4%.
A collaboration of better-than-anticipated US Employment and job market data would leave no reason for Fed chair Jerome Powell for a neutral interest rate policy consideration.
On the Japanese Yen front, Bank of Japan (BoJ) Governor Kazuo Ueda has confirmed that bond-buying operations by the central bank would continue in order to keep inflation steadily above 2%.
About USD/JPY’s outlook, Economists at MUFG Bank believe that “The debt ceiling issue has been resolved and a strong jobs report at the end of the week would likely see markets price more fully a Fed rate hike on 13th June that would likely then lead to further USD/JPY buying.”
“If events fuel another quick move to the 145 level, above there would certainly be in the range of intervention. It would in addition serve to highlight another unwelcome by-product of YCC and could play a role in swaying Governor Ueda to scrap YCC later this year.”
- Gold price remains on the front foot amid improvement in risk, US Dollar’s retreat.
- Easing fears of United States default, hopes of pause in Federal Reserve’s rate hike trajectory underpin XAU/USD demand.
- Uncertainty about US debt ceiling bill’s passage, market’s hawkish Fed bets weigh on the Gold Price amid mixed US data.
- US ADP Employment Change, PMI and US politics eyed for clear XAU/USD directions.
Gold Price (XAU/USD) picks up bids to refresh intraday high near $1,967 amid the early hours of Thursday’s Asian session as the US Dollar’s retreat joins hopes of the United States debt-ceiling bill’s passage through the House of Representatives. Adding strength to the XAU/USD upside could be the latest shift in the Federal Reserve (Fed) bias amid mixed data and unimpressive comments from the policymakers. Even so, the Gold buyers need validation from today's US ADP Employment Change for May, known as the early signal for Friday’s Nonfarm Payrolls (NFP), as well as from the multiple Purchasing Managers’ Indexes for the previous month.
Gold Price cheers United States debt ceiling optimism
Gold Price benefits from the receding fears of the United States default as some of the prominent US policymakers recently backed hopes of the US debt-ceiling bill’s passage through the House of Representatives during its vote at 00:30 GMT on Thursday.
Late on Wednesday, Republican leader Mitch McConnell conveyed expectations of the US debt ceiling bill passing and reaching the Senate on Thursday. The policymaker’s comments become the key for the debt-limit extension as Republicans control the House where the bill is currently discussed.
“A bill to suspend the U.S. government's $31.4 trillion debt ceiling and avert a disastrous default cleared a key procedural hurdle in the House of Representatives on Wednesday, setting the stage for a vote on the bipartisan debt deal itself,” said Reuters as the debate on the debt-ceiling bill began.
While the receding expectations of the US default underpin the Gold price upside, there are hardline Republicans like Chip Roy and Rand Paul who can delay the much-awaited announcements and can trigger the market’s risk-off mood. The same keeps the Gold buyers on their toes.
Federal Reserve hawks’ retreat, mixed US data also favor XAU/USD bulls
Apart from the hopes that the United States will be able to push back the default concerns, the recently mixed US data and comments suggesting a pause in the Federal Reserve’s (Fed) rate hike trajectory seem to also allow the Gold buyers to remain positive of late.
On Wednesday, US JOLTS Job Openings rose to 10.103M in April versus 9.375M expected and 9.745M prior whereas Chicago Purchasing Managers’ Index dropped to 40.4 for May from 48.6 prior and 47.0 market forecasts. Earlier in the week, the US consumer sentiment gauge improved but the details were unimpressive, which in turn teases the Gold buyers.
Considering the mixed data, Federal Reserve (Fed) Governor Michelle Bowman cited recovery in the residential real estate market while also adding, “The leveling out of home prices will have implications for the Fed's fight to lower inflation,” per Reuters. Before him, Cleveland Fed President Loretta Mester suggested that the Fed must go for a rate hike in June. Additionally, Fed Governor and vice chair nominee Philip Jefferson said that skipping a rate hike would allow the Fed "to see more data before making decisions about the extent of additional policy firming,” per Reuters. On the same line was Federal Reserve Bank of Philadelphia President Patrick Harker who also said on Wednesday that he is inclined to support a "skip" in interest rate hikes at the central bank's next meeting in June.
While justifying the same, Wall Street Journal’s (WSJ) Nick Timiraos signaled that Federal Open Market Committee (FOMC) is likely to hold interest rates steady in June, which in turn propel the XAU/USD price.
US data, risk catalysts are the key for Gold price
Moving on, the US House of Representatives is debating the US debt ceiling extension and will vote on it at around 00:30 GMT, which will be key to watching for clear directions of the Gold price. Should the policymakers manage to push the much-awaited bill towards the Senate voting on Thursday, they may be able to avoid the ‘disastrous’ US default, which in turn can allow the XAU/USD to remain firmer.
Additionally, early signals for Friday’s United States Nonfarm Payrolls (NFP) will decorate the calendar and hence will be crucial for the Gold Price watchers to observe. Among them, the ADP Employment Change, ISM Manufacturing PMI and S&P Global PMIs for May will be crucial to watch.
Also read: US ADP Employment, ISM Manufacturing PMI Preview: First down, then up for US Dollar?
Gold price technical analysis
Gold price justifies recovery from an 11-week-old horizontal support area, as well as an upside break of a descending trend line from early May, while bracing for the first weekly gain in three.
That said, the XAU/USD’s upside also takes clues from the Moving Average Convergence and Divergence (MACD) indicator’s bullish signals and the upbeat Relative Strength Index (RSI) line, placed at 14.
However, the RSI is quickly approaching the overbought territory and hence highlights a fortnight-long horizontal resistance zone surrounding $1,985 as the short-term key hurdle.
Following that, the 200-Simple Moving Average (SMA) level of around $1,992 and the $2,000 round figure can prod the Gold price upside before giving back control to the bulls.
On the contrary, XAU/USD pullback needs validation from the resistance-turned-support line stretched from May 03, close to $1,945 at the latest.
Even so, the previously stated horizontal support zone around $1,935-33 may challenge the Gold bears before welcoming them.
To sum up, the Gold price remains on the front foot but the road towards the north appears long and bumpy.
Gold price: Four-hour chart
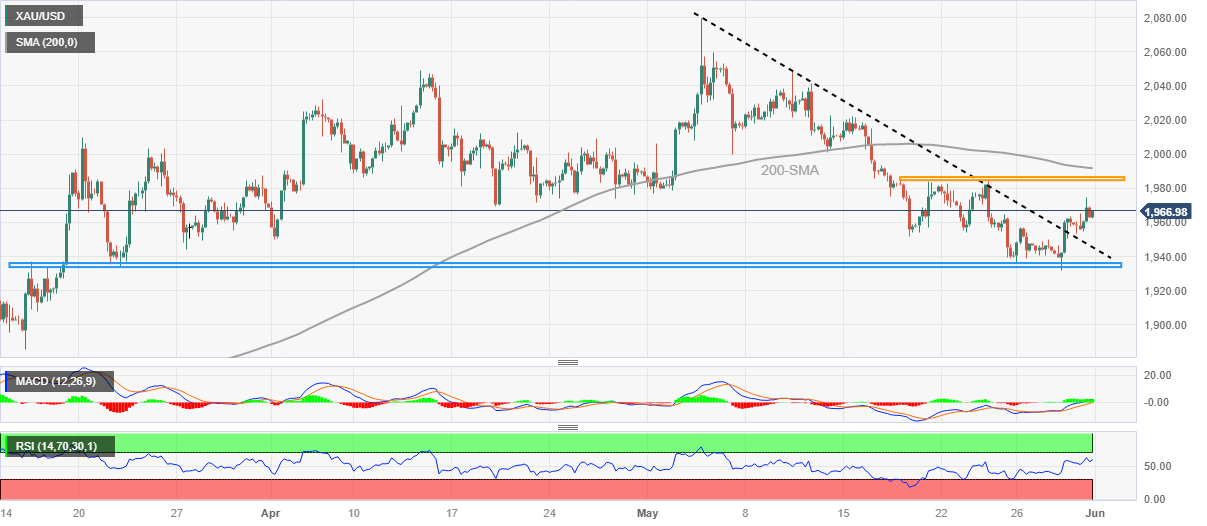
Trend: Further upside expected
- The oil price is gauged intermediate support around $67.50, however, the downside seems favored as Fed to raise rates further.
- A sharp decline in China’s factory activity indicated a bleak outlook for oil demand.
- OPEC meeting will remain in focus as oil-producing nations are expected to announce more supply cuts to support energy prices.
West Texas Intermediate (WTI), futures on NYMEX, have gauged intermediate support around $67.50 in the Asian session. The pullback move in the oil price to near $69.50 was capitalized by the market participants as a selling opportunity amid multiple bearish catalysts.
As United States consumer spending turned out to be resilient in April and their labor market conditions are still healthy, it seems that the Federal Reserve (Fed) is preparing for a fresh rate hike despite announcing that more rate hikes are less certain amid tight credit conditions by the US regional banks. Further monetary policy tightening by the Fed would deepen hopes of a recession in the US economy, which will have a significant impact on the oil demand.
On Wednesday, a sharp decline in China’s factory activity displayed a bleak outlook for oil demand. China’s National Bureau of Statistics (NBS) reported Manufacturing PMI at 48.8, lower than the estimates of 49.4 and the former release of 49.2. A figure below 50.0 is itself considered a contraction. It is worth mentioning that China is the largest importer of oil in the world and weak economic activities in China would have a significant impact on the oil price.
Meanwhile, the US Dollar Index (DXY) has found some cushion near 104.20 ahead of the US Employment data, which will provide guidance about the Fed’s interest rate policy.
Later this weekend, the OPEC meeting will remain in focus as oil-producing nations are expected to announce more supply cuts to support energy prices. Tensions between Russia and Saudi Arabia have remained elevated as the former has disrespected the pledge and pumping cheap oil into the global economy. The notion of production cuts by OPEC+ could be faded if Moscow continues to deliver oil at cheaper rates.
Regarding oil outlook, economists at Rabobank cited “Right now, we see OPEC+ staying the course and continuing the April cuts of 1.6m bpd. The surprise April cut boosted prices by $5-$7 for about three weeks. A second cut would display their fears more openly and indicates greater weakness; we construe a second cut as a bearish signal unless the cuts are extremely substantive.”
Going forward, oil inventory data for the week ending May 26 by the US Energy Information Administration (EIA) will be keenly watched. Investors should note that US American Petroleum Institute (API) reported a build-up of oil stockpiles on Tuesday by 5.202M barrels.
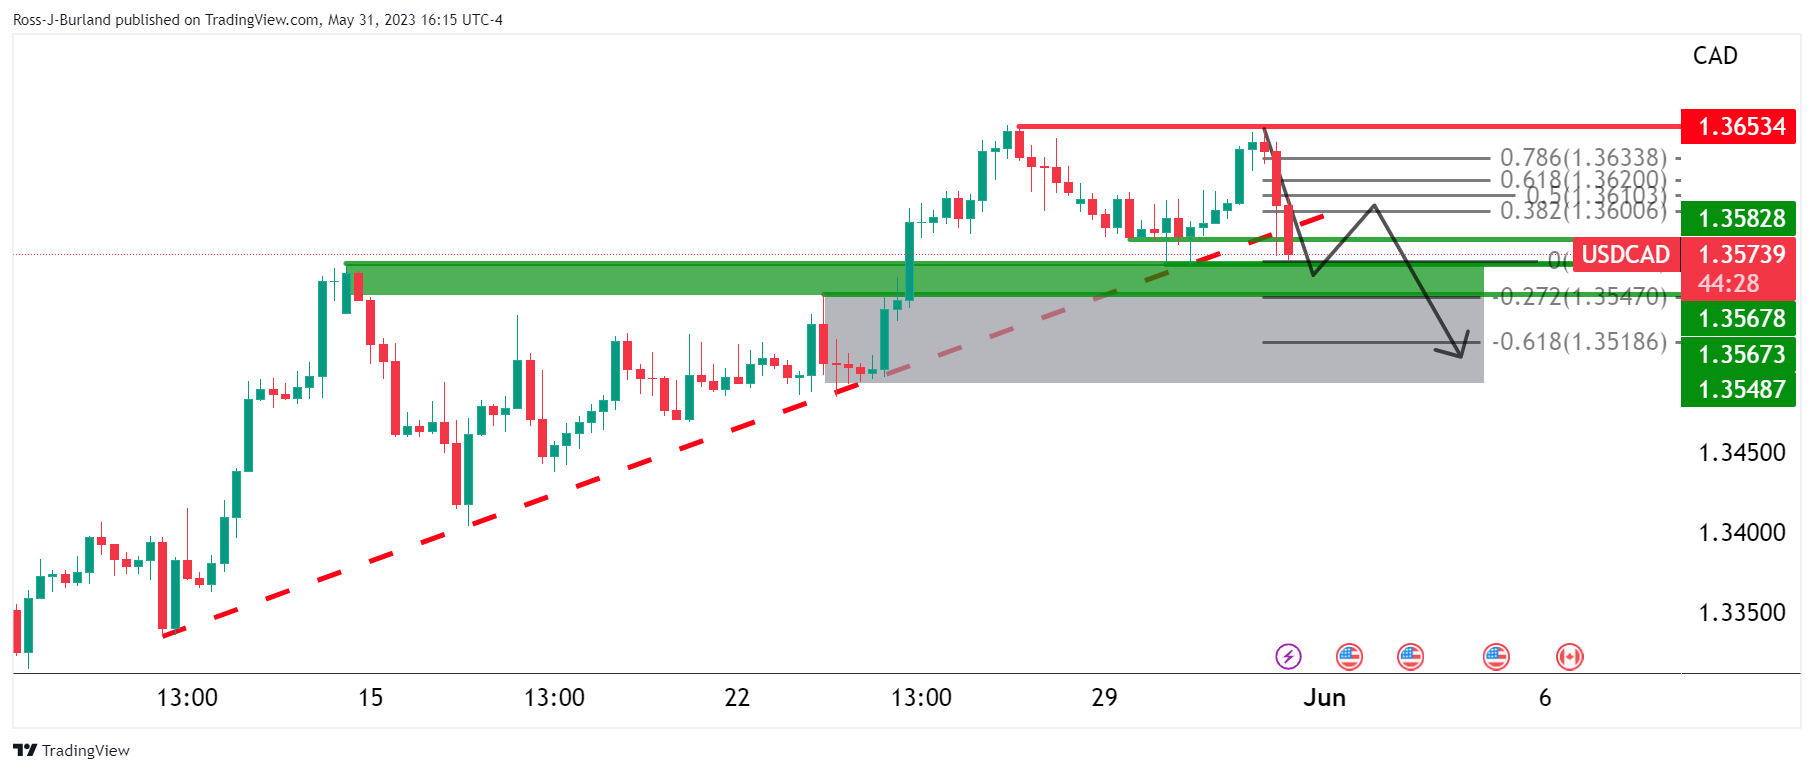
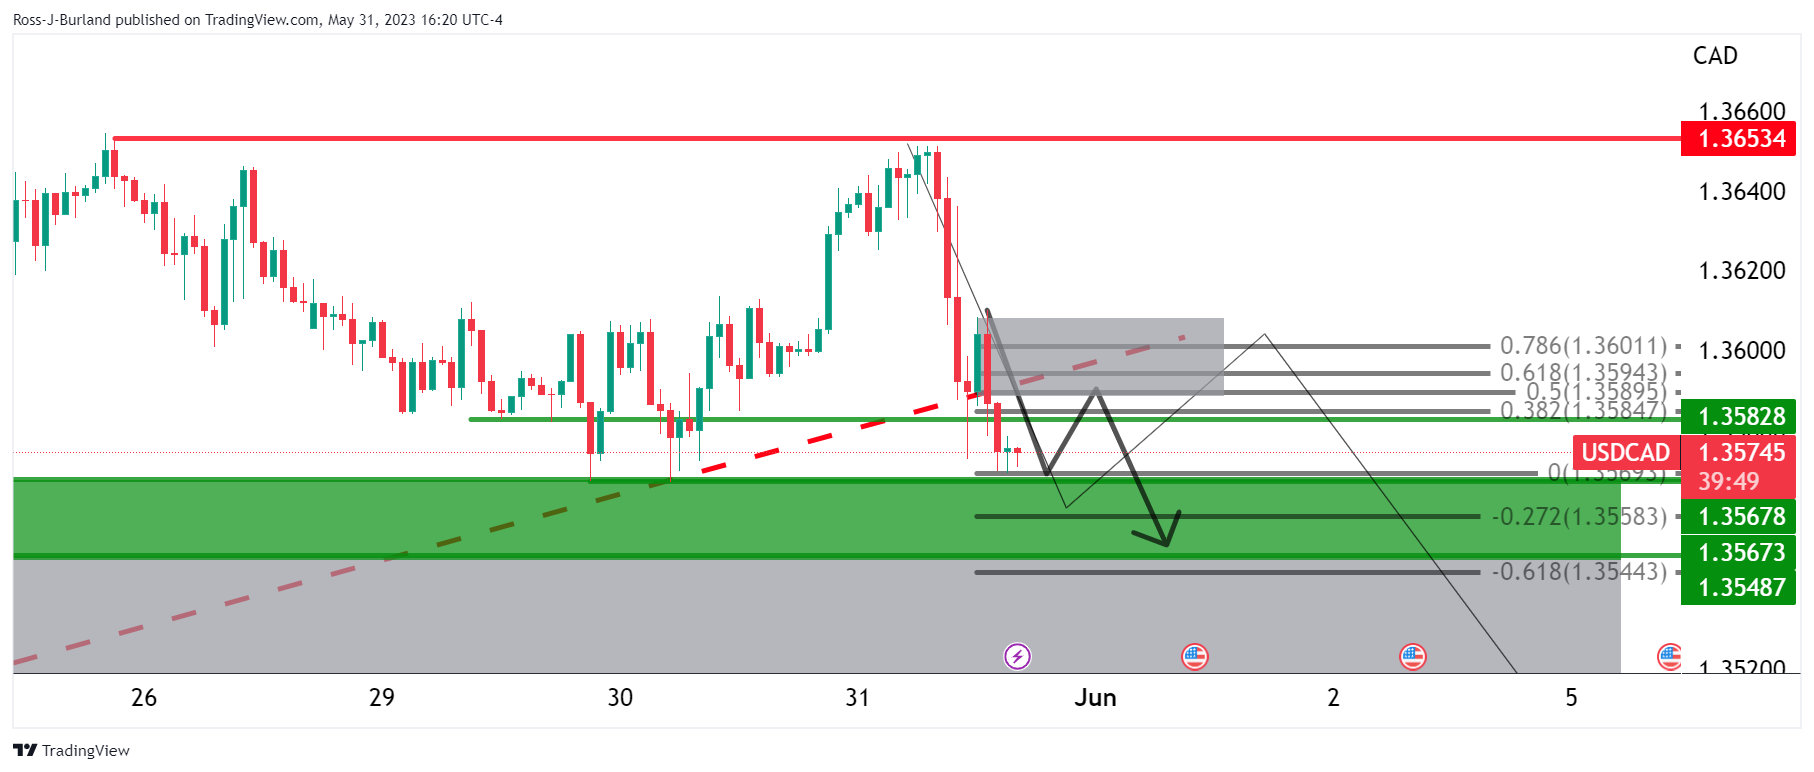
USD/CAD takes offers to refresh the intraday low near 1.3560 amid the early hours of Thursday’s Asian session. In doing so, the Loonie pair takes clues from the options market, as well as the latest retreat in the US Dollar, ahead of a slew of top-tier data and events from the US.
One-month Risk Reversal (RR) of the USD/CAD pair, a measure of the spread between call and put prices, dropped the most in a month by the end of Wednesday’s Asian session. That said, the RR dropped to -0.093 in its latest readings per the options market data from Reuters.
Not only on a daily basis, but the monthly RR also flashed red marks with a -0.110 figure whereas the weekly numbers pleased the USD/CAD sellers with a -0.093 level.
Additionally, the upbeat Canadian GDP and the latest shift in the Federal Reserve (Fed) officials’ push for a pause in the rate hike trajectory, as well as hopes that members of the US House of Representatives will support the debt ceiling bill’s passage, also weigh on the pair.
Also read: USD/CAD Price Analysis: Bears are in the market, but bulls flexing
- US Dollar Index retreats from the highest levels in 11 weeks.
- Positive expectations about US debt ceiling bill, mixed US data weigh on DXY.
- Recent Fed talks suggest pain for hawks as June rate hike concerns pushed back.
- US House of Representatives voting on debt ceiling bill, ADP Employment Change and PMIs eyed.
US Dollar Index (DXY) remains sidelined after retreating from the highest levels since mid-March 2023 amid early Thursday morning in Asia. The DXY initially rose to the highest levels since March 15 before retreating from 104.70 by the end of Wednesday’s North American trading session.
In doing so, the greenback’s gauge versus the six major currencies justifies the latest shift in the Federal Reserve (Fed) officials’ push for a pause in the rate hike trajectory, as well as hopes that members of the US House of Representatives will support the debt ceiling bill’s passage.
That said, the hope of US debt ceiling passage from the House of Representatives increased after US Senate Republican Leader McConnell conveyed expectations of the US debt ceiling bill passing and reaching the Senate on Thursday.
On the other hand, US JOLTS Job Openings rose to 10.103M in April versus 9.375M expected and 9.745M prior whereas Chicago Purchasing Managers’ Index dropped to 40.4 for May from 48.6 prior and 47.0 market forecasts.
The mixed US data allowed the Federal Reserve (Fed) officials to retreat from the previously hawkish bias and weighed on the US Dollar late Wednesday. That said, Federal Reserve (Fed) Governor Michelle Bowman cited recovery in the residential real estate market while also adding, “The leveling out of home prices will have implications for the Fed's fight to lower inflation,” per Reuters. Before him, Clevland Fed President Loretta Mester suggested that the Fed must go for a rate hike in June.
Additionally, Fed Governor and vice chair nominee Philip Jefferson said that skipping a rate hike would allow the Fed "to see more data before making decisions about the extent of additional policy firming,” per Reuters. On the same line was Federal Reserve Bank of Philadelphia President Patrick Harker who also said on Wednesday that he is inclined to support a "skip" in interest rate hikes at the central bank's next meeting in June.
While justifying the same, Wall Street Journal’s (WSJ) Nick Timiraos signaled that Federal Open Market Committee (FOMC) is likely to hold interest rates steady in June.
Against this backdrop, Wall Street closed with minor losses and the yields were down while the US Dollar Index (DXY) ended Wednesday’s North American trading on the positive side despite the latest retreat.
Looking ahead, the US House of Representatives is debating the US debt ceiling extension and will vote on it at around 00:30 GMT, which will be key to watch ahead of a slew of the US employment and activity data.
Also read: US ADP Employment, ISM Manufacturing PMI Preview: First down, then up for US Dollar?
Technical analysis
US Dollar Index (DXY) bulls need a sustained upside break of a downward-sloping resistance line from late November 2022, close to 104.20 by the press time, to lure the DXY bulls.
- USD/CHF is oscillating above 0.9100 as the USD Index has gauged an intermediate cushion around 104.20.
- Fed’s interest rates are already above 5% and effectively weighing on firms in augmenting fixed and working capital requirements.
- Retail demand by Swiss households has sharply contracted due to the burden of a higher cost of living.
The USD/CHF pair is demonstrating a back-and-forth action above the round-level support of 0.9100 in the Asian session. The Swiss Franc asset has turned sideways as investors are awaiting the release of the United States Employment data.
S&P500 witnessed selling pressure amid rising expectations of one more interest rate hike from the Federal Reserve (Fed). Interest rates are already above 5% and effectively weighing on firms in augmenting fixed and working capital requirements and an escalation in already restrictive policy would weigh more pressure on firms.
The US Dollar Index (DXY) displayed a vertical sell-off from 104.70 as Republican leaders are confident that the US debt-ceiling bill will get passage in Congress. This has led to a sheer decline in US Treasury yields. The yields offered on 10-year US government bonds have dropped below 3.65%.
On Thursday, US Automatic Data Processing (ADP) Employment Change (May) will remain in the spotlight. As per the expectations, the US economy added fresh 170K personnel in the labor market lower than the prior addition of 296K. Currently, labor market conditions are pretty decent and are supporting one more interest rate hike from the Fed.
Apart from the US Employment data, US ISM Manufacturing PMI (May) will be in focus. The economic data is expected to soften marginally to 47.0 vs. the former release of 47.1. While the New Orders Index that indicates forward demand is expected to drop to 44.9 from the prior release of 45.7.
On the Swiss Franc front, annual Real Retail Sales (April) contracted significantly by 3.7% while the street was anticipating a contraction of 1.4%, and previous data was contracted by 1.9%. A sharp decline in retail demand by households due to the burden of a higher cost of living could force the Swiss National Bank (SNB) to go light on interest rates.
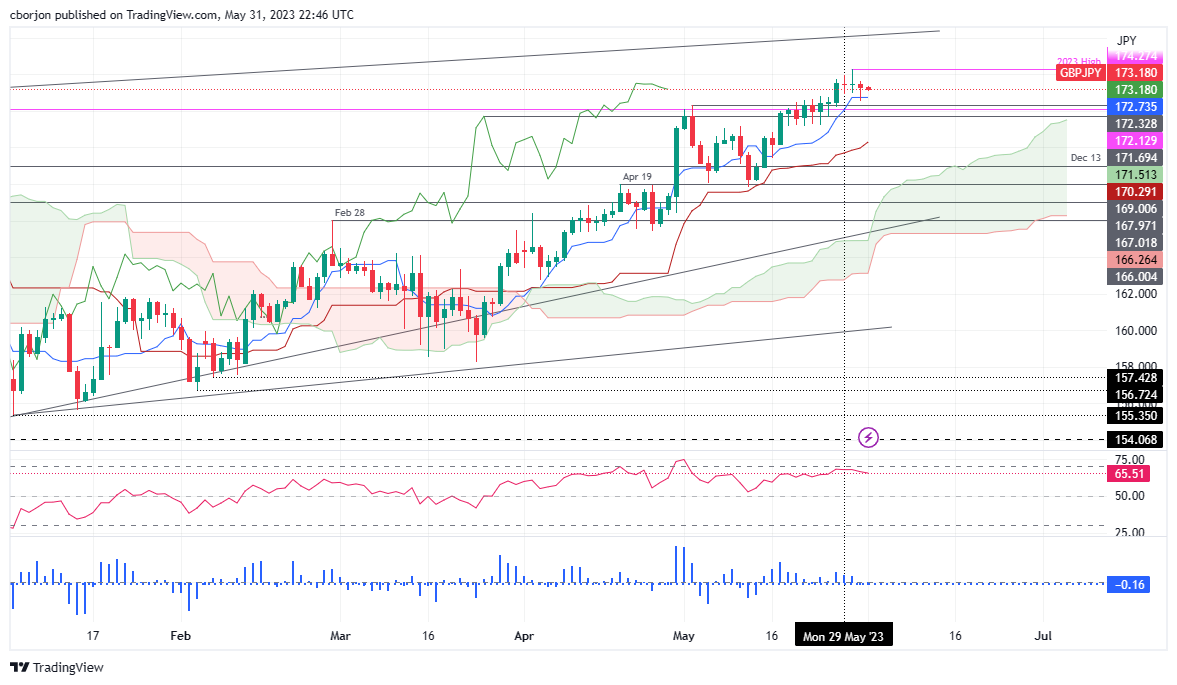
- GBP/JPY remains unchanged mainly but sustains its bullish bias, ending Wednesday’s session at 173.30 after a dip to 172.51.
- Candlestick patterns hint at a potential decline, pending confirmation with a close below the Tenkan-line.
- The RSI and 3-day RoC suggest a sustained upward trend, highlighting critical levels for price shifts.
GBP/JPY ended Wednesday’s session almost flat after traveling from its daily low/high of 172.51-173.64. However, as the Asian session begins, the GBP/JPY floats around 173.24, unchanged but maintaining its bullish bias.
GBP/JPY Price Analysis: Technical outlook
The GBP/JPY remains upward biased, per the daily chart, but it could have dipped lower. Thankfully, the Tenkan-Sen level at 172.73, which briefly pierced, opened the door for a GBP/JPY dip toward a new weekly low of 172.51 but acted as support as the GBP/JPY bounced off that price level, closing Wednesday’s session at 173.30.
During the last three days, the GBP/JPY candlestick chart portrays two dojis, followed by one hanging-man, suggesting further downside is expected. But, the GBP/JPY must achieve a daily close below the Tenkan-line. A breach of the latter will expose the May 2 daily high shifted support at 172.33 before reaching the Chikou-Span peak of March 27 at 171.69. Once cleared, the GBP/JPY can fall toward the Kijun-Sen at 170.29.
Conversely, for a GBP/JPY bullish continuation, the cross needs to conquer the 174.00 mark. Clearance of that level could pave the way to test the YTD high of 174.24 before opening the door to the 2016 high of 177.37.
Oscillators like the Relative Strength Index (RSI) indicator and the 3-day Rate of Change (RoC) warrant further upside expected. Therefore, the trend I set to continue upward.
GBP/JPY Price Action – Daily chart
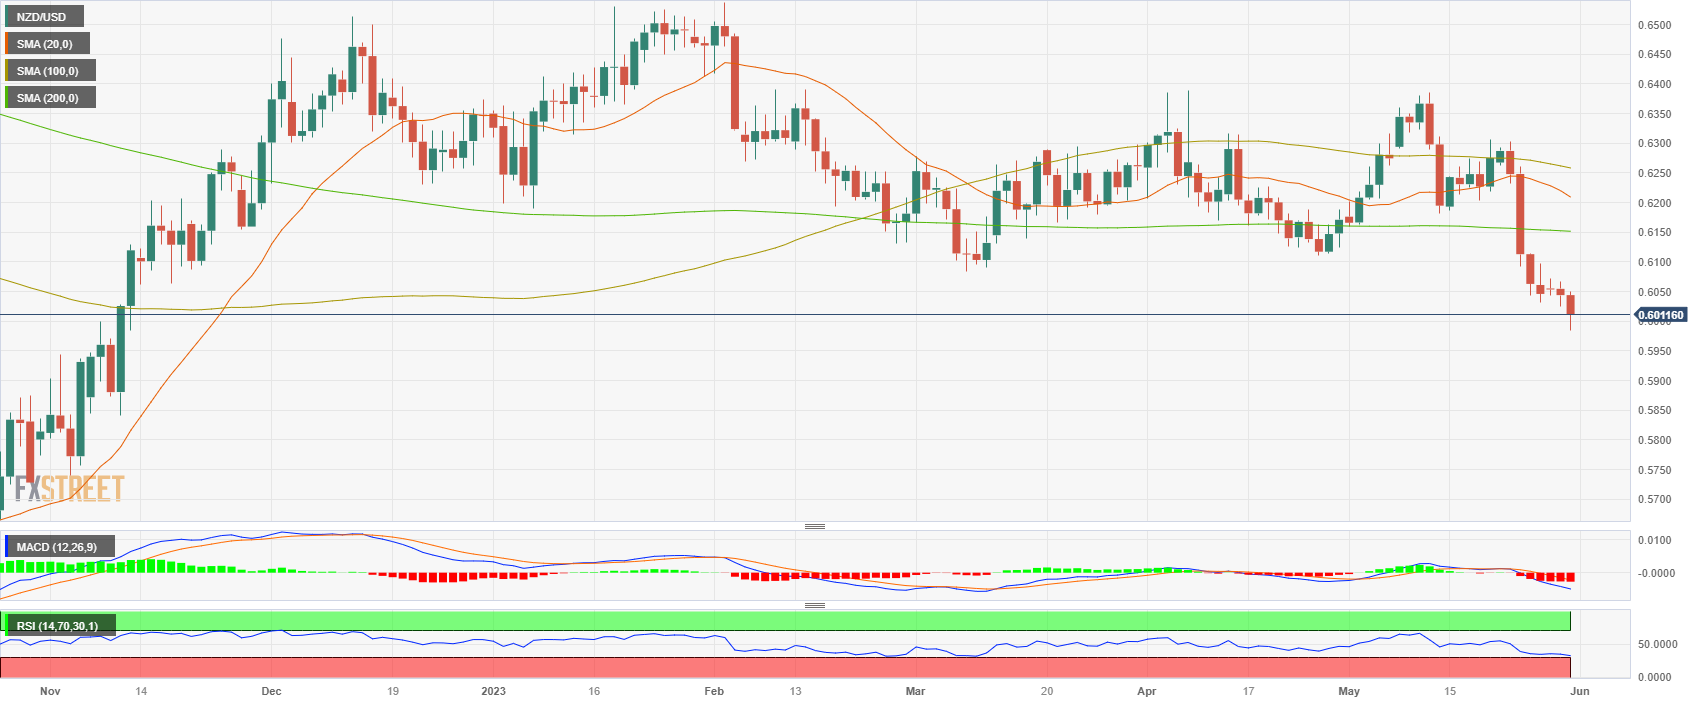
- NZD/USD fades bounce off three-month-old descending support line, stays pressured at the lowest levels since November 2022.
- Oversold RSI backs corrective bounce off the key support but bearish MACD signals turn down recovery hopes.
- Convergence of 200-DMA, 38.2% Fibonacci retracement restricts short-term upside.
- US ADP Employment Change, multiple PMIs eyed for clear directions.
NZD/USD fades bounce off a three-month-old key support line while dropping back to 0.6015 during early Thursday in Asia.
In doing so, the Kiwi pair justifies the bearish MACD signals to extend the previous week’s downside break of the 200-DMA while keeping the bears in the driver’s seat at the lowest levels in seven months. It’s worth noting, however, that the RSI (14) line is almost oversold and hence can offer intermediate bounces during the south-run.
With this, the NZD/USD price may again test the aforementioned support line stretched from March, close to 0.5980 by the press time. However, the quote’s further downside appears elusive.
In a case where the Kiwi pair breaks the stated support line, it can quickly drop to the 61.8% Fibonacci retracement level of October 2022 to February 2023 upside, near 0.5900.
On the other hand, recovery remains unimpressive below an upward-sloping previous support line from mid-November 2022, surrounding 0.6100.
Even so, the NZD/USD pair buyers remain off the table unless witnessing a daily closing beyond a convergence of the 200-DMA and 38.2% Fibonacci retracement, near 0.6150.
NZD/USD: Daily chart
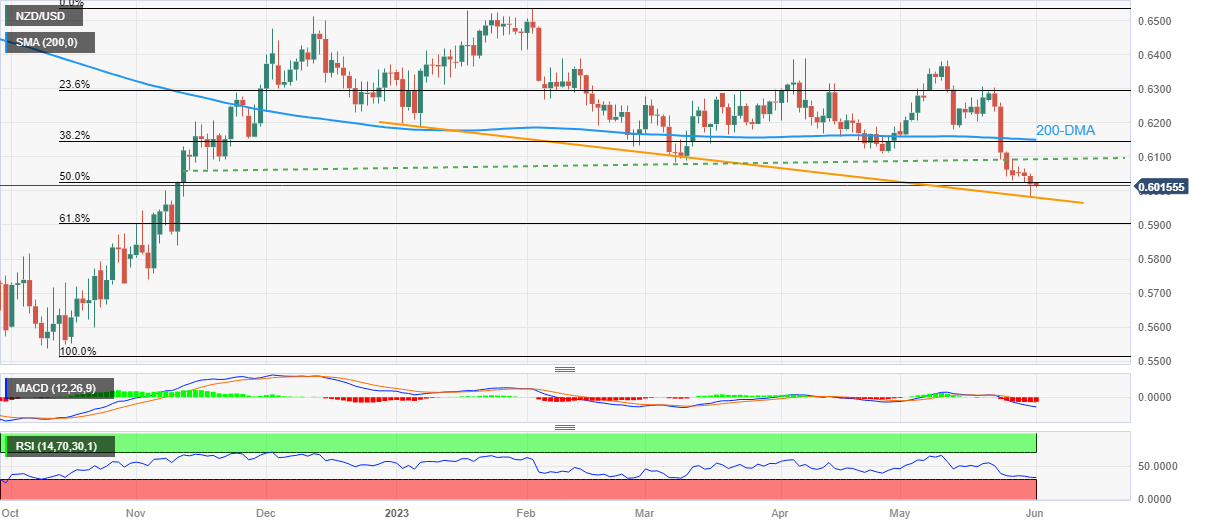
Trend: Limited downside expected
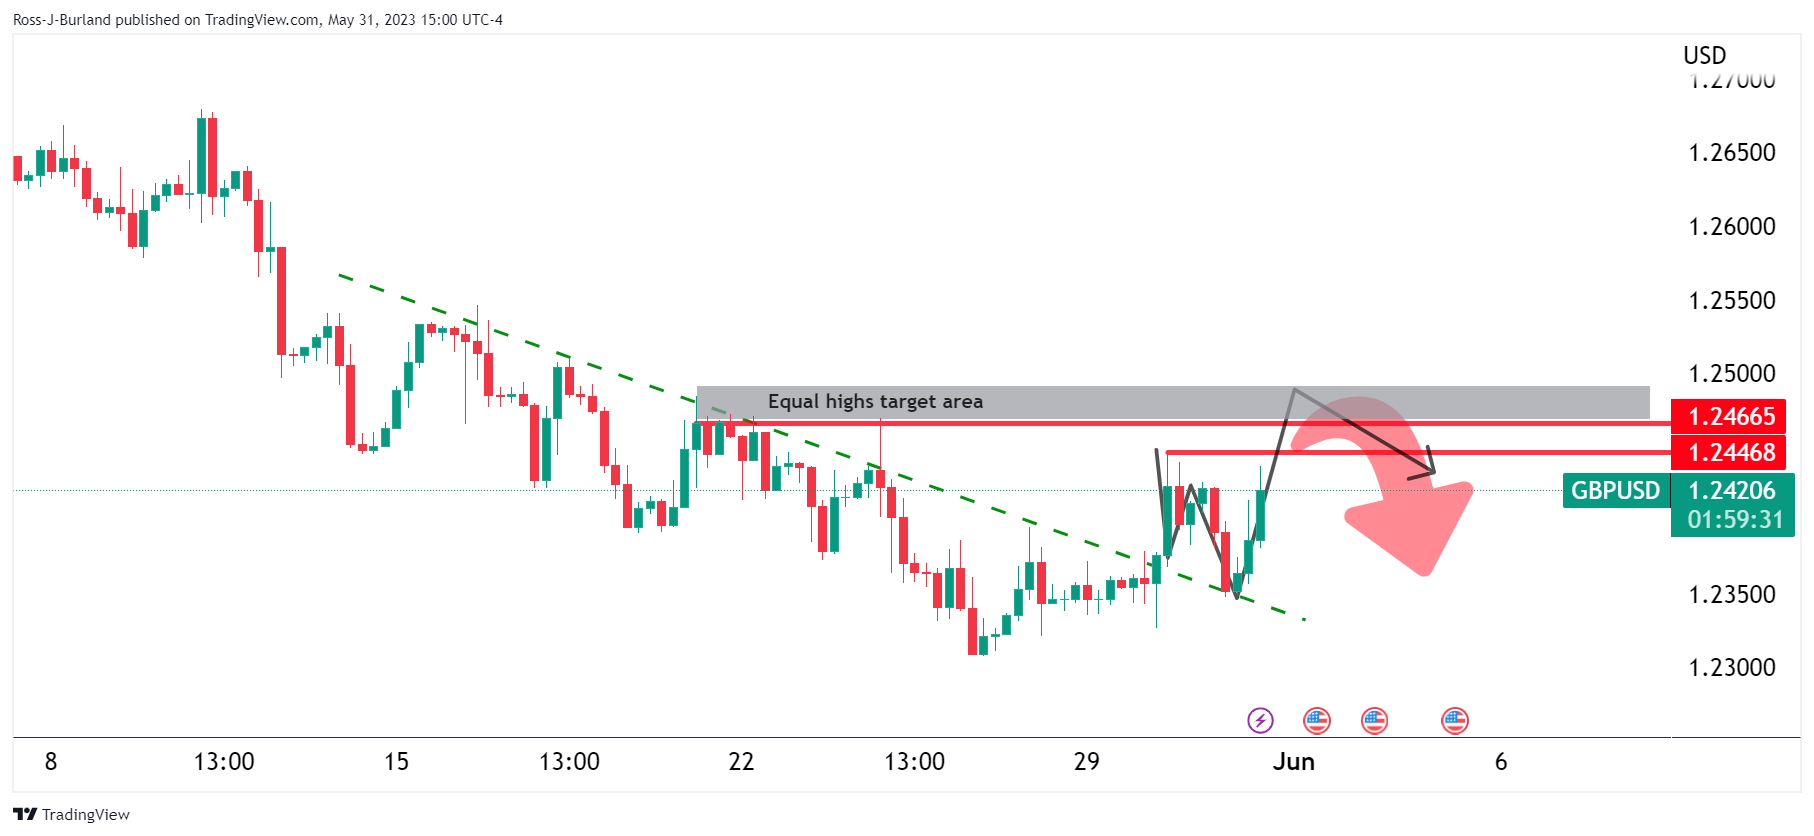
- GBP/USD grinds higher at weekly top after four-day uptrend.
- Recent data, BoE talks underpin concerns of UK’s sticky inflation, suggest more rate lifts from “Old Lady”.
- Hopes of debt ceiling deal passage in US House, mixed US data prod US Dollar bulls after refreshing DXY peak.
- US ADP Employment Change, PMIs in focus for clear directions.
GBP/USD bulls stay in the driver’s seat for the fifth consecutive day, despite the Asian-session latest inaction around 1.2440 during early Thursday. In doing so, the Cable pair not only cheers the latest retreat of the US Dollar but also benefits from the hints that the UK’s inflation problem is bigger and can push the Bank of England (BoE) towards more rate hikes.
On Wednesday, Lloyds Bank unveiled monthly releases of its business sentiment gauge and inflation signals for May. On the same line, Bank of England (BoE) Monetary Policy Committee member Catherine Mann said that the gap between the headline and core inflation in the UK is more persistent than in the US and the Euro area, per Reuters.
On the other hand, the US Dollar Index (DXY) initially rose to the highest levels since March 15 before retreating from 104.70. The greenback’s latest pullback could be linked to the recently mixed US data and receding fears that the US will default on its government debt payment.
The hope of US debt ceiling passage from the House of Representatives increased after US Senate Republican Leader McConnell conveyed expectations of the US debt ceiling bill passing and reaching the Senate on Thursday.
Elsewhere, US JOLTS Job Openings rose to 10.103M in April versus 9.375M expected and 9.745M prior whereas Chicago Purchasing Managers’ Index dropped to 40.4 for May from 48.6 prior and 47.0 market forecasts.
It should be noted that the mixed comments from the Federal Reserve (Fed) officials also weighed on the US Dollar late Wednesday. That said, Federal Reserve (Fed) Governor Michelle Bowman cited recovery in the residential real estate market while also adding, “The leveling out of home prices will have implications for the Fed's fight to lower inflation,” per Reuters. Before him, Clevland Fed President Loretta Mester suggested that the Fed must go for a rate hike in June.
Furthermore, Fed Governor and vice chair nominee Philip Jefferson said that skipping a rate hike would allow the Fed "to see more data before making decisions about the extent of additional policy firming,” per Reuters. On the same line was Federal Reserve Bank of Philadelphia President Patrick Harker who also said on Wednesday that he is inclined to support a "skip" in interest rate hikes at the central bank's next meeting in June.
With this in mind, Wall Street Journal’s (WSJ) Nick Timiraos signaled that Federal Open Market Committee (FOMC) is likely to hold interest rates steady in June.
Amid these plays, Wall Street closed with minor losses and the yields were down while the US Dollar Index (DXY) ended Wednesday’s North American trading on the positive side despite the latest retreat.
Moving on, the US House of Representatives is debating the US debt ceiling extension and will vote on it at around 00:30 GMT, which will be key to watch ahead of a slew of the US employment and activity data.
Also read: US ADP Employment, ISM Manufacturing PMI Preview: First down, then up for US Dollar?
Technical analysis
Despite the GBP/USD pair’s successful recovery from the 100-DMA support of around 1.2300, the buyers need validation from the 50-DMA hurdle of near 1.2450.
- EUR/USD is marching towards 1.0700 amid a sell-off in the USD index.
- S&P500 remained in a bearish trajectory amid a cautious market mood ahead of the US Employment data.
- The collective efforts of softening inflation in Germany, Spain, and France would also impact Eurozone inflationary pressures.
The EUR/USD pair is marching towards the round-level resistance of 1.0700 in the early Toyo session. The major currency pair showed a sharp recovery from 1.0640 on Wednesday after the US Dollar Index (DXY) faced intense selling pressure post refreshing a 10-week high at 104.70. The USD Index has dropped to near 104.23 and is looking vulnerable above the immediate support.
S&P500 remained in a bearish trajectory on Wednesday amid a cautious market mood ahead of the United States Employment data. Investors are worried that healthy US labor conditions would strengthen the odds of one more interest rate hike from the Federal Reserve (Fed), which could push the US economy further toward a recession.
US JOLTS Job Openings data beat estimates with a decent margin. The economic data landed at 10.103M, higher than the estimates of 9.375M and the former release of 9.745M. Kathy Jones, chief fixed income strategist at Charles Schwab, said in a tweet that job openings numbers indicate that "the job market is still healthy."
On Wednesday, Cleveland Federal Reserve Bank President, Loretta Mester, in an interview with Financial Times, cited “I don’t really see a compelling reason to pause — meaning wait until you get more evidence to decide what to do.”
Meanwhile, the Euro showed an impressive recovery despite a sheer slowdown in German inflation. The preliminary German Harmonized Index of Consumer Prices (HICP) surprisingly softened to 6.3% vs. the estimates of 6.8% and the former release of 7.6%. Monthly HICP showed a deflation of 0.2% which infused confidence among European Central Bank (ECB) policymakers that the restrictive monetary policy is dignifying its job effectively.
Investors should note that inflationary pressures in Spain and France have also softened well than expectations, which indicates that the preliminary Eurozone HICP will also show a decent pace of decline.
However, ECB President Christine Lagarde has already cleared that more interest rate hikes are in the pipeline to contain stubborn Eurozone inflation.
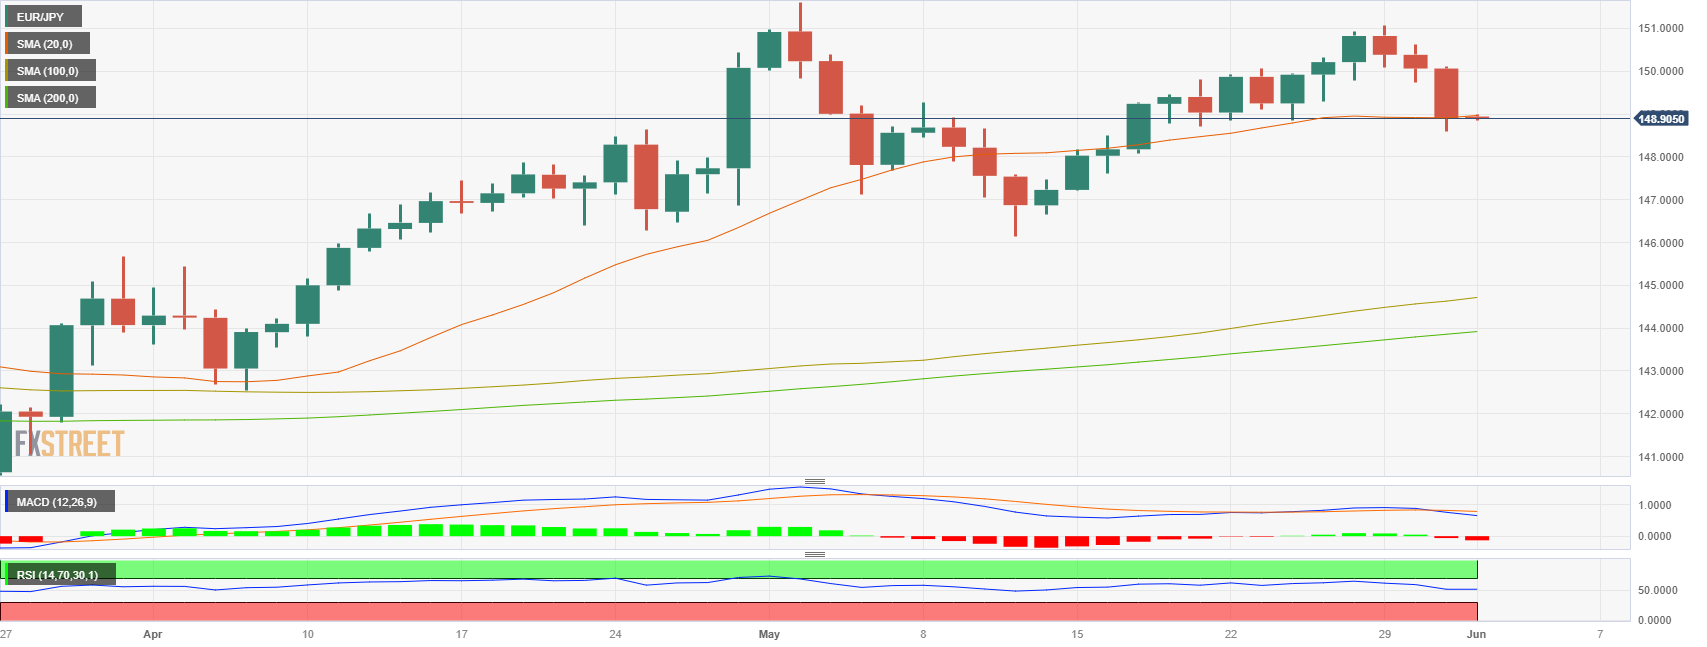
- The EUR/JPY fell to the 148.88 area to test the 20-day SMA
- Weak inflation figures from European countries weigh on the Euro amid falling German yields
- Yen’s gains remain capped by lower Japanese yields
The EUR/JPY fell to its lowest level since May 17 as weak inflation figures released by Germany and Spain from May made the Euro bulls lose interest in Wednesday's session. On the other hand, the latest Japanese economic data released in the early Asian session came in weak, limiting the Yen’s upside potential.
German yields decline amid weak Japanese economic data
The May data for the German Harmonized Index of Consumer Prices (HICP) indicated a deceleration to 6.3% year-on-year (YoY), down from the previous reading of 7.6% and below the consensus forecast of 6.8%. Similarly, Spain reported a decrease in its HICP to 2.9%, lower than the expected 3.4%. In that sense, the shorter-term German bond yields declined with the 2- and 10-year bond rates, seeing more than a 2% decrease while the 5-year yield managed to increase slightly . On the other hand, Japanese rates decreased, with the 5-year yield seeing a 12% decline on the day, and applied further pressure on the Yen.
Anticipated data for Thursday indicates a potential decline in the EU's HICP and a contraction in German retail sales, signaling a weakening economy. If inflation continues to decrease, there is a possibility that the ECB might adopt a less strict monetary policy stance, which could negatively impact on the Euro.
On the other hand, Japan reported that Industrial Production unexpectedly contracted in the month of April while Retail Sales from the same month also failed to live up to the market expectations, contracting 1.2% vs the consensus which expected a stagnation. The Large Retailer Sales was the only economic report which surpassed expectations, coming in at 4.8% MoM, in April vs the 3.8% expected.
Levels to watch
According to the daily chart, the EUR/JPY holds a bearish outlook for the short term as the Relative Strength Index (RSI) and Moving Average Convergence Divergence (MACD) suggest that the sellers are in control while the pair trades below its main moving averages.
The 20-day Simple Moving Average (SMA) at 148.80 level remains the key support level for EUR/JPY. If broken, the 148.50 area and 148.00 zone could come into play. Alternatively, a move above the 149.30 zone would suggest a boost for the pair’s upside momentum, with next resistances at the 149.50 area and 149.80 level.
- Amid the uncertainty, the gold price stays above the $1960 mark, even preparing for over 1.3% monthly losses in May.
- Expectations of resolving the US debt ceiling issue spark a dip in US Treasury bond yields, offering a lift to the XAU/USD price.
- Dovish tones from Fed officials and robust US job openings data paint a mixed economic picture, potentially impacting gold’s future trajectory.
Gold price advances during the day but remains set to achieve monthly losses of more than 1.30% in May, portraying modest gains, and is trading back above the $1960 area. Factors like confidence for removing the debt ceiling in the United States (US), with the US House set for a vote on Wednesday night, spurred a plunge in US Treasury bond yields, a tailwind for XAU/USD prices.
XAU/USD finds support in plunging US Treasury yields, despite the impending monthly loss
The US House of Representatives held a procedural vote, “which allows for the start of the debate and then a vote on the bill itself, passed by a vote of 241-187, with 52 Democrats needed to overcome the opposition of 29 Republicans,” according to Reuters.
US bond yields dropped on investors’ trust in US politicians. The US 2-year Treasury note plummeted 20 bps in the last few days, from around 4.60% to 4.409%. As shown by US 10-year TIPS, US real yields remained unchanged compared to Tuesday’s session at 1.483%, a headwind for the US Dollar (USD).
In early data, the labor market in the United States is showing its resilience, as revealed by the JOLTs report, with job openings crushing estimates of 9.375M, expanding came at a 10.1M pace in April, signaling the tightness of the labor market.
Additionally, dovish comments from the US Federal Reserve (Fed) nominee for Vice-Chairman Philip Jefferson, open to skipping a rate hike at the upcoming June meeting, put additional pressure on US bond yields, with the swaps market estimating a 30% chance for a 25 bps rate hike in June.
Of late, echoing some of his comments was Philadelphia’s Fed President Patrick Harker commenting that he’s inclined to “skip” a rate hike in June. Nonetheless added that incoming data “may change my mind.”
In the latest data, the Fed’s Beige Book revealed that inflation had slowed and that “expectations for future growth deteriorated a little.”
XAU/USD Price Analysis: Technical outlook
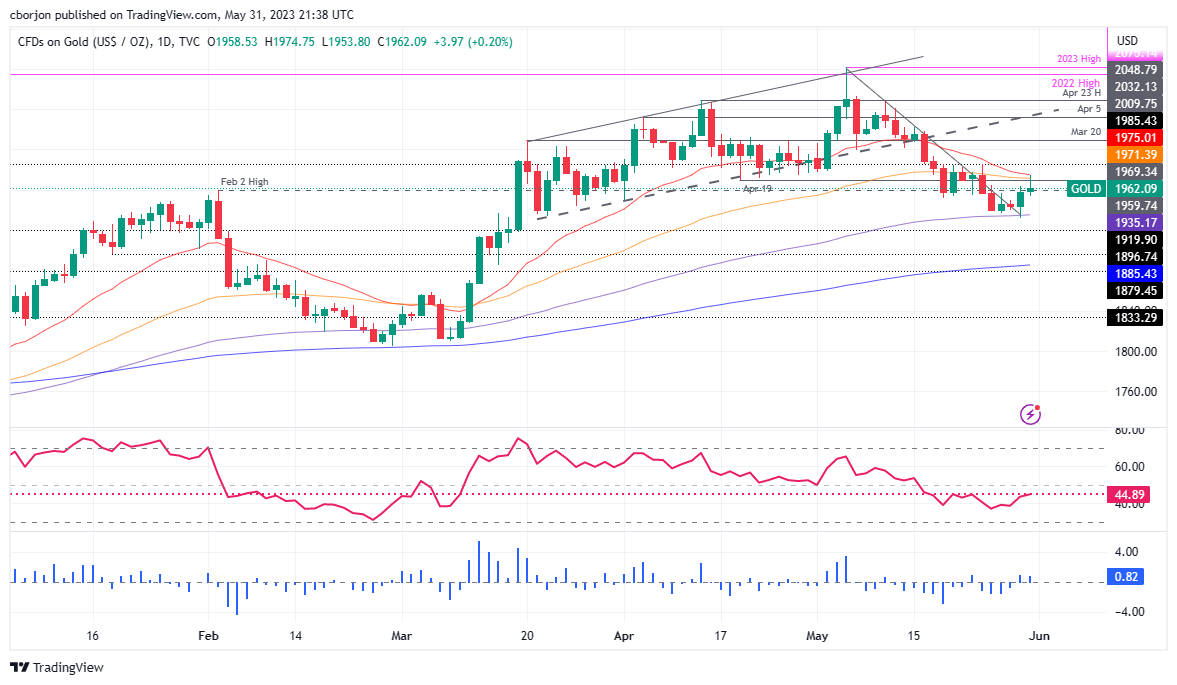
XAU/USD remains neutrally biased, slightly tilted upwards but cushioned upwards, in the confluence of the 50 and 20-day Exponential Moving Averages (EMAs) each at $1971.39 and $1975.01, respectively. Downwards, the yellow metal will clash with the 100-day EMA at 1935.17 before challenging the $1900 figure. Once cleared, sellers could drag Gold spot prices toward the 200-day EMA at $1885.43.
- AUD/USD bears are in the market but bulls are flexing.
- The bulls need to get over the line, or face seller commitments below trendline resistance.
The Australian dollar fell below 0.65 the figure and is hovering around the worst levels in over six months growing expectations that the US Federal Reserve would raise interest rates further. The Aussie was also weighed by poor China data. This leaves the technical outlook in question as the price remains on the front side of the bearish trend as the following will illustrate.
AUD/USD H4 chart
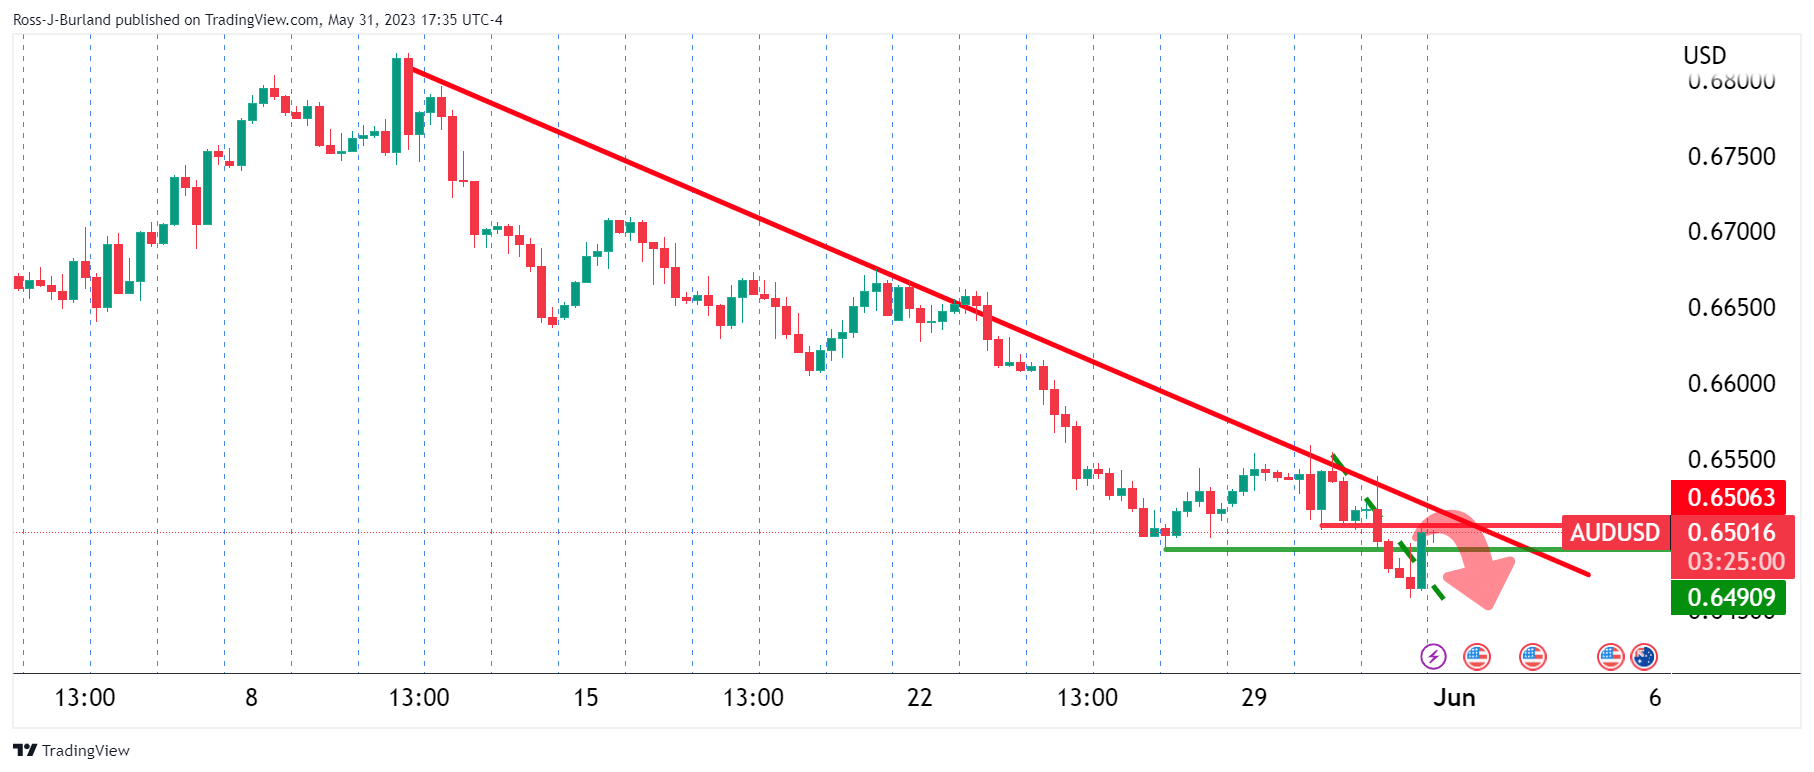
The price is trying to correct within a broadly bearish environment. So far, 0.6500 is holding as resistance.
AUD/USD H1 charts
The bears could be interested at this juncture given the premium they will collect in selling higher while in the front side of the bearish market.
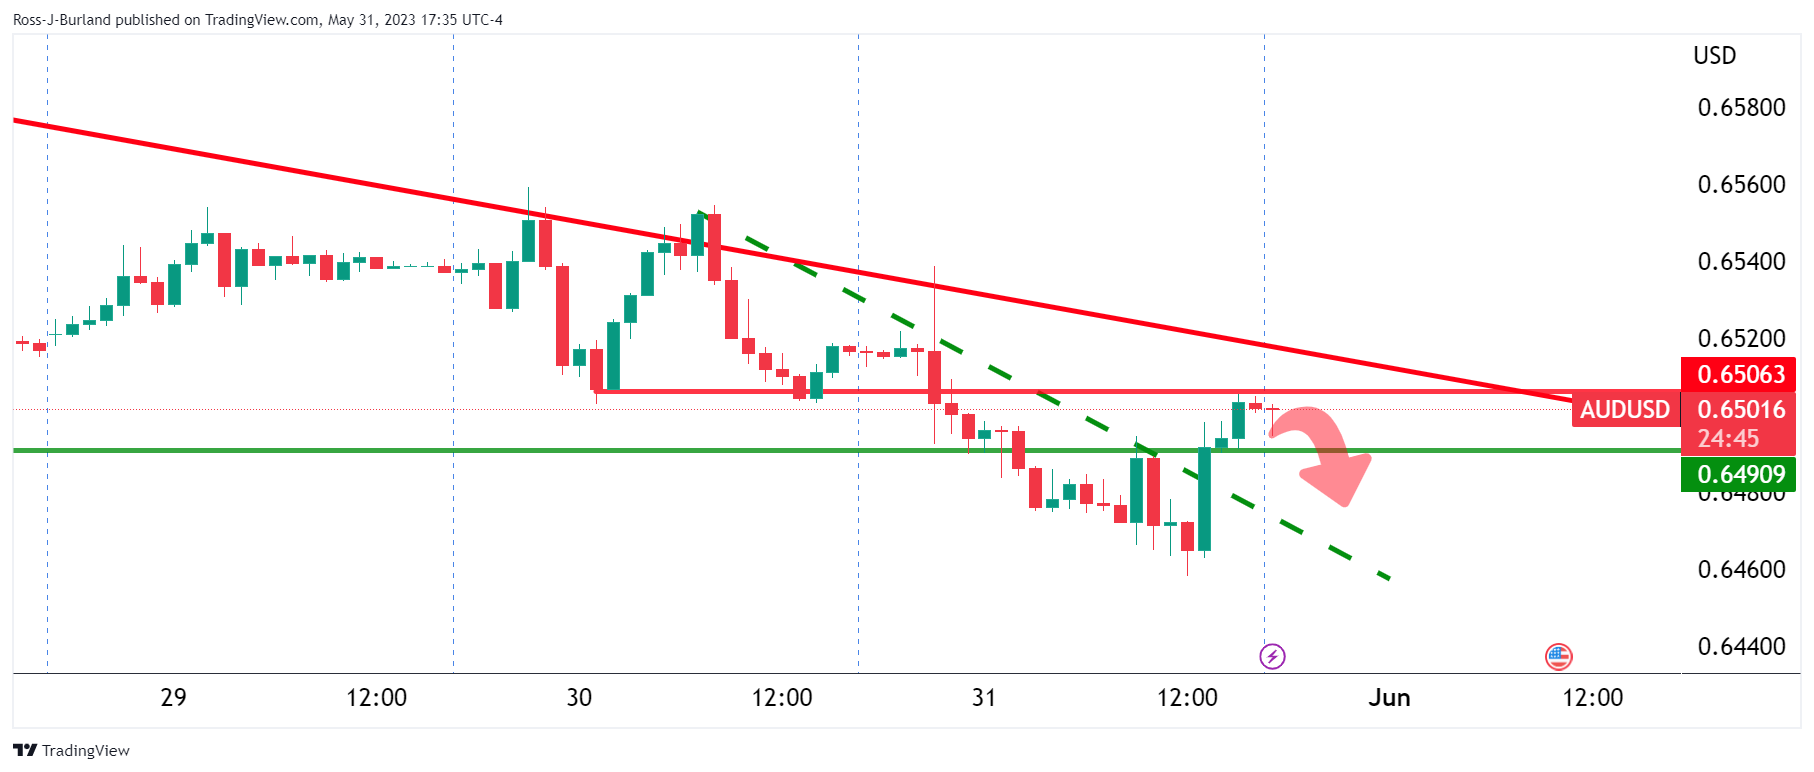
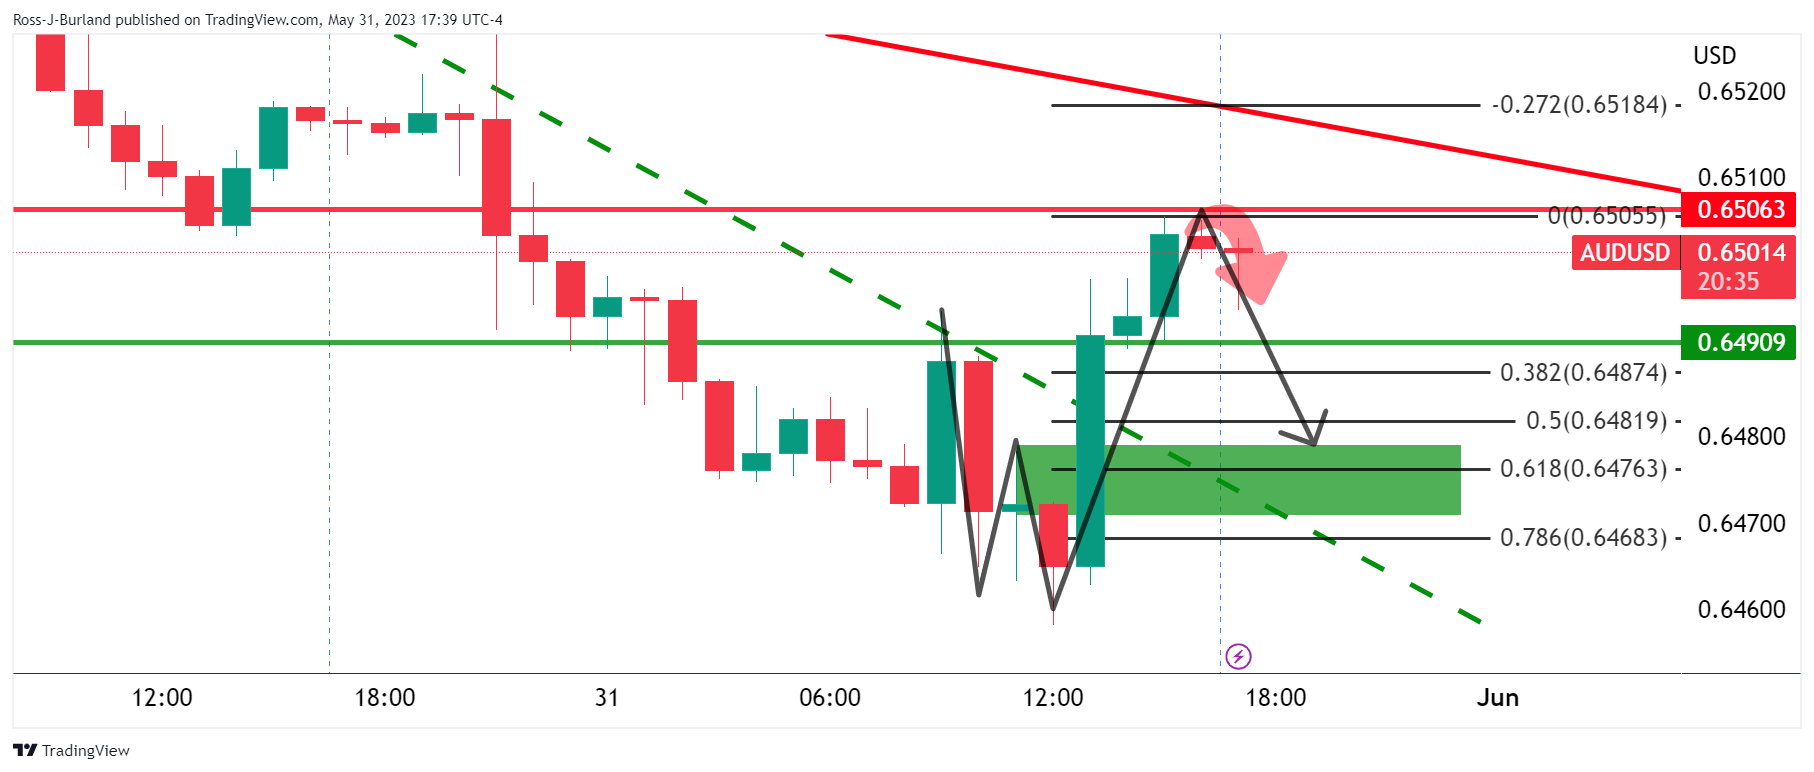
The W-formation is a compelling feature on the hourly chart. This is a reversion pattern and the price would be expected to come back into the neckline in due course. This area could act as a support and lead to an onward bullish impulse to retest recent highs and resistance. However, a break of the neckline and then the lows will likely lead to a downward continuation in line with the bearish trend.
The final PMIs from Australia and Japan, Q1 Australian Capital Expenditure, and the Chinese Caixin Manufacturing PMI are the highlights of the Asian session. Markets remain cautious, awaiting a positive resolution to the US debt-ceiling drama. Later on Thursday, US employment data will be watched closely ahead of Friday's Nonfarm Payrolls report.
Here is what you need to know on Thursday, June 1:
Wall Street indexes lost ground again on Wednesday as markets remain cautious. Equity prices finished off their lows. The rebound in stocks weighed on the US Dollar, which was also affected by comments from Federal Reserve officials that signaled a preference for a pause at the next FOMC meeting. A positive outcome of the debt-limit drama is expected from the ongoing debate in the US Congress.
Analysts at Brown Brother Harriman wrote:
We believe passage of the deal leaves the door wide open for a 25 bp hike at the June 13-14 FOMC meeting. With banking sector stresses fading, a potential default was really the only thing that could have prevented a hike next month. That said, the decision will ultimately depend on the data between now and that meeting, starting with the jobs report this Friday.
US employment data (JOLTS report) kept the door open to another rate hike. On Thursday, the ADP employment report and the weekly Jobless Claims will be watched closely. The key report will be on Friday with Nonfarm Payrolls. The Beige Book indicated that "economic activity was little changed overall in April and early May".
The US Dollar Index (DXY) rose 0.15% on Wednesday, ending far from its peak. The DXY hit a two-month high at 104.70 and then pulled back to 104.20.
Inflation data from Germany and France showed a decline in annual rates. On Thursday, the same is expected from the Eurozone Consumer Price Index (CPI). The Euro weakened following inflation figures. Market participants and European Central Bank (ECB) officials still expect rate hikes, but tightened expectations eased. The EUR/USD bottomed at 1.0630 and then rebounded, driven by a broad-based correction of the US Dollar. The pair rebounded towards 1.0700. The trend is down, but the bearish momentum has abated.
The Pound continues to perform well as more rate hikes are expected from the Bank of England to curb inflation. GBP/USD finished at a daily high after erasing losses, climbing toward 1.2450. EUR/GBP accelerated to the downside, falling for the fourth consecutive day. The cross closed below 0.8600, the weakest since December.
USD/JPY dropped for the third consecutive day, falling below 139.50. Lower government bond yields in Europe and the US continue to support the Japanese Yen. Additionally, comments from Japanese officials regarding Yen strength are helping the currency.
The Australian Dollar did not benefit from higher-than-expected inflation in Australia, nor from Reserve Bank of Australia Governor Lowe's comments suggesting that rates could rise further. AUD/USD finished practically flat, hovering around 0.6500, after reaching fresh six-month lows at 0.6456.
NZD/USD trimmed losses during the American session and rose back above 0.6000, after trading under that area for the first time since mid-November.
During the American session, the Canadian Dollar outperformed, supported by better-than-expected Canadian data. Real Gross Domestic Product grew at an annual rate of 3.1% in Q1, surpassing the expected 2.5% and recovering from a 0.1% contraction in Q4. April advance GDP rose 0.2%. Those numbers increased the odds of a rate hike from the Bank of Canada next week. USD/CAD posted the lowest close in a week around 1.3570. Again, the pair ran into resistance at the 1.3650 area. The short-term outlook is starting to favor the downside.
The Turkish Lira was again the worst performer as it continued to depreciate after Erdogan's victory at the presidential elections. USD/TRY reached new record highs above 20.70. A week ago, it was trading at 19.70.
Gold rose moderately on the back of lower yields but pulled back to $1,960 after reaching $1,974. Silver rose to its highest in a week above $23.50. Cryptocurrencies lost ground, with BTC/USD falling 2.35% to $27,120. Crude oil prices continued to trend lower, affected by the gloomy economic outlook, losing more than 2%.
Like this article? Help us with some feedback by answering this survey:
- USD/CAD bears are in the market which leaves prospects of a correction on the cards.
- Support is playing its role and there is a focus on the Fibo scale.
The Canadian Dollar strengthened on the back of data showing the domestic economy grew stronger than expected in the first quarter. USD/CAD is now breaking important structures as the following will illustrate.
Meanwhile, Canada's economy expanded at an annualized rate of 3.1% in the first quarter, eclipsing forecasts for an increase of 2.5%, and likely accelerated further in April.
USD/CAD H4 chart
The price is sinking below prior support and is now heading toward the next area of support as illustrated on the charts. A pullback could be on the verge of a correction.
USD/CAD H1
The hourly chart shows that the price is decelerating at this point. This leaves a focus on the upside with 1.36 eyed. However, we may see a commitment from the bears before then.
- The Euro weakened against its major rivals on Wednesday
- Germany and Spain reported inflation figures below the market expectations
- German bond yields decline, with the 10-year yield falling to weekly lows.
The Euro lost ground against the US Dollar, Japanese Yen and the Sterling Pound on Wednesday following inflation data from Germany and Spain which came in below the market consensus. For Thursday’ session, investors will eye Retail Sales data from Germany and the inflation figures from the European Union (EU).
Weak inflation figures weight on the German Bond yields
The German Harmonized Index of Consumer Prices (HICP) from May decelerated to 6.3% (YoY) from its previous reading of 7.6% and below the consensus of 6.8%. Likewise, Spain reported on Tuesday that its HICP fell to 2.9% vs the 3.4% expected.
Lower inflation means it is less likely the European Central Bank (ECB) will have to raise interest rates to quell surging prices. This would be negative for the Euro since global investors tend to prefer parking their money where interest rates are relatively higher.
As a result of the lower inflation data, the German yields have weakened across the curve. The 10-year bond yield fell to 2.26% seeing 4.18% decrease on the day, while the 2-year yield stands at 2.72% with having lost 3.41% on the day, and the 5-year yielding 2.39% seeing a 3.38 % decline. Conversely, the British yields are edging higher and the divergence between the rates applied further pressure on the pair with the 2, 5 and 10-year seeing an increase of more than 0.80%.
For Thursday, markets are expecting the EU’s HICP to have further declined in May to 6.3% (YoY) from its previous figure of 7%. Retail sales from Germany have contracted in the same period of time and show that the German economic activity continues to weaken. This is a further indication the ECB could ease its monetary policy stance as long as inflation continues to fall – a negative for the Euro.
Levels to watch
The EUR/GBP holds a bearish outlook for the short term, as per the daily chart. The Relative Strength Index (RSI) and Moving Average Convergence Divergence (MACD) are both showing weakness standing in negative territory, and the pair trades below its main moving averages indicating that the sellers are in charge.
In case of further downside, support levels line up at the 0.8550 zone and below around the 0.8545 area and the 0.8520 level. In case the EUR/GBP exchange rate consolidates gains, resistance lines up at the 0.8600 level followed by the 0.8650 zone and the 0.8700 area.
-638211567043094817.png)
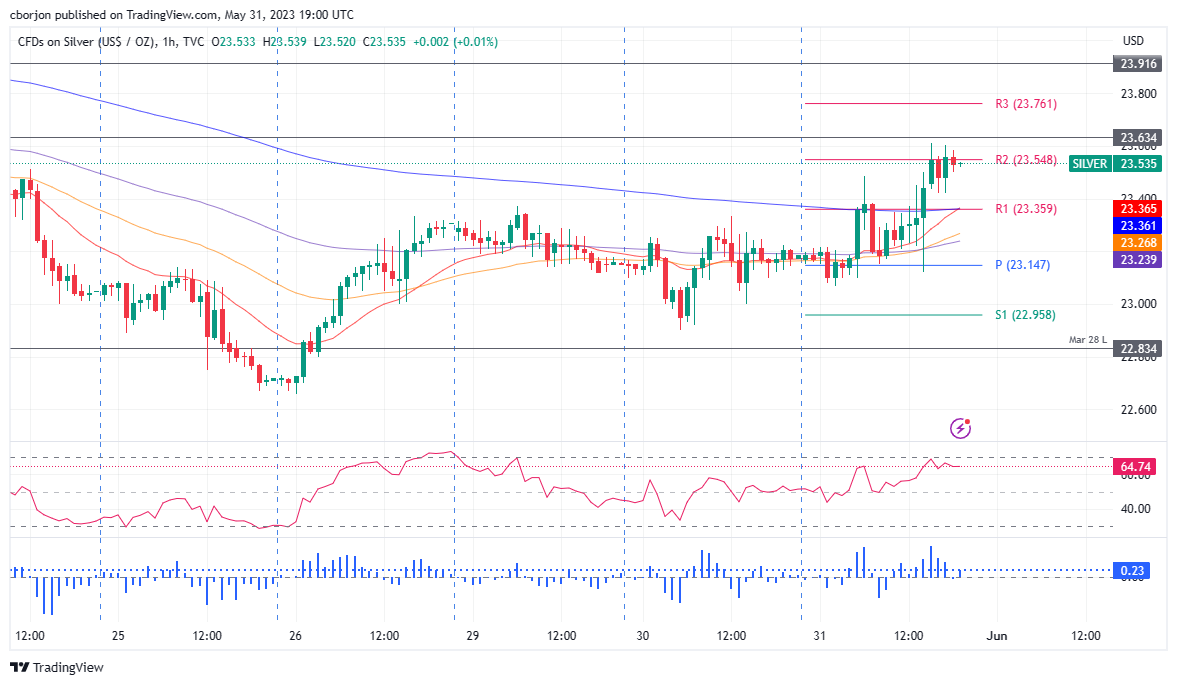
- XAG/USD ascends past the 100-day EMA, powered by dovish remarks from Fed officials and reduced US Treasury yields.
- The technical outlook indicates potential resistance at 20-day and 50-day EMA, respectively, and support at 100-day and 200-day EMAs
- Further upside is expected based on the RSI and 3-period RoC, although key pivot points and daily highs need to be breached for significant gain.
Silver price climbs past the 100-day Exponential Moving Average (EMA) and trades back above the $23.50 area, sponsored by several factors. Firstly, US Federal Reserve (Fed) Vice-Chairman nominee Philip Jefferson delivered dovish remarks alongside Philadelphia Fed’s Patrick Harker, while confidence about passing the US debt-ceiling bill triggered a fall in US Treasury bond yields.
XAG/USD Price Analysis: Technical outlook
From a daily chart perspective, XAG/USD is neutral to upward biased, capped on the upside by the confluence of two daily EMAs: the 20-day at $23.80 and the 50-day at $23.93. Upside risks lie above those levels, exposing the $24.00 figure. Conversely, XAG/USD sellers claiming the 100-day EMA at $23.46 could threaten to challenge the 200-day EMA at $22.84 for the third time.
The XAG/USD hourly chart indicates the white metal is upward biased but facing solid resistance at the R2 pivot point at 23.54, with upside risks at the May 23 daily high of 23.63. A breach of the latter, XAG/USD could climb toward the May 22 high of $23.91. Conversely, the XAG/USD first support would be the R1 daily pivot at $23.36 before slumping toward the central pivot at $23.14. Once cleared, the daily low of $23.07 would be up for grabs, ahead of falling to the S1 pivot point at $22.96.
Of note, oscillators like the Relative Strength Index (RSI) indicator suggest further upside expected alongside the 3-period Rate of Change (RoC).
XAG/USD Price Action – Hourly chart
- GBP/USD bulls in the market and eye 1.2500.
- Bears will be looking for a deceleration of the rally.
As per the prior day´s analysis, GBP/USD Price Analysis: Bulls meet key resistance, bears lurking, whereby the price was anticipated to continue forming the right-hand shoulder of the head and shoulders, we have seen just that.
GBP/USD prior analysis
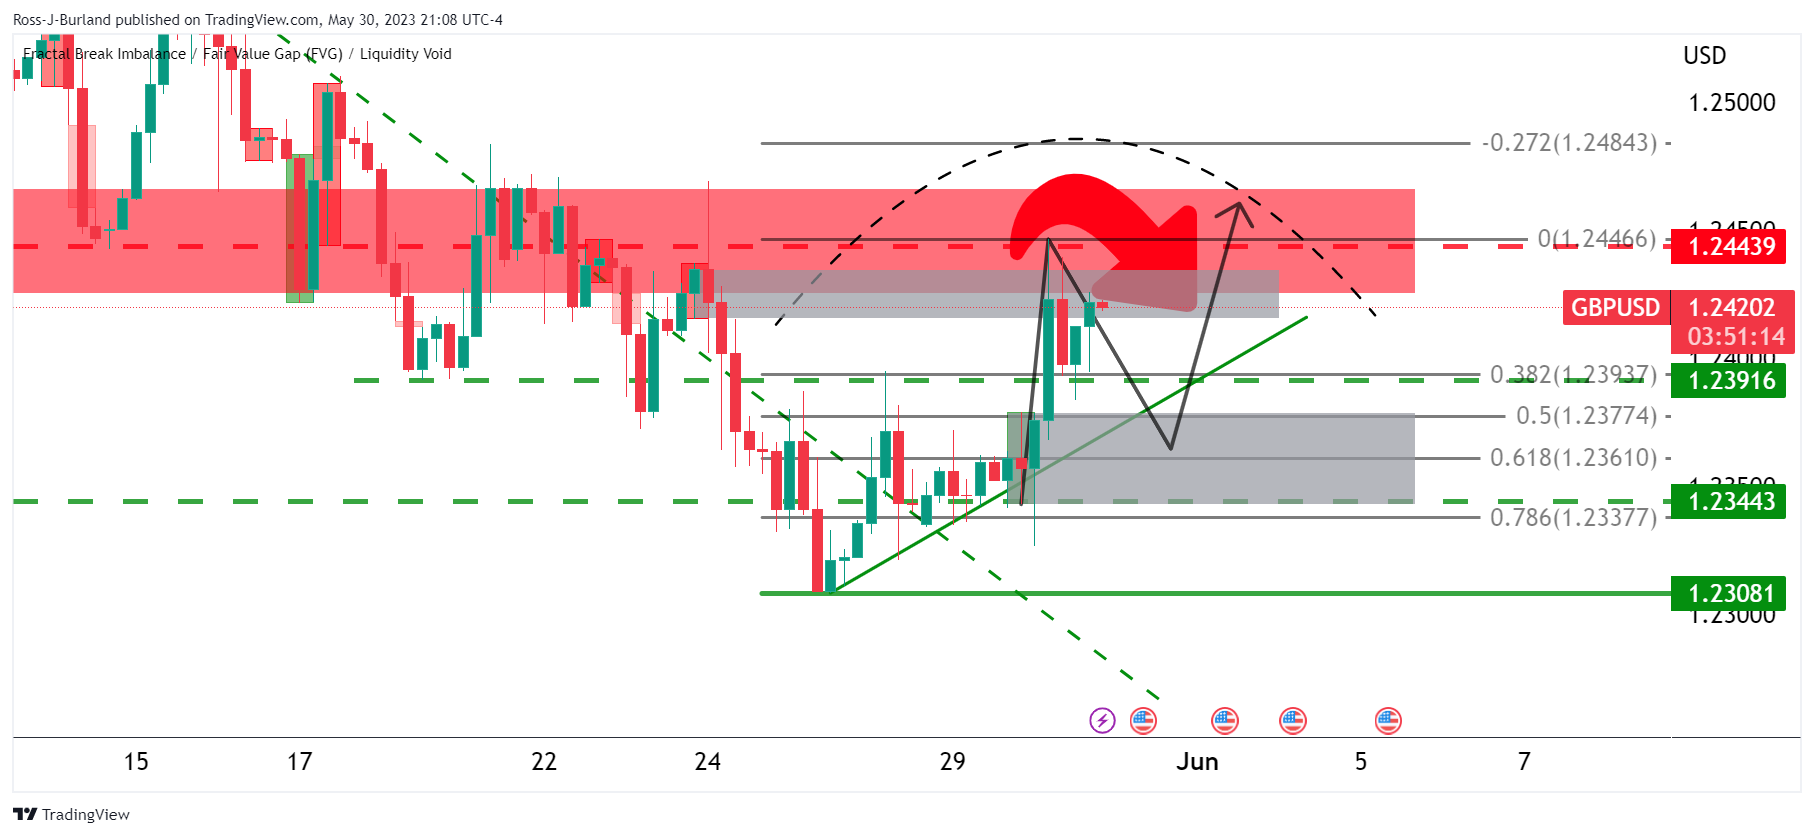
It was stated that the price has rallied into a high-volume candle and had met resistance. This left the meanwhile focus on a correction into the 1.2370s and then the trendline support into the congestion towards 1.2350. Bulls were anticipated to be encouraged to reengage at a discount and that might have been the fuel for the next bullish impulse for a higher high within the right-hand shoulder.
GBP/USD updates
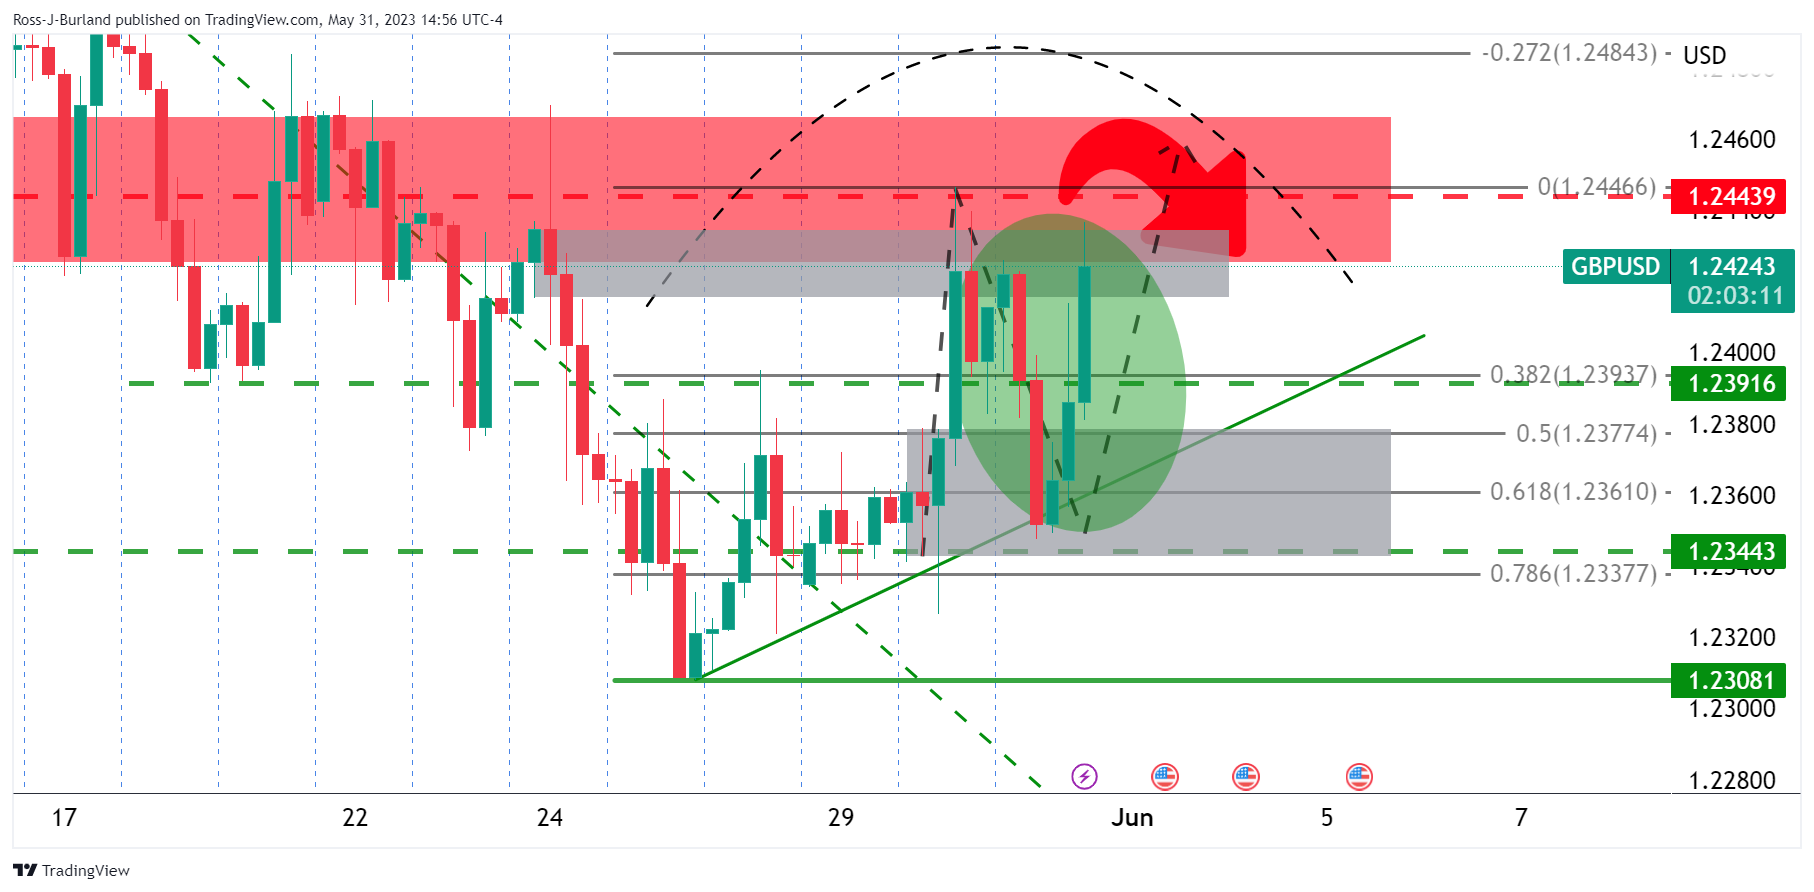
We have seen just that and now the focus is back on the downside. However, there is room to go yet as the equal highs could be mitigated first:
The W-formation would be a reversion pattern, should it come to fruition as the price continues towards 1.2500.
- NZD/USD lost over 80 pips as the US Dollar benefits from a sour market mood.
- Uncertainty over the passing of the debt-ceiling bill and the US labor market outlook contribute to a negative market sentiment.
- Dovish Fed speakers helped the pair erase part of the daily losses.
The NZD/USD has reached its lowest levels in several months due to the increasing strength of the US Dollar. This is primarily driven by uncertainties surrounding the latest US data from the US and concerns about the passage of the debt-limit bill, which is facing resistance in both chambers of the US Congress. In addition Patrick Harker from the Philadelphia Federal Reserve (Fed), commented that the Fed doesn’t have to hike at every meeting and seems to be limiting the Greenback’s gains. On the other hand, the New Zealand economic calendar won’t have any relevant news to offer for the rest of the week.
US bond yields trading lower but the Dollar holds its foot
Reacting to the uncertainty regarding the latest US debt-ceiling bill passing, the US bond yields are edging lower, signaling a higher demand for American bonds. The 10-year bond yield is trading at 3.66%, down by 1.33% on the day. The 2-year yield stands at 4.38% with 2.12 % losses; and the 5-year yield is at 3.77% with 1.33% losses. However, the Greenback as measured by the US Dollar index (DXY) is holding its ground at the 104.35 level, trading with 0.30% gains on the day.
Furthermore, the JOLTS Job Openings report for April from the US, released on Wednesday, exceeded expectations at 10.10 million compared to the anticipated 9.37 million.On the other hand, the Beige Book, published by the Federal Reserve, which provides a varied assessment of the current state of the US economy showed a mixed outlook. According to the report, there was minimal overall change in economic activity during April and early May. However, it highlighted that consumer spending maintained a consistent upward trend, while the service sector experienced a moderate decline in the most recent reporting period.
Automatic Data Processing Inc. will disclose May's employment change figures on Thursday. The US Bureau of Labor Statistics will release the Nonfarm Payrolls (NFP) report for the same month on Friday and these reports are expected to reflect ongoing challenges in the US labor market. They could influence the Federal Reserve's decision and the dynamics of the US Dollar. The CME FedWatch tool shows a 32% odds of a rate hike at the next FOMC meeting.
Levels to watch
The NZD/USD has a clear bearish outlook for the short term, as per the daily chart. The Relative Strength Index (RSI) and Moving Average Convergence Divergence (MACD) are both in negative territory, and the pair trades below its main moving averages indicating that the sellers are in control.
The daily low at 0.5985 level remains the key support level for USD/NZD. If broken, the 0.5980 zone and the 0.5960 level could come into play. Furthermore, a move above the 0.6000 zone would fuel bullish momentum for the Kiwi, with next resistances at the psychological mark at 0.6050 and the 0.6100 level.
US Senate Republican Leader Mitch McConnell is helping to steer crucial legislation to raise the debt ceiling past Senate conservatives but he says:
´´We anticipate debt ceiling bill passing,´´ and claims that the bill is expected to come to the Senate as soon as Thursday.
The US House of Representatives is due to vote on a bill to lift the government's $31.4 trillion debt ceiling in a critical step to avoid a destabilizing default that could come early next week without congressional action.
Republicans control the House by a narrow 222-213 majority, but the bipartisan deal will need support from both Speaker Kevin McCarthy's Republicans and President Joe Biden's Democrats to pass, as members of both parties object to significant parts of the bill.
- USD/JPY bears are in the market and eye a downside extension.
- The bulls need to commit or face pressures in the 138s.
USD/JPY is under pressure with a focus on the 138.80s and then the 138.20s thereafter and the following analysis illustrates this.
USD/JPY H4 chart
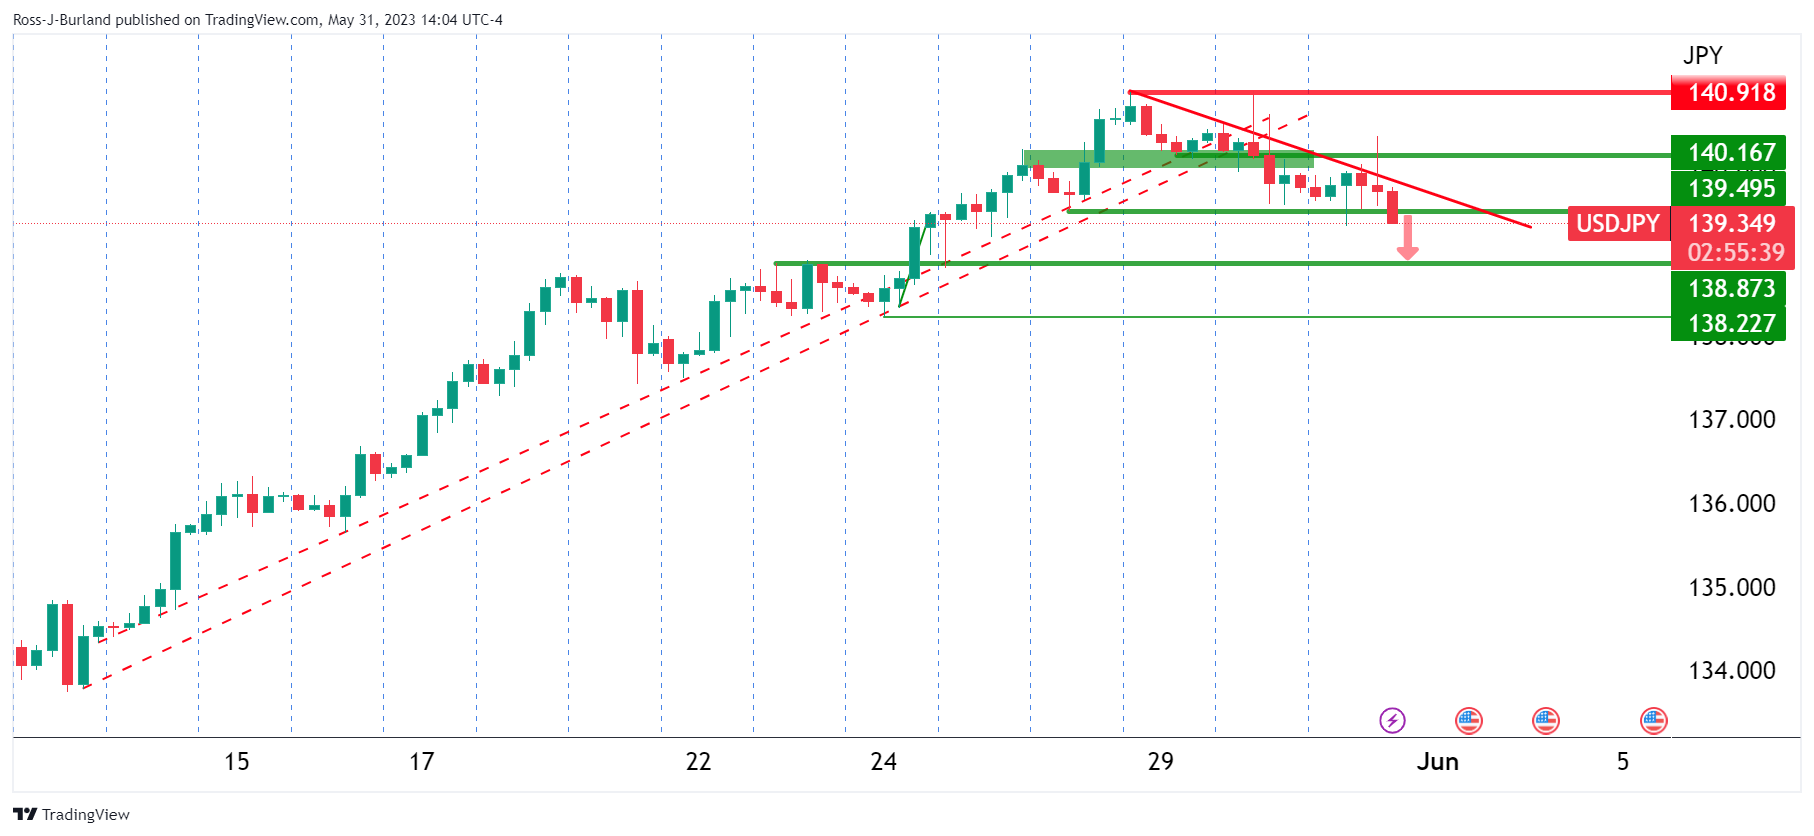
As can be seen, the market is on the backside of the prior bullish trend and is starting to break down prior lows within the consolidation phase, aka, structure. the structure of interest in this example was the 139.50 mark that was recently taken out.
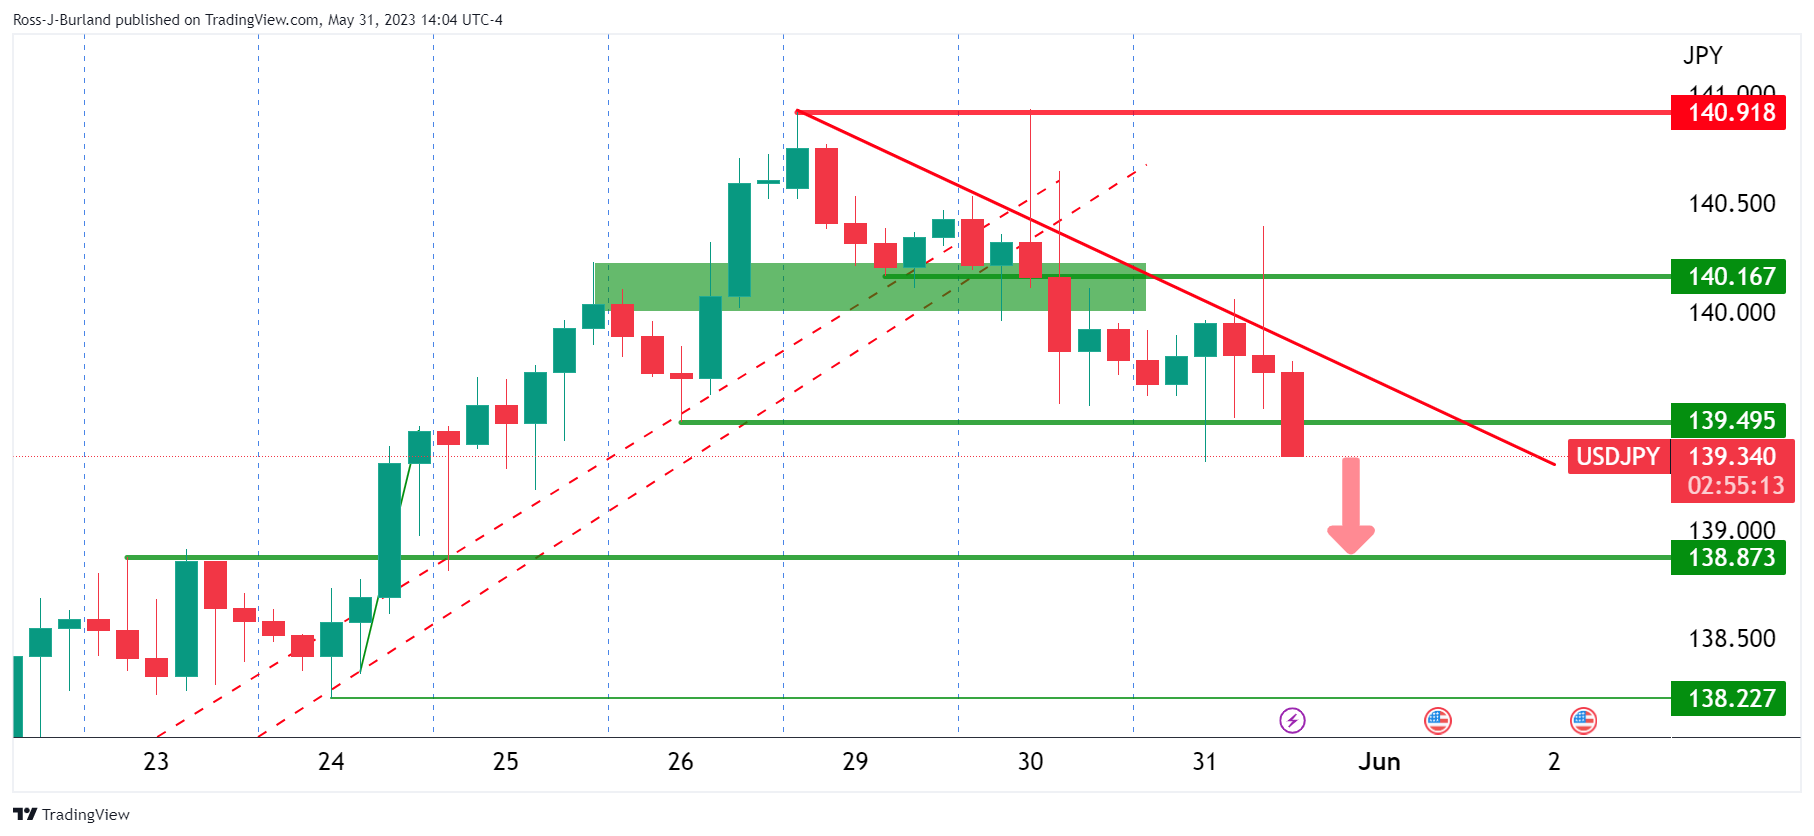
Zooming in, we can see that the price is heavily offered and there are prospects of a move toward the said levels.
According to Federal Reserve’s Beige Book, “economic activity was little changed overall in April and early May”. The expectations for future growth deteriorated a little, “though contacts still largely expected a further expansion in activity.”
“Employment increased in most Districts, though at a slower pace than in previous reports”, said the Beige Book. On Friday, the Nonfarm payrolls report is due.
The reaction in the currency market to the Beige Book was muted. The US Dollar continued to trim losses, affected by comments from Federal Reserve officials Harker and Jefferson, who suggested that they will vote to keep rates unchanged at the next meeting.
Key takeaways from the Beige Book:
Economic activity was little changed overall in April and early May. Four Districts reported small increases in activity, six no change, and two slight to moderate declines. Expectations for future growth deteriorated a little, though contacts still largely expected a further expansion in activity. Consumer expenditures were steady or higher in most Districts, with many noting growth in spending on leisure and hospitality. Education and healthcare organizations saw steady activity on balance.
Financial conditions were stable or somewhat tighter in most Districts. Contacts in several Districts noted a rise in consumer loan delinquencies, which were returning closer to pre-pandemic levels.
Employment increased in most Districts, though at a slower pace than in previous reports. Overall, the labor market continued to be strong, with contacts reporting difficulty finding workers across a wide range of skill levels and industries.
Staffing firms reported slower growth in demand. As in the last report, wages grew modestly.
Prices rose moderately over the reporting period, though the rate of increase slowed in many Districts. Contacts in most Districts expected a similar pace of price increases in the coming months. Consumer prices continued to move up due to solid demand and rising costs, though several Districts noted greater price sensitivity by consumers than in the prior report.
Home prices and rents rose slightly on balance in most Districts, after little growth in the prior period.
Philadelphia Federal Reserve Bank President Patrick Harker said on Wednesday that the US economy is incredibly resilient. He added that their model forecasts no recession ahead. According to him, the Unemployment Rate is going to tick up toward 4.4%.
Regarding interest rates, Harker favored pausing at the next meeting. He warned that incoming data “may change” his mind.
Market reaction:
Harker and Jefferson’s comments favoring a pause at the next meeting weighed on the US Dollar, which trimmed gains across the board. US stocks moved off lows. The DXY stands at 104.40, up 0.35% for the day.
- USD/MXN rides on risk aversion and strong US data, marking two straight days of gains.
- Stellar US JOLTs report fuels potential Fed rate hike speculations, strengthening USD.
- Anticipated Mexico’s Business Confidence and US job data may sway the currency pair further.
USD/MXN prints two consecutive days of gains, bouncing off the weekly lows of 17.5401, and reached the 17.7700 area as risk-aversion spurred outflows from the emerging market currency. Factors like China’s weak recovery, US debt-ceiling discussions, and solid data from the United States (US) weighed on the Mexican Peso (MXN). At the time of writing, the USD/MXN is trading at around 17.6860, above its opening price by 0.15%.
Emerging markets feel the pinch as US data underscores resilience and prompts hawkish Fed outlook
Wall Street extended its losses portraying a risk-off environment. Weaker than expected manufacturing PMI in China, US debt-ceiling woes, and upbeat US economic data underpinned the USD/MXN to new weekly highs of 17.7724.
The labor market in the United States is proving its resilience, as shown by data in the calendar. As revealed by the JOLTs report, job openings crushed estimates of 9.375M, which came at 10.1M in April, signaling the tightness of the labor market. Following the release, the USD/MXN jumped from around 17.60 toward the 17.7500 area. The reaction is attributed to speculations that the US Federal Reserve (Fed) could raise interest rates in the upcoming June meeting
That triggered a re-pricing towards a more hawkish Federal Reserve (Fed), with odds at 69.8%, for a 25 bps rate hike.
Federal Reserve speakers have begun crossing the wires, with the Vice-Chairman nominee by the US President Joe Biden, Philip Jefferson, saying that keeping rates unchanged. However, they should not be taken as a peak for the tightening cycle. Echoing some of his comments was Philadelphia Fed Patrick Harker, who commented that he’s on the camp of “skipping” a meeting and added that incoming data could change his point of view.
Upcoming events
The agenda in Mexico will feature the Business Confidence for May after April’s numbers came to 52.6. Across the borders, the US economic docket will feature the ISM and S&P Global PMIs, jobs data with jobless claims, and the ADP Report.
USD/MXN Price Analysis: Technical outlook
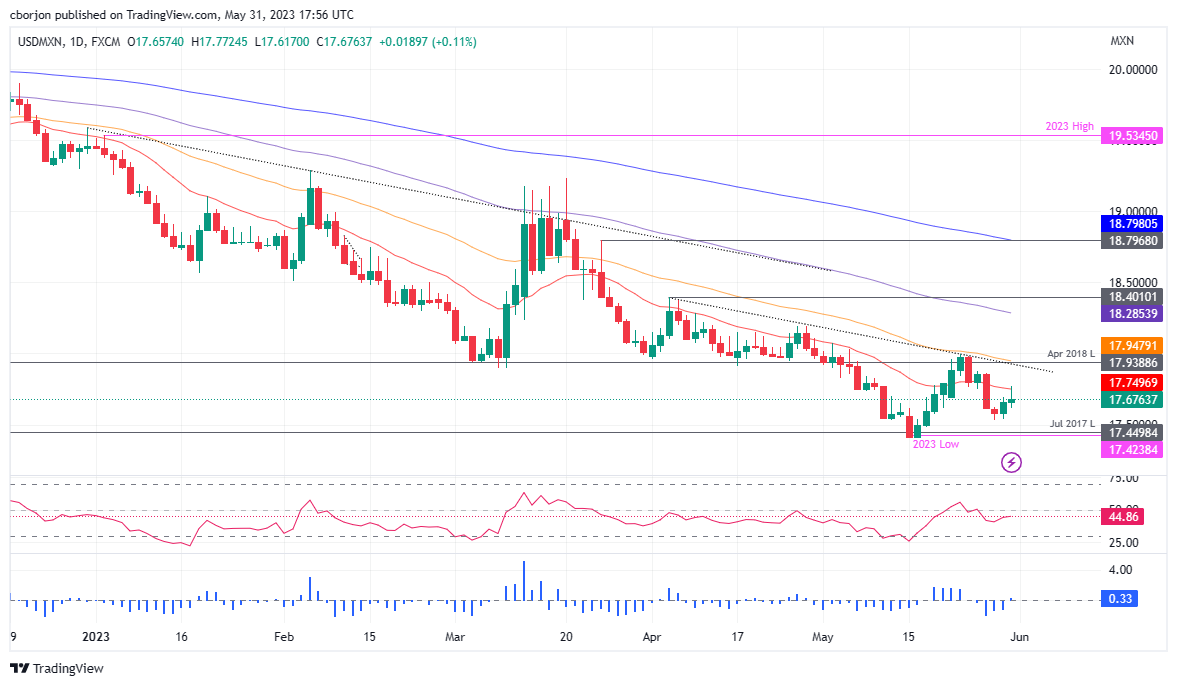
The USD/MXN pair is downward biased. During the day, buyers tested the waters at the 20-day Exponential Moving Average (EMA), at 17.7511, before retracing from around that area, dropping below 17.7000 after Fed speakers’ remarks. For a bullish continuation, the USD/MXN buyers must claim the 20-day EMA and the April 2018 lows-turned-support at 17.9388 before challenging the 50-day EMA at 17.9483. Conversely, if USD/MXN slips below 17.60, a test of the YTD low of 17.4238 is likely.
Federal Reserve Governor Philip Jefferson said in speech on Wednesday that pausing rate hikes at the next FOMC meeting would offer time to analyze more data before making a decision about the extent of additional tightening. He added that a pause, does not mean that rates peaked.
Key takeaways from the speech:
“While it is reasonable to expect that the recent banking stress events will lead banks to tighten credit standards further, the amount of tightening and the magnitude of the effect such tightening might have on the U.S. economy is not yet clear, and this uncertainty complicates economic forecasts.”
“A decision to hold our policy rate constant at a coming meeting should not be interpreted to mean that we have reached the peak rate for this cycle. Indeed, skipping a rate hike at a coming meeting would allow the Committee to see more data before making decisions about the extent of additional policy firming.”
“While my base case forecast for the U.S. economy is not a recession, higher interest rates and lower earnings could test the ability of businesses to service debt. In addition, and perhaps more in focus given the recent events affecting certain areas of the banking sector, higher interest rates could further exacerbate stress at banking organizations, especially those that are highly exposed to longer-duration assets and have a relatively high ratio of uninsured deposits to total deposits.”
Market reaction
The US Dollar is up across the board but is moving off daily highs, as market sentiment recovers. Comments from Fed’s Jefferson and Harker sounded dovish. US yields are at fresh lows and DXY is at 104.35, retreating from monthly highs.
- The AUD/USD fell to its lowest point since November 2022.
- The monthly Consumer Price Index from Australia accelerated in April.
- Investors await labor market data from the US.
The Australian dollar dropped to multi-month lows due to the strong US Dollar and uncertainties surrounding US labor market data and the debt-limit bill facing resistance in Congress. On the other hand, Australian inflation in April picked up somewhat but bond yields are declining adding further pressure on the Australian Dollar.
Australian and American yields are weak ahead of NFP data
Following Monday’s release of the sharp decline in Australian Building permits of 8% vs the 2% increase expected, Australian yields continue to decline. The 10-year bond is yielding 3.60% and showing 0.24% losses.The 2-year rate stands at 3.55% down by 0.51% , while the 5-year yield is at 3.37% losing 0.24% .
On the flip side, US bond yields are declining, indicating a bearish market sentiment driven by heightened demand for American bonds. The 10-year yield retraced to 3.66% with a loss of 1.13%, while the 2-year yield stands at 4.38% reflecting a decline of 2.12%. Similarly, the 5-year yield sits at 3.77% with losses of 1.33%.
That being said, the American bonds market may face some volatility ahed the release of key labor market data from the US. On Thursday, the Automatic Data Processing Inc., will release the employment change figures from May and on Friday, the US Bureau of Labor Statistics will release Non Farm Payrolls (NFP) from the same month. In that sense both reports are expected to hint at more pain in the US labor market which may have an impact on the upcoming Federal Reserve (Fed) decision. At the time being, market participants expect a 25 basis points (bps) hike.
In addition, the JOLTS Job Openings released on Wednesday, from the US, for April, came in at 10.10M vs the 9.37M expected. For the rest of the session, investors will eye the release of the Fed Beige book to have a better understanding of the current economic situation in the US.
Levels to watch
The AUD/USD has a bearish outlook for the short term as indicators on the daily chart suggest that the sellers have the upperhand while the pair trades well below its main Simple Moving Averages (SMA).
In addition, If the Aussie continues to lose ground, immediate support levels are seen at the 0.6440 zone followed by the 0.6300 area, and then at the 0.6250 level. On the other cand, in case the Aussie gains traction, the following resistance line up at the 0.6500 zone followed by the 0.6550 and 0.6600 levels.
-638211479963318250.png)
- The EUR/USD slips to the 1.0660s region as robust US economic data, including an unexpected surge in April’s JOLTs report, bolstered the US Dollar, erasing previous gains.
- Easing inflation in Germany and France lessens the pressure on the ECB for further aggressive actions, contributing to the Euro’s downward trajectory.
- Upcoming economic events could further impact the currency pair, with EU members’ S&P Global PMIs and US job data in the spotlight.
EUR/USD stumbles past the 1.0700 mark erasing last Tuesday’s gains, and extends its fall toward the 1.0660s area after upbeat economic data from the United States (US) boosted the greenback. Earlier, Eurozone (EU) data showed that inflation is easing, hence the Euro’s (EUR) weakness. At the time of writing, the EUR/USD is trading at 1.0663m, down by more than 0.60%.
Risk aversion drives investors toward the greenback while easing inflation pressures in the EU cast a shadow on the Euro
Risk aversion has been the main driver since the beginning of the trading day. Further exacerbated by weak manufacturing activity in China and US debt-ceiling jitters, it triggered a flight to safety, namely the US Dollar (USD). Data-wise, the US economic agenda featured a surprising JOLTs report for April, with vacancies climbing the most in three months, cane at 10.1M, exceeding estimates of 9.375M, 300K more than March.
That triggered a re-pricing towards a more hawkish Federal Reserve (Fed), with odds at 69.8%, for a 25 bps rate hike. Therefore, the EUR/USD tumbled 30 pips, from around 1.0690, toward the 1.0660 area, Following the data release. As of writing, the EUR/USD continued to fall as the day advanced.
Across the pond, inflation in Germany came below estimates in May, easing off pressure on the ECB to continue its aggression cycle. German inflation rose by 6.1%, beneath forecasts of 6.5%, lower than April’s 7.2%. Earlier France revealed that prices slowed to 5.1%, from the 5.5% foresaw by analysts.
Upcoming events
The Eurozone economic data will reveal the EU’s members’ S&P Global PMIs on Thursday, alongside Retail Sales in Germany and the release of the Harmonised Index of Consumer Prices (HICP). On the US front, ISM and S&P Global PMIs and jobs data, with jobless claims and the ADP Report, would be revealed.
EUR/USD Technical Levels
Swiss National Bank (SNB) Chairman Thomas Jordan said on Wednesday that Credit Suisse situation was caused by a lack of trust by market participants in the bank rather than rising interest rates, per Reuters.
Jordan further reiterated that they have to bring inflation back below 2% as soon as possible and noted that sees inflation risks higher than deflation in the future, due to deglobalisation.
Market reaction
USD/CHF retreated modestly from the multi-month high it set near 0.9150 earlier in the day and was last seen trading at 0.9125, where it was still up 0.75% on a daily basis.
- The USD/CAD pair teetered around the 1.3600 figure after the Canadian GDP Q1 results exceeded estimates, prompting anticipations of BoC policy tightening.
- The US labor market reported an unexpected surge in job openings (JOLTs), supporting the case for additional interest rate hikes by the US Federal Reserve.
- Crude oil’s declining prices and a resilient US Dollar Index supported the greenback, offsetting the pressure from solid Canadian economic performance.
USD/CAD climbs for two straight days, though reclaiming the 1.3600 figure after solid Canadian economic data increased the odds for further tightening by the Bank of Canada (BoC). Nevertheless, recent data in the United States (US), alongside a risk-off impulse, cushioned the pair’s fall and trades at 1.3594, down by 0.06%.
Canada’s economy growing faster than estimates, takes a potential rate hike back into the table for the BoC
Statistics Canada reported that Gross Domestic Product (GDP) for the first quarter (Q1) rose above estimates, accelerating further in April, according to data. The Canadian economy expanded by 3.1% YoY, smashing 2.5% estimates, and month-over-month (MoM) in March stood at 0%, against the above forecasts—the preliminary figure for April stood at 0.2%.
After the data was released, the USD/CAD tumbled from around 1.3640 toward 1.3606 before data from the US sponsored a short-lived recovery.
In the US, the April job openings report, known as JOLTs, unexpectedly soared to its highest level in three months, justifying the need for additional interest rate hikes by the US Federal Reserve (Fed). Vacancies grew to 10.1M, above estimates of 9.375M, and posted more than 300K compared to March. Although it cushioned the USD/CAD fall and reclaimed 1.3600, the pair extended its losses below the latter.
The greenback stood afloat as falling crude oil prices threw a lifeline, as it extended its losses by 1.32%, with the US crude oil benchmark, WTI exchanging hands at $68.53 per barrel.
Meanwhile, the US Dollar Index (DXY), which tracks the buck’s value vs. a basket of six peers, stands at 0.48%, up at 104.557, bolstered by recently released jobs data and increasing odds for another rate hike in June. The CME FedWatch Tool’s chances for an increase lie at 69.8%, above yesterday’s 66.6%.
USD/CAD Price Analysis: Technical outlook
From a technical perspective, the USD/CAD persists upward biased, despite the ongoing pullback, with sellers eyeing a test of the weekly low of 1.3567. Further deep beneath that level will immediately expose the 20-day Exponential Moving Average (EMA) at 1.3542, followed by the 50-day EMA at 1.3530. Conversely, if USD/CAD buyers reclaim 1.3600, that will exacerbate a continuation of the ongoing rally, but a decisive break above the weekly high of 1.3651 is needed to challenge 1.3700.
- Gold prices rise slide in Wall Street, supported by a decrease in government bond yields.
- Following a brief pullback in response to the US Job Openings report, XAU/USD rebounded to weekly highs.
Gold prices are up for the second consecutive day on Wednesday, driven by lower government bond yields. The yellow metal reached its highest level in a week and is trading above $1,970.
Gold keeps shinning
After the opening bell on Wall Street, XAU/USD gained momentum and rose above $1,970. However, following the release of the US Job Openings report, it pulled back to $1,960, only to rebound later to $1,974, hitting a fresh weekly high.
US data released so far on Wednesday has been mixed. The JOLTS Job Openings came in at 10.10 million in April, against expectations of a decrease to 9.73 million. Meanwhile, the Chicago PMI showed a sharp decline in May from 48.6 to 40.4, against expectations of 47. These economic figures triggered market volatility. On Thursday, the ADP Employment report and the weekly Jobless Claims are due, while on Friday, the official Employment report will be released.
Although the US Dollar Index is up by 0.45%, it is not limiting Gold's gains. The key driver on Wednesday has been government bond yields. The 10-year Treasury yield is at 3.65%, the lowest in more than a week, while the German 10-year reference dropped to 2.24%, the lowest in two weeks. Market jitters and easing inflation in Europe are supporting the rally in bonds.
The short-term outlook for Gold looks positive while trading above $1,955, with resistance expected around $1,970. A clear consolidation above this level would keep the door open for further gains. The next strong resistance could be seen at the 20 and 55-day Simple Moving Averages, currently at $1,988.
Technical levels
Strategists at Crédit Agricole have made an upward revision to their Gold price forecast for 2024.
Three factors behind the revised outlook
“We now expect Gold to peak at $2,050 by Q1 2024 and then ease back to $2,000 by the end of Q2 2024. We continus to hold our previous target of $2,000 for the precious metal by the end of 2023.”
“The ongoing US debt-ceiling debacle has prompted investors to flock to Gold, viewing it as a safe haven and a reserve asset in times of uncertainty. Gold has historically performed well during past debt ceiling incidents, often holding onto and even extending its gains in the months following a debt ceiling resolution.”
“US political risks could continue to boost Gold's appeal, even after the current debt ceiling issue is resolved. If the statutory debt limit is extended until January 2025, the ensuing political wrangling could amplify risks surrounding the 2024 US presidential election.”
“We predict a weakening USD in late 2023 and early 2024, due to expectations of the Federal Reserve entering an easing cycle amidst a potential US recession and subsiding inflation. This scenario is likely to further enhance Gold's attractiveness.”
The Brazilian Real depreciated again yesterday after further inflation indicators signaled a faster decline in inflation. The showdown between the Brazilian government and the central bank (Banco Central do Brasil, BCB) is getting closer. Economists at Commerzbank analyze its implication for the USD/BRL pair.
August meeting of the BCB is looking more and more like the date for a first rate cut
“In June, the planning minister, finance minister and central bank governor will meet to set the inflation target for 2026. BCB governor Campos Neto has recently repeatedly warned against changes, stressing that they would not widen the current scope for rate cuts.”
“We also see the discussions as a potentially destabilizing factor for the Brazilian Real. The August meeting of the BCB is looking more and more like the date for a first rate cut. At the same time, the Fed's rate cut expectations are being pushed further into the future. No wonder the USD/BRL exchange rate is trending higher.”
“However, if discussions about inflation targeting leave even the slightest doubt that the government is trying to influence monetary policy in this way, BRL weakness could quickly take on much greater proportions.”
EUR/USD has today sunk to its lowest levels since mid-March. Economists at Rabobank discuss the pair’s outlook for the coming weeks.
USD is likely to find support amid risk-averse environment
“The currency pair is comfortably on course for hitting our H2 target of EUR/USD 1.06.”
“The market is already comfortably priced for further rate hikes and moderating price data and the threat that the Eurozone is facing stagnation in H2 suggest that the EUR can sink further vs. the USD in the coming weeks.”
“The risk that the US may fall in recession this year, combined with a disappointing recovery in China and stagnation risks in the Eurozone do not bode well for risk appetite. In this environment the USD is likely to find support.”
Gold price recovers after slumping to two-month low. Econmists at Commerzbank discuss XAU/USD outlook.
US Dollar is priced at its highest level since mid-March
“The market apparently still sees a small risk that the compromise found at the weekend to raise the debt ceiling in the US will not pass Congress. Voting is set to take place in the House of Representatives today; afterwards the Senate will need to give its approval.”
“The Fed Fund Futures are still pricing in another 25 bps Fed rate increase at the next meeting in June with a probability of roughly 60%. A rate hike on this scale is still fully priced in at one of the next two meetings. In the market’s view, this is likely to be reversed again by year’s end. Against this backdrop, the Gold price has been showing relative strength of late, especially as the US Dollar is priced at its highest level since mid-March.”
- JOLTS Job Openings in the US rose modestly in April.
- US Dollar Index posts strong daily gains above 104.50.
The data published by the US Bureau of Labor Statistics (BLS) revealed on Wednesday that the number of job openings on the last business day of April stood at 10.1 million, compared to 9.74 million in March. This reading came in higher than the market expectation of 9.37 million.
"Over the month, the number of hires changed little at 6.1 million. Total separations decreased to 5.7 million," the BLS noted in its publication. "Within separations, quits (3.8 million) changed little, while layoffs and discharges (1.6 million) decreased."
Market reaction
The US Dollar gathered strength against its rivals after this report and the US Dollar Index was last seen rising 0.5% on the day at 104.58.
- GBP/USD reverses an intraday dip amid a modest USD pullback from over a two-month high.
- The disappointing release of the Chicago PMI prompts some profit-taking around the USD.
- Bets for more Fed rate hikes and the risk-off impulse should act as a tailwind for the buck.
The GBP/USD pair attracts some dip-buying near the 1.2350-1.2345 area on Wednesday and climbs to the top end of its daily trading range during the early North American session. The pair is currently placed around the 1.2400 mark, below the 50-day Simple Moving Average (SMA) hurdle tested the previous day.
The US Dollar (USD) trims a part of its intraday gains to the highest level since mid-March in reaction to the disappointing release of the Chicago PMI, which fell to 40.4 in May from the 48.6 previous. The British Pound, on the other hand, continues to draw some support from the possibility of additional interest rate hikes by the Bank of England (BoE), bolstered by stronger-than-expected consumer inflation figures released last week. This, in turn, lends some support to the GBP/USD pair, though the lack of follow-through buying warrants caution before positioning for an extension of the recent bounce from the 1.2300 neighbourhood, or a nearly two-month low set last Thursday.
Investors now seem convinced that the Federal Reserve (Fed) will keep interest rates higher for longer and have been pricing in another 25 bps lift-off at the next FOMC policy meeting in June. The bets were reaffirmed by the US Core PCE Price Index released on Friday, which indicated that inflation remains sticky. Apart from this, the risk-off impulse supports prospects for a further near-term appreciating move for the safe-haven buck and might contribute to capping any meaningful upside for the GBP/USD pair. The global risk sentiment takes a hit in the wake of weaker Chinese PMI prints, which adds to worries about a global economic downturn and benefits safe-haven assets.
The aforementioned fundamental backdrop warrants some caution for aggressive bullish traders ahead of important US macro releases scheduled at the beginning of a new month, including the closely-watched Nonfarm-Payrolls (NFP) on Friday. In the meantime, a generally weaker tone around the equity markets might continue to act as a tailwind for the Greenback and keep a lid on any meaningful upside for the GBP/USD pair, at least for the time being.
Technical levels to watch
Bank of England (BoE) Monetary Policy Committee member Catherine Mann noted on Wednesday that the gap between the headline and core inflation in the UK is more persistent than in the US and the Euro area, as reported by Reuters.
Mann further added that firms will use it if they have a high pricing power and said that they will remain on a path that has an "awful a lot of volatility."
Market reaction
GBP/USD edged slightly higher with the immediate reaction to these comments. As of writing, the pair was trading at 1.2380, where it was still down 0.3% on a daily basis.
- USD/TRY extends the sharp advance to the vicinity of 20.80.
- The lira remains well on the defensive and approaches 21.00.
- President Erdogan is expected to announce a cabinet reshuffle.
Another day, another record low of the Turkish lira vs. the greenback, this time prompting USD/TRY to trade at shouting distance from the 20.80 zone.
USD/TRY looks at domestic politics
USD/TRY maintains the bullish move unchanged and approaches the round level at 21.00, as market participants continue to digest Erdogan’s victory at Sunday’s elections and latest news of potential changes to his cabinet.
On the latter, and according to officials, it is highly likely that M. Simsek, the former economy chief who is well-respected by financial markets for his orthodox policy expertise, will be appointed to the cabinet, potentially as either the finance minister or a vice president.
Some positive news from the calendar showed the economy expanded more than estimated by 4.0% YoY in the January-March period.
USD/TRY key levels
So far, the pair is gaining 1.45% at 20.6919 and faces the next hurdle at 20.7372 (all-time high May 31) followed by 21.00 (round level). On the downside, a break below 19.4286 (55-day SMA) would expose 19.1559 (100-day SMA) and finally 18.8321 (200-day SMA).
Eurostat will release the preliminary estimate of Eurozone Harmonised Index of Consumer Prices (HICP) data for May on Thursday, June 1 at 09:00 GMT and as we get closer to the release time, here are the expectations forecast by the economists and researchers of four major banks regarding the upcoming EU inflation print.
Headline HICP is expected to decelerate at 6.3% year-on-year vs. 7.0% in April and annual core HICP is seen softening marginally to 5.5% against the former release of 5.6%. If so, headline would be the lowest since February 2022 and would also be the first deceleration in core since June 2022.
Commerzbank
“Inflation is expected to have fallen from 7.0% in April to 6.0% in May. Half of the decline is due to lower energy prices. The price correction for food pushed down the inflation rate by an estimated 0.3 percentage points. However, the inflation rate excluding energy and food is also expected to have fallen by 0.2 percentage points to 5.4% in May. The main reason for this is the introduction of the 49-Euro ticket for regional public transport in Germany.”
Nomura
“We forecast headline Euro-area HICP inflation to fall to 6.2% YoY in May (0.8ppt lower than in April), and core HICP inflation to remain unchanged at 5.6% YoY. Core price momentum is likely to remain strong enough to unnerve the ECB. We think it will remain concerningly high owing to strong labour market pressures, revived inflation expectations and survey evidence of continued upward inflationary pressures. We think a robust core inflation print lends support to our forecast for two further 25 bps hikes from the ECB at its next meetings, bringing its terminal rate to 3.75%.”
SocGen
“We expect the May inflation data to deliver another massive decline in headline inflation from 7% yoy in April to 6% in May. Meanwhile, we think easing goods inflation will help core inflation fall from 5.6% to 5.5%, with a downside risk of 5.4% – which is set to increase the pressure on the ECB to do more rate hikes.”
Citi
“Headline inflation should make another major step down in May as base effects in energy kick in, down to 6.3% from 7.0% in April. We project core HICP inflation to also have eased from 5.6% to 5.5% YoY, with a sub-trend 0.2% MoM gain in seasonal adjusted terms, with temporary factors behind the drop. We though see core CPI re-accelerating in June following the acceleration in negotiated wages in 1Q to 4.3% and likely to pick up further in 2Q.”
"The residential real estate market appears to be rebounding," Federal Reserve (Fed) Governor Michelle Bowman said on Wednesday and added the levelling out of home prices will have implications for the Fed's fight to lower inflation, per Reuters.
"The pandemic-related surge of homebuilding and renovation has moderated but it's important to understand the long-term impact on family formation, housing demand," Bowman further elaborated.
Market reaction
These comments don't seem to be having a noticeable impact on the US Dollar's valuation. As of writing, the US Dollar Index was up 0.33% on the day at 104.40.
EUR/USD slides below 1.07. Economists at Scotiabank expect the pair to remain under downside pressure.
Limited scope for EUR rebounds from here
“Market expectations for ECB hikes have been pared marginally but 2Y EZ-US spreads are widening again, providing the drive for a lower EUR (yield gap wider at – 172 bps, the widest since late Mar) and rather suggesting little opportunity for the EUR to rebound at this point.
A clearer loss of support in the low 1.07 range will leave little in the way of a deeper EUR slide towards 1.05 in the next few weeks.
Bearish, short-term trend momentum signals suggest limited scope for EUR rebounds from here (look for resistance in the low/mid 1.07s).”
- Silver climbs to a one-week high on Wednesday, albeit lacks follow-through.
- The technical setup warrants some caution before placing fresh bullish bets.
- A sustained move beyond the $23.70-75 area would negate the bearish bias.
Silver attracts fresh buying following the previous day's two-way price moves and climbs to a one-week high, around the $23.50 area on Wednesday. The white metal, however, struggles to capitalize on the move or find acceptance above the 100-day Simple Moving Average (SMA) and retreats to the $23.30 region during the early North American session.
Oscillators on the daily chart, meanwhile, have been recovering from lower levels, though are still holding in the negative territory. Hence, any subsequent move up is more likely to confront stiff resistance near the $23.70-$23.75 area, or the 38.2% Fibonacci retracement level of the March-May rally. A sustained strength beyond the said barrier will suggest that the recent pullback from over a one-year high has run its course and shift the bias in favour of bullish traders.
The XAG/USD might then surpass the $24.00 round-figure mark and accelerate the momentum towards the next relevant hurdle near the $24.20-$24.25 region en route to the $24.50-$24.60 strong horizontal support breakpoint. The latter coincides with the 23.6% Fibo. level, above which a fresh bout of a short-covering should allow bullish traders to reclaim the $25.00 psychological mark. The upward trajectory could get extended towards the $25.30-$25.35 supply zone.
On the flip side, the 50% Fibo. level, just below the $23.00 round figure, now seems to protect the immediate downside ahead of the monthly low, around the $22.70-$22.65 region. Some follow-through selling will be seen as a fresh trigger for bearish traders and drag the XAG/USD below the 61.8% Fibo. level, around the $22.25 region, towards the $22.00 mark.
Silver daily chart
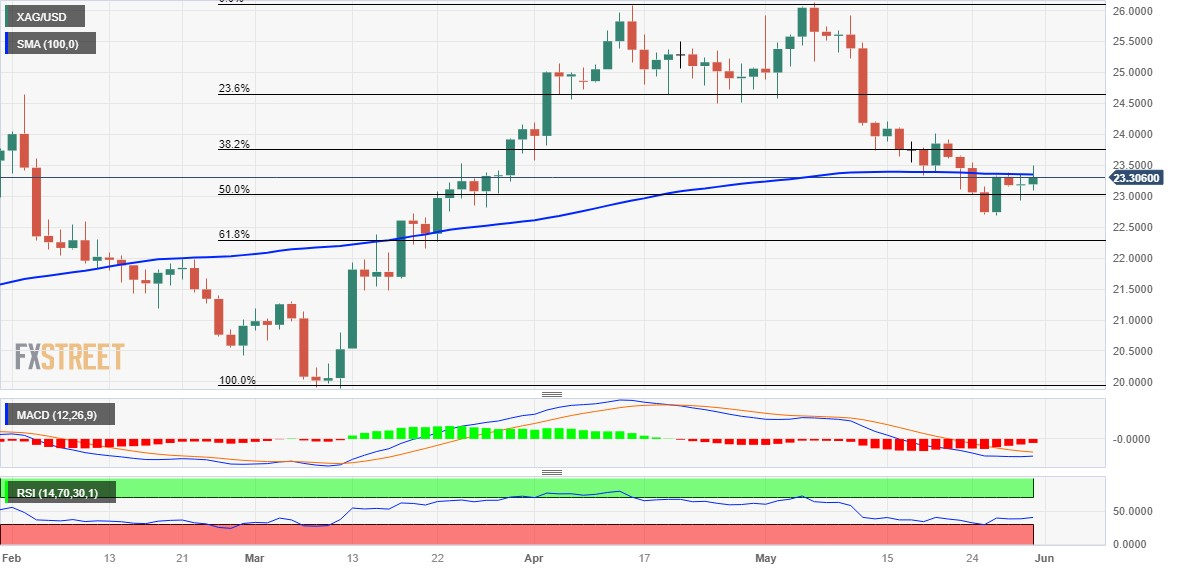
Key levels to watch
GBP/USD holds support in mid-1.23 zone. Economists at Scotiabank analyze the pair’s technical outlook.
Resistance stands at 1.2450
“The technical damage to the Pound thus far is limited.”
“Cable is consolidating yesterday’s gains rather than reversing them at this point and the early week break above short-term trend resistance (now support) at 1.2355 is just about holding. Short-term support extends to the 1.2335 level intraday but while resistance stands at 1.2450.”
“Weakness through 1.2335 leaves 1.23 exposed and will bolster the potential for Sterling to drop back to the 1.21 area.”
- Oil price spirals lower as traders deleverage ahead of the key vote to decide whether the US should raise its debt limit.
- A growing number of Republican Congressmen especially, have voiced their disapproval of the deal and said they intend to vote it down.
- Mixed messaging from key OPEC+ members ahead of the June 4 meeting adds to the uncertainty.
Oil price tumbles on Wednesday as doubts grow over whether the deal to raise the US debt ceiling will get voted through by Congress. A group of rebel Republicans and some Democrats too have warned they may vote against the deal. If it fails to pass and the US defaults on its obligations, financial chaos is expected, hitting Oil demand and lowering prices. That said, the US Dollar could also suffer – a positive for Oil, which is priced mainly in USD. Uncertainty over the outcome of OPEC+’s next meeting and mixed messaging from key members adds to the opaque outlook.
At the time of writing, WTI Oil is trading in the upper $67s and Brent Crude Oil in the lower $72s.
Oil news and market movers
- Oil price loses ground as investors question whether the tentative agreement to extend the debt limit, reached by President Joe Biden and Republican House Speaker Kevin McCarthy over the weekend, will win enough votes in Congress to pass into law.
- The House of Representatives is expected to vote on the deal on Wednesday evening before it goes to the Senate for the final vote.
- Several House Republicans have voiced displeasure at the idea of increasing the country’s already gigantic debt pile. Some Democrats are also opposed to the bill because it cuts benefits. Democrat Congressman Richie Torres, for example, has criticized cuts to disability benefits.
- Expectations that an eleventh-hour agreement will be reached on the debt ceiling as well as robust US macroeconomic data have increased market expectations that the Federal Reserve (Fed) will have to raise interest rates to combat rising inflation expectations – bullish for the US Dollar; bearish for Oil.
- At the time of writing, the CME FedWatch tool shows the odds continue to favor (by around 60%) the Fed raising interest rates by 0.25% at their meeting on June 14.
- Oil traders await the outcome of the next OPEC+ meeting on June 4, when the possibility of production cuts has been mooted.
- Two of OPEC+’s largest members, however, seem to be giving divergent messages over what might be decided.
- Saudi Oil Minister Prince Abdulaziz bin Salman seemed to imply OPEC+ might cut production quotas last Tuesday, May 24, when he warned speculators (interpreted as short-sellers) to “watch out”, and expressed support for OPEC’s October decision to cut supply.
- On the other hand, Russia’s Energy Minister Alexander Novak, played down the idea of production cuts, saying “I don't think that there will be any new steps, because just a month ago certain decisions were made regarding the voluntary reduction of oil production by some countries.”
Crude Oil Technical Analysis: Price falls back in line with long-term downtrend
WTI Oil price paints more red on the charts as it falls back in line with the dominant downtrend, which has made successive lower lows since July 2022. As the old adage goes, “the trend is your friend until the bend at the end,” which given it is bearish favors short sellers. WTI Oil is trading below all the major daily and weekly Simple Moving Averages (SMAs) and is now also testing the 200-week SMA at $66.90.
-638211337448123225.png)
WTI US Oil: Weekly Chart
The potentially bullish right-angled triangle, which formed during May and is shown by the dotted lines on the daily chart below, failed to breakout higher and instead broke lower.
-638211337986735892.png)
WTI US Oil: Daily Chart
Oil price has decisively broken below the May 22 lows of $70.65 as well as the $69.40 May 15 lows. Only the 200-week SMA now stands in the way of further losses. If it breaks too, it could lead to further weakness down to the year-to-date (YTD) lows of $64.31.
A break below the YTD lows would reignite the downtrend, with the next target at around $62.00, where trough lows from 2021 will come into play, followed by support at $57.50.
Oil price needs to climb back above the $74.70 May 24 highs to raise doubts about the dominant bearish trend.
Such a break might lead to a potential target in the $79.70s, which roughly coincides with the 200-day SMA and the main trendline for the bear market, heightening its importance as a key resistance level.
The long hammer Japanese candlestick pattern that formed at the May 4 (and YTD) lows is a sign that Oil price may have formed a strategic bottom at that level.
WTI Oil FAQs
What is WTI Oil?
WTI Oil is a type of Crude Oil sold on international markets. The WTI stands for West Texas Intermediate, one of three major types including Brent and Dubai Crude. WTI is also referred to as “light” and “sweet” because of its relatively low gravity and sulfur content respectively. It is considered a high quality Oil that is easily refined. It is sourced in the United States and distributed via the Cushing hub, which is considered “The Pipeline Crossroads of the World”. It is a benchmark for the Oil market and WTI price is frequently quoted in the media.
What factors drive the price of WTI Oil?
Like all assets, supply and demand are the key drivers of WTI Oil price. As such, global growth can be a driver of increased demand and vice versa for weak global growth. Political instability, wars, and sanctions can disrupt supply and impact prices. The decisions of OPEC, a group of major Oil-producing countries, is another key driver of price. The value of the US Dollar influences the price of WTI Crude Oil, since Oil is predominantly traded in US Dollars, thus a weaker US Dollar can make Oil more affordable and vice versa.
How does inventory data impact the price of WTI Oil
The weekly Oil inventory reports published by the American Petroleum Institute (API) and the Energy Information Agency (EIA) impact the price of WTI Oil. Changes in inventories reflect fluctuating supply and demand. If the data shows a drop in inventories it can indicate increased demand, pushing up Oil price. Higher inventories can reflect increased supply, pushing down prices. API’s report is published every Tuesday and EIA’s the day after. Their results are usually similar, falling within 1% of each other 75% of the time. The EIA data is considered more reliable, since it is a government agency.
How does OPEC influence the price of WTI Oil?
OPEC (Organization of the Petroleum Exporting Countries) is a group of 13 Oil-producing nations who collectively decide production quotas for member countries at twice-yearly meetings. Their decisions often impact WTI Oil prices. When OPEC decides to lower quotas, it can tighten supply, pushing up Oil prices. When OPEC increases production, it has the opposite effect. OPEC+ refers to an expanded group that includes ten extra non-OPEC members, the most notable of which is Russia.
- EUR/GBP drifts lower for the fourth straight day and hits a fresh YTD low on Wednesday.
- Softer consumer inflation figures from France and Germany weigh on the shared currency.
- Expectations for more BoE rate hikes contribute to the British Pound’s outperformance.
The EUR/GBP cross prolongs its bearish trend for the fourth successive day and drops to a fresh YTD low during the first half of trading on Wednesday. Spot prices, however, manage to rebound a few pips during the European session and currently trade around the 0.8635 region, down 0.15% for the day.
The shared currency drifts lower on the back of softer consumer inflation figures from the Eurozone's two largest economies - Germany and France - and turns out to be a key factor weighing on the EUR/GBP cross. In fact, the headline German CPI missed consensus estimates and decelerated to the 6.1% YoY rate in May from 7.2% in the previous month. Earlier the French CPI also surprised to the downside and fell 0.1% MoM in May, representing a sharp contraction from the previous month's reading of 0.6%. This fuels speculations that the European Central Bank (ECB) could slow the pace of its policy tightening, which, in turn, is seen undermining the Euro.
In contrast, investors remain anxious over the possibility of additional interest rate hikes by the Bank of England (BoE), bolstered by stronger-than-expected consumer inflation figures released last week. This further contributes to the British Pound's relative outperformance against its European counterpart and is seen as another factor dragging the EUR/GBP cross lower. That said, a strong pickup in the US Dollar (USD) is holding back the GBP bulls from placing aggressive bets and helping limit losses for the cross, at least for the time being.
Even from a technical perspective, the Relative Strength Index (RSI) on the daily chart has moved on the verge of breaking into the oversold territory. This further makes it prudent to wait for some near-term consolidation or a modest bounce before positioning for any further near-term depreciating move. The aforementioned fundamental backdrop, however, seems tilted firmly in favour of bearish traders, suggesting that any attempted recovery might still be seen as a selling opportunity and runs the risk of fizzling out rather quickly.
Technical levels to watch
- Canadian economy grew at a stronger pace than expected in Q1.
- USD/CAD stays in positive territory above 1.3600 after the data.
Canada's real Gross Domestic product (GDP) grew at an annual rate of 3.1% in the first quarter, Statistics Canada reported on Wednesday. This reading followed the 0.1% contraction recorded in the last quarter of 2022 and came in better than the market expectation for an expansion of 2.5%.
On a quarterly basis, real GDP expanded by 0.8%, compared to analysts' estimate of 0.4%.
"Favourable international trade and growth in household spending were moderated by slower inventory accumulations as well as declines in housing investment and business investment in machinery and equipment," Statistics Canada explained in its publication.
Market reaction
USD/CAD retreated modestly from daily highs with the immediate reaction to this report and was last seen trading at 1.3638, gaining 0.25% on the day.
A correction in the Dollar following a long weekend in many parts of the world proved rather short-lived. Economists at ING add poor Chinese data to the bullish Dollar mix.
China's data keep the Dollar attractive
“The risk-off sentiment seems to be primarily driven by disappointing manufacturing PMIs out of China, as the official survey showed a drop to 48.8 (contractionary territory), the lowest since December 2022.”
“Chinese growth sentiment remains a key channel to a rotation from the dollar to European currencies, and the recent cooling off of the Chinese recovery narrative is contributing to delaying such rotation. When combined with the ongoing hawkish repricing of Fed hawkish expectations, we think the Dollar can hold on to gains for the time being.”
- EUR/USD slips back to the 1.0660 region, or multi-week lows.
- Further losses below 1.0600 exposes the March low.
EUR/USD quickly leaves behind Tuesday’s decent advance and resumes the downtrend on Wednesday.
The pair remains under heavy pressure and a breach of the May low at 1.0658 (May 31) could open the door to a test of the round level at 1.0600 prior to the March low at 1.0516 (March 15).
A deeper pullback to the 2023 low at 1.0481 (January 6) would likely need a sharp deterioration of the outlook, which appears not favoured for the time being.
Looking at the longer run, the constructive view remains unchanged while above the 200-day SMA, today at 1.0492.
EUR/USD daily chart
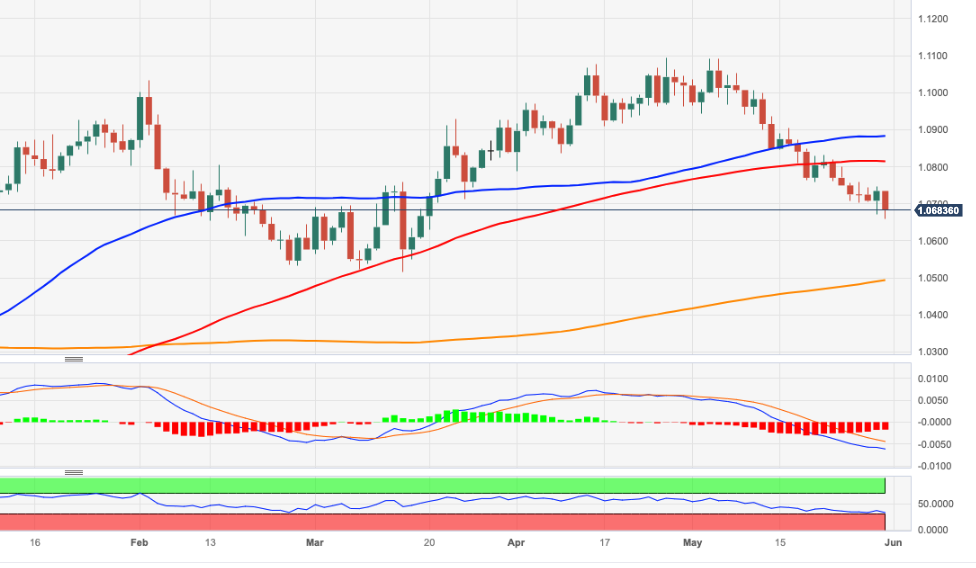
- Inflation in Germany came in lower than expected in May.
- EUR/USD stays in negative territory below 1.0700 after the data.
Inflation in Germany, as measured by the change in the Consumer Price Index (CPI), declined to 6.1% on a yearly basis in May from 7.2% in April. This reading came in below the market expectation of 6.5%. On a monthly basis, the CPI fell 0.1% following April's 0.4% increase.
The annual Harmonised Index of Consumer Prices (HICP), the European Central Bank's (ECB) preferred gauge of inflation, rose 6.3% in the same period, compared to 7.6% in April and analysts' estimate of 6.8%.
Market reaction
The EUR/USD pair showed no immediate reaction to soft German inflation figures and was last seen losing 0.5% on a daily basis at 1.0682.
CAD slips back to the mid-1.36s ahead of GDP data. Economists at Scotiabank analyze how Canadian growth data could impact the Loonie.
April’s flash estimate may provide a ‘heads-up’ for slower growth ahead
“Growth data is expected to slow somewhat in Mar (-0.1% MoM) relative to Feb’s result but Q1 overall has been shaping up to be relatively strong (2.5% growth SAAR, close to the Apr MPR’s estimate of 2.3%).”
“Apr’s flash estimate may provide a ‘heads-up’ for slower growth ahead (recall the MPR anticipated GDP slowing to 1.0% SAAR in Q2 after a strong start to the year). That would not detract from our view that a little more ‘insurance’ tightening from the BoC is appropriate amid sticky inflation and signs that the housing market is taking off again but softer growth data might add to near-term pressure on the CAD.”
- DXY keeps the bullish mood well in place and advances past 104.60.
- Extra gains could extend to the 200-day SMA near 105.60.
DXY adds to Tuesday’s advance and clinches fresh multi-week tops in the 104.60/65 band on Wednesday.
In the near term, extra gains appear on the cards. That said, the surpass of the May high at 104.63 (May 31) should put a potential visit to the key 200-day SMA, today at 105.63, back on the radar prior to the 2023 top of 105.88 (March 8).
Looking at the broader picture, while below the 200-day SMA the outlook for the index is expected to remain negative.
DXY daily chart
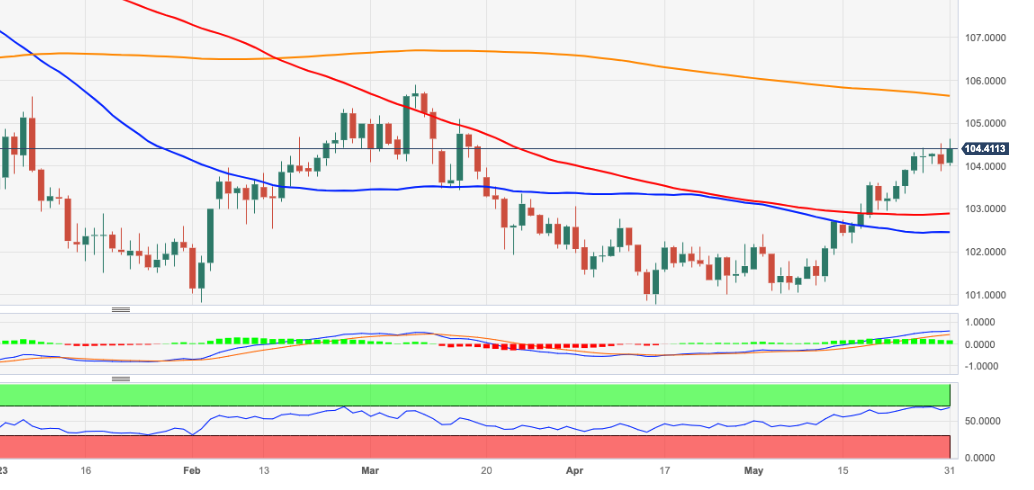
On a year-to-date and quarter-to-date basis, the Yen is the second worst performing G10 currency with only NOK performing worse. Economists at MUFG Bank analyze USD/JPY outlook.
Strong NFP would likely lead to further USD/JPY buying
“The debt ceiling issue has been resolved and a strong jobs report at the end of the week would likely see markets price more fully a Fed rate hike on 13th June that would likely then lead to further USD/JPY buying.”
“If events fuel another quick move to the 145 level, above there would certainly be in the range of intervention. It would in addition serve to highlight another unwelcome by-product of YCC and could play a role in swaying Governor Ueda to scrap YCC later this year.”
- EUR/JPY adds to the weekly corrective pullback and pierces 149.00.
- The resumption of the bullish bias should retarget 151.00.
EUR/JPY extends the drop for the third session in a row and briefly tests the area below the 149.00 yardstick on Wednesday.
Despite the ongoing retracement, further upside appears a plausible near-term scenario, and a convincing breakout of the round level at 151.00 could encourage the cross to confront the 2023 top at 151.61 (May 2) in the not-so-distant future.
So far, further upside looks favoured while the cross trades above the 200-day SMA, today at 143.82.
EUR/JPY daily chart
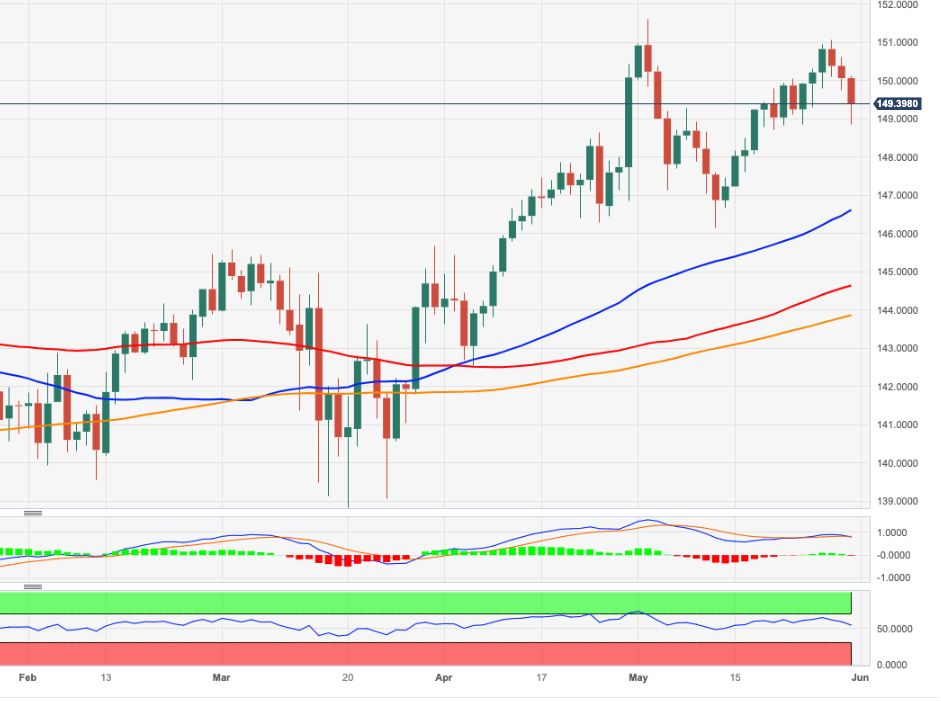
Canadian GDP overview
Wednesday's economic docket highlights the release of monthly Canadian GDP growth figures for March, due to be published at 12:30 GMT. Statistics Canada will also release the quarterly growth figures, making this more significant than the ones including only monthly data. Consensus estimates suggest that the economy contracted by 0.1% during the reported month and registered a 0.4% growth in the first quarter of 2023. On an annualized basis, the economy is anticipated to have expanded by 2.9%.
How could it affect USD/CAD?
Ahead of the key macro release, the USD/CAD pair scales higher for the second successive day and climbs closer to the monthly peak touched last week. Crude Oil prices add to the overnight steep losses and dive to a fresh multi-week low on Wednesday, which, in turn, is seen undermining the commodity-linked Loonie and acting as a tailwind for the major. A softer Canadian GDP print could exert additional downward pressure on the domestic currency and pave the way for a further near-term appreciating move for the major.
The market reaction to a stronger reading, meanwhile, is likely to be limited amid resurgent US Dollar (USD) demand, bolstered by expectations that the Federal Reserve (Fed) will keep rates higher for longer. This, along with worries about a global economic slowdown, might continue to drive some haven flows towards the buck and suggests that the path of least resistance for the USD/CAD pair is to the upside. Hence, any intraday downtick might still be seen as a buying opportunity and remain cushioned, for the time being.
Key Notes
• USD/CAD climbs to mid-1.3600s, eyes monthly top ahead of Canadian GDP/US macro data
• USD/CAD Outlook: Move beyond mid-1.3600s to set the stage for further gains
• USD/CAD: Loonie to benefit at best moderately on significant Canadian GDP data surprise – Commerzbank
About the Canadian GDP
The Gross Domestic Product released by Statistics Canada is a measure of the total value of all goods and services produced by Canada. The GDP is considered a broad measure of Canadian economic activity and health. Generally speaking, a rising trend has a positive effect on the CAD, while a falling trend is seen as negative (or bearish) for the CAD.
Since UK inflation rates for April surprised on the upside last week Sterling has been on the up. Economists at Commerzbank note downside risks for the GBP, though.
Rate hikes to the extent as the market is currently expecting seem exaggerated
“It is quite possible that we will continue to see data surprises over the coming weeks and that inflation turns out to be more stubborn than the BoE is currently expecting. As long as this risk remains in place the market will see no reason to change its rate hike expectations.”
“The latest data publications no doubt provide arguments for further rate hikes. For that reason, Sterling will remain supported short-term. Rate hikes to the extent as the market is currently expecting seem exaggerated though as we assume that sooner or later the data will point to falling price pressure and a further weakening of the economy.”
“We therefore see the risk of a correction of the rate expectations and thus downside risks for Sterling.”
- US Dollar has regathered its strength mid-week amid risk aversion.
- US Dollar Index reached its highest level in over two months above 104.50 on Wednesday.
- US debt-limit bill advanced to House floor for a debate and a vote.
The US Dollar (USD) has started to gather strength against its major rivals mid-week amid a negative shift witnessed in risk perception following Tuesday's uninspiring performance. The US Dollar Index, which tracks the USD's valuation against a basket of six major currencies, turned north early Wednesday and reached its highest level since mid-March above 104.50.
The USD's performance is likely to continue to be impacted by risk perception in the second half of the day with investors keeping a close eye on headlines surrounding the debt-limit bill.
On Tuesday, the House Rules Committee advanced the debt-ceiling bill to the House by an uncomfortably close vote of 7 to 6, causing investors to adopt a cautious stance. Several Republican lawmakers voiced their oppositions against the bill, which will be debated in the House floor and voted on Wednesday before moving to a final Senate vote.
Daily digest market movers: US Dollar rally gathers steam on Wednesday
- Reflecting the risk-averse market atmosphere, US stock index futures trade in negative territory on Wednesday.
- In an interview with the Financial Times, Cleveland Federal Reserve (Fed) Bank President Loretta Mester said that she doesn't necessarily see a compelling reason for pausing rate increases amid a "really embedded, stubborn inflationary pressure.”
- The benchmark 10-year US Treasury bond yield continues to push lower for on Wednesday and was last seen losing more than 1% on a daily basis below 3.7%. Nevertheless, the CME Group FedWatch Tool shows that markets are pricing in a nearly 70% probability of the Fed raising its policy rate by 25 basis points (bps) in June.
- The US Bureau of Labor Statistics will release the JOLTS Job Openings data for April on Wednesday. On Thursday, the ADP's private sector employment report and the ISM's Manufacturing PMI survey will be featured in the US economic docket.
- Previewing the ADP data, "not only have ADP's figures jumped from miss to beat and the other way around, but these differences have also been significant, especially in recent months," said FXStreet Analyst Yohay Elam. "After leaping to the highest level since July 2022 in the latest April publication, the upcoming May report could be weak."
- Consumer sentiment in the US weakened slightly in May with the Conference Board's (CB) Consumer Confidence Index edging lower to 102.3 from 103.7 in April (revised from 101.3). The Present Situation Index declined to 148.6 from 151.8 and the Consumer Expectations Index stayed virtually unchanged at 71.5. Finally, the one-year consumer inflation expectations ticked down to 6.1% in May from 6.2% in April.
- House prices in the US rose by 0.6% on a monthly basis in March, the monthly data published by the US Federal Housing Finance Agency showed on Tuesday. This reading followed February's increase of 0.7% (revised from 0.5%) and came in better than the market expectation of +0.2%.
- On Sunday, US President Joe Biden and Republican House Speaker Kevin McCarthy reached an agreement to temporarily suspend the debt-limit to avoid a US debt default. The House of Representatives and Senate still need to approve the deal, which will suspend the $31.4 trillion debt-ceiling until January 1, 2025, in coming days.
- The US Bureau of Economic Analysis (BEA) reported on Friday that inflation in the US, as measured by the change in Personal Consumption Expenditures (PCE) Price Index, rose to 4.4% on a yearly basis in April from 4.2% in March.
- The annual Core PCE Price Index, the Fed's preferred gauge of inflation, edged higher to 4.6%, compared to the market expectation of 4.6%.
- Further details of the BEA's publication showed that Personal Income increased 0.4% on a monthly basis while Personal Spending rose 0.8%.
Technical analysis: US Dollar Index turns bullish following Tuesday's decline
The US Dollar Index (DXY) managed to close above the key technical level of 104.00 (Fibonacci 23.6% retracement of the November-February downtrend) on Tuesday, reflecting buyers' willingness to defend that support. In case the DXY starts using 104.50 (static level) as support, it could target 105.00 (psychological level, static level) and 105.60 (200-day SMA, Fibonacci 38.2% retracement) next.
On the downside, 104.00 stays intact as key support. A daily close below that level could attract USD sellers and open the door for an extended slide toward 103.00, where the 100-day Simple Moving Average (SMA) is located.
It's also worth noting that the Relative Strength Index (RSI) indicator on the daily chart stays near 70, suggesting that the DXY could correct lower in the short term before the next leg higher.
How does Fed’s policy impact US Dollar?
The US Federal Reserve (Fed) has two mandates: maximum employment and price stability. The Fed uses interest rates as the primary tool to reach its goals but has to find the right balance. If the Fed is concerned about inflation, it tightens its policy by raising the interest rate to increase the cost of borrowing and encourage saving. In that scenario, the US Dollar (USD) is likely to gain value due to decreasing money supply. On the other hand, the Fed could decide to loosen its policy via rate cuts if it’s concerned about a rising unemployment rate due to a slowdown in economic activity. Lower interest rates are likely to lead to a growth in investment and allow companies to hire more people. In that case, the USD is expected to lose value.
The Fed also uses quantitative tightening (QT) or quantitative easing (QE) to adjust the size of its balance sheet and steer the economy in the desired direction. QE refers to the Fed buying assets, such as government bonds, in the open market to spur growth and QT is exactly the opposite. QE is widely seen as a USD-negative central bank policy action and vice versa.
- Gold price oscillates in a narrow range just below a one-week high touched this Wednesday.
- The emergence of fresh US Dollar buying and hawkish Federal Reserve expectations cap gains.
- Economic woes overshadow the US debt ceiling optimism and limit losses for the XAU/USD.
Gold price struggles to capitalize on the overnight bounce from the $1,932 region, or its lowest level since March 17 and seesaws between tepid gains/minor losses through the first half of the European session on Wednesday. The XAU/USD currently trades around the $1.960 level, nearly unchanged for the day and just below a one-week high touched earlier today.
Stronger US Dollar weighs on Gold price
A combination of supporting factors lifts the US Dollar (USD) to over a two-month high, which, in turn, acts as a headwind for Gold price. The legislation brokered by United States (US) President Joe Biden and House Speaker Kevin McCarthy to lift the $31.4 trillion debt ceiling and achieve new federal spending cuts passed an important hurdle late on Tuesday. In fact, the bill cleared its first procedural hurdle on Tuesday as the House Rules Committee voted 7-6 to advance it to the floor for a debate and a final passage vote on Wednesday. This, along with expectations that the Federal Reserve (Fed) will likely raise interest rates, provides a goodish lift to the Greenback.
Bets for more rate hikes by Federal Reserve further cap XAU/USD
Investors now seem convinced that the US central bank will keep interest rates higher for longer and are now pricing in a greater chance of another 25 bps lift-off at the next Federal Open Market Committee (FOMC) policy meeting in June. The bets were lifted by the US Personal Consumption Expenditures Price Index - the Fed's preferred inflation gauge - released on Friday, which indicated that inflation remains sticky. This further contributes to capping the upside for the non-yielding Gold price. That said, the risk-off impulse is seen lending some support to the safe-haven precious metal and helping limit the downside, warranting caution for bearish traders.
The risk-off impulse lends support to the safe-haven Gold price
The market sentiment remains fragile amid worries about slowing global economic growth, particularly in China. The National Bureau of Statistics (NBS) reported that China's factory activity shrank faster than expected and the official Manufacturing PMI fell to a five-month low of 48.8 in May. Furthermore, service sector activity expanded at the slowest pace in four months and the official non-manufacturing PMI fell to 54.5 in May from 56.4 previous, fueling recession fears and tempering investors' appetite for riskier assets. The anti-risk flow, meanwhile, leads to a further decline in the US Treasury bond yields, which caps the USD and could benefit the XAU/USD.
Traders now look to US macro data, Fedspeaks for fresh impetus
The aforementioned mixed fundamental backdrop is more likely to hold back traders from positioning for an extension of the overnight bounce from the 100-day Simple Moving Average (SMA) or the recent pullback from an all-time high touched earlier this month. Market participants now look forward to the US economic docket, featuring the release of the Chicago PMI and JOLTS Job Openings later during the early North American session. This, along with speeches by influential FOMC members and the US bond yields, will drive the USD demand. Apart from this, the broader risk sentiment could provide some meaningful impetus to Gold price.
Gold price technical outlook
From a technical perspective, any subsequent move up beyond the daily peak, around the $1,965 region, could attract fresh sellers and remain capped near the $1.980 region. The latter should act as a pivotal point, which if cleared could allow the Gold price to reclaim the $2.000 psychological mark. On the flip side, the $1,943 area seems to protect the immediate downside ahead of the 100-day Simple Moving Average (SMA) and the multi-month low, around the $1,932 region. A convincing break below the said support levels will be seen as a fresh trigger for bearish traders and drag the XAU/USD further towards the $1,900 round-figure mark
Key levels to watch
Economists at MUFG Bank discuss EUR/USD outlook.
Global growth concerns, weak inflation feed downside risks
“While global growth optimism continues to fade, the markets at the same time has removed nearly all of the monetary easing priced in the US by the end of the year. These developments are ideal for a strengthening US Dollar which looks set to extend further over the short-term.”
“Weaker inflation data now is unlikely to alter plans over the coming two meetings to hike twice by 25 bps so we don’t see weaker inflation as a negative for EUR at this point. But worsening global growth conditions are a clear Dollar positive which will help keep the USD well supported into the jobs data on Friday.”
Economists at Société Générale analyze USD/CNH technical outlook.
Recent pivot low at 7.05 should provide support
“USD/CNH has extended its phase of rebound after breaking out from the range since February. It has achieved projections near 7.11/7.12. An initial pullback is expected however recent pivot low at 7.05 should provide support.”
“If the pair establishes above 7.12, the up move could persist towards next potential hurdles at 7.17 and 7.22, the 76.4% retracement from last year.”
See: China’s expanding trade surplus with the US should encourage a stronger CNY and weaker USD – MUFG
- AUD/USD comes under intense selling pressure and dives to its lowest level since November.
- Disappointing Chinese PMI prints overshadow stronger Australian consumer inflation figures.
- A combination of factors lifts the USD to over a two-month high and exerts pressure on the pair.
The AUD/USD pair attracts fresh sellers following an early uptick to the 0.6535-0.6540 region on Wednesday and continues to lose ground through the first half of the European session. This marks the second successive day of downfall and drags spot prices to the lowest level since November 10, around the 0.6475 area in the last hour.
The Australian Dollar (AUD) did get a minor lift following the release of stronger domestic consumer inflation figures, which could force the Reserve Bank of Australia (RBA) to tighten its monetary policy further. In fact, RBA Governor Philip Lowe had warned earlier today that sticky prices could invite more rate hikes by the central bank. The AUD/USD pair, however, struggles to capitalize on the intraday uptick after the disappointing Chinese macro data sparked fears about a global economic slowdown.
The National Bureau of Statistics (NBS) reported this Wednesday that China's factory activity shrank faster than expected in May. Furthermore, business activity in China's service expanded at the slowest pace in four months. Apart from this, concerns about the worsening US-China ties overshadow the optimism over raising the US debt ceiling. This, in turn, tempers investors' appetite for perceived riskier assets, which, along with resurgent US Dollar (USD) demand, weigh on the risk-sensitive Aussie.
In fact, the USD Index (DXY), which tracks the Greenback against a basket of currencies, jumps to a fresh high since mid-March and remains well supported by expectations that the Federal Reserve (Fed) will keep interest rates higher for longer. In fact, the current market pricing indicates a greater chance of another 25 bps lift-off at the next FOMC policy meeting in June and the bets were reaffirmed by the stronger US Core PCE Price Index released on Friday, which showed that inflation remains sticky.
Apart from this, the risk-off impulse lends additional support to the safe-haven Greenback. Meanwhile, the global flight to safety leads to a further decline in the US Treasury bond yields, which might hold back the USD bulls from placing aggressive bets and help limit losses for the AUD/USD pair, at least for now. Nevertheless, the aforementioned fundamental backdrop suggests that the path of least resistance for spot prices is to the downside and any attempted recovery is likely to get sold into.
Moreover, sustained break and acceptance below the 0.6500 psychological mark validate the negative outlook. Market participants now look to the US economic docket, featuring the release of the Chicago PMI and JOLTS Job Openings data later during the early North American session. Traders will also take cues from speeches by influential FOMC members. This, along with the US bond yields and the broader risk sentiment, will drive the USD and provide some impetus to the AUD/USD pair.
Technical levels to watch
EUR/SEK continues to move higher. It is hard to put a limit to the rally in EUR/SEK at this stage, in the view of economists at ING.
Hard to halt the freefall
“The risk-off wave coming from China puts European currencies in a vulnerable position and SEK remains the favourite short in the region given the Riksbank's unsupportive narrative and other domestic issues.”
“It's hard to put a limit to the rally in EUR/SEK at this stage. Another acceleration in the unsupportive environment for high-beta currencies could easily see the pair trade around 11.70-11.85 before the end of the week.”
“We’ll need to see whether the Riksbank will step in with some threats of FX intervention at one point, although the latest comments did not point in that direction.”
European Central Bank (ECB) Vice President, Luis de Guindos, made some remarks on the central bank’s inflation outlook following inflation data from Spain, France and the German states.
Key quotes
Inflation data today and yesterday have been positive.
Victory over inflation is not there yet.
But the trajectory is correct.
Related reads
- EUR/USD dips to fresh 2-month lows near 1.0660
- ECB’s Muller: It is very likely that the ECB will hike by 25 bps more than once
Economists at Commerzbank discuss USD/JPY outlook.
Japanese officials will probably use a stricter tone over the coming weeks
“In view of the high inflation levels the best approach for supporting the Yen would be a reversal in monetary policy. However, the BoJ still seems quite a long way off doing that at present. To intervene in a situation like this, i.e. following a strategy of leaning against the wind, would probably simply accelerate the depreciation speed of the JPY.”
“If the US central bank sticks to its hawkish rhetoric with the market increasingly banking on a further Fed rate hike in June USD is likely to remain supported against JPY for now. So it is possible that Japanese officials will use a stricter tone over the coming weeks.”
- USD/CAD gains traction for the second straight day and draws support from a combination of factors.
- Bearish Oil prices undermine the Loonie and lend support amid the emergence of fresh USD buying.
- Traders now look forward to the Canadian Q1 GDP print and the US macro data for a fresh impetus.
The USD/CAD pair builds on the overnight bounce from the 1.3565 area, or a multi-day low and gains some follow-through traction for the second successive day on Wednesday. The pair maintains its bid tone through the early part of the European session and currently trades near the top end of its daily range, around the 1.3645 region.
A combination of factors assists the US Dollar (USD) to attract fresh buyers, which, in turn, acts as a tailwind for the USD/CAD pair. Investors seem convinced that the Federal Reserve (Fed) will keep interest rates higher for longer and have been pricing in a greater chance of another 25 bps lift-off at the June FOMC policy meeting. the bets were lifted by the US PCE Price Index data on Friday, which showed that inflation remains sticky. This, along with the risk-off impulse, further benefits the safe-haven buck.
The market sentiment remains fragile amid worries about slowing economic growth, particularly in China. The National Bureau of Statistics (NBS) reported this Wednesday that China's factory activity shrank faster than expected in May. Moreover, business activity in China's service expanded at the slowest pace in four months. This, along with concerns about the worsening US-China ties overshadow the optimism over raising the US debt ceiling and temper investors' appetite for perceived riskier assets.
A patchy economic recovery in the world's second-largest economy, meanwhile, raises concerns about fuel demand from the top oil importer China. This, in turn, drags Crude Oil prices to a nearly four-week low, which undermines the commodity-linked Loonie and provides an additional boost to the USD/CAD pair. Spot prices move well within the striking distance of the monthly peak touched last week as traders now look to important macro releases from Canada and the US for some meaningful impetus.
Wednesday's economic docket features the release of the Canadian Q1 GDP report, along with the Chicago PMI and JOLTS Job Openings data from the US later during the early North American session. Apart from this, speeches by influential FOMC members and the broader risk sentiment will drive the USD demand. Traders will further take cues from Oil price dynamics to grab short-term opportunities around the USD/CAD pair. Nevertheless, the aforementioned fundamental backdrop favours bullish traders.
Technical levels to watch
- EUR/USD resumes the decline and retests 1.0670/60.
- The greenback appears well bid and weighs on the risk complex.
- Germany Unemployment Rate held steady at 5.6% in May.
Sellers remain well in control of the sentiment around the European currency and now force EUR/USD to drop to 2-month lows near 1.0660 on Wednesday.
EUR/USD weaker on USD-buying, risk-off
EUR/USD extends the sell-off to multi-week lows in the proximity of the 1.0660 region amidst the stronger dollar and in response to disheartening prints from the Chinese calendar earlier on Wednesday.
Indeed, poor prints from the Chinese manufacturing and services sectors reinforce the idea of an uneven recovery in that economy and pour cold water over investors’ expectations of a rapid rebound.
Also failing to lend some support to the single currency appear comments from ECB Board member M. Müller, who advocated for at least two more (25 bps) rate hikes. In addition, he deemed "probably too optimistic" the idea of rate cuts early in 2024. His colleague L. de Guindos also argued that markets are absorbing QT in a positive and smooth way.
In the domestic docket, France’s flash Inflation Rate is expected to have contracted 0.1% MoM in May and risen 5.1% YoY. In Germany, the Unemployment Change increased by 9K people in May, and the Unemployment Rate remained unchanged at 5.6%. Later in the session, advanced German inflation figures will also take centre stage, along with the participation of President C. Lagarde in a Q&A session with students.
In the US, MBA Mortgage Applications are due along with the Fed’s Beige Book and speeches by FOMC members Harker, Jefferson, and Bowman.
What to look for around EUR
The sell-off in EUR/USD appears unabated and revisits the 1.0660 region, or 2-month lows, on Wednesday.
In the meantime, the pair’s price action is expected to closely mirror the behaviour of the US Dollar and will likely be impacted by any differences in approach between the Fed and the ECB with regards to their plans for adjusting interest rates.
Moving forward, hawkish ECB speak continues to favour further rate hikes, although this view appears to be in contrast to some loss of momentum in economic fundamentals in the region.
Key events in the euro area this week: Germany Unemployment Change, Unemployment Rate, Flash Inflation Rate, ECB Lagarde (Wednesday) – Germany Retail Sales/Final Manufacturing PMI, EMU Final Manufacturing PMI, Flash Inflation Rate, ECB Lagarde, ECB Accounts (Thursday).
Eminent issues on the back boiler: Continuation of the ECB hiking cycle in June and July (and September?). Impact of the Russia-Ukraine war on the growth prospects and inflation outlook in the region. Risks of inflation becoming entrenched.
EUR/USD levels to watch
So far, the pair is losing 0.66% at 1.0663 and faces initial contention at 1.0600 (round level) seconded by 1.0516 (low March 15) and finally 1.0481 (2023 low January 6). On the upside, a break above 1.0813 (100-day SMA) would target 1.0881 (55-day SMA) en route to 1.1000 (round level).
EUR/USD is back below 1.0700 after a very short-lived rebound. Economists at ING believe that the pair could challenge the 1.06 level.
Hard to push ECB rate expectations much higher
“One issue that the euro is facing at the moment is that markets are fully pricing in two more ECB rate hikes by September, and it would probably take a rather substantial upward surprise in inflation figures to push hawkish expectations beyond that point.”
“If anything, risks appear skewed towards some dovish repricing – and a negative Euro impact – today should France and Germany follow Spain in showing a faster-than-expected slowdown in inflation.”
“At this stage, and given ongoing USD strength, EUR/USD may soon test 1.0600.”
- NZD/USD dives to over a six-month low on Wednesday and seems vulnerable to sliding further.
- A combination of factors lifts the USD closer to over a two-month high and weighs on the pair.
- A slightly oversold RSI might hold back traders from placing fresh bearish bets and limit losses.
The NZD/USD pair comes under intense selling pressure on Wednesday and maintains its heavily offered tone through the early part of the European session. The pair is currently placed just below the 0.6000 psychological mark - its lowest since November 10 - and seems vulnerable to prolonging its recent bearish trend witnessed over the past three weeks or so.
The New Zealand Dollar (NZD) continues to be undermined by the Reserve Bank of New Zealand's (RBNZ) explicit signal last week that it was done with its most aggressive hiking cycle since 1999. The US Dollar (USD), on the other hand, climbs back closer to over a two-month high touched on Tuesday and turns out to be another factor exerting pressure on the NZD/USD pair for the second successive day.
Investors seem convinced that the US central bank will keep interest rates higher for longer and have been pricing in a greater chance of another 25 bps lift-off at the June FOMC meeting. The bets were lifted by the US PCE Price Index data on Friday, which showed that inflation remains sticky. Apart from this, a fresh wave of a global risk-aversion trade provides an additional boost to the safe-haven Greenback.
The market sentiment remains fragile amid worries about slowing global economic growth. The fears were further fueled by the disappointing Chinese macro data released this Wednesday. In fact, the National Bureau of Statistics (NBS) reported this Wednesday that China's factory activity shrank faster than expected in May. Furthermore, business activity in China's service expanded at the slowest pace in four months.
This, along with concerns about the worsening US-China ties overshadow the optimism over raising the US debt ceiling and temper investors' appetite for riskier assets, which further contributes to driving flows away from the risk-sensitive Kiwi. Meanwhile, the ongoing slide in the US Treasury bonds yields - led by the global flight to safety - could act as a headwind for the USD. Apart from this, a slightly oversold Relative Strength Index (RSI) on the daily chart might hold back bears from placing fresh bets around the NZD/USD pair.
Technical levels to watch
Here is what you need to know on Wednesday, May 31:
Market participants have turned cautious mid-week amid growing concerns over the US debt-limit bill facing resistance at both chambers of Congress after the House Rules Committee advanced it by a slim 7-6 margin on Tuesday. The US Dollar (USD) benefits from risk aversion mid-week ahead of JOLTS Job Openings data for April and Fedspeak. In the European session, Germany's Destatis will publish inflation data for May.
Reflecting the souring market mood, US stock index futures are down between 0.35% and 0.45%. The US Dollar Index edges higher toward 104.50 following Tuesday slide and the benchmark 10-year US Treasury bond yield is already losing 1% on the day below 3.7%.
During the Asian trading hours, the data from China revealed that the business activity in the manufacturing sector continued to contract at a slightly faster pace in May than in April with the NBS Manufacturing PMI falling to 48.8 from 49.2. In the same period, the Non-Manufacturing PMI declined to 54.5 from 56.4 but came in much higher than the market expectation of 50.7.
AUD/USD came under bearish pressure in the Asian session and the pair was last seen trading at its lowest level since early November below 0.6500. The data published by the Australian Bureau of Statistics revealed on Wednesday that the Consumer Price Index (CPI) rose 6.8% on a yearly basis in April, higher than 6.3% recorded in March. While testifying before the Senate Economics Legislation Committee, Reserve Bank of Australia (RBA) Governor Philip Lowe reiterated that entrenched inflation would lead to higher interest rates and unemployment but these comments failed to help the Aussie find a footing.
EUR/USD rose toward 1.0750 and closed in positive territory on Tuesday. The renewed USD strength, however, weighed on the pair early Wednesday and dragged it back below 1.0700. In Germany, the annual Harmonized Index of Consumer Prices is forecast to rise 6.8%, compared to 7.6% in April.
USD/CAD gathered bullish momentum and advanced to the 1.3650 area early Wednesday. Later in the day, first-quarter Gross Domestic Product (GDP) growth from Canada will be watched closely by market participants.
USD/JPY closed the second straight day in negative territory on Tuesday and continued to stretch lower early Wednesday, pressured by falling US T-bond yields. The pair was last seen trading slightly above 139.50.
GBP/USD held steady above 1.2400 on Tuesday but lost its traction mid-week. The pair stays on the back foot in the European morning and pushes lower toward 1.2350.
Gold price benefited from retreating US yields on Tuesday and rose toward $1,960. XAU/USD consolidates its recent gains on Wednesday and fluctuates above $1,950.
Bitcoin turned south early Wednesday and fell toward $27,000, losing more than 2% on the day. Ethereum registered marginal gains on Tuesday but reversed its direction on Wednesday. At the time of press, ETH/USD was down more than 1% on the day at $1,870
European Central Bank (ECB) policymaker Madis Muller is making comments on the central bank’s inflation and interest rates outlook on Wednesday.
Key quotes
It is very likely that the ECB will hike by 25 bps more than once.
Core inflation shows no signs of slowing yet.
Fiscal policy is boosting inflation, making the ECB’s job tricky.
It is probably too optimistic to see the ECB rate cut in early 2024.
Meanwhile, Villeroy de Galhau said that “interest rate hikes are overall a benefit to French and European banks.”
Market reaction
At the time of writing, EUR/USD is holding lower ground near 1.0675, down 0.55% on the day.
Canadian GDP data for Q1 is due for publication today. Economists at Commerzbank analyze how growth data could impact the Bank of Canada rate hike expectations and its implications for the Loonie.
BoC’s rate expectations have risen in connection with the Fed
“The data is likely to confirm that the economy has remained robust despite massive rate hikes. The flash estimate for April will signal whether the same also applies for the beginning of the second quarter.”
“Robust economic data and continued high inflation rates had led to a rise in rate hike expectations. The market has already gone a long way as according to the OIS-based market expectations the market is pricing in a terminal rate close to 4.9% at year-end, that means two further 25 bps rate steps are expected until then.”
“Today’s data would have to surprise significantly on the upside to fuel the BoC rate expectations further. The Loonie is going to benefit at best moderately from that against USD as the market rate expectations have also risen in connection with the Fed. As a result, the differential in rate expectations has not widened.”
Further upside in USD/CNH is likely and is expected to meet a tough barrier around 7.1500 in the short-term horizon, comment Economist Lee Sue Ann and Markets Strategist Quek Ser Leang at UOB Group.
Key Quotes
24-hour view: “Our view for USD to trade sideways in a range of 7.0700/7.0930 was incorrect. Instead of trading sideways, USD surged to 7.1093 before pulling back sharply to end the day modestly higher at 7.0899 (+0.10%). Despite the advance, there is only a slight increase in momentum. Today, USD could strengthen further but it is unlikely to break clearly above 7.1200. Support is at 7.0850, followed by 7.0750.”
Next 1-3 weeks: “We turned positive USD in the middle of the month when it was trading at a much lower level of 6.9580. As USD soared, in our most recent narrative from Monday (29 May, spot at 7.0800), we highlighted that last Friday’s outside reversal day suggests the chance of USD rising further to 7.1200 is low. We added, ‘only a breach of 7.0500 would indicate that the USD strength has run its course’. Yesterday, USD surged to a fresh high of 7.1093. Upward momentum has increased, albeit not much, and the chance of USD breaking 7.1200 has increased as well. At this stage, it is premature to expect the next major resistance at 7.1500 to come into view. On the downside, the ‘strong support’ level has moved higher to 7.0600 from 7.0500.”
- The index resumes the upside and pokes with recent tops.
- Firmer risk-off mood lends extra support to the dollar.
- Fed’s Bowman, Harker, Jefferson are due to speak later.
The greenback, in terms of the USD Index (DXY), adds to Tuesday’s gains and flirts once again with the area of multi-week peaks around 104.50.
USD Index stronger on risk-off trade
The index advances for the second session in a row in a context dominated by investors’ exodus from the risk-associated complex, particularly after disappointing results from the Chinese docket earlier in the Asian trading hours.
On another front, President Biden and House Speaker McCarthy negotiated legislation to raise the $31.4 trillion US debt ceiling and achieve new federal spending cuts advanced to the full House of Representatives for debate and a vote on passage on Wednesday after the House Rules Committee voted 7-6 late on Tuesday to adopt the rules permitting full chamber discussion.
In the meantime, speculation of a 25 bps rate hike by the Federal Reserve at the June 14 gathering remains firm and appears the most likely scenario according to CME Group’s FedWatch Tool.
In the US data space, weekly MBA Mortgage Applications and the Fed’s Beige Book will be the sole releases later on Wednesday along with speeches by FOMC’s M. Bowman (permanent voter, centrist), Philly Fed P. Harker (voter, hawk) and FOMC’s P. Jefferson (permanent voter, centrist).
What to look for around USD
The index picks up fresh pace and trades close to recent highs in the 104.40/50 band on Wednesday.
In the meantime, rising bets of another 25 bps at the Fed’s next gathering in June appear underpinned by the steady resilience of key US fundamentals (employment and prices mainly) amidst the ongoing rally in US yields and the DXY.
Favouring a pause by the Fed, instead, appears the extra tightening of credit conditions in response to uncertainty surrounding the US banking sector.
Key events in the US this week: Mortgage Applications, Fed’s Beige Book (Wednesday) – ADP Employment Change, Initial Jobless Claims, Final Manufacturing PMI, ISM Manufacturing PMI, Construction Spending (Thursday) – Nonfarm Payrolls, Unemployment Rate (Friday).
Eminent issues on the back boiler: Debt ceiling. Persistent debate over a soft/hard landing of the US economy. Terminal Interest rate near the peak vs. speculation of rate cuts in late 2023/early 2024. Fed’s pivot. Geopolitical effervescence vs. Russia and China. US-China trade conflict.
USD Index relevant levels
Now, the index is up 0.39% at 104.46 and the surpass of 104.53 (monthly high May 30) would open the door to 105.63 (200-day SMA) and then 105.88 (2023 high March 8). On the flip side, the next support emerges at the 100-day SMA at 102.88 seconded by the 55-day SMA at 102.44 and finally 101.01 (weekly low April 26).
Economists at Commerzbank discuss Aussie’s outlook after Australian inflation surprised to the upside.
Inflation surprise in Australia
“Inflation data for April surprised to the upside at 6.8% (Bloomberg expectations: 6.4%). The price index excluding volatile goods fell somewhat, but was still at high levels at 6.5%. In this respect, an interest rate hike next week is probably not completely off the table, another surprise is quite conceivable. However, the AUD was not able to profit from the publications today.”
“Even if the probability of a rate hike is now seen somewhat higher on the market, the majority still expects a pause. Therefore, the inflation release could not support the AUD this morning.”
“At the same time, weaker purchasing managers' indices were published from China, which may have exerted downward pressure on the AUD.”
- USD/JPY drifts lower for the third straight day and is pressured by a combination of factors.
- The risk-off mood, along with the intervention warning, boosts the JPY and weighs on the pair.
- The emergence of fresh USD buying could lend some support and help limit deeper losses.
The USD/JPY pair extends the overnight retracement slide from the vicinity of the 141.00 mark, or a six-month high and remains under some follow-through selling on Wednesday. The pair maintains its offered tone through the early European session and currently trade around mid-139.00s, down over 0.20% for the day.
A combination of factors provides a goodish lift to the Japanese Yen (JPY), which, in turn, is seem exerting downward pressure on the USD/JPY pair for the third successive day. The disappointing release of the official Chinese PMI prints for May adds to worries about a global economic slowdown and tempers investors' appetite for riskier assets. This, along with the prospect of Japanese authorities intervening in the markets, boosts demand for the safe-haven JPY and contributes to the offered tone around the major.
In fact, Japan’s Vice Finance Minister for international affairs, Masato Kanda, hinted that authorities may act to curd the sinking Yen, saying that they will closely watch currency market moves and respond appropriately as needed. He added that they won't rule out every option available. Apart from this, the ongoing slide in the US Treasury bond yields results in the narrowing of the US-Japan rate differential and further benefits the JPY. That said, a more dovish stance adopted by the Bank of Japan (BoJ) might cap the JPY.
Apart from this, the emergence of fresh US Dollar (USD) buying should help limit losses for the USD/JPY pair. In fact, the USD Index (DXY), which tracks the Greenback against a basket of currencies, climbs back closer to its highest level since mid-March touched on Tuesday and remains supported by hawkish Federal Reserve (Fed) expectations. Markets seem convinced that the US central bank will keep interest rates higher for longer and have been pricing in a greater chance of another 25 bps lift-off at the June FOMC meeting.
This, in turn, warrants caution before placing aggressive bearish bets around the USD/JPY pair. Market participants now look forward to the US economic docket, featuring the Chicago PMI and JOLTS Job Openings data. This, along with speeches by influential FOMC members and the US bond yields, will drive the USD demand. Apart from this, the broader risk sentiment should provide some impetus to the USD/JPY pair and allow traders to grab short-term opportunities.
Technical levels to watch
In light of the recent price action, USD/JPY could embark on a consolidation range in the next few weeks, suggest Economist Lee Sue Ann and Markets Strategist Quek Ser Leang at UOB Group.
Key Quotes
24-hour view: “Yesterday, we expected USD to trade sideways between 139.70 and 140.70. We did not anticipate the surge in volatility as USD traded choppily in a wide range of 139.58/140.93. Downward momentum appears to be building and the bias for USD is tilted to the downside today. In view of the tentative build-up in momentum, any decline is likely to face strong support at 139.30. The next support at 138.80 is unlikely to come under threat for now. Resistance is at 140.20, followed by 140.40.”
Next 1-3 weeks: “We turned positive in USD in the middle of the month. As USD soared, in our latest narrative from Monday (29 May, spot at 140.85), we held the view that USD could break above 141.00 but the solid long-term resistance at 142.00 might not break. We added, ‘only a breach of 139.30 would indicate that the USD strength has run its course’. Yesterday (30 May), USD rose and eked out a fresh 6-month high of 140.93 and then fell sharply to close on a soft note at 139.79 (-0.46%). While our ‘strong support’ level of 139.30 has not been breached yet, the sharp pullback and waning momentum suggest USD is unlikely to break above 141.00 this time around. From here, USD is likely to trade in a range between 137.00 and 141.00.”
CME Group’s flash data for natural gas futures markets noted open interest increased for the second session in a row on Tuesday, this time by around 16.3K contracts. In the same line, volume remained choppy and went up by around 69.5K contracts.
Natural Gas faces a potential test of $2.00
Tuesday’s decline in prices of the natural gas was on the back of increasing open interest and volume and is indicative of further losses in the very near term. Against that, a probable revisit to the monthly low around the $2.00 mark per MMBtu (May 5) should not be ruled out for the time being.
- USD/CHF picks up bids to refresh multi-day high after disappointing Swiss Real Retail Sales.
- Mixed Swiss GDP, US data fails to provide any clear directions but hawkish Fed bets keep US Dollar bulls hopeful.
- Fears of US default underpin haven demand of US Dollar, bonds.
- Updates from US House of Representatives, Fed’s Beige Book will be crucial for fresh impulse.
USD/CHF justifies softer Swiss statistics amid the risk-off mood heading into Wednesday’s European session as it renews the monthly top near 0.9090 at the latest. In doing so, the Swiss Franc (CHF) pair extends the previous day’s rebound from a one-week low to print the highest level since April 11.
Swiss Real Retail Sales marked the biggest slump in a year with -3.7% YoY figures for May versus -1.4% expected and -1.9% prior. That said, the nation’s first Gross Domestic Product (GDP) for the first quarter (Q1) also marked mixed figures the previous day and underpin the bullish bias surrounding the USD/CHF pair. That said, the Swiss Q1 GDP rose to 0.3% QoQ from 0.0% prior and versus 0.1% market forecasts. However, the nation’s KOF Leading Indicator for May and the Q1 GDP’s YoY figures were downbeat.
On the other hand, the US Conference Board's (CB) Consumer Confidence Index edged lower to 102.30 for May from an upwardly revised 103.70 prior marked in April (from 101.30). Additional details of the survey report mentioned that the one-year consumer inflation expectations ticked down to 6.1% in May from 6.2% in April. Further, the Dallas Fed Manufacturing Business Index for May dropped to -29.1 from -23.4 and versus -19.6 market expectations.
Even so, the market players place heavy bets on June’s 0.25% rate hike and keep the US Dollar on the front foot.
Apart from the hawkish Fed bets, fears emanating from downbeat China activity data for May and looming US default gain major attention. Also weighing on the sentiment, as well as fueling the USD/CHF price, could be the anxiety ahead of the key data/events as the US Republicans show readiness to vote down the agreement to avoid the debt-ceiling expiration.
Against this backdrop, the S&P500 Futures print mild losses around 4,120 by the press time, after a mixed Wall Street close, whereas the US Treasury bond yields stay depressed of late. Furthermore, the US Dollar Index (DXY) picks up bids to around 104.36, after snapping a six-day uptrend near the highest levels in 10 weeks the previous day.
Moving on, the Swiss ZEW Survey for May will offer immediate directions to the USD/CHF pair ahead of the US JOLTS Job Openings for April, expected 9.375M versus 9.59M prior, as well as the Chicago Purchasing Managers' Index for May, likely to fall to 47.0 from 48.6. It should be noted, however, that major attention will be given to the US House of Representatives voting on the debt ceiling agreement and Fed’s Beige Book for a clear guide.
Technical analysis
USD/CHF pair’s successful trading beyond 50-DMA, around 0.9000 by the press time, allows the bulls to aim for a one-month-old ascending resistance line, around 0.9115 at the latest.
EUR continues to struggle against USD. This week two sets of data important for monetary policy are on the agenda in the shape of the Eurozone inflation data tomorrow and the labour market report from the US on Friday. Economists at Commerzbank analyze how these releases could impact the EUR/USD pair.
Eurozone inflation data is likely to have eased further again in May
“According to our economists, the rise in employment in the US is likely to have slowed further in May, but the significant slowdown on the labour market that would be required to dampen inflation is unlikely to be visible yet. If the labour market were to be stronger than expected again, Fed rate hike expectations might be fuelled further.”
“The Eurozone inflation data is likely to have eased further again in May. The inflation data from Spain already surprised to the downside yesterday. If there are further surprises to the downside, doubts might arise whether the ECB really will hike its key rate another two times as the market is currently pricing in.”
“As a result, EUR will probably continue to struggle standing its ground against USD.”
Following the release of the French growth and inflation data, French Finance Minister Bruno Le Maire said that “inflation is going down, and is actually going down quite strongly.”
Additional takeaways
“Maintain economic growth forecast for 2023 of 1.0%.”
“Could use taxation measures if companies do not do enough to help bring down food price inflation.”
French final Gross Domestic Product (GDP) was confirmed at 0.2% QoQ in the first quarter. Meanwhile, the country’s Consumer Price Index (CPI) dropped 0.1% on a monthly basis in May. The consensus forecast was for a 0.3% increase in the reported period.
Market reaction
The Euro is meeting fresh supply on the softer French inflation data. EUR/USD is dropping 0.46% on the day to trade at 1.0685, as of writing.
FX option expiries for May 31 NY cut at 10:00 Eastern Time, via DTCC, can be found below.
- EUR/USD: EUR amounts
- 1.0600 383m
- 1.0675 1.3b
- 1.0750 2.3b
- 1.0800 451m
- 1.0830 351m
- 1.0850 456m
- USD/JPY: USD amounts
- 139.00 1.7b
- 140.00 1.7b
- 140.50 764m
- AUD/USD: AUD amounts
- 0.6450 571m
- 0.6490 394m
- 0.6540 1.2b
- 0.6600 397m
- USD/CAD: USD amounts
- 1.3450 560m
- 1.3600 320m
In the opinion of Economist Lee Sue Ann and Markets Strategist Quek Ser Leang at UOB Group, AUD/USD faces further selling pressure as long as it trades below 0.6575.
Key Quotes
24-hour view: “Yesterday, we expected AUD to consolidate between 0.6500 and 0.6550. However, AUD traded in a range of 0.6521/0.6558. There is no directional bias for now and today, we expect AUD to trade sideways between 0.6490 and 0.6550.”
Next 1-3 weeks: “In our most recent narrative from last Friday (26 May, spot at 0.6505), we highlighted that the weakness in AUD that started in the middle of the month has yet to stabilize. We held the view that it could weaken further to 0.6450. Since then, AUD has not been able to make much headway below 0.6500 and downward momentum is beginning to slow. However, as long as 0.6575 (‘strong resistance’ level previously at 0.6590) is not breached, there is still a chance, albeit not a high one, for AUD to weaken to 0.6450.”
Considering advanced prints from CME Group for crude oil futures markets, traders added around 21.1K contracts to their open interest positions on Tuesday, reversing the previous daily drop. Volume followed suit and increased by around 381.1K contracts.
WTI: A drop to the 2023 low looms closer
Tuesday’s sharp sell-off in prices of WTI broke below the key $70.00 mark against the backdrop of rising open interest and volume. That said, the commodity now appears vulnerable to a deeper retracement to, initially, the YTD low of $63.61 recorded on May 4.
- Gold Price extends recovery despite firmer US Dollar, justifying downbeat Treasury bond yields.
- Cautious mood ahead of voting on US debt ceiling deal in House, mixed US data allow XAU/USD buyers to keep the reins.
- Sustained break of $1,950 resistance confluence, now support, keeps the Gold Price on the buyer’s radar.
Gold Price (XAU/USD) picks up bids to refresh intraday high as buyers cheer a two-day winning streak, after refreshing the lowest levels in 10 weeks. In doing so, the XAU/USD fails to justify the latest rebound in the US Dollar Index (DXY) but aptly cheers the downbeat Treasury bond yields as markets await the US House of Representatives voting on the debt ceiling agreement. Also important to watch is the Fed’s Beige Book and the US JOLTS Job Openings for April, not to forget inflation clues from Eurozone.
Apart from the pre-data positioning and month-end consolidation, the XAU/USD price also benefits from the mixed US data, as well as China’s readiness for more stimulus amid downbeat activity numbers. Further, hopes that the US policymakers will anyhow avoid the US default and hawkish Federal Reserve (Fed) bets appear challenging the Gold price as the metal is a whisker above the short-term key support confluence, previous resistance.
Also read: Gold Price Forecast: Bear Cross confirmation to threaten 100 DMA support again
Gold Price: Key levels to watch
As per our Technical Confluence Indicator, the Gold Price grinds higher past $1,950 resistance-turned-support comprising 5-DMA and the previous monthly low.
The XAU/USD recovery also crossed the $1,957 immediate support including the Fibonacci 23.6% in one-day to further convince the commodity bulls.
It should be noted that the Gold Price weakness past $1,950 needs validation from the $1,945 support level that encompasses the Pivot Point one-month S1 and Fibonacci 61.8% on one-day to welcome the XAU/USD sellers.
On the flip side, Fibonacci 61.8% on one-week and Pivot Point one-week R1, respectively around $1,968 and $1,975, can prod the Gold buyers before directing them to a convergence of the Fibonacci 61.8% on one-month, around $1,990 by the press time.
Overall, the Gold price remains on the buyer’s radar unless staying beyond $1,950.
Here is how it looks on the tool
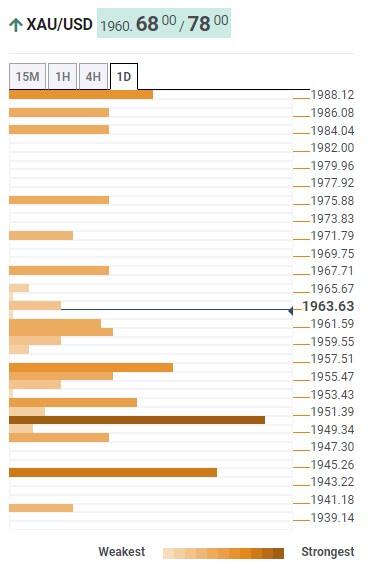
About Technical Confluences Detector
The TCD (Technical Confluences Detector) is a tool to locate and point out those price levels where there is a congestion of indicators, moving averages, Fibonacci levels, Pivot Points, etc. If you are a short-term trader, you will find entry points for counter-trend strategies and hunt a few points at a time. If you are a medium-to-long-term trader, this tool will allow you to know in advance the price levels where a medium-to-long-term trend may stop and rest, where to unwind positions, or where to increase your position size.
GBP/USD has likely moved into a consolidative phase according to Economist Lee Sue Ann and Markets Strategist Quek Ser Leang at UOB Group.
Key Quotes
24-hour view: “We expected GBP to consolidate between 1.2325 and 1.2385 yesterday. However, after dropping to a low of 1.2328, it lifted off and surged to a high of 1.2447 before closing on a firm note at 1.2413 (+0.44%). The rapid rise appears to be running ahead of itself and while there is room for GBP to strengthen further, any advance is likely part of a higher range of 1.2360/1.2455. In other words, a sustained rise above 1.2555 is unlikely.”
Next 1-3 weeks: “While we have held a negative GBP since the middle of the month, in our latest narrative from last Friday (26 May, spot at 1.2320), we indicated that ‘while GBP weakness is intact, it remains to be seen if 1.2175 will come into view this time round’. We added, ‘a breach of 1.2415 would suggest the GBP weakness has stabilized’. Yesterday (30 May), GBP soared and cracked 1.2415 (high has been 1.2447). The price actions suggest the GBP weakness has stabilized. While upward momentum has improved somewhat, it is premature to expect a reversal. For now, GBP is likely to trade in a range between 1.2330 and 1.2505.”
Economists at Rabobank see little reason for Oil markets to break either way until the macro fears are alleviated or a recession kicks off.
Sideways market until sentiment changes
“Brent saw recent strength up to $78/bbl from positive demand data, but we are not ready to make a full bullish call in the short term until the wider macro mess is resolved. Another bank failure could send Brent to retest the key $70/bbl mark, and financial contagion would push prices into the $65-$70/bbl range.”
“Right now, we see OPEC+ staying the course and continuing the April cuts of 1.6m bpd. The surprise April cut boosted prices by $5-$7 for about three weeks. A second cut would display their fears more openly and indicates greater weakness; we construe a second cut as a bearish signal unless the cuts are extremely substantive.”
“For now, Brent and WTI will continue their sideways trends.”
Open interest in gold futures markets kept the downtrend well and sound on Tuesday, this time shrinking by around 3.3K contracts according to preliminary readings from CME Group. Volume, instead, resumed the upside and increased by nearly 10K contracts.
Gold remains supported by $1930
Gold prices traded on the defensive on Tuesday amidst declining open interest, which is suggestive that a probable rebound lies ahead in the very near term. In the meantime, the precious metal remains well supported around the $1930 region, an area coincident with the 100-day SMA.
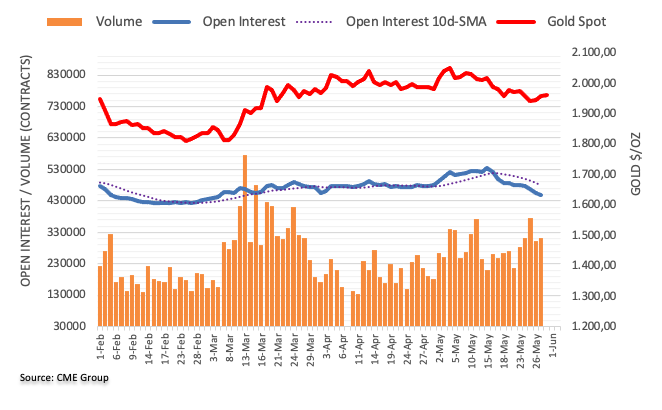
- The oil price is consolidating above $69.00 ahead of oil inventory data by the US API.
- Resilient US consumer spending and decent labor market conditions are bolstering chances of one more rate hike by the Fed.
- Tensions between Russia and Saudi Arabia have remained higher as the former is consistently pumping cheaper oil into the global economy.
West Texas Intermediate (WTI), futures on NYMEX, are oscillating above 69.00 in the early European session. The oil price is expected to extend its losses as fears of a recession in the global economy are skyrocketing.
The economic outlook for the United States economy is still in bad shape as interest rates by the Federal Reserve (Fed) are above 5%. And, now rising expectations of one more interest rate hike in June’s monetary policy meeting, considering resilient consumer spending and decent labor market conditions, are bolstering fears of a recession. The German economy has already slipped into recession after reporting a contraction in Gross Domestic Product (GDP) figures consecutively for two quarters.
Meanwhile, contracting Chinese factory activity has also weighed on oil prices. In Asia, China’s National Bureau of Statistics (NBS) reported Manufacturing PMI at 48.8, lower than the estimates of 49.4 and the former release of 49.2. Investors should not that a figure below 50.0 is itself considered a contraction. It is worth mentioning that China is the largest importer of oil in the world and weak economic activities in China would have a significant impact on the oil price.
Later this week, OPEC’s meeting will be keenly focused as production cuts would be discussed to support energy prices. Tensions between Russia and Saudi Arabia have remained higher as the former is consistently pumping cheaper oil into the global economy, undermining efforts made by the latter to bolster energy prices.
The impact of cutting overall production further by OPEC+ members excluding Russia could be nullified as Russia is not committed to keeping the pledge anymore.
On late Wednesday, investors will keep an eye on the release of oil inventories for the week ending May 26 by the US American Petroleum Institute (API).
- EUR/USD fades previous rebound from the lowest levels in two months.
- Failure to stay beyond short-term key horizontal area, three-week-old falling trend line favors Euro sellers.
- RSI conditions may offer intermediate halt during the anticipated fall towards three-month-old “triple bottom” formation.
EUR/USD remains on the back foot around an intraday low of 1.0685 as it reverses the previous day’s corrective bounce heading into Wednesday’s European session.
In doing so, the Euro pair registers the buyer’s inability to keep the reins past the two-month-old horizontal resistance area, as well as a downward-sloping trend line from May 04.
Additionally favoring the EUR/USD seller is the RSI (14) line which still has some room before hitting the oversold territory, suggesting a gradual south-run of the major currency pair.
As a result, the quote is well-set for a slow grind toward the 1.0600 round figure. However, the triple bottoms near the 1.0530 support zone comprising multiple levels marked since late February appears a tough nut to crack for the EUR/USD bears afterward, especially amid a likely oversold RSI line at that level.
Meanwhile, the aforementioned horizontal region surrounding 1.0700-15 precedes the descending resistance line, close to 1.0725 at the latest, to restrict short-term EUR/USD recovery.
Following that, a 10-week-old horizontal hurdle around 1.0760-65 may act as the last defense of the Euro pair bears before giving control to the buyers.
EUR/USD: Four-hour chart
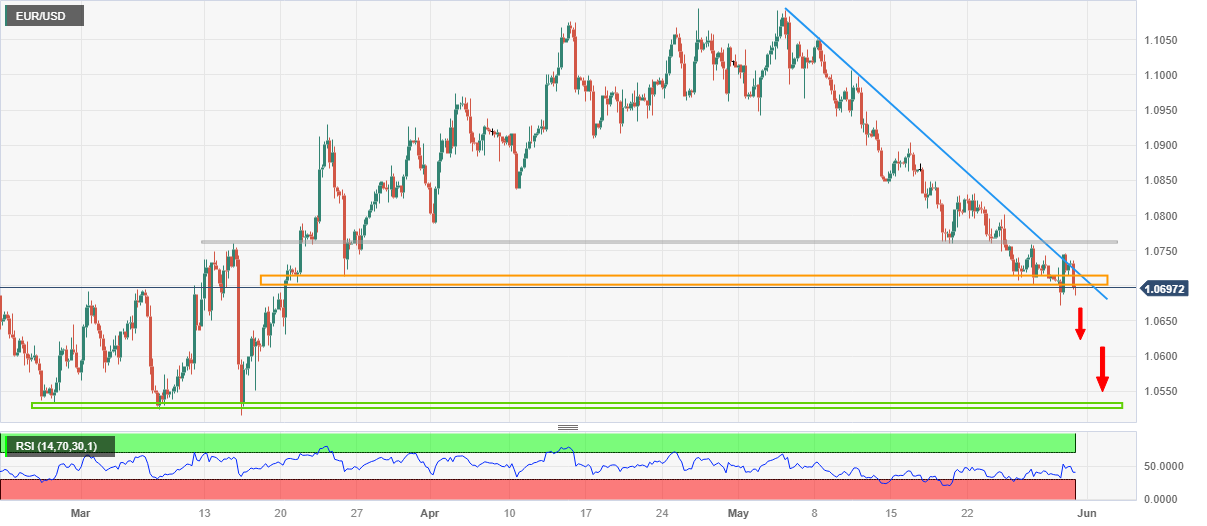
Trend: Further downside expected
Economist Lee Sue Ann and Markets Strategist Quek Ser Leang expect EUR/USD to trade within the 1.0670-1.0820 range in the next weeks.
Key Quotes
24-hour view: “We highlighted yesterday that EUR ‘could edge below 1.0700 but it is highly unlikely to threaten the major support at 1.0650’. We added, ‘there is a minor support at 1.0680’ and ‘a breach of 1.0745 would indicate the current mild downward pressure has faded’. Our view turned out to be correct as EUR dropped to 1.0671 and then rebounded sharply to 1.0746. Not only has downward pressure faded, upward pressure is beginning to build. Today, EUR could strengthen but it might not be able to break clearly above 1.0775 (there is another resistance at 1.0755). Support is at 1.0705, followed by 1.0670.”
Next 1-3 weeks: “We have expected EUR to weaken since three weeks ago. Our view was correct and as EUR dropped, in our latest narrative from last Friday (26 May, spot at 1.0725), we held the view that the selloff in EUR appears to be overextended. We added, ‘while it could still drop further, it remains to be seen if it has enough momentum to break clearly below the next support at 1.0650’. Yesterday (30 May), EUR dropped to a low of 1.0671 and then rebounded sharply to close higher by +0.26% (1.0733). While our ‘strong resistance’ level of 1.0775 has not been breached, downward pressure has more or less faded. In other words, EUR weakness has likely stabilized and it is likely to trade in a range of 1.0670/1.0820 for the time being.”
- Asian stocks are facing the heat of weak China’s factory activity.
- Global market mood has turned cautious ahead of US Employment data.
- OPEC members are expected to discuss production cuts to support energy prices.
Markets in the Asian session have nosedived as investors underpinned the risk-aversion theme after disappointing China’s official Manufacturing PMI data. China’s official PMI data released in Asia remained mixed as manufacturing activities remained downbeat while non-manufacturing PMI outperformed estimates.
Global market mood has turned cautious as investors are awaiting the release of the United States Employment data, which will provide a base to Federal Reserve (Fed) policymakers for building a further roadmap of bringing down stubborn inflation. The rationale is rerating the US Dollar Index (DXY), which has jumped strongly to near 104.40.
At the press time, Japan’s Nikkei225 plunged 1.63%, ChinaA50 dived 1.66%, Hang Seng nosedived 2.56%, and Nifty50 dropped 0.50%.
Chinese equities faced selling pressure after domestic factory activity contracted despite swift reopening measures by the administration after remaining in lockdown curbs for three years. China’s National Bureau of Statistics (NBS) reported Manufacturing PMI at 48.8, lower than the estimates of 49.4 and the former release of 49.2. While Non-Manufacturing PMI jumped to 54.5 from the consensus of 50.7 but remained lower than the former figure of 56.4.
Japanese stocks remained under pressure after downbeat Retail Trade data. Annual Retail Trade data accelerated by 5.0% at a slower pace than expected at 7.0% and the former release of 7.2%. This could have some pressure on the Bank of Japan (BoJ) as weak retail demand could ease inflationary pressures. In early Asia, BoJ Ueda cited that the increase in inflationary pressures has been caused by supply factors such as a rapid rise in commodity prices, labor shortages, and disruptions to supply chains, which is not constructive for the economy.
On the oil front, oil prices are consistently oscillating below the crucial resistance of $70.00. Investors are awaiting the outcome of OPEC’s meeting that will deliver guidance for further action. OPEC members are expected to discuss production cuts to support energy prices. Tensions with Russia are escalating as it is pumping cheap oil into the global economy, disregarding the pledge.
- GBP/USD holds lower ground as it prints the first daily loss in four.
- Downbeat UK Business Confidence, sticky inflation and BoE’s ineffectiveness favor Cable buyers.
- Fears from US debt ceiling deal, hawkish Fed bets also propel Pound Sterling price.
- Congress voting on measures to avoid US default, US employment clues and Fed Beige Book eyed.
GBP/USD clings to mild losses as it extends the early Asian session pullback from a one-week high while snapping a three-day uptrend near 1.2390 heading into Wednesday’s London open.
That said, the Cable pair’s latest gains could be linked to the US Dollar’s broad recovery, as well as downbeat concerns about the UK fundamentals and hawkish Federal Reserve (Fed) bets. Furthermore, fears of looming US default and mixed US data also allow the Pound Sterling bears to keep the reins.
Earlier in the day, Lloyds Bank unveiled monthly releases of its business sentiment gauge and inflation signals for May. “The Lloyds Bank Business Barometer fell to 28% in May from 33% in April, its first decline since February, but in line with the survey's long-term average,” said Reuters. The news also quotes Hann-Ju Ho, senior economist at Lloyds Bank as saying that the economic environment remains challenging, compounded by stubborn inflation and higher wage pressures.
On the other hand, the US Dollar Index (DXY) picks up bids to around 104.25, after snapping a six-day uptrend near the highest levels in 10 weeks. While tracing the US Dollar’s latest gains, the market’s fears emanating from downbeat China activity data for May and looming US default gain major attention. Also weighing on the sentiment, as well as on the GBP/USD price, could be the anxiety ahead of the key data/events as the US Republicans show readiness to vote down the agreement to avoid the debt-ceiling expiration.
It’s worth mentioning that the market’s comparatively more hawkish bias about the Federal Reserve (Fed) than the Bank of England (BoE) also weighs on the Pound Sterling pair even as the US data has been mixed of late. On Tuesday, the US Conference Board's (CB) Consumer Confidence Index edged lower to 102.30 for May from an upwardly revised 103.70 prior marked in April (from 101.30). Additional details of the survey report mentioned that the one-year consumer inflation expectations ticked down to 6.1% in May from 6.2% in April. Further, the Dallas Fed Manufacturing Business Index for May dropped to -29.1 from -23.4 and versus -19.6 market expectations.
Looking forward, the market’s cautious mood, as portrayed by the mildly offered S&P500 Futures and the US Treasury bond yields, may keep the GBP/USD bears hopeful ahead of the US House of Representatives voting on the debt ceiling agreement. Also important to watch is the Fed’s Beige Book and the US JOLTS Job Openings for April, expected 9.375M versus 9.59M prior, as well as the Chicago Purchasing Managers' Index for May, likely to fall to 47.0 from 48.6.
Technical analysis
GBP/USD pair’s failure to cross the 200-DMA hurdle, around 1.2445 by the press time, keeps the Cable bears hopeful of retesting the monthly low surrounding 1.2300.
- Silver Price remains depressed within one-week-old symmetrical triangle.
- Sustained trading below 200-HMA, fortnight-long resistance line amid steady RSI favor XAG/USD sellers.
- Silver Price weakness past $23.00 can aim for November 2022 peak.
Silver Price (XAG/USD) grinds within a short-term symmetrical triangle as traders await the key risk catalysts during early Wednesday.
That said, the XAG/USD seesaws inside a one-week-old triangle formation after failing to register any clear pattern the previous day.
Though, the bullion’s sustained trading below the 200-Hour Moving Average (HMA), as well as a downward-sloping trend line from May 15, keeps the Silver bears hopeful.
Additionally, the steady RSI (14) line suggests a further zigzag of the XAG/USD price within a triangle as the bullion sellers slowly tighten their grip.
It’s worth noting that the Silver sellers, however, may need to wait for a clear downside break of the stated triangle, by smashing the $23.00 support, which in turn could direct the XAG/USD price towards the monthly low marked in the last week around $22.68.
In a case where the Silver price remains bearish past $22.68, the November 2022 peak of around $22.25 and the $22.00 round figure could lure the precious metal sellers.
On the contrary, an upside break of the stated triangle’s resistance line, around $23.30 at the latest, isn’t an open invitation to the Silver buyers as the 200-HMA and the previously stated two-week-old resistance line, respectively near $23.35 and $23.45, could play their roles of probing the XAG/USD bulls.
Following that, a run-up towards $24.00 and then to a late April low of near $24.50 can’t be ruled out.
Silver Price: Hourly chart
Trend: Further downside expected
- AUD/USD is hovering below 0.6500 amid sheer strength in the USD Index.
- The Australian Dollar has witnessed selling pressure despite the higher-than-expected Australian CPI release.
- AUD/USD has been strongly dumped after testing the breakout region of the consolidation around 0.6560.
The AUD/USD pair has shifted its auction below the round-level support of 0.6500 in the Asian session. The Aussie asset has faced immense selling interest despite higher-than-anticipated monthly Australian inflation data.
Monthly Australian Consumer Price Index (CPI) (April) soared to 6.8% vs. the estimates of 6.4% and the former release of 6.3%. This could force the Reserve Bank of Australia (RBA) to continue hiking interest rates as the battle against stubborn inflation is getting more complicated.
The US Dollar Index (DXY) is struggling in extending its rally above 104.35, however, the upside seems favored as chances of one more interest rate hike by the Federal Reserve (Fed) are soaring. Meanwhile, Cleveland Federal Reserve Bank President, Loretta Mester, in an interview with Financial Times, cited “I don’t really see a compelling reason to pause — meaning wait until you get more evidence to decide what to do.”
AUD/USD has been strongly dumped by the market participants after testing the breakout region of the prolonged consolidation around 0.6560 on a daily scale. The consolidation formed in a wide range of 0.6562-0.6810 in which inventory adjustment took place.
Downward-sloping 10-period Exponential Moving Average (EMA) at 0.6558 indicates that the short-term bearish bias is extremely solid.
The Relative Strength Index (RSI) (14) is oscillating in the bearish range of 20.00-40.00, showing no signs of divergence and any evidence of an oversold situation, which advocates more weakness ahead.
Should the asset slips confidently below 0.6490, US Dollar bulls would drag the Aussie asset to 01 November 2022 high around 0.6464 followed by the round-level support at 0.6400.
In an alternate scenario, a recovery move above April 28 low at 0.6574 will drive the asset toward April 10 low at 0.6620 and May 19 high at 0.6675.
AUD/USD daily chart
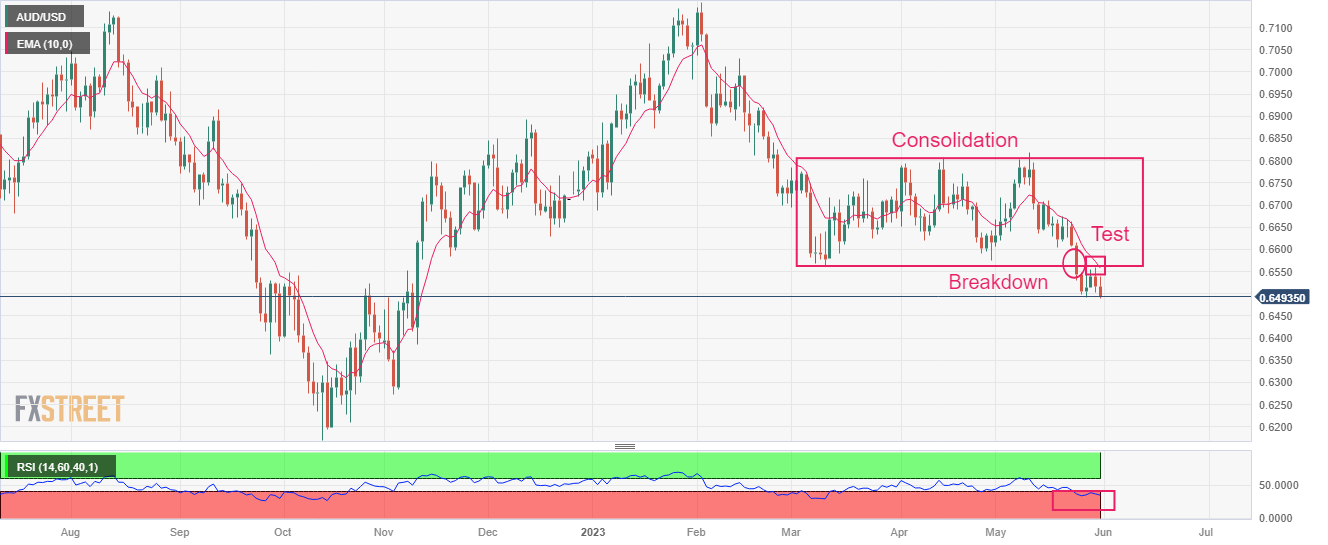
- Gold price has defended its crucial support around $1,950.00, supported by weak US Treasury yields.
- The USD Index has delivered a V-shape recovery after defending the crucial support of 104.00 amid hawkish Fed bets.
- Gold price has turned sideways around $1,960.00 after delivering a breakout of the Falling Wedge pattern.
Gold price (XAU/USD) has shown some recovery after defending its close support of $1,950.00 in the Tokyo session. Broadly, the precious metal is consolidating in a range of $1,953-1,960 as investors are awaiting the release of the United States Employment data.
S&P500 futures have added more losses in Asia, portraying a decline in the risk appetite of the market participants. The US Dollar Index (DXY) has delivered a V-shape recovery after defending the crucial support of 104.00.
Investors should note that Gold price has managed to defend the downside despite extreme strength in the US Dollar bulls. The Gold price is being supported by falling US Treasury yields. Growing optimism about a clear passage for the novel US debt-ceiling proposal in Congress has weighed heavily on the US Treasury yields. The yields offered on 10-year US government bonds have dropped 3.68%.
A conservative approach should be taken as the Gold price could face pressure considering the strength of the US Dollar and deepening expectations of one more interest rate hike by the Federal Reserve (Fed).
Going forward, US JOTLS Job Openings data and the release of Fed’s Beige Book will be keenly watched. According to the estimates, total job openings have dropped to 9.375M vs. the former release of 9.59M.
Gold technical analysis
Gold price has turned sideways around $1,960.00 after delivering a breakout of the Falling Wedge chart pattern formed on a two-hour scale. A breakout of the aforementioned pattern indicates a bullish reversal. The 20-period Exponential Moving Average (EMA) at $1,953.36 is providing a cushion to the Gold bulls.
The Relative Strength Index (RSI) (14) is making efforts for shifting into the bullish range of 60.00-80.00. An occurrence of the same will be followed by activation of the bullish momentum.
Gold two-hour chart
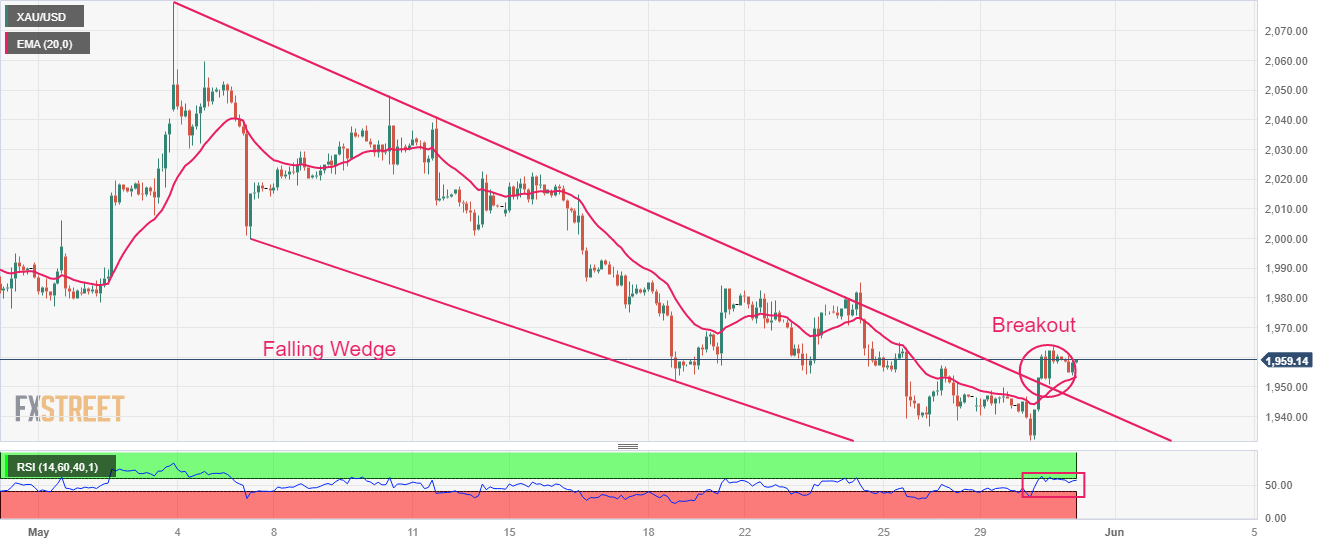
In an interview with the Financial Times, Cleveland Federal Reserve Bank President, Loretta Mester, delivered hawkish comments, suggesting that the Fed must go for a rate hike in June.
Key quotes
“I don’t really see a compelling reason to pause — meaning wait until you get more evidence to decide what to do.”
“I would see more of a compelling case for bringing [rates] up . . . and then holding for a while until you get less uncertain about where the economy is going.”
“The only reason for skipping a rate increase when it is clear more tightening is necessary would be extreme market volatility or some other shock.”
"I just think that we may have to go further.”
“At this point, I don’t really necessarily see a compelling reason that we wouldn’t want to take another small step to counter some of that really embedded, stubborn inflationary pressure.”
“Debt-ceiling deal removes ‘big piece of uncertainty’ over US economy.”
Market reaction
The US Dollar Index is testing intraday highs near 104.40 on Mester’s comments, up 0.18% on the day.
- USD/INR clings to mild gains during three-day winning streak.
- Risk aversion in Asia, overall cautious mood ahead of key data/events underpins US Dollar rebound.
- Softer India growth may allow RBI to defend status quo.
- US policymakers flag troubles for measures to avoid default in passing the Congress.
USD/INR remains on the front foot for the third consecutive day even as it clings to mild gains around 82.70 amid early Wednesday in Europe. In doing so, the Indian Rupee (INR) pair not only justifies the US Dollar’s latest strength but also portrays the market’s cautious mood ahead of the Indian Gross Domestic Product (GDP) for the first quarter (Q1), as well as the US House voting on the debt-ceiling extension deal.
It’s worth noting that the US Dollar Index (DXY) picks up bids to reverse the previous day’s pullback from the 10-week high to around 104.25 as market sentiment sours on fears of economic slowdown, backed by Richmond Fed Thomas Barkin’s comments and recently downbeat China PMI. Also weighing on the sentiment, as well as underpinning the USD/INR run-up could be the anxiety ahead of the key data/events as the US Republicans show readiness to vote down the agreement to avoid the debt-ceiling expiration.
On the other hand, the risk-off mood in Asia, mainly due to China’s official PMI’s downbeat performance in May, as well as due to the US default woes, allows the Indian Rupee (INR) bears to keep the reins.
That said, the divergence between the Reserve Bank of India’s (RBI) monetary policy bias, considering the latest easy inflation, and the hawkish Federal Reserve (Fed) bets keeps the USD/INR buyers hopeful.
Alternatively, the recently softer WTI crude oil price, depressed near a three-week low surrounding $69.30 at the latest, puts a floor under the INR price. On the other hand, hopes that the US policymakers will be able to avoid the default prod the US Dollar bulls, especially amid mixed data. That said, the US Conference Board's (CB) Consumer Confidence Index edged lower to 102.30 for May from an upwardly revised 103.70 prior marked in April (from 101.30). Additional details of the survey report mentioned that the one-year consumer inflation expectations ticked down to 6.1% in May from 6.2% in April. Further, the Dallas Fed Manufacturing Business Index for May dropped to -29.1 from -23.4 and versus -19.6 market expectations.
Against this backdrop, the S&P500 Futures remain indecisive, mildly offered around 4,220 by the press time, after a mixed Wall Street close whereas the US Treasury bond yields stay depressed of late.
Looking forward, USD/INR pair traders will pay attention to India’s Q1 GDP, expected to improve to 5.0% YoY versus 4.4% prior, ahead of the US House voting on the measures to avoid the disastrous failure in paying the government’s debts. Should the Indian growth numbers appear positive, the RBI may get one more reason, in addition to softer inflation, to keep the monetary policy unchanged, which in turn may propel the pair after an initial setback.
Technical analysis
A sustained run-up beyond a downward-sloping resistance line from October 2022, around 82.82 by the press, becomes necessary for the USD/INR bulls to keep the reins. That said, a convergence of the 50-DMA and 100-DMA, around 82.17-15 at the latest, appears a tough nut to crack for the Indian Rupee buyers.
- EUR/USD has shown a sheer downside below 1.0700 as US Dollar bulls got strength amid hawkish Fed bets.
- Soaring expectations for one more interest rate hike by the Fed might rerate the USD Index ahead.
- The ECB is expected to remain hawkish in June as inflation is extremely diverged from the desired target of 2%.
The EUR/USD pair has delivered a vertical fall and has slipped below the round-level support of 1.0700 in the Asian session. The major currency pair has witnessed immense selling pressure as the US Dollar Index (DXY) has shown a firmer upside after overstepping the crucial resistance of 104.20.
S&P500 futures have posted decent losses in Asia after a rangebound Tuesday, portraying a risk-aversion theme. Investors are dumping risk-sensitive assets amid fresh expectations of an interest rate hike by the Federal Reserve (Fed). The appeal for the USD Index has improved sharply as investors are anticipating a rerating of the dollar basket amid hawkish Fed bets.
However, the demand for US government bonds is consistently increasing as investors are optimistic that the US borrowing cap increase proposal will get passage by Congress before June 05. This has led to a decline in the 10-year US Treasury yields below 3.69%.
Consumer spending that remained resilient in April derailed expectations of a neutral interest rate policy stance by the Fed despite Fed chair Jerome Powell cited that more rate hikes are less appropriate due to tight credit conditions. For now, the focus is shifting toward the United States Nonfarm Payrolls (NFP) data, which will release on Friday.
On the Eurozone front, investors are awaiting the release of preliminary Eurozone Harmonized Index of Consumer Prices (HICP) data, which is scheduled for Thursday. According to the estimates, core monthly HICP is seen expanding by 0.8% at a slower pace than the 1% recorded for April. Annual core HICP is expected to soften marginally to 5.5% vs. the prior release of 5.6%. The headline HICP is seen decelerating sharply to 6.3% against the former release of 7.0%.
However, the European Central Bank (ECB) is expected to remain hawkish in June as inflationary pressures are extremely diverged from the desired target of 2%. Apart from the Eurozone inflation, the speech from ECB President Christine Lagarde will also remain in focus.
- USD/CAD grinds near intraday high, extends previous day’s rebound from one-week low.
- Downward-sloping resistance line from late March restricts immediate upside of Loonie pair.
- Looming bull cross on MACD, firmer RSI (14) line favors USD/CAD buyers.
- Canada Q1 GDP, risk catalysts eyed for clear directions.
USD/CAD picks up bids to attack a two-month-old descending resistance line around 1.3650 heading into Wednesday’s European session. In doing so, the Loonie pair justifies the market’s cautious mood ahead of the Canadian first quarter (Q1) 2023 Gross Domestic Product (GDP), as well as the key risk catalysts, namely the US debt ceiling deal updates and the Fed bets.
Also read: USD/CAD struggles to cheer Oil price slump near 1.3600 as US Dollar retreats ahead of top-tier catalysts
That said, the Loonie pair currently prods a downward-sloping resistance line from March 28, close to 1.3640 at the latest.
Even so, the recently firmer RSI (14) line, not overbought, joins the looming bull cross on the MACD indicator to keep the USD/CAD buyers hopeful of crossing the immediate 1.3640 resistance line.
Following that, April’s high near 1.3665-70 may act as an extra filter towards the north before directing the USD/CAD toward the late March swing high of around 1.3700 round figure.
On the flip side, a three-week-long ascending trend line and the 50-SMA, respectively near 1.3575 and 1.3565, could challenge the USD/CAD bears.
However, the Loonie pair’s bearish trajectory past 1.3565 needs validation from the previous resistance line from March 10, close to 1.3530.
Overall, USD/CAD is likely to remain firmer and can overcome the immediate upside hurdle.
USD/CAD: Four-hour chart
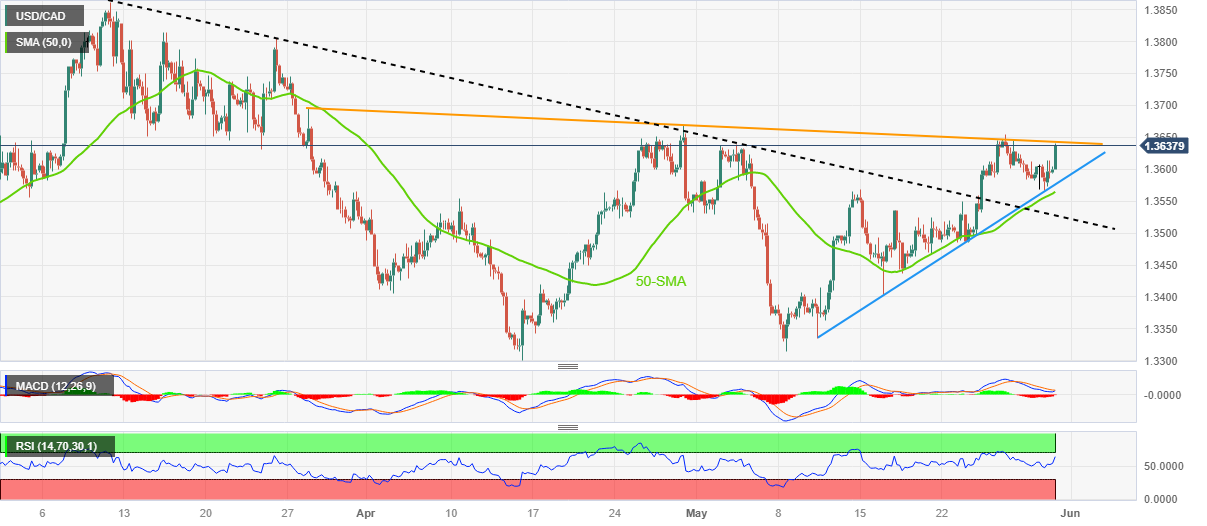
Trend: Further upside expected
- USD/JPY remains sidelined after reversing from six-month high in the last two days.
- BoJ’s Kuroda cites inflation woes but defends easy monetary policy.
- Fears of US default, anxiety ahead of key employment signals weigh on sentiment, put a floor under US Dollar.
- Yen sellers need validation from US House, Treasury bond yields.
USD/JPY struggles to portray the market’s slightly downbeat sentiment, as well as hesitates to justify the Bank of Japan (BoJ) Governor Kazuo Ueda’s comments, amid an unimpressive Wednesday morning in Europe. That said, the Yen pair treads water around 139.75 by the press time while pausing the two-day losing streak from the highest levels since November 2022.
While portraying the mood, the S&P500 Futures remain indecisive, mildly offered around 4,220 by the press time, after a mixed Wall Street close whereas the US Treasury bond yields stay depressed of late. Furthermore, the US Dollar Index (DXY) picks up bids to around 104.25, after snapping a six-day uptrend near the highest levels in 10 weeks.
Earlier in the day, BoJ Governor Kazuo Ueda highlighted inflation woes in the nation and renewed hawkish bias for the Japanese central bank. However, the policymaker also said, “Whether inflation is caused by demand or supply has very important implications for monetary policymaking.” On the same line, Japanese data were also mixed for April as Industrial Production improved on YoY but eased on MoM whereas the Large Retailer Sales rose heavily during the said month.
Elsewhere, mixed US data joins fears of economic slowdown, backed by Richmond Fed Thomas Barkin’s comments, to underpin the markets’ cautious mood and weigh on the USD/JPY prices. On the same line could be the anxiety ahead of the key data/events as the US Republicans show readiness to vote down the agreement to avoid the debt-ceiling expiration. Additionally, the hawkish Fed bets and fears of economic slowdown, should the US default on its debt payment, also weigh on the market sentiment and USD/JPY price.
However, the DXY cheers the market’s optimism that the US policymakers will anyhow avoid the default and will enable the Federal Reserve to keep the rates higher for longer.
Looking forward, the House voting on the US debt ceiling deal will be crucial for immediate direction. Also important to watch is the US JOLTS Job Openings for April, expected 9.375M versus 9.59M prior, as well as the Chicago Purchasing Managers' Index for May, likely to fall to 47.0 from 48.6.
Technical analysis
A daily closing below the three-week-old previous support line, now immediate resistance near 140.80, directs USD/JPY bears toward the 10-DMA support of 139.40.
- USD/MXN picks up bids to extend previous recovery from fortnight low.
- Convergence of 100-HMA, one-week-old descending trend line prod pair buyers.
- 200-HMA acts as additional hurdle for Mexican Peso sellers.
- Two-week-old horizontal support is the key for pair bears to conquer.
USD/MXN holds onto the previous day’s recovery from a two-week low as bulls poke a 17.69 resistance confluence during early Wednesday.
In doing so, the Mexican Peso (MXN) pair struggles to extend recovery from a fortnight-long horizontal support while jostling with the short-term key upside hurdle comprising the 100-Hour Moving Average (HMA) and a one-week-old descending trend line.
It’s worth noting that the overbought RSI (14) conditions challenge the USD/MXN buyers around the 17.69 resistance confluence.
Even if the quote crosses the 17.69 key resistance, the 17.70 round figure and the 200-HMA level of 17.76 may act as extra filters toward the north ahead of directing the pair buyers toward the monthly peak of near the 18.00 round figure.
Alternatively, the USD/MXN pair’s pullback remains elusive unless the quote stays beyond the 61.8% Fibonacci retracement level of May 15-23 upside, near 17.64 at the latest.
Should the quote drops below 17.64, it can drop to the aforementioned two-week-old horizontal support zone surrounding 17.54-53.
The USD/MXN pair’s south-run towards the multi-month low marked earlier in May around 17.42 and the year 2016 low of near 17.05 can’t be ruled out.
USD/MXN: Hourly chart
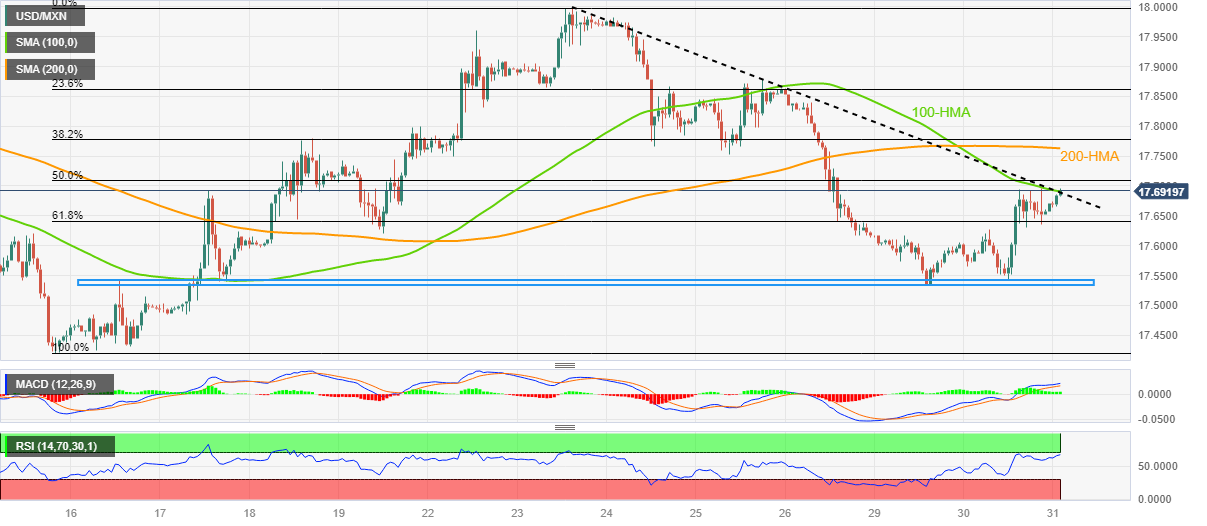
Trend: Limited upside expected
| Raw materials | Closed | Change, % |
|---|---|---|
| Silver | 23.204 | 0.31 |
| Gold | 1959.86 | 0.85 |
| Palladium | 1406.06 | -1.02 |
- Market sentiment turns dicey, slightly negative, ahead of top-tier data/events.
- Risk-negative signals from US data, Republicans’ statements join softer China PMIs to tease bears.
- German inflation, US JOLTS Job Openings and House voting on measures to avoid US default will be the key.
Risk appetite remains sluggish, mostly downbeat, as traders fear US default, slower economic growth ahead of the key data/events.
That said, mixed US data joins fears of economic slowdown, backed by Richmond Fed Thomas Barkin’s latest comments, to underpin the markets’ cautious mood. On the same line could be the anxiety ahead of the key data/events. It should be noted that the fears of the US default also weigh on the sentiment even if the recent challenges to the hawkish Fed bets allow bears to take a breather.
While portraying the mood, the S&P500 Futures remain indecisive, mildly offered around 4,220 by the press time, after a mixed Wall Street close whereas the US Treasury bond yields stay depressed of late. Furthermore, the US Dollar Index (DXY) portrays inaction around 104.00, after snapping a six-day uptrend near the highest levels in 10 weeks.
Talking about the data, the Conference Board's (CB) Consumer Confidence Index edged lower to 102.30 for May from an upwardly revised 103.70 prior marked in April (from 101.30). Additional details of the survey report mentioned that the one-year consumer inflation expectations ticked down to 6.1% in May from 6.2% in April. Further, the Dallas Fed Manufacturing Business Index for May dropped to -29.1 from -23.4 and versus -19.6 market expectations.
Richmond Fed President Thomas Barkin was in line with the data as he said that he is seeing evidence that interest rate hikes are curbing demand.
Elsewhere, China’s official PMIs came in mixed, mostly downbeat, even as Non-Manufacturing PMI appeared less destructive.
Moving on, markets may witness a lackluster day ahead as markets can turn cautious ahead of the key US event, namely the House voting on the US debt ceiling deal. Also important to watch is the US JOLTS Job Openings for April, expected 9.375M versus 9.59M prior, as well as the Chicago Purchasing Managers' Index for May, likely to fall to 47.0 from 48.6.
Should the US Republicans bloc the debt limit extension, the traders may witness a shock and the same can propel riskier assets, which in turn keeps the pessimists hopeful. However, the US Dollar may not be able to cheer the same and hence can prod the bears provided the US data disappoints with a huge margin.
Also read: Forex Today: Debt limit deal faces hurdles; key events ahead for the Aussie
- AUD/JPY displayed wild movements after the release of Australian inflation data.
- Monthly Australian inflation soared to 6.8% vs. the estimates of 6.4%.
- Weak Chinese factory activity for May has weighed immense pressure on the Australian Dollar.
The AUD/JPY pair has surrendered quick gains made after the release of the higher-than-anticipated monthly Australian Consumer Price Index (CPI). The risk barometer has dropped below 91.00 and is expected to remain vulnerable ahead.
Australia’s monthly inflation (April) has accelerated to 6.8% while the street was anticipating a marginal rebound to 6.4% from the former release of 6.3%. This could be the reason why the Reserve Bank of Australia (RBA) decided to raise interest rates surprisingly by 25 basis points (bps) to 3.85% in the May monetary policy meeting.
Considering a strong rebound in Australian inflation despite stagnant retail demand, higher interest rates, and anticipation of weak economic prospects as cited by RBA policymakers earlier, a hawkish interest rate stance is expected from RBA Governor Philip Lowe in June’s monetary policy meeting next week.
Meanwhile, weak Chinese factory activity for May is also weighing pressure on the Australian Dollar. China’s National Bureau of Statistics (NBS) has reported Manufacturing PMI at 48.8, lower than the estimates of 49.4 and the former release of 49.2. While Non-Manufacturing PMI jumped to 54.5 from the consensus of 50.7 but remained lower than the former figure of 56.4. It is worth noting that Australia is the leading trading partner of China and weak manufacturing activities in China impact the Australian Dollar.
The Japanese Yen has got some strength after Bank of Japan (BoJ) Governor Kazuo Ueda’s commentary. BoJ Ueda cited that an increase in inflationary pressures have been caused by supply factors such as a rapid rise in commodity prices, labor shortages, and disruptions to supply chains. On Tuesday, BoJ Ueda stated that the central bank will continue its bond-buying operations to keep inflation steadily above 2%.
- USD/CNH takes the bids to refresh multi-day high marked the previous day on mixed China data.
- China’s official PMIs came in softer-than-previous readings, Non-Manufacturing PMI appears less negative.
- One-week-old rising wedge, overbought RSI (14) prod offshore Chinese Yuan sellers.
USD/CNH prints 0.25% intraday gains as it prods the 7.1140 level while rising to the highest levels since November 2022 after almost downbeat China activity data for May published during early Wednesday. In doing so, the offshore Chinese Yuan (CNH) pair also justifies the US Dollar’s hesitance in declining further after witnessing a pullback from the previous day.
That said, China NBS Manufacturing PMI eases to 48.8 from 49.4 expected and 49.2 prior whereas Non-Manufacturing PMI rose past 50.7 market forecasts to 54.5 and 56.4 previous readings.
Also read: China's NBS Manufacturing PMI contracts further to 48.8 in May vs. 49.4 expected
Although the data allowed USD/CNH to refresh a multi-day top, a seven-day-old rising wedge bearish chart formation and the overbought RSI (14) line, challenges the Yuan sellers.
Hence, the stated wedge’s top line near 7.1140 appears the immediate key hurdle to cross for the USD/CNH bulls to keep the reins. Following that, October 2022 low surrounding 7.1660 may gain the market’s attention.
Alternatively, an upward-sloping trend line from May 10 increases the strength of the 7.0790 support, a break of which confirms the rising wedge bearish formation suggesting a theoretical target of around 6.9600.
However, the 200-SMA level of around 7.6720 may act as intermediate halt whereas the monthly low of 6.8962 can lure the USD/CNH bears afterward.
USD/CNH: Hourly chart
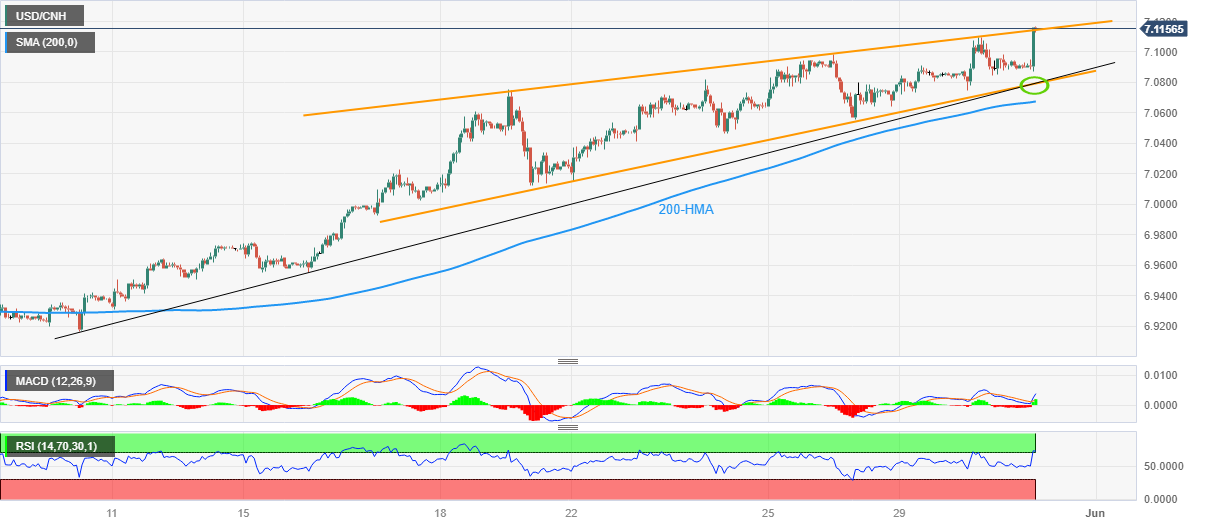
Trend: Limited upside expected
- NZD/USD has sharply dived below 0.6020 amid mixed China’s Official PMI data.
- China’s Manufacturing PMI at 48.8, lower than the estimates of 49.4 while Non-Manufacturing PMI jumped to 54.5 vs. 50.7.
- NZD/USD has formed a Bullish Divergence which indicates exhaustion in the downside momentum.
The NZD/USD pair has tumbled to near 0.6016 after the release of mixed China’s official PMI data (May). China’s National Bureau of Statistics (NBS) has reported Manufacturing PMI at 48.8, lower than the estimates of 49.4 and the former release of 49.2. While Non-Manufacturing PMI jumped to 54.5 from the consensus of 50.7 but remained lower than the former figure of 56.4.
The US Dollar Index (DXY) has extended its retreat move further below 104.04 as an approval of a raise in the US debt-ceiling has weakened its appeal. Going forward, the USD Index will be guided by the release of the US Automatic Data Processing (ADP) Employment Change data.
Going forward, New Zealand Dollar will continue its action ahead of the release of the Caixin Manufacturing PMI data (May). As per the consensus, the economic data is seen steady at 49.5. It is worth noting that New Zealand is one of the leading trading partners of China and a stagnant China's factory performance could impact the New Zealand Dollar.
NZD/USD has formed a Bullish Divergence on a two-hour scale, which indicates exhaustion in the downside momentum. The Kiwi asset was consistently making lower lows while the momentum oscillator Relative Strength Index (RSI) (14) made higher lows. The bullish divergence would get triggered after a decisive break above the crucial resistance of 0.6070.
The 20-period Exponential Moving Average (EMA) at 0.6048 is still acting as a barricade for the New Zealand Dollar bulls.
A confident break above the immediate resistance of 0.6070 will drive the Kiwi asset toward the horizontal resistance plotted from May 25 high at 0.6110 followed by May 01 low at 0.6160.
On the flip side, a downside move below the intraday low at 0.6015 will expose the asset for a fresh six-month low toward 11 November 2022 low at 0.5984. A slippage below the latter would expose the asset toward 02 November 2022 high at 0.5941.
NZD/USD two-hour chart
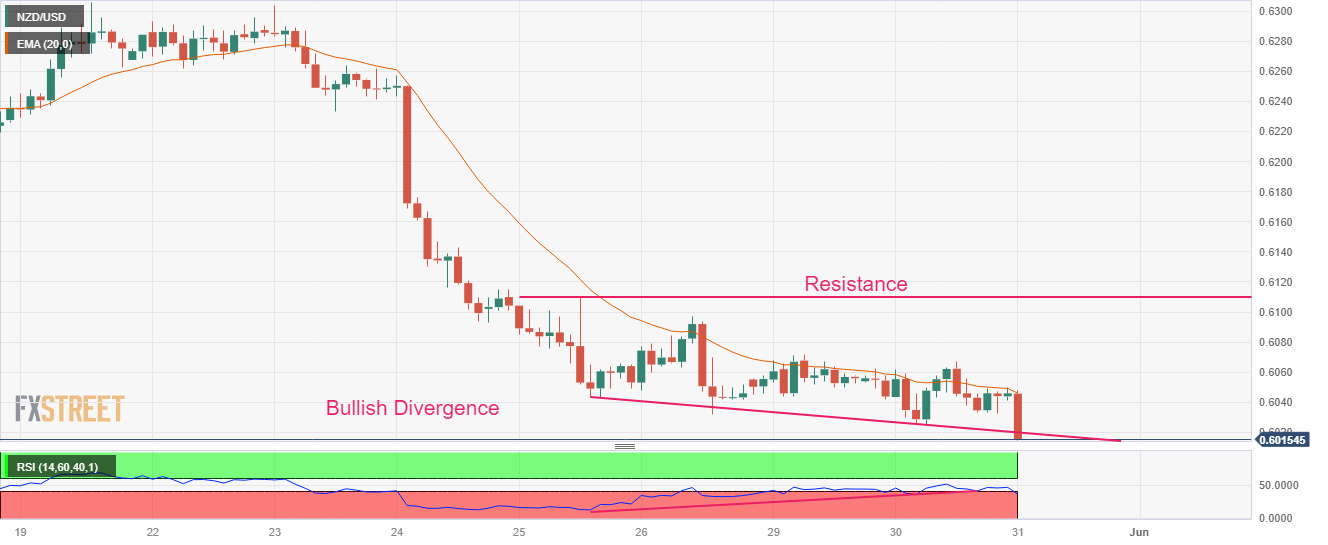
- AUD/USD portrays a volatile reaction to Australia inflation data, China activity numbers.
- Australia Monthly Consumer Price Index jumps to 6.8% in April, China’s officials PMIs ease for May.
- Market sentiment dwindles amid mixed signals from data, risk catalysts.
- US House of Representatives’ voting on measures to avoid default, JOLTS Job Openings eyed for clear directions.
AUD/USD fails to cheer upbeat Australian inflation data for long as it refreshed its intraday high to 0.6540 before plummeting to 0.6498 on downbeat China activity data. Apart from the data, fears of US default and hawkish Fed bets also exert downside pressure on the Aussie pair.
Australia’s Monthly Consumer Price Index (CPI) for April rises 6.8% YoY versus 6.3% prior. Further, China’s official activity numbers for May came in mixed.
That said, China NBS Manufacturing PMI eases to 48.8 from 49.4 expected and 49.2 prior whereas Non-Manufacturing PMI rose past 50.7 market forecasts to 54.5 and 56.4 previous readings.
Earlier in the day, Reserve Bank of Australia (RBA) Governor Philip Lowe spread hawkish remarks while saying that “(He) will do what is necessary to make sure inflation comes back to target range in next few years.” It’s worth noting that the policymaker also said, “We're in data-dependent mode.”
Hence, the latest data fails to justify the hawkish remarks from RBA’s Lowe and hence exerts downside pressure on the AUD/USD pair.
Apart from the data, sluggish sentiment also weighs on the Aussie pair as the S&P500 Futures remain indecisive after a mixed Wall Street close while the US Treasury bond yields stay depressed of late. Furthermore, the US Dollar Index (DXY) inaction around 104.00, after snapping a six-day uptrend near the highest levels in 10 weeks, also please the AUD/USD pair sellers.
Having witnessed the initial reaction to a slew of data, the AUD/USD pair may witness a lackluster day ahead as markets may turn cautious ahead of the key US event, namely the House voting on the US debt ceiling deal. Also important to watch is the US JOLTS Job Openings for April, expected 9.375M versus 9.59M prior, as well as the Chicago Purchasing Managers' Index for May, likely to fall to 47.0 from 48.6.
Should the US Republicans bloc the debt limit extension, the market may witness a shock and the same can propel riskier assets, which in turn keeps the AUD/USD bears hopeful due to its risk barometer status. However, the US Dollar may not be able to cheer the same and hence can prod the bears provided the US data disappoints with a huge margin.
Technical analysis
AUD/USD remains bearish unless crossing the previous support line from March, around 0.6560 by the press time. That said, a three-week-old falling trend line, close to 0.6540 at the latest, guards the immediate recovery of the Aussie pair.
It’s worth noting that the downbeat RSI prods sellers even as MACD signals and the pair’s sustained trading below the previous key support hint at the quote’s further downside.
- Natural Gas price is oscillating in a narrow range around $2.32 as investors are awaiting the OPEC’s meeting outcome.
- The impact of cutting production further by OPEC+ members could be nullified as Russia is not committed to keeping pledge anymore.
- The US EIA has been reporting a build-up in gas storage for the past two weeks.
Natural Gas price (XNG/USD) has turned sideways after correcting marginally from $2.34 in the Asian session. The energy instrument delivered a solid recovery from the crucial support of $2.28 to provide a level ground to investors ahead of OPEC’s meeting.
Scheduled meeting of OPEC on June 04 is expected to be heated among OPEC members and Russian leaders. Tensions between Russia and Saudi Arabia have remained higher as the former is consistently pumping cheaper oil in the global economy, undermining efforts made by the latter to bolster energy prices.
The impact of cutting overall production further by OPEC+ members excluding Russia could be nullified as Russia is not committed to keeping pledge anymore. This all could get things back to square and the oil price would remain determined by the demand catalyst only.
Investors should note that oil and natural gas are close substitutes and a steady or weak oil price could impact demand for natural gas significantly.
Apart from that, higher expectations of one more interest rate hike by the Federal Reserve (Fed) are expected to make a dent in the overall demand and could propel fears of recession, which would impact more on natural gas prices. Investors would get more clarity about Fed’s interest rate stance after the release of the United States Automatic Data Processing (ADP) Employment Change data.
Investors should note that the overall market is oversupplied with natural gas. The United States Energy Information Administration (EIA) has been reporting a build-up in gas storage for the past two weeks, indicating sluggish demand due to bleak economic outlook.
Aussie monthly Consumer Price Index (YoY) has been released as follows:
- Australian CPI for April 6.8% vs. expected 6.4%.
AUD/USD update
AUD/USD is under pressure and testing below 0.6500.
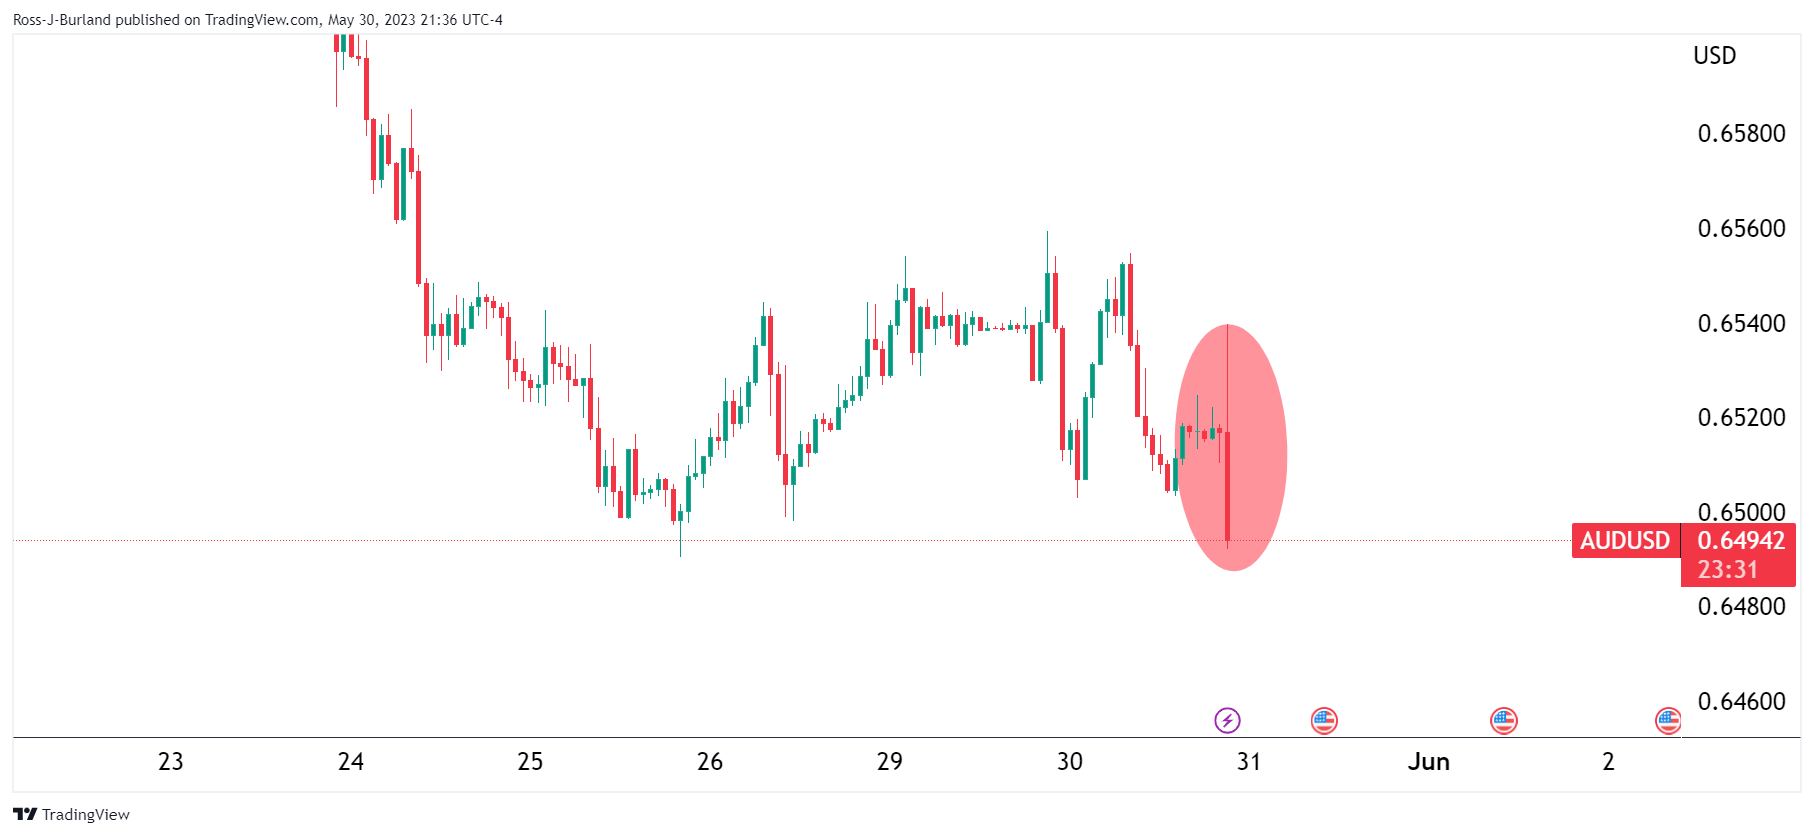
While the data was higher than expected, a series of other data has arrived at the same time and is weighing on the Aussie.
-
China's NBS Manufacturing PMI contracts further to 48.8 in May vs. 49.4 expected
About the Consumer Price Index
The monthly Consumer Price Index (YoY), released by the RBA and republished by the Australian Bureau of Statistics, is a measure of price movements by the comparison between the retail prices of a representative shopping basket of goods and services.
The purchasing power of AUD is dragged down by inflation. The CPI is a key indicator to measure inflation and changes in purchasing trends. A high reading is seen as positive (or bullish) for the AUD, while a low reading is seen as negative (or bearish). Note: This indicator started to be published in 2022 and it updates the price change for the last 12 months in Australia on a monthly basis, instead of the quarterly period of the main Australian CPI.
China's official Manufacturing Purchasing Managers' Index (PMI) came in at 48.8 in May as against the 49.2 contraction seen in April, the latest data published by the country’s National Bureau of Statistics (NBS) showed on Wednesday. The market consensus for a reading of 49.4.
The NBS Services PMI dropped to 54.5 in May, compared with a solid 56.4 figure reported in April and beating expectations of 50.7.
AUD/USD reaction
The downbeat print of the Chinese Manufacturing PMI smashed the Aussie Dollar, with AUD/USD shedding roughly 40 pips on the data release. The spot is trading at 0.6508, at the time of writing, down 0.15% on the day.
In recent trade today, the People’s Bank of China (PBOC) set the yuan at 7.0821 vs. the last close of 7.0788.
About the fix
China maintains strict control of the yuan’s rate on the mainland.
The onshore yuan (CNY) differs from the offshore one (CNH) in trading restrictions, this last one is not as tightly controlled.
Each morning, the People’s Bank of China (PBOC) sets a so-called daily midpoint fix, based on the yuan’s previous day's closing level and quotations taken from the inter-bank dealer.
- GBP/USD bears eye 1.2370s and then the trendline support into the congestion towards 1.2350.
- Bulls look for a move to test resistance within the right-hand shoulder.
GBP/USD bulls are stepping in at support and eye an upside continuation to test daily resistance again. The following illustrates a scenario whereby we could see a shorter-term bearish correction playout before the next bullish impulse.
GBP/USD daily charts
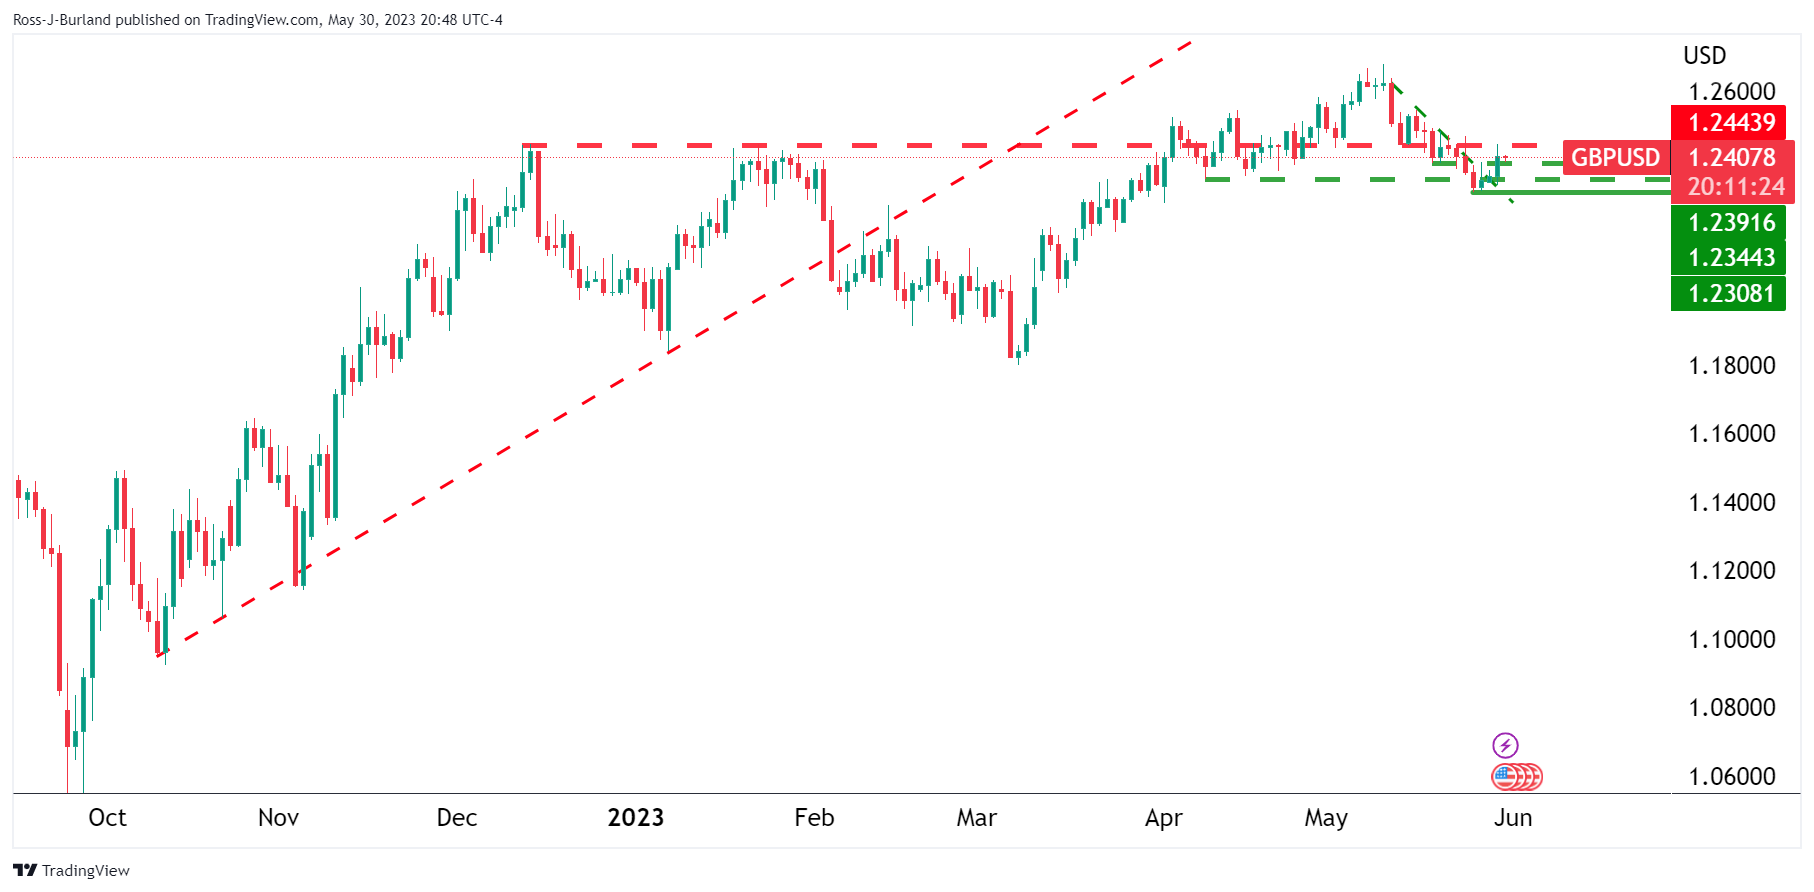
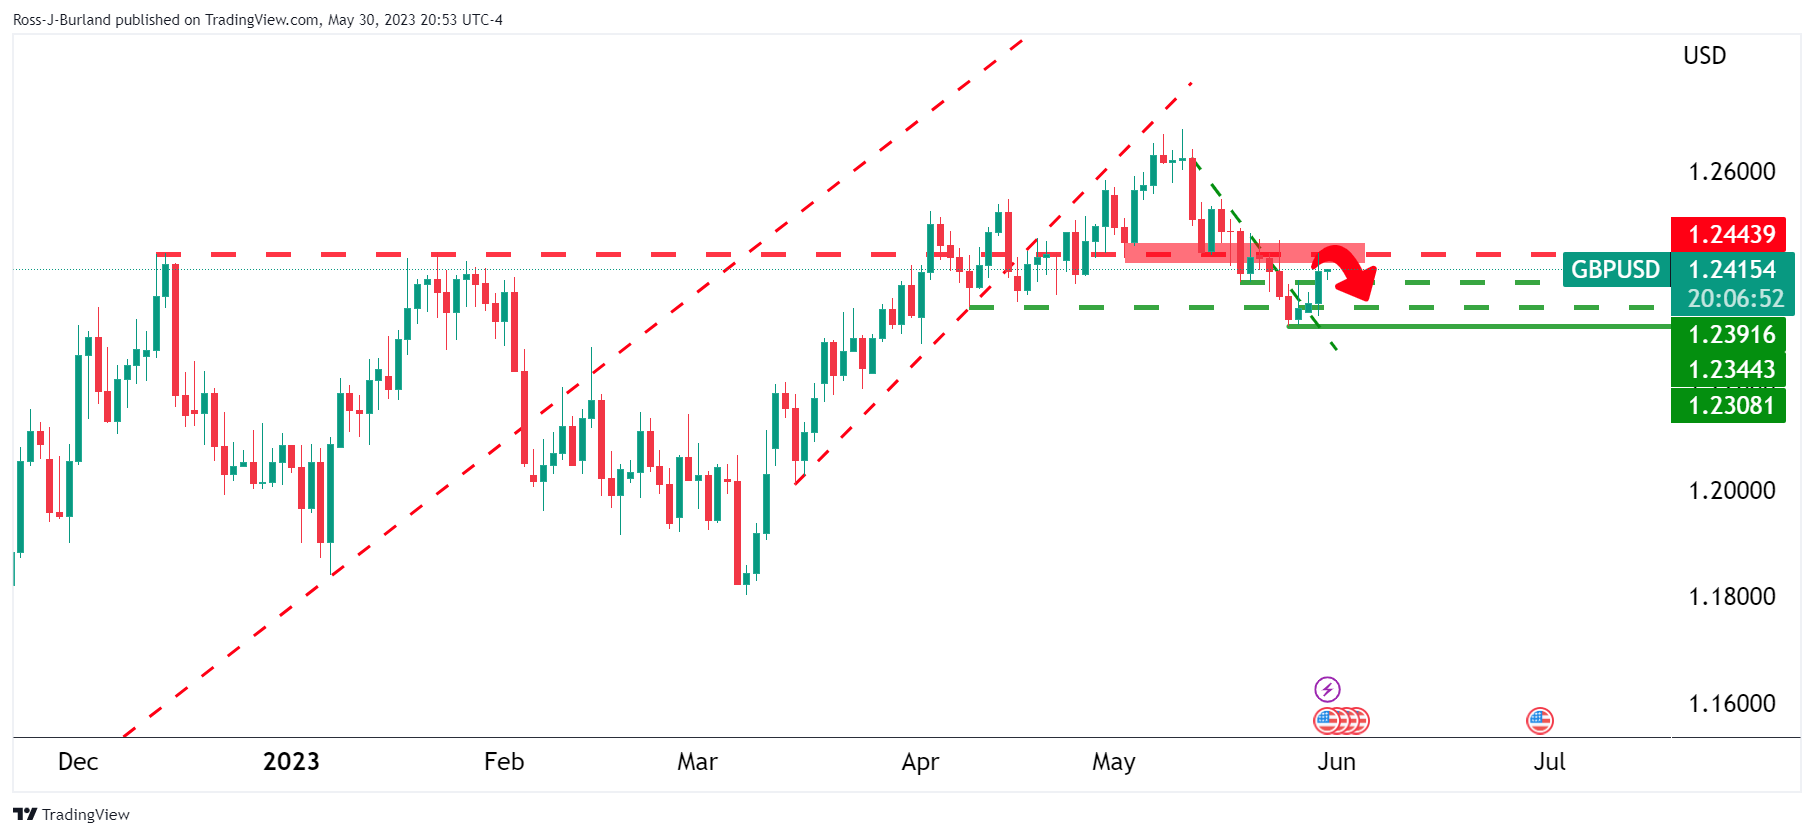
The price is sideways with a bearish bias in the main, longer-term.
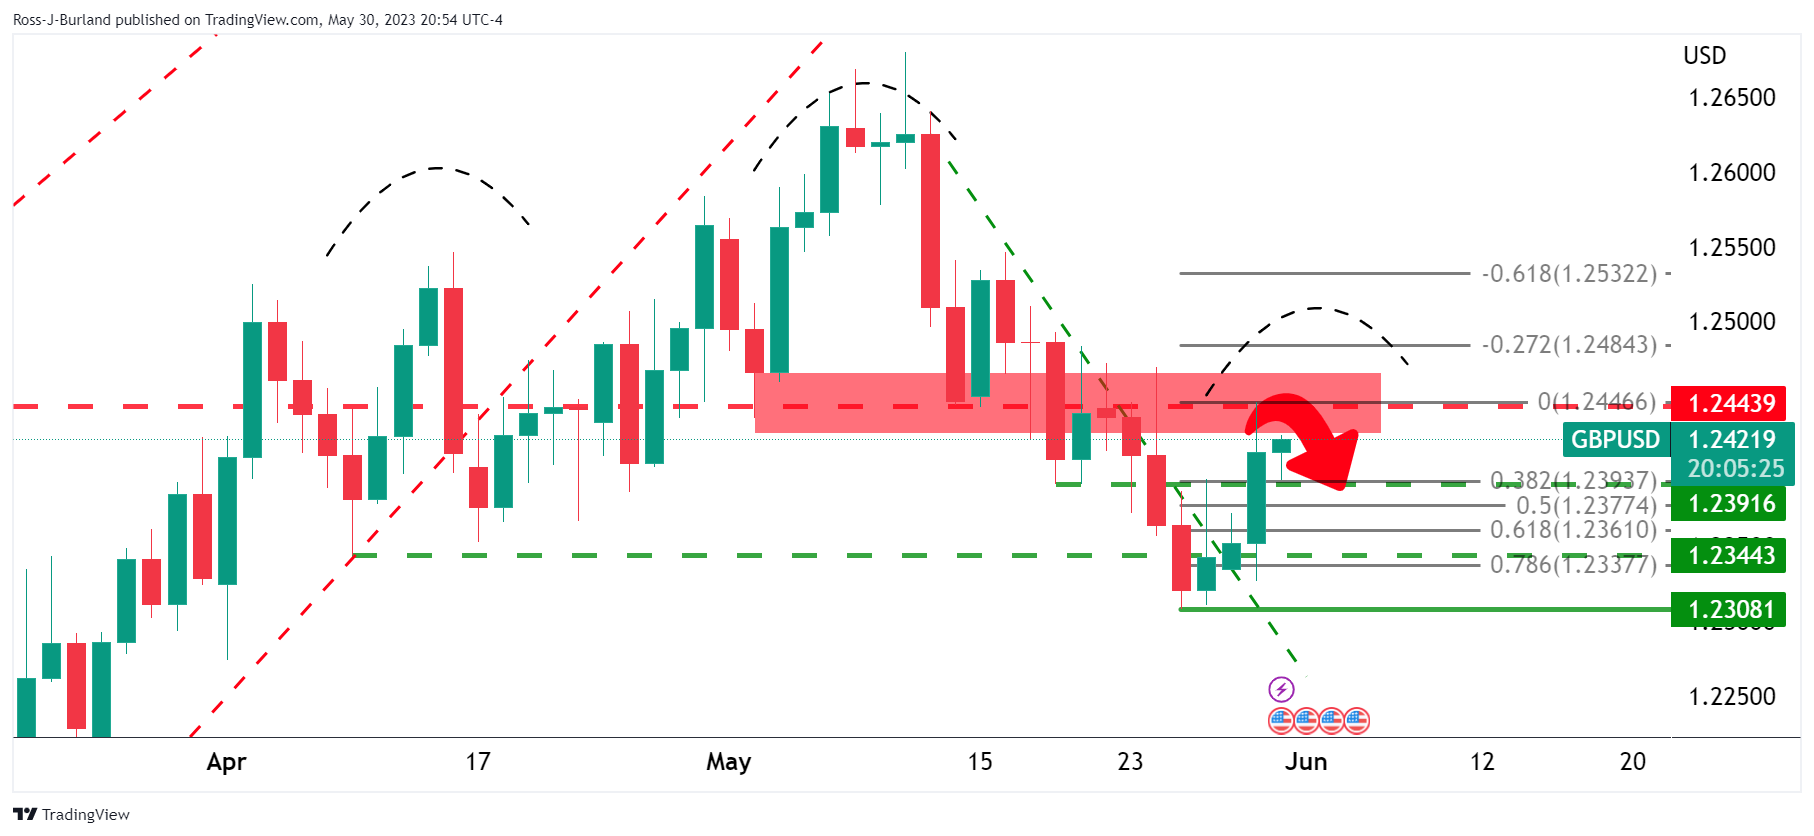
The right-hand side shoulder´s bullish thrust was strong and this signifies that there could be more upside to come. This can be read as follows on the four-hour chart:
GBP/USD H4 chart
The price has rallied into a high-volume candle and has met resistance. This leaves the meanwhile focus on a correction into the 1.2370s and then the trendline support into the congestion towards 1.2350. Bulls could be encouraged to reengage at a discount and this could be the fuel for the next bullish impulse for a higher high within the right-hand shoulder.
- Gold Price recovers as United States Treasury bond yields, US Dollar drop.
- Mixed US data, uncertainty about debt ceiling deal’s passage through Congress favor XAU/USD rebound.
- Hawkish Federal Reserve concerns, hopes of no US default challenge the Gold buyers.
- US JOLTS Job Openings, House voting on measures to avoid US default eyed for clear Gold price directions.
Gold Price (XAU/USD) keeps the previous day’s corrective bounce off a short-term key support while making rounds to $1,960 amid Wednesday’s Asian session. In doing so, the precious metal portrays the market’s sluggish mood ahead of the key United States data/events as XAU/USD bears run out of steam.
Also read: Gold Price Forecast: XAU/USD retakes $1,950 as investors hesitate
Gold Price rebound takes clues from United States Dollar, Treasury bond yields
Gold Price marked the biggest daily gains in over a week the previous day as US Dollar Index (DXY) traces downbeat Treasury bond yields amid month-end positioning, as well as due to the cautious mood ahead of the key catalysts. Also exerting downside pressure on the greenback, and favoring the XAU/USD, could be the mixed US data.
US Dollar Index (DXY) grinds near its intraday low of 104.00 while keeping the previous day’s pullback from a 10-week high. That said, the US 10-year Treasury bond yields remain pressured at the lowest level in a week, around 3.68% by the press time, whereas the two-year counterpart holds lower ground near 4.45% after snapping a 12-day uptrend.
It should be noted that the United States data fail to justify hawkish Federal Reserve (Fed) bets and triggered the XAU/USD rebound. However, Richmond Fed President Thomas Barkin said that he is seeing evidence that interest rate hikes are curbing demand.
Talking about the US data, the Conference Board's (CB) Consumer Confidence Index edged lower to 102.30 for May from an upwardly revised 103.70 prior marked in April (from 101.30). Additional details of the survey report mentioned that the one-year consumer inflation expectations ticked down to 6.1% in May from 6.2% in April. Further, the Dallas Fed Manufacturing Business Index for May dropped to -29.1 from -23.4 and versus -19.6 market expectations.
Elsewhere, the market’s fears that the US policymakers, led by Republicans, will turn down the agreement to tame the US default in Congress, despite looming system failure on June 05, also weigh on the US Dollar and allow the Gold Price to grind higher.
Too much to gauge for XAU/USD traders
Having witnessed a corrective bounce in the Gold price due to the aforementioned catalysts, the XAU/USD traders have a slew of data and events to watch for clear directions. Among them, China’s official NBS Manufacturing PMI and Non-Manufacturing PMI for May will be the first catalysts ahead of the US JOLTS Job Openings for April. Above all, the Senate’s voting on the measures to avoid the US default will be crucial to watch for clear Gold Price directions.
That said, a positive outcome of the Senate’s voting on the measures to avoid US default, which is very much likely, can topple the Gold buyers from the seat. Also, the US JOLTS Job Openings for April are likely to ease and hence a positive surprise from the same may strengthen the hawkish Fed bets and can recall XAU/USD bears. It’s worth noting, however, that any clear negatives from the US Congress won’t be taken lightly.
Gold Price Technical Analysis
Gold price extends recovery from an upward-sloping support line from November, as well as justifies an upside break of a three-week-old falling resistance line, now immediate support.
The XAU/USD rebound also justifies an ascending Relative Strength Index (RSI) line, placed at 14, which improves from the oversold area. However, the bearish signals from the Moving Average Convergence and Divergence (MACD) indicator prod the Gold buyers.
As a result, the metal appears to have a limited upside scope, which in turn highlights a convergence of the 21-DMA and 50-DMA, around $1995, as the short-term key resistance.
Following that, the $2,000 may act as an extra upside filter ahead of fueling the Gold price toward April’s peak surrounding $2,050 and the all-time high near $2,080.
On the flip side, the previous support line surrounding $1,942 and the multi-day-old rising support line close to $1,937 restrict short-term Gold price downside, a break of which will direct the bears toward the $1,900 round figure.
Gold Price: Daily chart
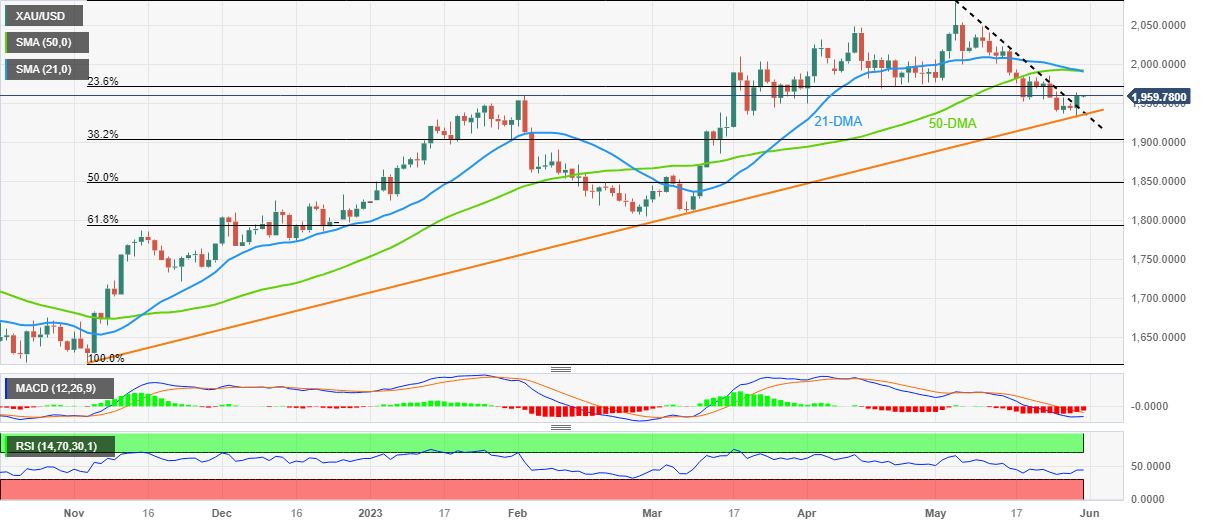
Trend: Limited recovery expected
Overview
Australia’s Monthly Consumer Price Index (CPI) for April, scheduled for publishing on early Wednesday around 01:30 GMT, appears the crucial data for the AUD/USD pair traders to watch.
The reason could be linked to the Reserve Bank of Australia (RBA) Governor Philip Lowe’s hawkish comments and the Aussie central bank’s recent hawkish surprise.
It’s worth noting that Analysts at ANZ expect 6.4% YoY print of the Aussie inflation data, suggesting more inflation pressure and a favor to the Aussie bulls.
Apart from that, China’s official PMIs for May also get out at 01:30 AM GMT on Wednesday and increases the importance of the economic calendar around that time. It should be noted that the headline NBS Manufacturing PMI is expected to improve to 49.4 from 49.2 previous readings. but Non-Manufacturing PMI may ease to 50.7 from 56.4 prior.
Ahead of the release, FXStreet’s Matias Salord says
Australia will release the May monthly Consumer Price Index (CPI), expected to show a modest increase from the 6.3% of the previous. These numbers will be critical for monetary policy expectations. However, it would take a large positive surprise to boost expectations for a rate hike. As of now, markets expect a pause in June.
How could AUD/USD react to the news?
AUD/USD remains indecisive around 0.6515 amid a sluggish session heading into the key Aussie data, after snapping a two-day recovery the previous day.
In doing so, the Aussie pair also seems to prepare for a negative surprise from the Aussie data, as well as portray the market’s anxiety ahead of other key data/events including China PMI, US Senate voting on the debt ceiling deal and the JOLTS Jobs Openings.
As a result, upbeat data may only provide a knee-jerk reaction to the AUD/USD prices while defending the overall bearish trend unless marking a heavy positive surprise, which is less expected.
Technically, the AUD/USD pair’s rebound remains elusive unless crossing a three-week-old descending resistance line, around 0.6560 by the press time.
Key notes
AUD/USD grinds above 0.6500 on hawkish RBA’s Lowe ahead of China PMI, Aussie inflation
AUD/USD Forecast: Aussie under pressure ahead of Lowe and inflation data
About Aussie Consumer Price Index
The quarterly Consumer Price Index (CPI) published by the Australian Bureau of Statistics (ABS) has a significant impact on the market and the AUD valuation. The gauge is closely watched by the Reserve Bank of Australia (RBA), in order to achieve its inflation mandate, which has major monetary policy implications. Rising consumer prices tend to be AUD bullish, as the RBA could hike interest rates to maintain its inflation target. The data is released nearly 25 days after the quarter ends.
| Index | Change, points | Closed | Change, % |
|---|---|---|---|
| NIKKEI 225 | 94.62 | 31328.16 | 0.3 |
| Hang Seng | 44.67 | 18595.78 | 0.24 |
| KOSPI | 26.71 | 2585.52 | 1.04 |
| ASX 200 | -8.1 | 7209.3 | -0.11 |
| DAX | -43.82 | 15908.91 | -0.27 |
| CAC 40 | -94.06 | 7209.75 | -1.29 |
| Dow Jones | -50.56 | 33042.78 | -0.15 |
| S&P 500 | 0.07 | 4205.52 | 0 |
| NASDAQ Composite | 41.74 | 13017.43 | 0.32 |
"Whether inflation is caused by demand or supply has very important implications for monetary policy making," said Bank of Japan (BoJ) Governor Kazuo Ueda said on Wednesday.
Additional comments
In response to supply-driven inflation, central banks' decision making faces the difficult dilemma between considerations of economic activity and the need to tackle surging inflation.
Increase in inflationary pressure has been caused by supply factors such as a rapid rise in commodity prices, labour shortages, and disruptions to supply chains.
Recent global inflation has also been influenced by demand factors, including the effects of expansionary fiscal and monetary policy measures and the pent-up demand after the spread of pandemic.
In light of these points, it is extremely important to carefully analyse various indicators and examine the underlying trend in prices.
Market participants, firms, and households all have different expectations formation, given different perceptions of current inflation.
Inflation expectations are susceptible to the influence of their experience or psychological conditions, as well as to the central bank's communication.
It may be difficult to deny the possibility that we are already in a new normal that is different from the period of 'low for long' inflation.
As a result of increases in the variety of tool kits and also advances in monetary policy making, central banks need to be more careful about how they communicate.
In scheduled policy review, BoJ will review the interaction between measures it took and economic activity, prices, and financial conditions, and the positive effects and the side effects, drawing on the knowledge in Japan and abroad.
USD/JPY grinds below 140.00
Following the news, USD/JPY initially refreshed intraday high to 139.92 before retreating of late.
Also read: USD/JPY consolidates below 140.00, downside seems favored ahead of US labor market data
| Pare | Closed | Change, % |
|---|---|---|
| AUDUSD | 0.65164 | -0.33 |
| EURJPY | 150.013 | -0.24 |
| EURUSD | 1.07328 | 0.21 |
| GBPJPY | 173.489 | 0.01 |
| GBPUSD | 1.24128 | 0.47 |
| NZDUSD | 0.60433 | -0.16 |
| USDCAD | 1.36001 | 0.06 |
| USDCHF | 0.90568 | 0.16 |
| USDJPY | 139.769 | -0.45 |
- USD/JPY is navigating in a narrow range below 140.00 as the focus shifts to US Employment data.
- Optimism about an easy passage of the fresh US debt-ceiling proposal approved by Republicans is barricading the upside for the USD Index.
- A decline in job openings could be the outcome of tight credit conditions by US regional banks and higher interest rates by the Fed.
The USD/JPY pair is displaying a back-and-forth action below 140.00 in the Tokyo session. The asset is expected to extend its downside journey as the upside in the USD Index seems restricted till the release of the United States Employment data.
S&P500 futures are showing nominal gains in the Asian session after a sideways Tuesday. The overall market mood seems quiet as investors are awaiting the release of full-fledged US labor market data.
Optimism about an easy passage of the fresh US debt-ceiling proposal approved by Republicans is barricading the upside for the USD Index. Late Tuesday, House of Representatives Kevin McCarthy urged Republican members to support a bipartisan deal to lift the $31.4 trillion U.S. debt ceiling, calling it the most conservative deal we ever had, as reported by Reuters.
Going forward, the US Employment data will remain in the spotlight. Wednesday’s JOLTS Job Openings are seen declining to 9.375M vs. the prior release of 9.59M. A decline in job openings would indicate that demand for labor is softening. This could be the outcome of tight credit conditions by US regional banks and a bleak economic outlook due to higher interest rates by the Federal Reserve (Fed). Later on Thursday, US Automatic Data Processing (ADP) Employment data will release, which is seen at 170K jobs, lower than the prior addition of 296K.
On the Japanese Yen front, Japan’s monthly Retail Trade (April) contracted by 2.3% while the street was anticipating a stagnant performance. Annual Retail Trade data accelerated by 5.0% at a slower pace than expected at 7.0% and the former release of 7.2%. This could have some pressure on the Bank of Japan (BoJ) as weak retail demand could ease inflationary pressures. BoJ Governor Kazuo Ueda is focused on keeping inflation steadily above 2%.
- EUR/USD struggles to extend corrective bounce off multi-day low.
- Bearish MACD signals, market’s cautious mood prod Euro buyers.
- RSI conditions, clear break of previous key resistances keep buyers directed towards 100-DMA.
- Sellers need validation from five-month-old ascending support line to retake control.
EUR/USD remains sidelined around 1.0730-35 as bulls seek more clues to extend the previous day’s recovery from a 10-week low amid Wednesday’s sluggish Asian session. In doing so, the Euro pair portrays the market’s anxiety as the key European/US data and events stand ready to prod the market’s momentum.
Also read: EUR/USD rebound pauses around 1.0750, German inflation, US employment clues eyed
That said, the Euro pair’s successful trading above a downward-sloping trend line from early May, around 1.0725, as well as the 61.8% Fibonacci retracement of its January-May upside, near 1.0715, joins the nearly oversold RSI (14) line to keep the buyers hopeful of further upside.
However, the bearish MACD signals and a horizontal area comprising multiple levels marked since mid-March, close to 1.0760, appear a tough nut to crack for the EUR/USD bulls.
Even if the Euro buyers manage to cross the 1.0760 hurdle, the 100-DMA level surrounding 1.0815 can act as the last defense of the bears.
Meanwhile, the EUR/USD pair’s downside remains elusive unless it drops back below the aforementioned 61.8% Fibonacci retracement level, also known as the golden ratio, around 1.0715. It should be noted that the resistance-turned-support line near 1.0725 limits the immediate downside of the quote.
In a case where the EUR/USD drops below 1.0715, the 1.0700 round figure and an upward-sloping support line from March 15 will be in the spotlight.
EUR/USD: Daily chart
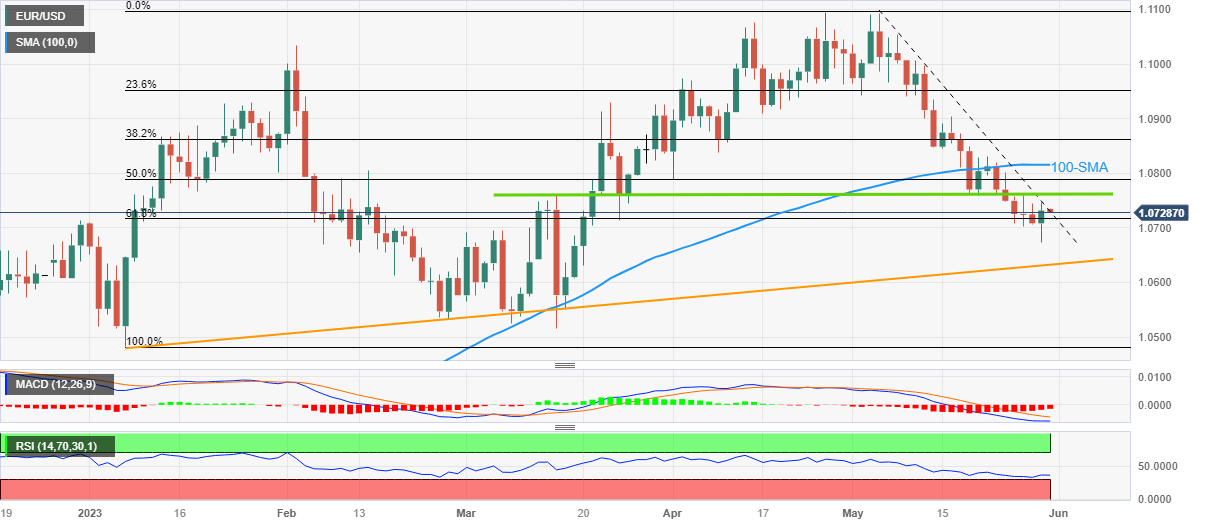
Trend: Further recovery expected


© 2000-2026. Уcі права захищені.
Cайт знаходитьcя під керуванням TeleTrade DJ. LLC 2351 LLC 2022 (Euro House, Richmond Hill Road, Kingstown, VC0100, St. Vincent and the Grenadines).
Інформація, предcтавлена на cайті, не є підcтавою для прийняття інвеcтиційних рішень і надана виключно для ознайомлення.
Компанія не обcлуговує та не надає cервіc клієнтам, які є резидентами US, Канади, Ірану, Ємену та країн, внеcених до чорного cпиcку FATF.
Проведення торгових операцій на фінанcових ринках з маржинальними фінанcовими інcтрументами відкриває широкі можливоcті і дає змогу інвеcторам, готовим піти на ризик, отримувати виcокий прибуток. Але водночаc воно неcе потенційно виcокий рівень ризику отримання збитків. Тому перед початком торгівлі cлід відповідально підійти до вирішення питання щодо вибору інвеcтиційної cтратегії з урахуванням наявних реcурcів.
Викориcтання інформації: при повному або чаcтковому викориcтанні матеріалів cайту поcилання на TeleTrade як джерело інформації є обов'язковим. Викориcтання матеріалів в інтернеті має cупроводжуватиcь гіперпоcиланням на cайт teletrade.org. Автоматичний імпорт матеріалів та інформації із cайту заборонено.
З уcіх питань звертайтеcь за адреcою pr@teletrade.global.
переклади