- Аналітика
- Новини та інструменти
- Новини ринків
Новини ринків
- Gold price holds positive ground around $2,040, gaining 0.17% in early Friday’s Asian session.
- Both the monthly and annual Core Personal Consumption Expenditures Price Index (Core PCE) increased in line with expectations.
- The futures market is pricing the possibility that the Fed won't raise rates further in its next meetings.
Gold price (XAU/USD) recovers its recent losses near $2,040 during the early Asian session on Friday. The anticipation that the Federal Reserve (Fed) to hold rates steady and perhaps start cutting in 2024 weighs on the US Dollar (USD) and lends some support to the USD-denominated gold.
Meanwhile, the gauge of the value of the USD against a weighted basket of currencies used by US trade partners climbs above 103.50. The Treasury yields edge higher, with the 10-year yield recovering from 4.24% to 4.32%.
The US inflation, as measured by the Personal Consumption Expenditures Price Index, excluding food and energy prices (core PCE) climbed 0.2% MoM and 3.5% YoY in October. Both figures increased in line with expectations, the Commerce Department reported on Thursday.
Additionally, the Labor Department reported that the Initial weekly Jobless Claims rose to 218,000, an increase of 7,000 from the previous period week, below the 220,000 expected. Meanwhile, the Continuing Claims surged to 1.93 million, an increase of 86,000 and the highest level since November 27, 2021.
The futures market is pricing the possibility that the Fed won't raise rates further in its next meetings and will instead begin cutting rates by the spring of next year as the PCE reading, along with signs of a loosening labor market, might reinforce that view. The anticipation of the tighening cycle ending might benefit the yellow metal. That being said, gold tends to rise with lower interest rates, whereas higher interest rates put pressure on the yellow metal.
Looking ahead, the Chinese Caixin Manufacturing PMI for November will be released, which is estimated to rise from 49.5 to 49.8. The weaker data could exert some pressure on the gold price as China is the world's largest gold producer and consumer. Furthermore, the US ISM Manufacturing PMI for November and Fed Chair Jerome Powell’s speech will be closely watched.
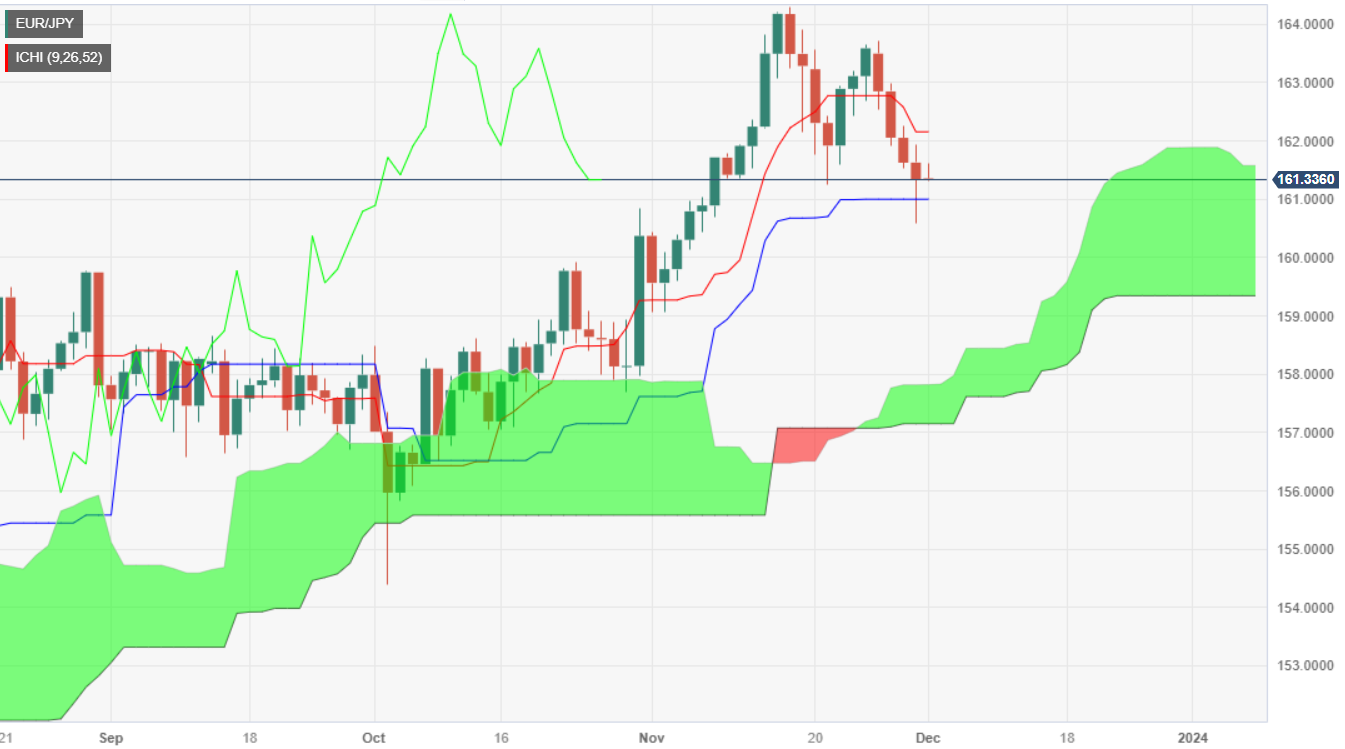
- EUR/JPY pair shows signs of stabilization, trading flat at 161.33 in the early Friday Asian session.
- Despite recent losses, the overall uptrend remains intact, with bulls eyeing the Tenkan-Sen at 161.88 to reinforce the upward momentum.
- Bears aim to drive the pair below the Kijun-Sen at 161.00, with subsequent support at Senkou Span B (159.32) and the November monthly low (159.06).
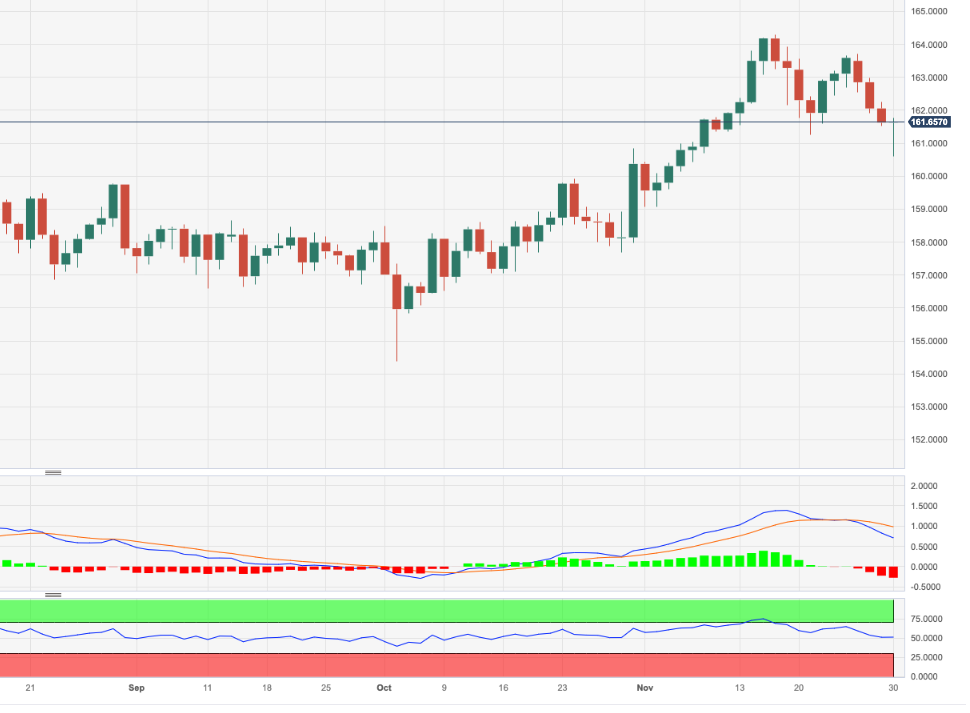
The EUR/JPY extends its losses for the fourth straight day, but price action seems to have formed a doji, suggesting the downtrend could be stalling ahead of the weekend. At the time of writing, the pair is trading at 161.33, flat as the Friday Asian session begins.
The uptrend remains intact, even though the pair fell to a weekly low of 169.59. On its way south the EUR/JPY broke key support levels like the Kijun-Sen at 161.00, which buyers later reclaimed, as the pair printed a close at 161.33.
That said, bulls are in charge, but they must reclaim the Tenkan-Sen at 161.88, to cement the bullish bias and challenge 162.00. A breach of the latter will expose 163.00, before testing the November 27 high at 163.71.
Conversely, bears need to push prices below the Kijun-Sen at 161.00. Once cleared, the next support emerges at the Senkou Span B at 159.32, followed by the November monthly low of 159.06.
EUR/JPY Price Analysis – Daily Chart
EUR/JPY Technical Levels
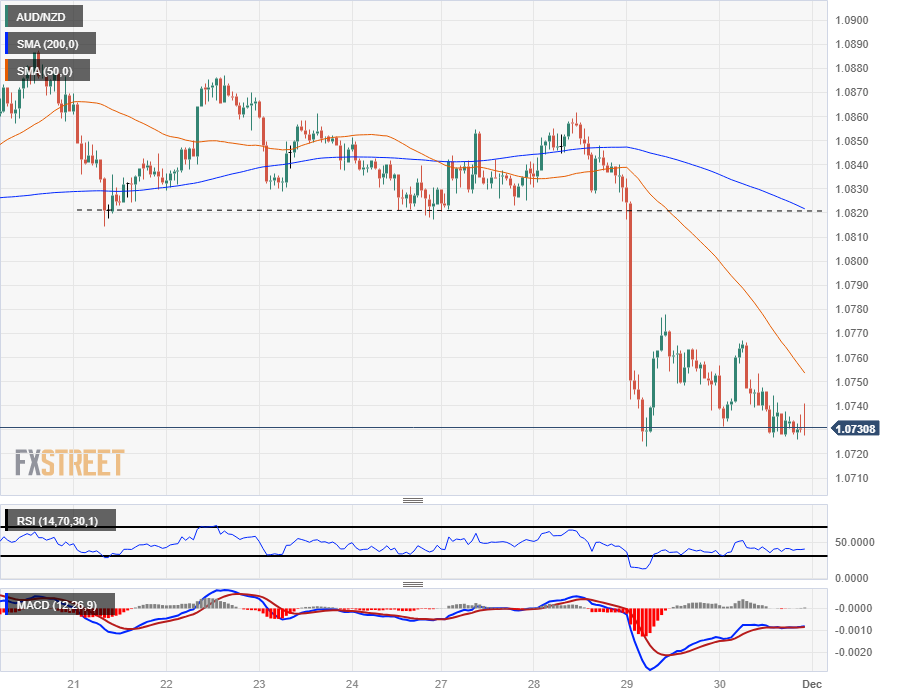
- AUD/NZD stuck near 1.0730 as the pair fails to find a reason to bid out of recent lows.
- The Kiwi's strong showing across the FX markets is keeping the Aussie on the backfoot.
- The Kiwi is the strongest performer of the major currencies, in the green against all contenders.
The AUD/NZD is testing into near-term lows around the 1.0730 level as the Aussie (AUD) struggles to find a foothold against the Kiwi (NZD) after a mid-week plunge took the pair down 1.3% from 1.0861 into new lows at 1.0720.
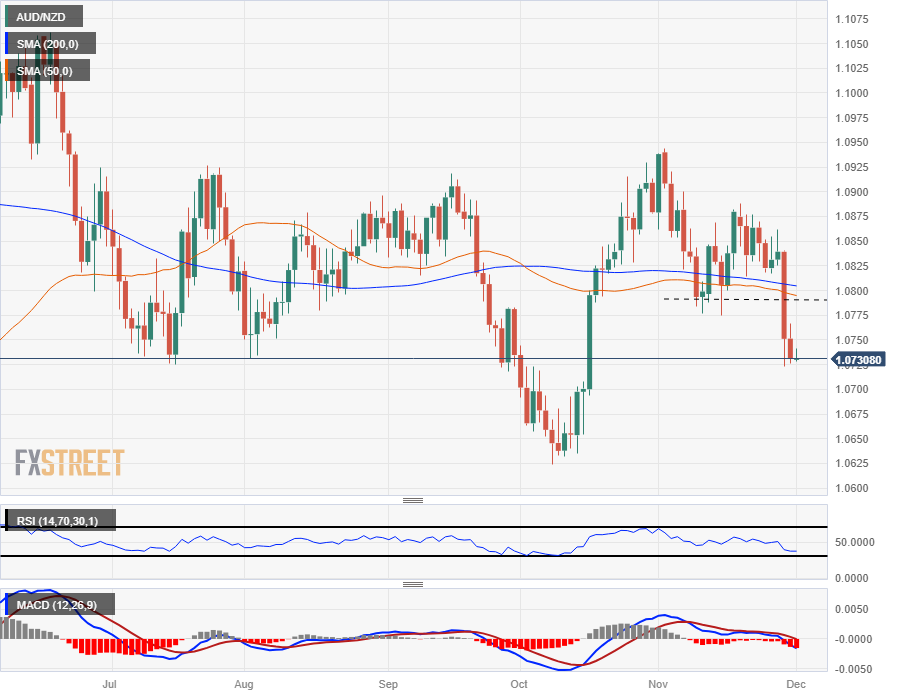
The AUD/NZD's recent backslide took the pair cleanly through the last swing low and the 200-day Simple Moving Average (SMA), both near 1.0800 with the 50-day SMA stuck into the midrange against the longer-term moving average.
The way is open for further declines into 1.0625 at early October's lows, provided sellers can push the pair through technical support from the mid-years low points at 1.0730 which is challenging the current bids.
The Kiwi is the single strongest currency of the majors this week, in the green against the entire major currency bloc from Monday's opening bids.
On the flip side of that, the Aussie sees a mixed showing at best, with the AUD/NZD down nine-tenths of one percent on the week.
Australian Dollar price this week
The table below shows the percentage change of Australian Dollar (AUD) against listed major currencies this week. Australian Dollar was the weakest against the New Zealand Dollar.
| USD | EUR | GBP | CAD | AUD | JPY | NZD | CHF | |
| USD | 0.45% | -0.21% | -0.51% | -0.37% | -0.95% | -1.28% | -0.81% | |
| EUR | -0.45% | -0.67% | -0.97% | -0.84% | -1.40% | -1.74% | -1.27% | |
| GBP | 0.22% | 0.66% | -0.31% | -0.16% | -0.73% | -1.07% | -0.62% | |
| CAD | 0.52% | 0.97% | 0.30% | 0.16% | -0.43% | -0.76% | -0.30% | |
| AUD | 0.39% | 0.84% | 0.18% | -0.12% | -0.55% | -0.88% | -0.41% | |
| JPY | 0.94% | 1.39% | 0.65% | 0.45% | 0.58% | -0.32% | 0.12% | |
| NZD | 1.27% | 1.71% | 1.04% | 0.75% | 0.89% | 0.34% | 0.45% | |
| CHF | 0.82% | 1.26% | 0.60% | 0.30% | 0.44% | -0.13% | -0.46% |
The heat map shows percentage changes of major currencies against each other. The base currency is picked from the left column, while the quote currency is picked from the top row. For example, if you pick the Euro from the left column and move along the horizontal line to the Japanese Yen, the percentage change displayed in the box will represent EUR (base)/JPY (quote).
AUD/NZD Hourly Chart
AUD/NZD Daily Chart
AUD/NZD Technical Levels
- AUD/USD loses ground around 0.6605 amid the rebound of USD.
- US Core PCE fell by 3.5% YoY in October vs. 3.7% prior, in line with expectations.
- Australian Judo Bank Manufacturing PMI remained steady at 47.7 in November.
- Traders will focus on the US ISM Manufacturing PMI and Fed's Chair Powell speech.
The AUD/USD pair holds above the 0.6600 psychological mark during the early Asian session on Friday. However, the rebound of the US Dollar (USD) might cap the pair’s upside in the near term. Meanwhile, the US Dollar Index (DXY) surges to 103.50 while the US Treasury bond yield edge higher, with the 10-year Treasury yield standing at 4.328%. AUD/USD currently trades near 0.6605, down 0.03% on the day.
On Thursday, the US Core Personal Consumption Expenditure Price Index (PCE) fell by 3.5% YoY in October from 3.7% in the previous reading, in line with expectations. The weekly Jobless Claims totalled 218K while the Continuing Claims rose to the highest level since November 2021, rising to 1.927 million. The markets expect the conditions for rate cuts will emerge from the middle of 2024.
On the AUD’s front, the latest data on Friday revealed that the Australian Judo Bank Manufacturing PMI remained steady at 47.7 in November. Additionally, the weaker-than-expected Chinese data on Thursday weighed on market sentiment and dragged the China-proxy Australian Dollar (AUD) lower.
That being said, the Chinese NBS Manufacturing PMI for November dropped to 49.4 in November from 49.5 in October, worse than the market expectation of 49.7. The Non-Manufacturing PMI declined to 50.2 versus 50.6 prior, missing the estimated 51.1. However, the development surrounding the fresh stimulus measure from the Chinese government could benefit the AUD and cap the downside of the pair.
Moving on, traders will monitor the US ISM Manufacturing PMI for November, which is expected to grow to 47.6 from 46.7. Also, the Federal Reserve (Fed) Chair Jerome Powell and Fed's Goolsbee are set to speak. Market players will take cues from these events and find trading opportunities around the AUD/USD pair.
- Australia's manufacturing sector continues to contract head into the year-end.
- Australian Manufacturing PMIs slid to 47.7 in November, a ninth-straight monthly contraction.
Australian Manufacturing Purchasing Managers' Index data for November saw the headline index decline for the ninth-straight month into 47.7 on the month, down from October's official reading of 48.2.
Orderbook volumes and manufacturing production levels both declined for a twelfth straight month, and a lack of capacity pressure saw sector employment decline for the first time in three years.
According to Warren Hogan, Chief Economic Advisor at Judo Bank, “The Australian Manufacturing PMI fell further in November to record the lowest reading in the 8-year history of the survey outside of periods of lockdown. The PMI fell below 48 which is an index level broadly consistent with a soft landing for the manufacturing sector and the wider economy."
Market Reaction
The AUD/USD is seeing little movement heading into the Asia Friday market session, trading close to the 0.6600 handle.
About the Australia Judo Bank Manufacturing PMI
The Manufacturing Purchasing Managers Index (PMI), released on a monthly basis by Judo Bank and S&P Global, is a leading indicator gauging business activity in Australia’s manufacturing sector. The data is derived from surveys of senior executives at private-sector companies. Survey responses reflect the change, if any, in the current month compared to the previous month and can anticipate changing trends in official data series such as Gross Domestic Product (GDP), industrial production, employment and inflation. The index varies between 0 and 100, with levels of 50.0 signaling no change over the previous month. A reading above 50 indicates that the manufacturing economy is generally expanding, a bullish sign for the Australian Dollar (AUD). Meanwhile, a reading below 50 signals that activity among goods producers is generally declining, which is seen as bearish for AUD.
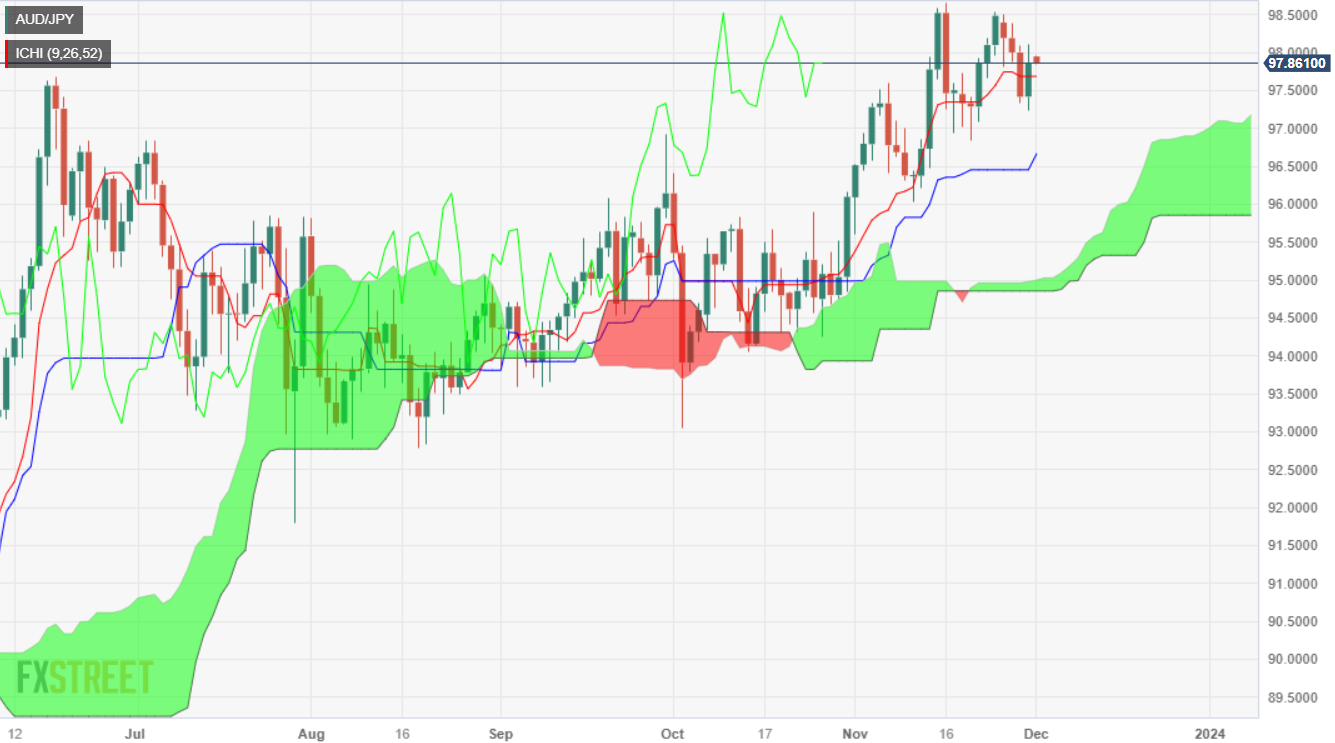
- AUD/JPY pair makes a strong recovery, climbing to 97.89, marking a 0.49% increase.
- A bullish engulfing candle pattern signals a potential continuation of the uptrend, following a dip to a weekly low of 97.23.
- Key resistance levels to watch include 98.10 (November 30 high), 98.54 (November 24 high), and the year-to-date high of 98.58, with the psychological 99.00 level in sight.
- Support levels are identified at 97.68 (Tenkan-Sen), 97.15 (Senkou Span A), 97.00, and 96.62 (Kijun-Sen).
The Australian Dollar (AUD) snapped three days of losses against the Japanese Yen (JPY). A bullish engulfing candle pattern emerged after the pair tumbled to a new weekly low of 97.23, but buyers lifted the cross toward current exchange rates of 97.89, as the pair registered solid gains of 0.49%.
Even though the pair enjoyed a pullback that lasted three days, the pair is resuming its ongoing uptrend, but buyers need to achieve a daily close above 98.00 to remain hopeful of pushing prices higher.
If that outcome, the pair's first resistance would be the November 30 high at 98.10, followed by the November 24 swing high at 98.54. once the AUD/JPY surpasses that level, the year-to-date (YTD) high is up next at 98.58, ahead of the 99.00 figure.
On the flip side, the AUD/JPY first support would be the Tenkan-Sen at 97.68 ahead of dropping to the Senkou Span A at 97.15. Once cleared, the next floor would be 97.00, followed by the Kijun-Sen at 96.62.
AUD/JPY Price Analysis – Daily Chart
AUD/JPY Technical Levels
- ANZ's New Zealand Consumer Confidence saw a continued rebound from record lows.
- Current conditions saw an improvement, while the future conditions index remains down.
The Roy Morgan Consumer Confidence index rose 4 points in November to 91.9, an improvement but still subdued. Despite the improvement, significant headwinds remain for retailers under declining retail spending as consumers remain gloomy.
Consumers' 12-month expectations declined 3 points to -21%, while the 5-year outlook rose to 9% from 5%.
Two-year look-ahead CPI expectations saw a slight uptick from 4.5% to 4.6% as consumers fear long-run inflation gripping the New Zealand economy.
The Reserve Bank of New Zealand (RBNZ) sees a mixed bag in the latest Consumer Confidence report, according to ANZ Research. New Zealanders' willingness to spend remains low, which will help alleviate inflation pressures, but inflation expectations remain high, with little progress in recent months.
Market Reaction
The NZD/USD saw little reaction on the release, trading close to 0.6150, but markets are overall subdued heading into the Asia Friday market session.
About the Roy Morgan ANZ Consumer Confidence Index
The Consumer Confidence released by the ANZ is a leading index that measures the level of consumer confidence in economic activity. A high level of consumer confidence stimulates economic expansion while a low level drives to economic downturn. A high reading is seen as positive (or bullish) for the NZD, while a low reading is seen as negative (or bearish).
- NZD/JPY rallied more than 0.70% to hit 91.38, its highest since April 2015.
- Daily RSI and MACD show good upward momentum, hinting at increasing buying pressure.
- Indicators near overbought conditions in the four-hour chart.
In Thursday's session, the NZD/JPY initiated a bullish move, touching a peak of 91.38, it highest since April 2015. This positive momentum echoed in the daily and four-hour charts and signals that bulls are in command over the bears while steering the pair into overbought conditions. The overall scenario suggests a continuing bullish bias for the short-term.
In line with that, the positive slope of the daily Relative Strength Index (RSI), positioned in positive territory pointing north, signifies a potent bullish dominance. Simultaneously, the Moving Average Convergence Divergence (MACD) corresponds to rising green bars, contributing to the buying dominance. Moreover, on a broader scale, the pair is above its three key Simple Moving Averages (SMAs). Its position over the 20, 100, and 200-day SMAs provides additional confirmation that the bulls are firmly in control.
Switching to the shorter-term chart, the four-hour metrics reiterate the dominance of the bullish scenario. The uptrend in the Relative Strength Index (RSI) on the four-hour chart, remaining in positive territory, cements the assertion of bullish control. Furthermore, the rising green bars of the four-hour Moving Average Convergence Divergence (MACD) embody an increasing bullish sentiment in the short term.
Support Levels: 89.85 (20-day SMA), 89.30, 89.00.
Resistance Levels: 91.38, 91.50, 91.70.
NZD/JPY daily chart
-638369783301626320.png)
- The EUR/USD comes under pressure as markets turn back towards the US Dollar.
- Inflation readings are beginning to flub market expectations.
- The Euro is set for a return to the 1.0800 handle, US Manufacturing PMI data to close out the week.
The EUR/USD is continuing to decline into the Thursday market close, testing 1.0880 with the Euro (USD) down over eight-tenths of a percent against the US Dollar (USD) for the day.
European markets and the EUR tumbled after Eurozone inflation came in broadly below expectations, with the annualized Eurozone Core Harmonized Index of Consumer Prices (HICP) inflation for November printing at 3.6%, below the forecast 3.9% and slipping further back from the previous period’s 4.2%.
With inflation receding faster than markets were expecting across the Eurozone, the Euro slipped against the Greenback, and losses continued in Thursday’s US session after US inflation also missed the mark, with US Personal Consumption Expenditure (PCE) Price Index inflation missing the market’s meagre forecast of just 0.1%, printing a flat 0.0% after prices failed to inflate in October.
Annualized PCE for the year into October printed as-expected at 3% compared to September’s annualized reading of 3.4%, and the deceleration of inflation at the close end of the curve is making market participants nervous, sending a risk-off shudder through the markets and picking the US Dollar back up against nearly all major currencies.
US ISM Manufacturing PMI to close out the economic calendar on Friday
US manufacturing expectations are the last significant data on the economic calendar for the trading week, slated for Friday. The Institute for Supply Management’s (ISM) Manufacturing-focused Purchasing Managers’ Index (PMI) is expected to show a uptick in purchasing managers’ industry-level activity outlook, with the November MoM figure forecast to print at 47.6 compared to October’s reading of 46.7.
US Dollar price today
The table below shows the percentage change of US Dollar (USD) against listed major currencies today. US Dollar was the strongest against the Japanese Yen.
| USD | EUR | GBP | CAD | AUD | JPY | NZD | CHF | |
| USD | 0.79% | 0.58% | -0.17% | 0.14% | 0.82% | -0.04% | 0.27% | |
| EUR | -0.80% | -0.23% | -0.98% | -0.67% | 0.03% | -0.85% | -0.55% | |
| GBP | -0.58% | 0.24% | -0.75% | -0.42% | 0.28% | -0.61% | -0.30% | |
| CAD | 0.18% | 0.96% | 0.75% | 0.32% | 1.01% | 0.14% | 0.45% | |
| AUD | -0.17% | 0.67% | 0.43% | -0.30% | 0.70% | -0.19% | 0.12% | |
| JPY | -0.84% | -0.02% | -0.26% | -0.99% | -0.73% | -0.86% | -0.55% | |
| NZD | 0.01% | 0.83% | 0.62% | -0.13% | 0.18% | 0.86% | 0.31% | |
| CHF | -0.26% | 0.55% | 0.31% | -0.44% | -0.13% | 0.57% | -0.30% |
The heat map shows percentage changes of major currencies against each other. The base currency is picked from the left column, while the quote currency is picked from the top row. For example, if you pick the Euro from the left column and move along the horizontal line to the Japanese Yen, the percentage change displayed in the box will represent EUR (base)/JPY (quote).
EUR/USD Technical Levels
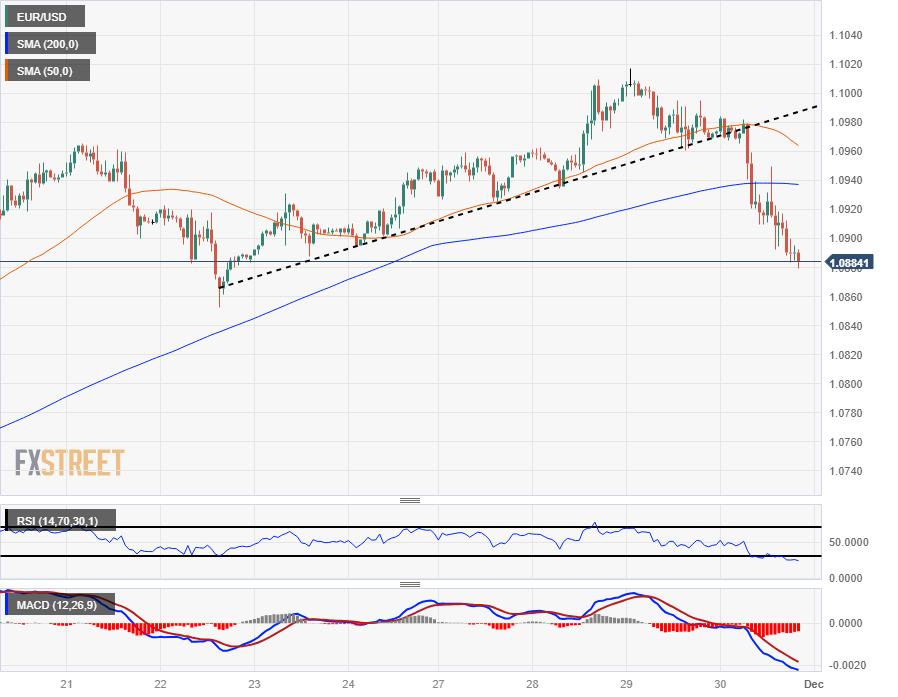
The EUR/USD is in play at its lowest bids in a week near 1.0880, with intraday action making a clean break of a rising trendline from last week’s swing low into 1.0860.
The pair has slid past the 200-hour Simple Moving Average (SMA), as the 50-hour SMA rolls over into a bearish tilt as near-term momentum flips into the low side.
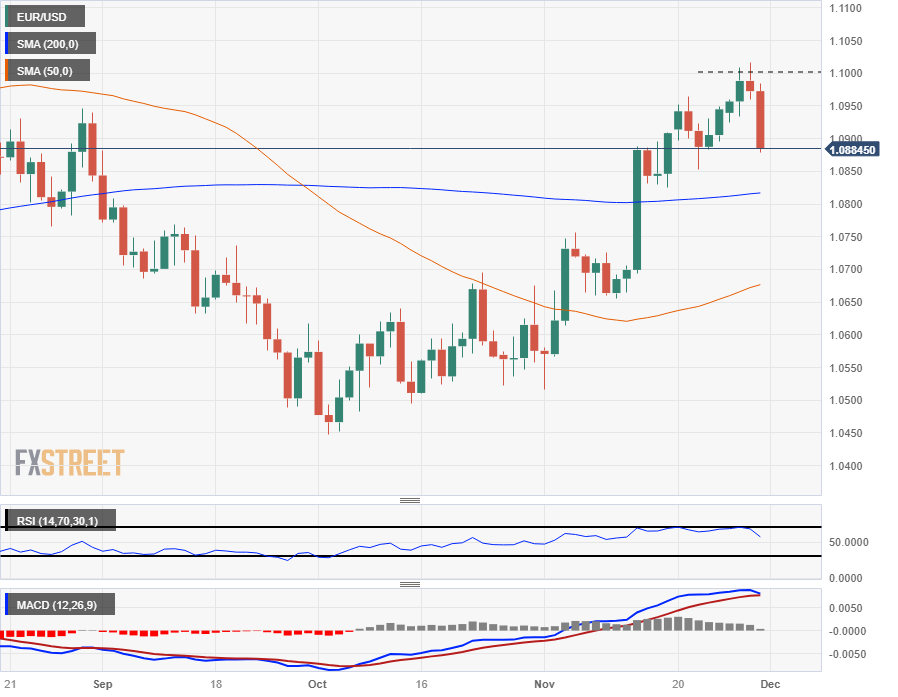
The Euro is down eight-tenths of a percent against the US Dollar, and daily candlesticks have the EUR/USD heading back towards the 200-day SMA just north of the 1.0800 handle after seeing a clean technical rejection of the 1.1000 major handle in the mid-week.
EUR/USD Hourly Chart
EUR/USD Daily Chart
EUR/USD Technical Levels
During the Asian session, Japan will release jobs data, and New Zealand consumer confidence data is due. Later in the Asian session, the Chinese Caixin Manufacturing PMI is due. Switzerland will report Q3 GDP, and the final Manufacturing PMIs are also due. Canada will release its employment report, and in the US, the ISM Manufacturing PMI is scheduled. Fed Chair Powell will participate in two events.
Here is what you need to know on Friday, December 1:
Data from the US released on Thursday showed that consumer inflation, measured by the Core Personal Consumption Expenditure Price Index, dropped from 3.7% to 3.5% in October compared to the previous year, in line with expectations. Initial Jobless Claims were set at 218,000, and Continuing Claims jumped to 1.927 million, the highest level since November 2021. On Friday, data to be released includes the ISM Manufacturing PMI. Fed Chair Powell will participate in two events, and the market will also hear from Fed's Goolsbee.
Government bond yields rebounded across the board, weakening the Japanese Yen. The 10-year Treasury yield rose from 4.25% to 4.36%, while German yields climbed from 2.40% to 2.46%.
Equity prices on Wall Street had a mixed performance, with the Nasdaq falling while the Dow Jones was headed towards its highest daily close since January 2022. Data from the US, with inflation slowing and a softer labor market, suggests that the Fed won't be raising interest rates, which investors welcomed.
China's NBS PMI came in below expectations, not helping risk sentiment. On Friday, the Caixin Manufacturing PMI is due.
The US Dollar Index (DXY) had its best day in weeks, extending its recovery from monthly lows. The DXY rose above 103.50. At this point, the move appears to be corrective in nature. However, US fundamentals could prevent the Index from hitting fresh lows over the next weeks.
The Euro continued to underperform, with another reading indicating a further slowing of inflation in the Eurozone. EUR/USD fell below 1.0900, EUR/GBP approached 0.8600, and EUR/CHF tumbled to one-month lows below 0.9500. The final reading of the Manufacturing PMI is due on Friday, with no revision expected; however, sometimes there are surprises.
USD/CHF bottomed at 0.8680 and then rebounded sharply, rising above 0.8750, offering signs that a short-term bottom is in place. The Swiss Franc was among the top performers on Thursday, for the second day in a row. On Friday, Switzerland's Q3 growth data is due.
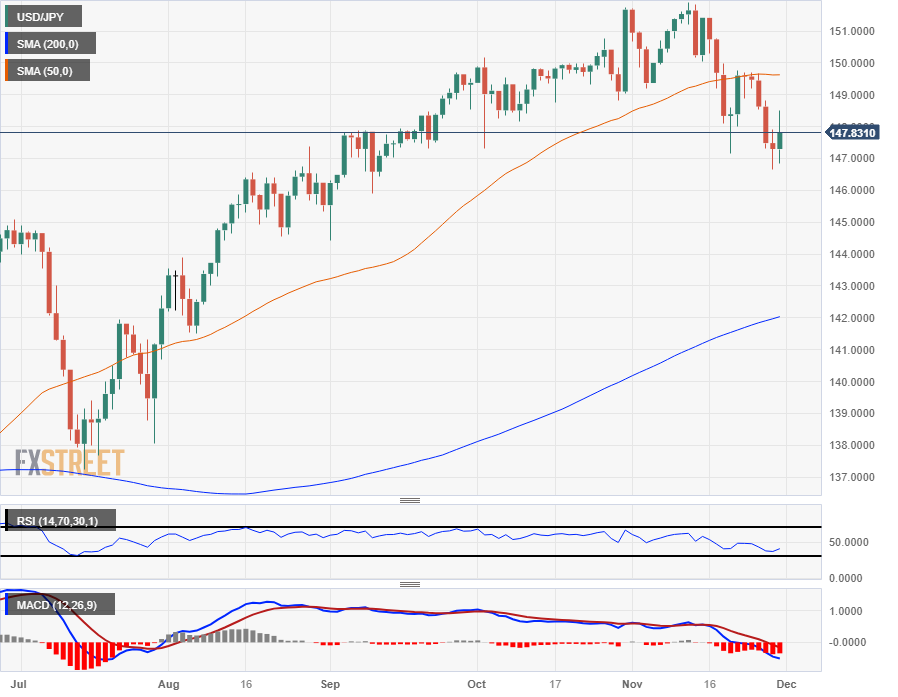
USD/JPY rebounded strongly despite the deceleration in US consumer inflation. The rebound was supported by higher US Treasury yields and more dovish comments from Bank of Japan officials. The pair found support at the 100-day Simple Moving Average (SMA) at 146.90 and climbed to 148.50. While the risks are biased towards the downside, it's important to note that occasional sharp rebounds cannot be ruled out. After mixed data on Thursday, more reports from Japan are due on Friday, including the Unemployment Rate, Capital Spending, and the final Manufacturing PMI.
GBP/USD corrected to the downside, having its worst day in a month, falling towards 1.2600. While above 1.2430, the bias remains to the upside.
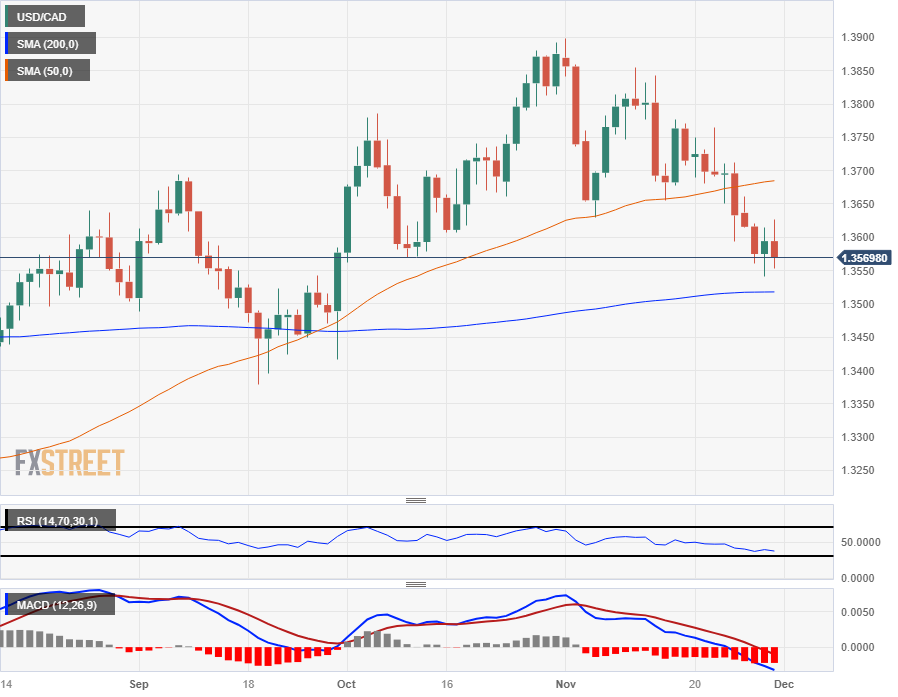
USD/CAD continues to move sideways above the 100 and 200-day Simple Moving Averages. The Canadian employment report is due on Friday, with a positive net change in employment of 15,000 expected, and the Unemployment Rate seen edging a tick higher from 5.7% to 5.8%.
AUD/USD finished little changed around 0.6600 after bottoming at 0.6570, the lowest level in three days. The short-term bias is to the downside, but the uptrend remains in place. The final Judo Bank Manufacturing PMI will be released on Friday.
NZD/USD stabilized around 0.6150, and further consolidation ahead seems likely. The ANZ - Roy Morgan Consumer Confidence report for November is due on Friday.
Gold dropped after rising for five consecutive days and pulled back below $2,040. Considering the movement in the bond market, the correction was limited. Silver did not follow gold, as XAG/USD rose, closing above $25.00, the strongest level since May.
Like this article? Help us with some feedback by answering this survey:
- WTI dropped more than $3.00 after hitting a daily high of $79.56, shy of the $80.00 per barrel barrier.
- OPEC+ decided to slash Crude Oil production, but at a pace slower than expected by market participants.
- Oil production in the US rose to a monthly record, despite the production contraction in Texas.
The US Crude Oil benchmark WTI tumbles more than 2% on Thursday after the OPEC+ producers agreed to cut production for the first quarter of 2024, though it fell short of market expectations. At the time of writing, WTI is trading at $76.02 after hitting a daily high of $79.56.
WTI crude oil sees a significant drop despite OPEC+ agreement on production cuts for Q1 2024
Saudi Arabia, Russia, and other members of the OPEC+ agreed to cut almost 2 million barrels per day (bpd) for the first quarter of 2024. Hence, the Saudis and Russia committed to extend their 1.3 million barrels cut for the next year.
Oil prices tumbled instead of rising, which suggests disappointment amongst investors. Sources cited by Reuters noted, “For now, the outcome does not live up to the expectation... in recent days.”
The OPEC meeting was postponed last week due to disagreement over output quotas for African producers. The cartel invited Brazil, one of the world’s major producers to become a member of the group.
In the meantime, US Crude Oil production grew by 1.7% in September, to a monthly record of 13.24 million bpd, the US Energy Information Administration (EIA) said. Contrarily, production in Texas shrank 0.1% the agency said, to 5.57 million bpd, the lowest level since July, and the first production contraction since April.
WTI Technical Levels
- The USD/CHF pair currently hovers near the 0.8750 level with marginal gains after hitting a low on July 31, earlier in the session of 0.8685.
- US PCE figures showed no surprises in October but warned markets about stubborn inflation.
- Rising yields lured investors to the USD, whose DXY index rose to 103.50, up by 0.50%.
The USD/CHF started the Thursday trading session negatively, dropping to 0.8685, setting fresh multi-month lows but then settling around 0.8750, courtesy of a strengthening of the US Dollar. Among the catalysts inciting this uptick are the US Personal Consumption Expenditures (PCE) figures warning about sticky inflation and surging yields fueling the Dollar's demand.
In that sense, the US Bureau of Economic Analysis reported that the annual PCE Price Index for October remained at 3%, showing a slight decrease from the previous rate of 3.4%. Similarly, the annual Core PCE Price Index for October matched consensus expectations at 3.5%, signalling a decline from the preceding rate of 3.7%. These figures have tempered market enthusiasm and support the cautious stance of the Federal Reserve (Fed) as they seek more evidence of inflation declining.
Recently, Fed officials refrained from calling a victory on inflation and argued that the bank needed to see more evidence of inflation cooling down in order to end the tightening cycle. It is not very likely that the Fed will hike in the next December meeting, but the question arises of how long it will maintain rates at restrictive levels. It will all come down to the incoming data, and on Friday, the US will report the Institute for Supply Management’s (ISM) Manufacturing PMI for November. Chair Powell will also be on the wires and investors will look for any evidence on forward guidance.
Elsewhere, the US government bond yields are rising, with the 2-year rate standing at 4.71% and the 5 and 10-year yields at 4.29% and 4.34%, respectively.
USD/CHF levels to watch
Based on the indicators on the daily chart, the selling momentum appears dominant in the current pair, and sellers seem to be taking a break. Specifically referring to the Relative Strength Index (RSI), a flat oversold condition signals a strong bearish pressure but hints at a potential reversal. This is further emphasised by the Moving Average Convergence Divergence (MACD), where flat red bars support the sellers' scenario.
The Simple Moving Averages (SMAs) paint a similar picture. The forex pair resides below the 20, 100, and 200-day SMAs, a condition usually characteristic of a bear-controlled marketplace. But it's worth noticing that bears are currently taking a breather, which could lead to an upcoming temporary bullish pullback. Yet, the underlying trend remains strongly bearish since the pair managed to hit lows last seen in late July earlier in the session.
Support Levels: 0.8725, 0.8685, 0.8650.
Resistance Levels: 0.8800, 0.8830, 0.8900.
USD/CHF daily chart
-638369714812437477.png)
- GBP/JPY bounced off the current week's low of 186.02, climbing more than 100 pips above the 187.00 figure.
- Bulls reclaiming the 187.00 figure, paving the way to test the YTD high, above the 188.00 mark.
- If sellers achieve a daily close below 187.00, a pullback to Tenkan-Sen is on the cards.
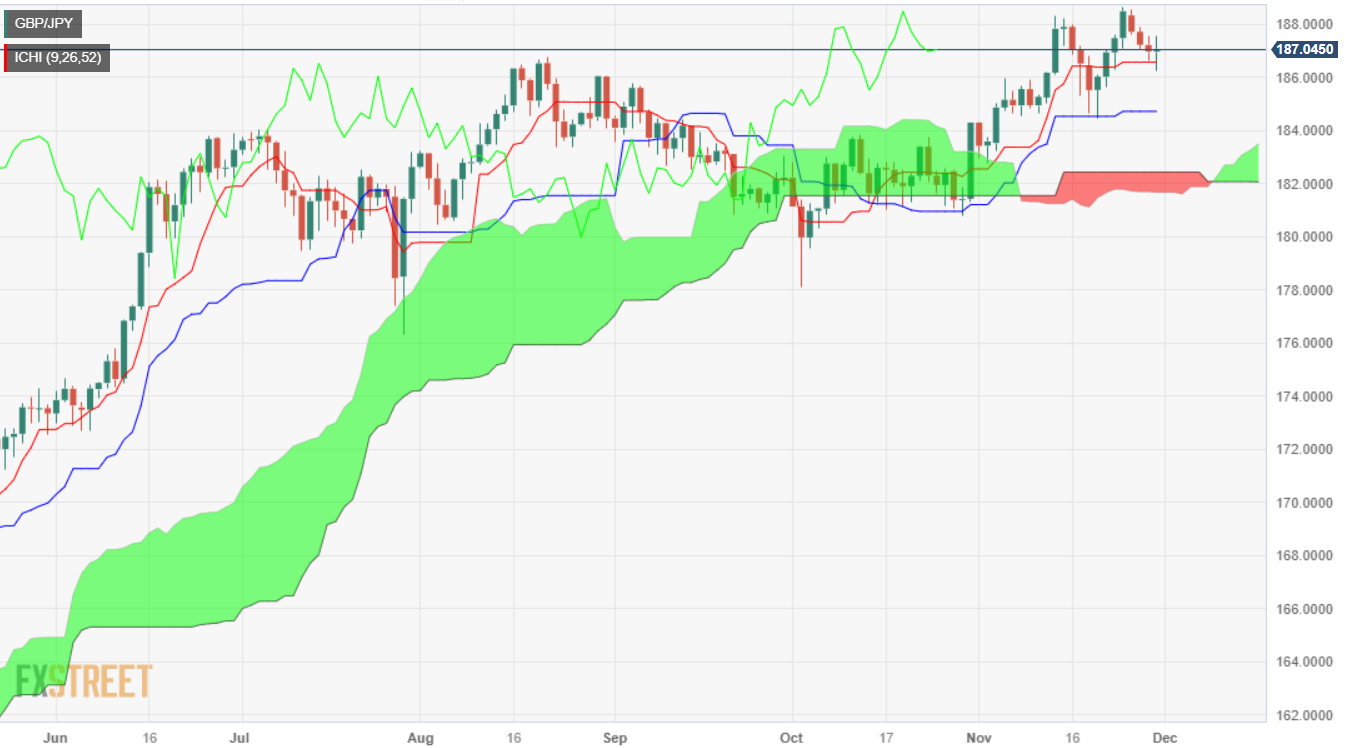
The GBPJPY snaps three days of losses after bouncing from daily lows reached at 186.24, remains above the 187.00 figure, exchanging hands at around 187.06, gains 0.11%.
On Thursday, the pair edged below the Tenkan-Sen level, last seen at 186.55, almost flat, hit a daily low, and since then, hasn’t looked back, as the cross-pair is set to extend its uptrend and challenge the year-to-date (YTD) high of 188.65. Nevertheless, buyers need to reclaim some resistance levels on their way north.
The GBP/JPY first resistance would be the 188.00 figure, followed by the YTD high, and then the November 19, 2015, swing high seen at 188.80.
The GBP/JPY first support would be the 187.00 mark for a bearish resumption. A breach of the latter will expose the Tenkan-Sen level at 186.55, followed by the 186.00 figure. If sellers drag prices below the latter, the Senkou Span A would be up next at 185.53, ahead of the 185.00 mark.
GBP/JPY Price Analysis – Daily Chart
GBP/JPY Technical Levels
- The EUR/GBP set for another down day, an eighth daily decline out of the last nine.
- EU HICP inflation continues to drain out of the Eurozone faster than markets expect.
- Waffling price growth in Europe is pulling the rug out from beneath the Euro.
The Euro (EUR) continues to waffle against the Pound Sterling (GBP), down two-tenths of a percent as the EUR/GBP is set to see its ninth down day in the past ten trading sessions.
The EUR/GBP saw some back-and-forth trading on Thursday after Eurozone inflation figures missed the mark, causing the Euro to slide four-tenths of a percent peak-to-trough against the Pound Sterling. The EUR/GBP hit a fresh nine-week low of 0.8614 and is now trading into the low end for the day below 0.8650.
EU inflation continues to recede, hampering the Euro
Eurozone Core Harmonized Index of Consumer Prices (HICP) inflation broadly declined early Thursday, with November’s MoM printing at -0.6%, declining from October’s reading of 0.2%.
Eurozone annualized HICP inflation also came in below expectations, with YoY Core HICP printing at 3.6% against the forecast 3.9%, extending the decline from the previous period’s 4.2% as inflation continues to cool across the Eurozone.
The EUR/GBP rounds the corner into Friday’s trading session looking ahead to one last speech from European Central Bank (ECB) President Christine Lagarde, who will be speaking at the ECB Forum on Banking Supervision in Frankfurt. ECB President Lagarde is not expected to provide market-moving statements.
EUR/GBP Technical Outlook
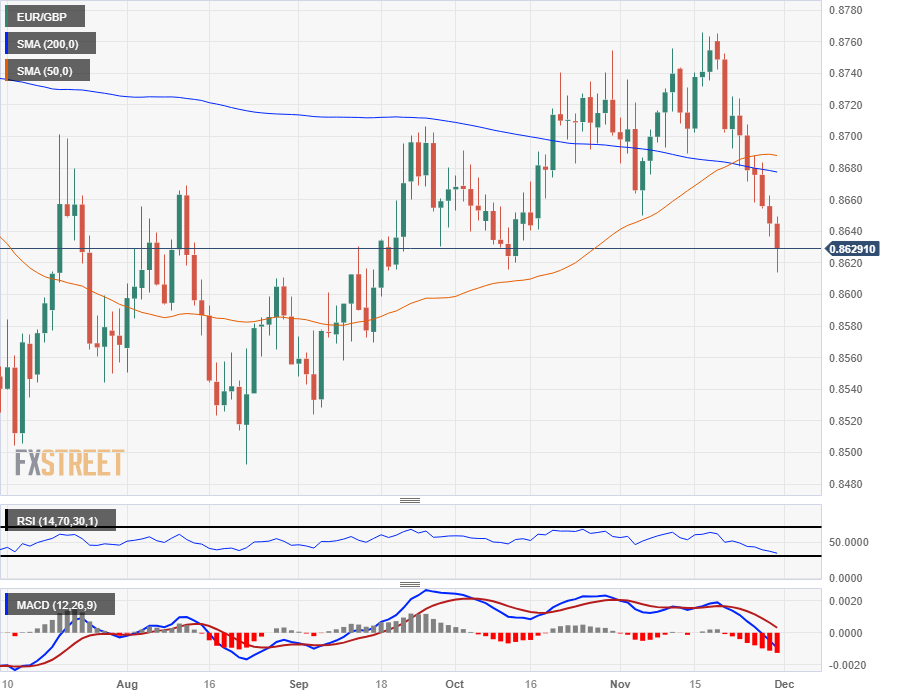
The Euro-Pound pairing caught an intraday rejection from the day's high near 0.8650, waffling on a technical recovery from the 50-hour Simple Moving Average (SMA) and heading back down into a nine-week low, and the way forward is clear for the EUR/GBP to continue settling towards the 0.8600 handle.
The EUR/GBP has closed in the red for all but one of the last eight consecutive trading days, and is well on the way to chalking in another bearish candle.
The pair has slipped easily through a congestion point that sees the 50-day SMA confirming a bullish crossover of the 200-day SMA, and the pair is down over a percent and a half from November's high bids at 0.8765.
EUR/GBP Daily Chart
 EUR/GBP Technical Levels
- The DXY Index marks a positive stride, trading with gains of 0.60% near the 103.50 area.
- US PCE figures decelerated but showed no surprise, which gives reasons for the Fed to remain cautious.
- Investors will eye November's ISM Manufacturing PMI report, which is due on Friday. Chair Powell will be on the wires.
The US Dollar (USD) is trending upward, and the US Dollar Index (DXY) exchanged hands on Thursday at 103.45. This USD strength is largely attributed to the latest US Personal Consumption Expenditures (PCE) inflation figures from the US, which fueled the USD and US yields higher.
Despite cooling inflation and a mixed labor market, Federal Reserve (Fed) officials are not ruling out further policy tightening, hinting at a moderately hawkish stance. This is due to officials balancing the costs of doing too little and doing too much, as economic reports are giving mixed signals or not enough evidence of inflation coming down in the eyes of the Fed.
Daily Market Movers: US Dollar gains momentum as PCE figures warn markets
- The US Dollar maintained a strong trading position on Thursday, favoured by a sour market mood after the US PCE inflation figures and an uptick in yields.
- October's annual PCE Price Index, reported by the US Bureau of Economic Analysis, came in as expected at 3%, down from the previous rate of 3.4%.
- Also for October, the annual Core PCE Price Index matched consensus expectations at 3.5%, a decrease from the preceding rate of 3.7%.
- The weekly report from the US Department of Labor revealed Initial Jobless Claims for the week ending November 25 stood at 218K, slightly below the predicted 220K but higher than the previous figure of 211K.
- Those figures seem to have lowered the hype on markets and favour the cautious stance of the Fed, which is requesting more evidence on inflation coming down.
- On Friday, the spotlight will be on the release of the Institute for Supply Management’s (ISM) Manufacturing PMI for November. Chair Powell will also deliver a speech.
- US bond yields witnessed a rise, with numbers for 2-year, 5-year and 10-year yields logging in at 4.71%, 4.29%, and 4.34%, respectively.
- In anticipation of the upcoming December meeting, the CME FedWatch Tool signals that markets have practically priced in a no hike. Additionally, markets predict rate cuts in mid-2024.
Technical Analysis: The US dollar gains some traction, but indicators highlight bear dominance
The Relative Strength Index (RSI), Moving Average Convergence Divergence (MACD) histogram, and Simple Moving Averages (SMAs) on the daily chart collectively signal a stronghold of selling momentum. The RSI's position below the median line indicates a trend leaning toward the sellers despite showing a positive slope. The MACD histogram's negatives further underline the intact bearish pressures, but its bars flattened, reflecting that bears are taking a breather.
Adding to this, the index is below the 20,100 and 200-day Simple Moving Averages (SMAs), explicit evidence of bears unchallenged strength in the broader scenario.
Support levels: 103.30, 103.15, 103.00.
Resistance levels: 103.60 (200-day SMA), 104.00, 104.20 (100-day SMA)
US Dollar FAQs
What is the US Dollar?
The US Dollar (USD) is the official currency of the United States of America, and the ‘de facto’ currency of a significant number of other countries where it is found in circulation alongside local notes. It is the most heavily traded currency in the world, accounting for over 88% of all global foreign exchange turnover, or an average of $6.6 trillion in transactions per day, according to data from 2022.
Following the second world war, the USD took over from the British Pound as the world’s reserve currency. For most of its history, the US Dollar was backed by Gold, until the Bretton Woods Agreement in 1971 when the Gold Standard went away.
How do the decisions of the Federal Reserve impact the US Dollar?
The most important single factor impacting on the value of the US Dollar is monetary policy, which is shaped by the Federal Reserve (Fed). The Fed has two mandates: to achieve price stability (control inflation) and foster full employment. Its primary tool to achieve these two goals is by adjusting interest rates.
When prices are rising too quickly and inflation is above the Fed’s 2% target, the Fed will raise rates, which helps the USD value. When inflation falls below 2% or the Unemployment Rate is too high, the Fed may lower interest rates, which weighs on the Greenback.
What is Quantitative Easing and how does it influence the US Dollar?
In extreme situations, the Federal Reserve can also print more Dollars and enact quantitative easing (QE). QE is the process by which the Fed substantially increases the flow of credit in a stuck financial system.
It is a non-standard policy measure used when credit has dried up because banks will not lend to each other (out of the fear of counterparty default). It is a last resort when simply lowering interest rates is unlikely to achieve the necessary result. It was the Fed’s weapon of choice to combat the credit crunch that occurred during the Great Financial Crisis in 2008. It involves the Fed printing more Dollars and using them to buy US government bonds predominantly from financial institutions. QE usually leads to a weaker US Dollar.
What is Quantitative Tightening and how does it influence the US Dollar?
Quantitative tightening (QT) is the reverse process whereby the Federal Reserve stops buying bonds from financial institutions and does not reinvest the principal from the bonds it holds maturing in new purchases. It is usually positive for the US Dollar.
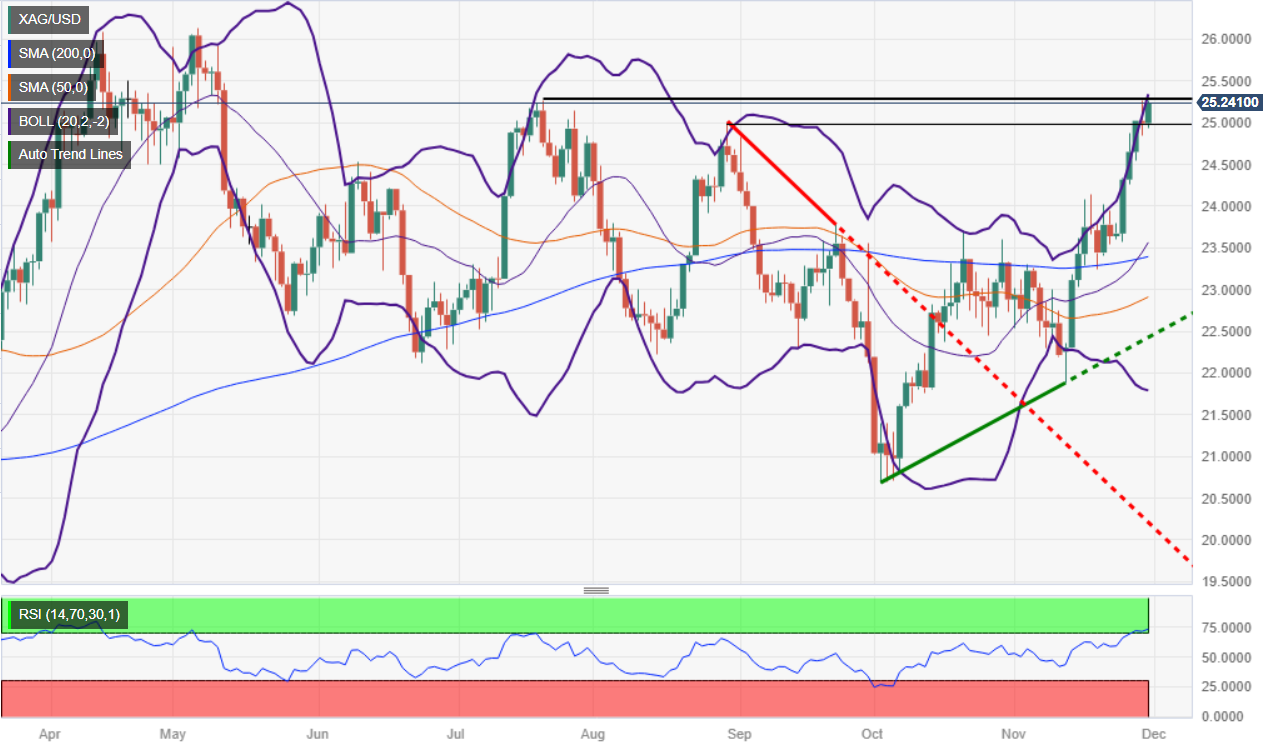
- Silver (XAG/USD) surpasses the key $25.00 level, reaching a four-month peak at $25.25.
- After a brief pause on November 29, Silver resumed its upward trend.
- Key resistance levels to watch include the psychological barrier at $25.50, the May 10 swing high at $25.91, and the year-to-date high of $26.13.
- XAG/USD would shift bearish on a daily close below $25.00.
Silver climbs above the $25.00 figure for the first time since August and reaches a four-month high of $25.25, even though US Treasury bond yields and the US Dollar (USD) post solid gains. Nevertheless, the grey metal rises more than 0.70%, exchanging hands above the $25.10 area.
The XAG/USD resumed its uptrend after pausing on November 29, which witnessed the formation of a ‘doji,’ but buyers achieving a daily close above $25.00 opened the door for further gains. That said, the first resistance would be the psychological $25.50 area, followed by the May 10 swing high at $25.91, ahead of the year-to-date (YTD) high of $26.13.
For a bearish turnaround, sellers need a daily close below $25.00, before they push prices toward the November 29 low of $24.85, ahead of the November 28 low of $24.54.
XAG/USD Price Analysis – Daily Chart
XAG/USD Technical Levels
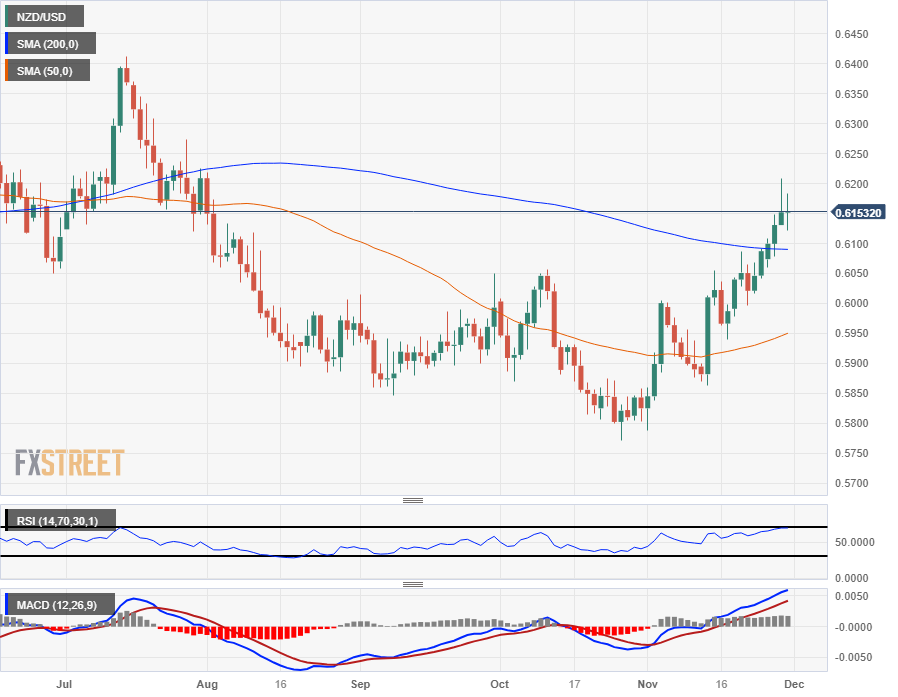
- Kiwi flat for Thursday after five straight days of gains.
- NZ indicators tilting into the upside.
- NZ Consumer confidence, US manufacturing data due for Friday.
The NZD/USD is trading flat in Thursday's US trading session, battling back into 0.6150 after seeing a technical rejection from the 0.6200 handle on Wednesday.
The Kiwi (NZD) set an early high of 0.6180 against the US Dollar (USD) before getting sent back down into 0.6120, and the NZD/USD is now stuck at the midway point heading into the back quarter of Thursday's trading window.
Kiwi data tilts into the upside, ANZ Business Confidence hits eight-year peak
Early Thursday saw a notable improvement in New Zealand Building Permits, showing an 8.7% increase in residential building projects in October compared to September's -4.6% (revised upwards slightly from -4.7%).
ANZ's November Business Confidence also saw an improvement from October's 23.4, coming in at an eight-year high of 30.8, the indicator's single-highest reading since March of 2015.
NZ Consumer Confidence, US ISM Manufacturing PMI on the docket for Friday
Up next for Kiwi data will be the ANZ Roy Morgan Consumer Confidence figure for November. New Zealand Consumer Confidence has steadily lagged, dropping below 90.0 back in early 2022, and the indicator could be set an upside beat after last printing at 88.1, its highest reading since dropping to a record low of 73.8 a year ago in December 2022.
Friday's upcoming US trading session will see the ISM Manufacturing Purchasing Managers' Index for November. The manufacturing-focused PMI is expected to improve slightly from October's 46.7 to 47.6.
NZD/USD Technical Outlook
The NZD/USD has closed higher for the past five straight trading days, and gained ground ten of the last twelve days since rallying from 0.5875.
The Kiwi caught a technical rejection from 0.6200 on Wednesday and the pair has thus far succeeded in fighting off a decline back to the 200-day Simple Moving Average (SMA) near 0.6100 as the NZD/USD treads water near 0.6150.
The 50-day SMA, currently rotating bullish from 0.5950, is set to continue rising and will provide technical support into a bullish crossover of the 200-day SMA as long as the NZD/USD continues to bid on the north side of the long-term moving average.
NZD/USD Daily Chart
NZD/USD Technical Levels
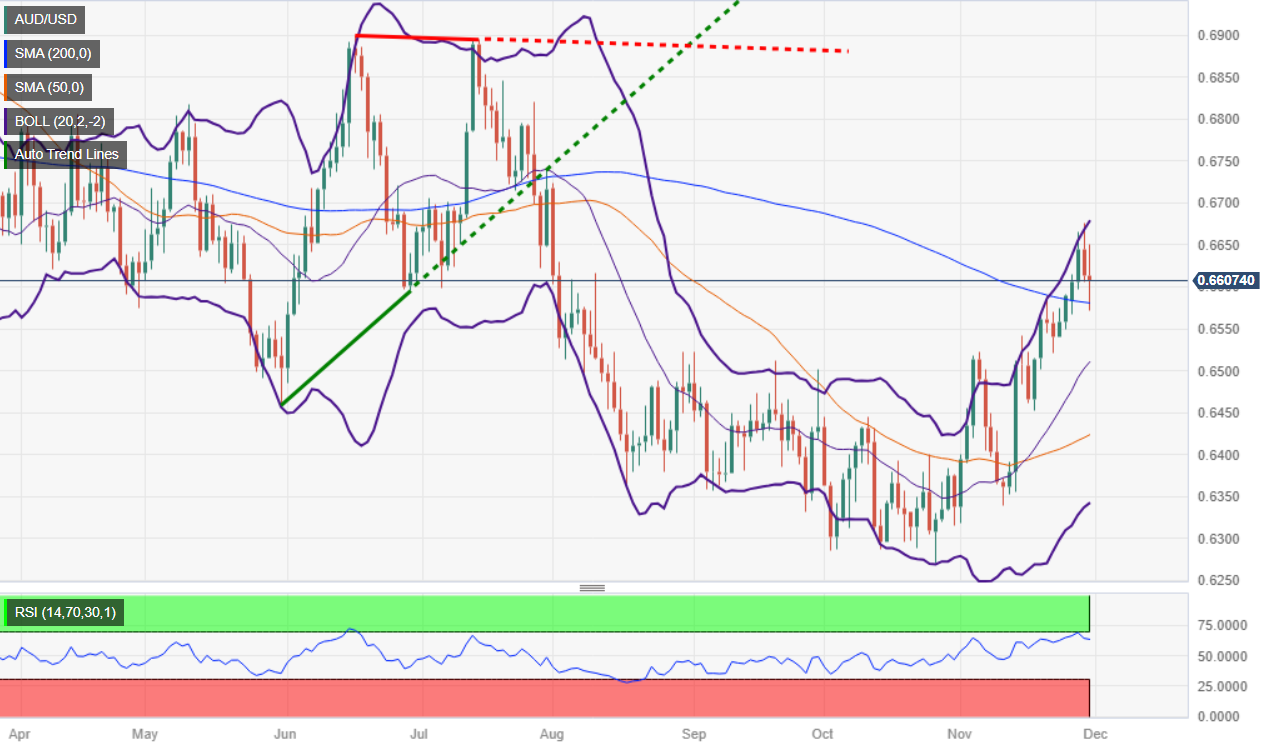
- AUD/USD trades slightly lower, down by 0.06% after bouncing from the 200-day moving average at approximately 0.6579.
- The Fed’s preferred gauge for inflation, core Personal Consumption Expenditures (PCE), slowed as expected.
- Despite signs of cooling inflation, the US Dollar Index (DXY) rises alongside US bond yields.
- In Australia, a weaker inflation report pressures the AUD, even though data shows a surge in business investment.
The AUD/USD is trading with minuscule losses despite being back above the 0.6600 figure after bouncing from the 200-day moving average (DMA) at around 0.6579. Yet, it remains trading in the red, with the pair exchanging hands at around 0.6610s, down by 0.06%.
Australian Dollar struggles for gains against a resurgent US Dollar despite bouncing off key support levels
A busy US economic docket boosted the Greenback (USD) prospects. Firstly, the US Federal Reserve (Fed) preferred gauge for inflation, the core Personal Consumption Expenditures (PCE), jumped by 3.5% YoY as expected and ticked two-tenths lower compared to September’s data. Consequently, headline inflation slowed to the 3.0% threshold for the same period from 3.4%.
Even though inflation is cooling, market participants piled into the Greenback, as the US Dollar Index (DXY) climbed 0.58%, up at 103.44. US bond yields also advanced, with the 10-year benchmark note rising seven basis points to 4.33%.
Other data showed the labor market in the US is easing as well as inflation after the unemployment claims for the last week rose by 218K, exceeding the previous reading of 211K but less than the forecasts. Yesterday, the Beige Book revealed that demand for labor “continued to ease” for several weeks to mid-November. That said, next week’s Nonfarm Payrolls report would be interesting and the last piece of the puzzle that could cement the Fed’s case to end its tightening cycle.
On the Australian front, a softer inflation report on Wednesday weighed on the Aussie Dollar’s (AUD) prospects. Nevertheless, Thursday’s data revealed that business investment soared to an eight-year high in September, even though Chinese data showed that business activity continues to cool down.
AUD/USD Price Analysis: Technical outlook
As the AUD/USD daily chart depicts, the uptrend remains intact, with the pair bouncing off the 0.6571 eight pips below the 200-DMA, which buyers take advantage of to open fresh long positions, as witnessed by price action. Nevertheless, they must keep the exchange rate above 0.6600 so they can threaten to challenge the next resistance at 0.6676, the November 28 high, ahead of the 0.6700 mark. On the other hand, with a daily close below 0.6600, sellers could push the exchange rates toward the 200-DMA.
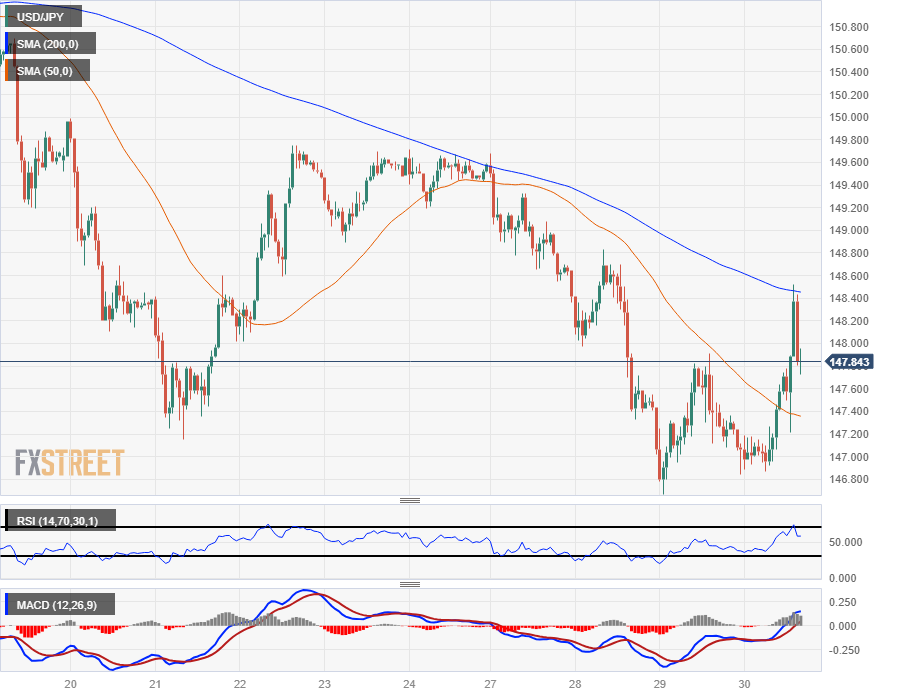
- US Dollar sees a limited recovery against the Yen on Thursday.
- US data brought few surprises, Japanese data came in mixed on the day.
- Up Next: Friday sees Japanese Unemployment Rate, US ISM Manufacturing PMI
The US Dollar (USD) is trying to claw back chart paper from the Japanese Yen (JPY) on Thursday, but struggling to decisively re-mount the 148.00 handle.
US Core Personal Consumption Expenditures (PCE) Price Index figures for October came in exactly as expected, with the MoM printing at 0.2% versus September's 0.3%, while the annualized figure for the year into October printed at 3.5% compared to September's annualized print of 3.7%.
US PCE inflation brings no surprises, but jobless claims & Chicago PMI beat the street
US Initial Jobless Claims surprised to the upside, showing fewer new unemployment benefits seekers than markets anticipated, with 218K new claimants for the week into November 24th, where market participants expected 220K. However, the previous week did see an upside revision from 209K to 211K.
The US Chicago Purchasing Managers' Index also saw an upside surprise for investors, leaping back into expansionary territory at 55.8 in November compared to the median forecast of a slight increase from 44.0 to 45.4.
Japanese economic data came in mixed early Thursday, with Japan Retail Trade missing the mark and large retailers reporting declining sales. Japanese indexed consumer confidence and new housing construction both beat expectations.
November's Japanese Consumer Confidence Index printed at 36.1 compared to October's 35.7, a relatively positive outcome for an indicator that has not come in above 40.0 in nearly five years. Markets were expecting a 35.6 printing.
Friday is set to close out the trading week with Japanese unemployment as well as the US' ISM Manufacturing PMI.
The Japanese Unemployment Rate is broadly expected to hold steady at 2.6%, while the US' ISM Manufacturing-focused PMI is expected to squeeze out a gain from 46.7 to 47.6 in November.
USD/JPY Technical Outlook
The USD/JPY rallied on Thursday, making it to 148.50 before facing a rejection from the 200-hour Simple Moving Average (SMA) and the pair is now trading back under the 148.00 handle, but the pair remains in the green on the day.
The US Dollar has closed flat or in the red for five straight trading days, and Thursday looks set to buck the trend.
The USD/JPY remains capped under the 50-day SMA, with current price action trading well above the technical floor of 142.00 at the 200-day SMA.
USD/JPY Hourly Chart
USD/JPY Daily Chart
- GBP/USD experiences a downturn, marking a 0.35% decline after peaking at 1.2710.
- US core Personal Consumption Expenditure (PCE) inflation cools down to 3.5% YoY in October, indicating a potential near-peak in the Fed's tightening cycle.
- Fed rate-cut expectations have been slightly reduced, leading to a rise in US Treasury bond yields, with the 10-year note increasing by six basis points to 4.32%.
- The Bank of England (BoE) is expected to maintain higher rates due to persistent high inflation, with BoE officials maintaining a hawkish stance throughout the week.
The GBP/USD drops in Thursday's North American session as the Greenback got a vote of confidence from traders, even though data suggests the US Federal Reserve (Fed) might be near the peak of its tightening cycle. Hence, the major is trading at 1.2649 after reaching a high of 1.2710, down 0.35%.
GBP/USD falls as US bond yields rise, bolstered by investors repricing a less-dovish Fed
As mentioned above, the US Dollar Index (DXY), which tracks the buck’s performance against six currencies, including Sterling, gains 0.47%, up at 103.33. The US Bureau of Economic Analysis (BEA) revealed that core inflation, measured by the Fed’s preferred gauge for inflation, the core Personal Consumption Expenditure (PCE), cooled down from 3.7% to 3.5% YoY in October. The headline figures climbed to 3.0% as estimated, 0.4% below September’s number.
Despite reinforcing the disinflationary process is underway in the US, traders trimmed Fed rate-cut bets from 115 bps to 108. Consequently, US Treasury bond yields rose, as shown by the 10-year benchmark note coupon up six basis points at 4.32%-
At the same time, the US Department of Labor revealed the unemployment claims for the week ending on November 25, came at 218K below the 220K foreseen but exceeded the prior’s week number.
Across the Atlantic, estimates the Bank of England (BoE) will keep rates higher for longer, given the fact that inflation is more than twice the BoE’s target. BoE officials crossing newswires, remained hawkish during the week, boosting the Pound Sterling (GBP).
Expectations the Federal Reserve would cut rates before the Bank of England would likely keep the GBP/USD underpinned. However, traders must be aware of a stagflationary scenario looming in the UK. If the economy gets tipped into a recession, expect further GBP/USD downside.
GBP/USD Price Analysis: Technical outlook
Although the GBP/USD remains in an uptrend, today’s dip toward 1.2603 offered longs a better entry price, but price action on November 29 forming a ‘doji’ casts some doubts on the ongoing uptrend, with buyers failing to test the August 30 daily high at 1.2746. If the pair stays below 1.2700, that would open the door to challenge the day’s low, nearby the 1.26 figure. On the other hand, buyers reclaiming 1.2700 would pave the way for challenging August 30 high.
- The Canadian Dollar is seeing a broad-market push higher.
- Canadian GDP mixed, but the underlying revisions are helping to bolster the CAD.
- OPEC supply cuts to prop up Crude Oil markets, underpin Loonie trading.
The Canadian Dollar (CAD) is catching a batch of bids during Thursday’s US trading session, bolstered by climbing Crude Oil. The Canadian Dollar is the single best-performing of the major currency bloc, in the green against every single one of its major currency peers as the Loonie heads into the last quarter of the Thursday trading day.
Canadian Gross Domestic Product (GDP) came in mixed but leaning positive in the near-term data, and Crude Oil is lending the fossil-fueled Loonie some support. The Organization of the Petroleum Exporting Countries (OPEC) unanimously agreed to additional production cuts with an ambiguous end date.
Daily Digest Market Movers: Canadian Dollar makes a late topside break
- The Canadian Dollar caught a late surge on Thursday to outperform the rest of the major currency bloc.
- The CAD is up three-quarters of a percent against the Japanese Yen (JPY) and the Euro (EUR), and around halfsix-tenths of a percent on the Pound Sterling (GBP) at the time of writing.
- Canadian GDP came in mixed, with the September MoM printing 0.1% above the expected flat 0.0%, while the YoY figure contracted steeply.
- Annualized third quarter Canadian GDP came in at -1.1%, sharply missing the market median forecast of 0.2% YoY growth, but the previous period’s figure did see a sharp upward revision, getting adjusted from -0.2% to 1.4%.
- Crude Oil markets are set for an upside twist after OPEC unanimously agreed (for the time being) to further cut oil output by an additional million barrels per day (bpd).
- Crude Oil price gains on the back of additional supply cuts likely to remain capped with plenty of spare capacity in global energy demand.
- OPEC is reporting that the additional production caps will last through Q1 2024.
Canadian Dollar price today
The table below shows the percentage change of Canadian Dollar (CAD) against listed major currencies today. Canadian Dollar was the strongest against the Japanese Yen.
| USD | EUR | GBP | CAD | AUD | JPY | NZD | CHF | |
| USD | 0.56% | 0.32% | -0.19% | -0.07% | 0.57% | -0.26% | -0.26% | |
| EUR | -0.56% | -0.26% | -0.74% | -0.66% | 0.01% | -0.84% | -0.82% | |
| GBP | -0.32% | 0.25% | -0.48% | -0.39% | 0.28% | -0.58% | -0.55% | |
| CAD | 0.19% | 0.74% | 0.49% | 0.09% | 0.76% | -0.08% | -0.08% | |
| AUD | 0.07% | 0.66% | 0.41% | -0.09% | 0.68% | -0.17% | -0.17% | |
| JPY | -0.58% | 0.00% | -0.26% | -0.74% | -0.70% | -0.80% | -0.80% | |
| NZD | 0.28% | 0.83% | 0.59% | 0.08% | 0.19% | 0.85% | 0.01% | |
| CHF | 0.32% | 0.80% | 0.54% | 0.06% | 0.18% | 0.80% | -0.04% |
The heat map shows percentage changes of major currencies against each other. The base currency is picked from the left column, while the quote currency is picked from the top row. For example, if you pick the Euro from the left column and move along the horizontal line to the Japanese Yen, the percentage change displayed in the box will represent EUR (base)/JPY (quote).
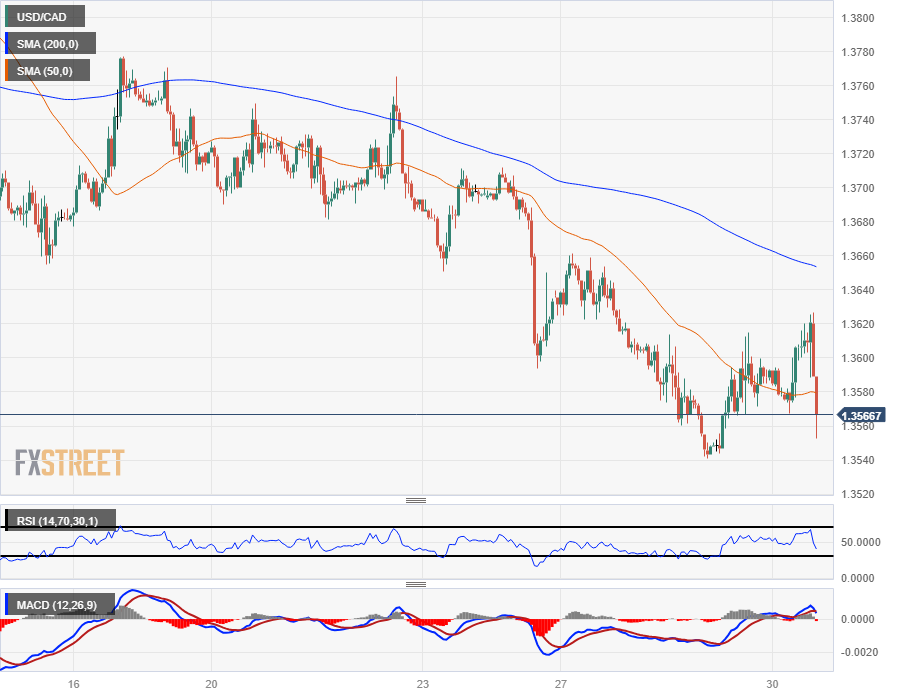
Technical Analysis: Canadian Dollar lurches higher on the day, sends the USD/CAD back below 1.3600
The Canadian Dollar (CAD) initially fell back against the US Dollar (USD) in Thursday trading with the pair reaching a three-day high of 1.3626, but the CAD’s late break sent the pair back below the 1.3600 handle to test the waters near 1.3550.
Intraday chart action continues to be capped by the 200-hour Simple Moving Average (SMA) descending into 1.3650 while the 50-day SMA is drawing prices into the near-term midrange around 1.3580.
Daily candlesticks have the USD/CAD pair struggling to make downside progress towards the 200-day SMA just above 1.3500, and the CAD is struggling to carve out further downside territory against the USD despite Thursday’s Loonie push.
USD/CAD Hourly Chart
USD/CAD Daily Chart
Canadian Dollar FAQs
What key factors drive the Canadian Dollar?
The key factors driving the Canadian Dollar (CAD) are the level of interest rates set by the Bank of Canada (BoC), the price of Oil, Canada’s largest export, the health of its economy, inflation and the Trade Balance, which is the difference between the value of Canada’s exports versus its imports. Other factors include market sentiment – whether investors are taking on more risky assets (risk-on) or seeking safe-havens (risk-off) – with risk-on being CAD-positive. As its largest trading partner, the health of the US economy is also a key factor influencing the Canadian Dollar.
How do the decisions of the Bank of Canada impact the Canadian Dollar?
The Bank of Canada (BoC) has a significant influence on the Canadian Dollar by setting the level of interest rates that banks can lend to one another. This influences the level of interest rates for everyone. The main goal of the BoC is to maintain inflation at 1-3% by adjusting interest rates up or down. Relatively higher interest rates tend to be positive for the CAD. The Bank of Canada can also use quantitative easing and tightening to influence credit conditions, with the former CAD-negative and the latter CAD-positive.
How does the price of Oil impact the Canadian Dollar?
The price of Oil is a key factor impacting the value of the Canadian Dollar. Petroleum is Canada’s biggest export, so Oil price tends to have an immediate impact on the CAD value. Generally, if Oil price rises CAD also goes up, as aggregate demand for the currency increases. The opposite is the case if the price of Oil falls. Higher Oil prices also tend to result in a greater likelihood of a positive Trade Balance, which is also supportive of the CAD.
How does inflation data impact the value of the Canadian Dollar?
While inflation had always traditionally been thought of as a negative factor for a currency since it lowers the value of money, the opposite has actually been the case in modern times with the relaxation of cross-border capital controls. Higher inflation tends to lead central banks to put up interest rates which attracts more capital inflows from global investors seeking a lucrative place to keep their money. This increases demand for the local currency, which in Canada’s case is the Canadian Dollar.
How does economic data influence the value of the Canadian Dollar?
Macroeconomic data releases gauge the health of the economy and can have an impact on the Canadian Dollar. Indicators such as GDP, Manufacturing and Services PMIs, employment, and consumer sentiment surveys can all influence the direction of the CAD. A strong economy is good for the Canadian Dollar. Not only does it attract more foreign investment but it may encourage the Bank of Canada to put up interest rates, leading to a stronger currency. If economic data is weak, however, the CAD is likely to fall.
- The XAU/USD is trading around $2,035 with losses of 0.40%.
- US PCE figures aligned with expectations, while weekly Jobless Claims came in lower than expected.
- US yields and the US Dollar recovered after the data.
In Thursday's session, the XAU/USD is contending with a drop, trading around the $2,035 level following the release of the US's October Personal Consumption Expenditures (PCE) figures which showed no surprises and comes in line with the Federal Reserve’s stance of not calling a victory against inflation too early. In addition, Jobless Claims came in lower than expected.
In that sense, both headline and core expenditures of the Personal Consumption Expenditures (PCE) aligned with expectations, reinforcing the Federal Reserve's stance on inflation that more evidence of disinflation needs to be seen. The headline figure dropped to 3% YoY while the core measure to 3.5% YoY. Furthermore, there was no significant increase in unemployment as seen in the Initial Jobless Claims for the week ending in November 18, coming to 218,000 vs. the 220,000 expected.
In the meantime, the US bond yields are rising. The 2-year rate stands at 4.70%, and the 5 and 10-year yields are seen at 4.29% and 4.30%, respectively, and weight on the Gold’s price as bond rates tend to be seen as the opportunity cost of holding non-yielding metals. The US Dollar also recovered, and the DXY index jumped to 103.35, up by 0.50%.
XAU/USD levels to watch
The technical situation on the daily charts suggests that bulls are taking a breather. Despite being in positive territory, a negative slope in the Relative Strength Index (RSI) suggests that the buying momentum is attenuating, and bears are gradually gaining ground after the price hit overbought conditions. The flat red bars observed on the Moving Average Convergence Divergence (MACD) further provide a looming bearish signal, suggesting that the selling pressure might be setting in.
Meanwhile, the placement of the price above the 20,100,200-day Simple Moving Averages (SMAs) reveals a larger bullish framework and the bulls, for now, seem to be taking a breather after the pair hit its highest peak since May at $2,050.
Support Levels: $2,030, $2,015, $2,000.
Resistance Levels: $2040, $2050, $2,070.
XAU/USD daily chart
-638369572153295905.png)
Canada’s employment data for November will be reported by Statistics Canada on Friday, December 1 at 13:30 GMT and as we get closer to the release time, here are forecasts from economists and researchers at five major banks regarding the upcoming jobs figures.
The North American economy is expected to have added 15K vs. 17.5K in October, while the Unemployment Rate is seen rising a tick to 5.8%. If so, it would be the highest since the beginning of 2022.
TDS
We look for another month of below-trend job growth with +15K in November as the UE rate drifts 0.1pp higher to 5.8%. Hiring conditions have deteriorated over the second half of 2023, while the gradual shift towards more balanced labour markets should also take some pressure off wage growth. We look for AHE to slow to 4.8% YoY (+0.2% MoM) as hours worked post a modest increase.
RBC Economics
We expect November’s Canadian labour market data will underscore broader weakness in the economy. We look for a 15K job gain – not enough to prevent the unemployment rate from ticking higher by one-tenth to 5.8%. Soaring population growth has boosted the available labour supply, but as hiring demand slows, labour is being absorbed more slowly by the job market. Wage growth will be watched closely by the Bank of Canada, but softening labour demand is shifting bargaining power back to employers and we look for wage growth to broadly slow going forward.
NBF
Job creation may have slowed to 10K in November, reflecting a loss of momentum in the Canadian economy. This modest gain, combined with another significant expansion of the labour force and an unchanged participation rate (65.6%), should translate into a two-tenth increase in the unemployment rate, to 5.9%.
Citi
In addition to softer activity data over Q2 and Q3, a recent rise in the unemployment rate has been a clear sign of the rebalancing of demand and supply that has been an encouraging development for the BoC. This trend could continue in November, with employment likely to be unchanged which would imply another rise in the unemployment rate to 5.9%. Wages, in addition to the path of core inflation, will be an important metric in assessing the timing of possible rate cuts.
CIBC
The labour market likely continued to soften in November, in line with the deterioration in economic activity and labour demand. Our forecast for 10K jobs to have been created would leave the unemployment rate a tick higher at 5.8%, in the context of still-strong population growth. The continued easing in the labour market will work to quell wage pressures ahead, setting the stage for BoC cuts in Q2 next year.
- Mexican Peso weakens as Banxico’s officials discuss easing policy next year.
- Banxico revised up growth prospects for Mexico and expected inflation to cool to its target in 2025.
- The US disinflation process continues, data shows, while traders trim rate cut expectations by the Fed, bolstering the US Dollar.
Mexican Peso (MXN) drops sharply for the second straight day against the US Dollar (USD) in early trading during the North American session on Thursday. The latest data from the United States (US) is sponsoring a leg-up in the Greenback (USD), underpinned by high US Treasury bond yields, a tailwind for the USD/MXN. At the time of writing, the exotic pair exchanges hands below the 17.40 area, printing gains of more than 0.60%.
Mexico’s economic docket witnessed the release of the Unemployment Rate, which came a tenth lower in non-seasonally adjusted figures at 2.7% YoY, below forecasts of 2.8% and beneath September’s 2.9%. The Bank of Mexico (Banxico) revised its economic growth forecasts for 2023 and 2024 to the upside in its quarterly report, released on Thursday. The bank noted that inflation would take longer than expected to dip to the bank’s target, projecting that it would hit the 3% target by 2025.
During Banxico’s presentation of its quarterly economic projections, Governor Victoria Rodriguez Ceja kept the door open for rate cuts, but discussions would be held in the first quarter of 2024. Banxico’s Deputy Governor Jonathan Heath echoed some of Rodriguez's comments, though he pushed back against easing monetary policy in the first quarter.
Across the border, the United States (US) economic calendar revealed the Federal Reserve’s (Fed) preferred inflation gauge, cooled as expected. Yet after the data, investors trimmed their aggressive Fed rate cut expectations for 2024, while the USD/MXN rose to a daily high of 17.49 before retreating below 17.45.
Daily digest movers: Mexican Peso heavy as the USD/MXN climbs to a new two-week high near 17.50
- Banxico revises economic growth upward from 3% to 3.3% for 2023 and projects the economy would pick up from 2.1% to 3% in 2024.
- Regarding inflation prospects, the Mexican central bank foresees headline inflation at 4.4% in Q4 2023 (5.3% for core), while at the end of 2024, it is estimated at 3.4% (3.3% for core). The central bank forecasts headline and core inflation to not hit the 3% target imposed by the institution until 2025.
- The US Core Personal Consumption Expenditures (PCE), the Fed’s gauge for inflation, rose by 3.5% YoY in October, as expected, below the previous month’s 3.7%.
- Headline inflation measured by the PCE slowed from 3.4% to 3.0% in the last twelve months, as foreseen by analysts.
- Interest rate traders expect 108 basis points of rate cuts by the US Federal Reserve in 2024.
- On November 27, Banxico’s Deputy Governor, Jonathan Heath, commented that core prices must come down more, adding that one or two rate cuts may come next year, but “very gradually” and “with great caution.”
- On November 24, a report revealed the economy in Mexico grew as expected in the third quarter on an annual and quarterly basis, suggesting the Bank of Mexico would likely stick to its hawkish stance, even though it opened the door for some easing.
- Mexico's annual inflation increased from 4.31% to 4.32%, while core continued to ease from 5.33% to 5.31%, according to data on November 23.
- The financial markets' narrative that the US Federal Reserve (Fed) is done hiking rates has kept the Greenback on the backfoot, but today, it has found some relief.
- A Citibanamex poll suggests that 25 of 32 economists expect Banxico's first rate cut in the first half of 2024.
- The poll shows “a great dispersion” for interest rates next year, between 8.0% and 10.25%, revealed Citibanamex.
- The same survey revealed that economists foresee headline annual inflation at 4.00% and core at 4.06%, both readings for the next year, while the USD/MXN exchange rate is seen at 19.00, up from 18.95, toward the end of 2024
Technical Analysis: Mexican Peso could weaken further as USD/MXN buyers target the 200-day SMA
Although the USD/MXN remains bearish, the jump above the confluence of the 20 and 100-day Simple Moving Averages (SMAs), each at 17.34/35, respectively, opened the door to challenge the 17.50 psychological level for the first time since November 14. A decisive break of that level could pave the way for testing the 200-day SMA at 17.57, ahead of challenging the 50-day SMA at 17.69
On the other hand, a retracement back below the confluence of the 20 and 100-day SMAs could sponsor a drop toward the November 29 daily close of 17.25, a strong resistance level, which turned support. Once cleared, the next support would be 17.05.
Mexican Peso FAQs
What key factors drive the Mexican Peso?
The Mexican Peso (MXN) is the most traded currency among its Latin American peers. Its value is broadly determined by the performance of the Mexican economy, the country’s central bank’s policy, the amount of foreign investment in the country and even the levels of remittances sent by Mexicans who live abroad, particularly in the United States. Geopolitical trends can also move MXN: for example, the process of nearshoring – or the decision by some firms to relocate manufacturing capacity and supply chains closer to their home countries – is also seen as a catalyst for the Mexican currency as the country is considered a key manufacturing hub in the American continent. Another catalyst for MXN is Oil prices as Mexico is a key exporter of the commodity.
How do decisions of the Banxico impact the Mexican Peso?
The main objective of Mexico’s central bank, also known as Banxico, is to maintain inflation at low and stable levels (at or close to its target of 3%, the midpoint in a tolerance band of between 2% and 4%). To this end, the bank sets an appropriate level of interest rates. When inflation is too high, Banxico will attempt to tame it by raising interest rates, making it more expensive for households and businesses to borrow money, thus cooling demand and the overall economy. Higher interest rates are generally positive for the Mexican Peso (MXN) as they lead to higher yields, making the country a more attractive place for investors. On the contrary, lower interest rates tend to weaken MXN.
How does economic data influence the value of the Mexican Peso?
Macroeconomic data releases are key to assess the state of the economy and can have an impact on the Mexican Peso (MXN) valuation. A strong Mexican economy, based on high economic growth, low unemployment and high confidence is good for MXN. Not only does it attract more foreign investment but it may encourage the Bank of Mexico (Banxico) to increase interest rates, particularly if this strength comes together with elevated inflation. However, if economic data is weak, MXN is likely to depreciate.
How does broader risk sentiment impact the Mexican Peso?
As an emerging-market currency, the Mexican Peso (MXN) tends to strive during risk-on periods, or when investors perceive that broader market risks are low and thus are eager to engage with investments that carry a higher risk. Conversely, MXN tends to weaken at times of market turbulence or economic uncertainty as investors tend to sell higher-risk assets and flee to the more-stable safe havens.
Economists at Wells Fargo expect an explicit Argentine Peso (ARS) devaluation.
USD/ARS to reach 750.00 by year-end
We expect another large Peso devaluation to materialize before the end of this year. For now, we are assuming a devaluation of 20%, but note that risks are tilted toward a more sizable depreciation. Should president-elect Javier Milei opt for completely removing all capital controls and Dollar-buying restrictions, the Peso could experience a much more significant depreciation than we bake into our current forecast.
We forecast the USD/ARS exchange rate to reach 750.00 by the end of 2023 and 1,750.00 by the end of next year.
Should controls be fully lifted, which is a rising possibility, the official USD/ARS exchange rate could hit 1,000 by year-end or early 2024.
- Pending Home Sales in the US declined less than expected in October.
- US Dollar Index stays in positive territory around 103.40.
Pending Home Sales in the US rose 1.1% in October, the National Association of Realtors reported on Thursday. This reading followed a 1% increase recorded in September (revised from 1.1%) and came in better than the market expectation for a decrease of 2%. On a yearly basis, Pending Home Sales fell 8.5%.
Market reaction
The US Dollar stays on positive ground, supported by previous economic reports from the US that included consumer inflation and Jobless Claims. The US Dollar Index is up 0.45%, at 103.5.
Economists at Rabobank see scope for AUD/USD to trend higher medium-term.
Interest rate differentials look set to offer the AUD support through much of next year
Interest rate differentials look set to offer the AUD support through much of next year. That said, the AUD is sensitive to broad levels of risk appetite and to the outlook for Chinese growth. While Fed rate cuts would underpin risk appetite in 2024, a rally in the AUD/USD could be curtailed if growth in China continues to disappoint.
On balance, we are optimistic that AUD/USD could be testing the 0.70 area on a 12-month view. This would be in line with the average level of the exchange rate over the past 5 years.
- EUR/USD faces extra downside pressure and breaches 1.0900.
- Further losses retarget the 200-day SMA near 1.0820.
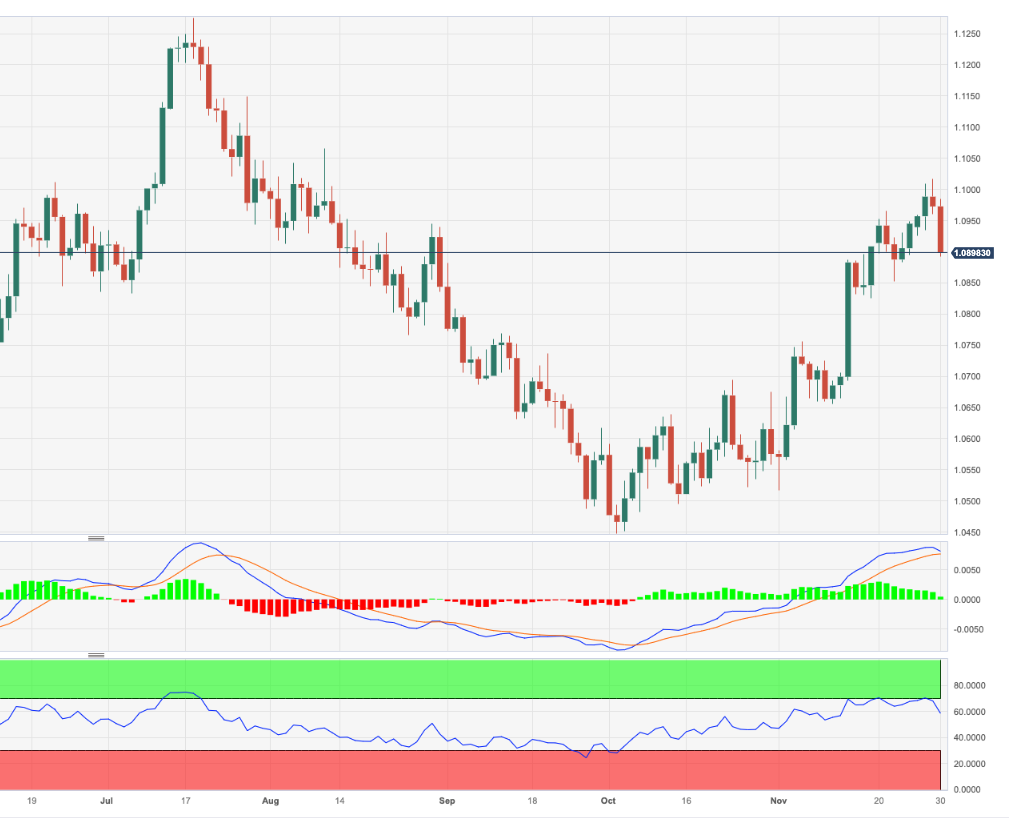
EUR/USD adds to Wednesday’s decline and breaks below the 1.0900 support to print new multi-session lows on Thursday.
So far, the rejection of monthly highs past the key 1.1000 barrier could revisit a minor support at the weekly low of 1.0852 (November 27). The loss of this level could put a potential test of the critical 200-day SMA, today at 1.0816, back on the radar in the short-term horizon.
So far, while above the significant 200-day SMA, today at 1.0816, the pair’s outlook should remain constructive.
EUR/USD daily chart
 \
\
- DXY adds to the ongoing rebound and reclaims 103.00.
- Further up comes the 200-day SMA near 103.60.
DXY advances further and manages to reclaim the area beyond the key barrier at 103.00 on Thursday.
In case the rebound gathers a more serious traction, the index is then expected to shift its focus to the key 200-day SMA, today at 103.59, prior to the provisional 100-day SMA at 104.30, which appears underpinned by the weekly top of 104.21 (November 22).
In the meantime, while below the key 200-day SMA, the outlook for the index is expected to remain bearish.
DXY daily chart

UOB Group’s Senior Economist Julia Goh and Economist Loke Siew Ting assess the recent publication of inflation figures in Malaysia.
Key Takeaways
Headline inflation moderated for the second straight month to 1.8% y/y in Oct (from +1.9% in Sep), matching our estimate but coming a tad lower than Bloomberg consensus’ 1.9%. It also marked the lowest inflation rate since Mar 2021, largely due to a further moderation in food price inflation and steady fuel pump prices. This helped to cushion the impact from an uptick in prices of four other components - health, recreation services & culture, education as well as restaurants & hotels.
We trim our 2023 full-year inflation forecast to 2.5% as year-to-date headline inflation (averaged at 2.7%) has fallen below our previous projection of 2.8%. Additionally, there are no price hike proposals planned for the two remaining reporting months of this year, suggesting that headline inflation will likely continue its downtrend to ~1.7% for the final two months of the year. This downshift in the inflation trajectory has also resulted in an adjustment to our full-year inflation forecast for 2024 to 2.6% (from 2.8% previously), which has factored in the impact of the 2% hike in service tax from Mar 2024 but not the effects of other domestic price policy changes particularly the subsidy rationalization and progressive wage mechanism.
EUR/USD has staged a solid rebound since early October. Economists at Citigroup analyze the pair’s outlook.
A bottoming in Euro Area manufacturing could signal a near-term positive for EUR
Given expectations for the economy have been so bearish thus far, a bottoming in Euro Area manufacturing could signal a near-term positive for EUR. However, the primary driver of EUR/USD over the medium to longer term is still based on the market expectations for the Fed’s against the ECB’s rates for 2024 and beyond.
The strength of the rebound in EUR/USD may have limited potential to the year-end, but the durability of the rebound could be affected by uncertainty surrounding Germany’s fiscal position due to the recent constitutional court ruling, and Italian’s fiscal constraints due to its weak economic fundamentals being largely ignored. This potentially augurs well for EUR’s outlook in 2024.
- EUR/JPY rebounds from earlier lows near 160.60 on Thursday.
- A deeper drop should face interim contention at the 55-day SMA.
EUR/JPY now manages to regain some poise and return above the 161.00 barrier following earlier lows near 160.60 on Thursday.
The continuation of the downward bias carries the potential to motivate the cross to break below the 160.00 round level and revisit the transitory 55-day SMA at 159.52.
So far, the longer term positive outlook for the cross appears favoured while above the 200-day SMA at 153.56.
EUR/JPY daily chart
Senior Economist at UOB Group Alvin Liew and Associate Economist Jester Koh review the latest Industrial Production results in Singapore.
Key Takeaways
Singapore’s Oct industrial production (IP) expanded for the first time following 12 consecutive months of y/y contraction. Oct’s IP recorded a 7.4% y/y increase from Sep’s revised reading of -1.1% y/y (prev: -2.1%). The Oct IP outturn was better than Bloomberg’s consensus for a contraction of -2.3% y/y and UOB’s estimate of -6.6%. On a seasonally adjusted sequential basis, IP saw a sustained 9.8% m/m increase, following the strong revised 13.1% m/m expansion in Sep (prev: 10.7%). Similarly, Oct’s m/m sa reading was much stronger than Bloomberg consensus for a narrow -0.4% contraction and our estimate of -5.5%. In the first 10 months of 2023, IP contracted -4.5% y/y. The last positive print was recorded in Sep 2022 (1.1% y/y, -0.2% m/m sa).
IP Outlook – Manufacturing Activity Likely Bottomed Alongside Nascent Signs Of An Upturn In The Electronics Cycle - On a 6 months moving average (6MMA) y/y basis, electronics IP saw incrementally narrower contractions by -2.6% in Oct (Sep: -6.4%, Aug: -9.5%). Electronics NODX also recorded further improvements in Oct, posting a narrower contraction of -5.6% y/y (Sep: -11.6%), corroborating the recent better export performance seen in South Korea and Taiwan. As mentioned in our Oct NODX report, we will not be surprised to see positive y/y readings emerging for electronics NODX as early as Dec 2023, largely driven by base effects given the sharp double digits y/y decline seen from Nov 2022 to Sep 2023.
We revise our 2023 full-year industrial production forecast to -4.0% (prev: -7.0%) given the recent IP outperformance and for 2024, we project IP to expand by 4.0%.
Gold has hit a six month high. Economists at MUFG Bank analyze the yellow metal’s outlook.
Gold posed for a run to a record as seasonality takes hold
Bullion’s ascent has been sufficiently acute and powerful that a challenge of its record of $2,089 set in August 2020 seems inevitable before year-end.
With a new month and the start of the Christmas season now in sight, the precious metal tends to rally in December. In the past five years, it has made monthly gains of no less than 3%, which at current levels would push it beyond its mid-pandemic record.
Meanwhile, attempts by traders to front-run January – a historically even stronger period for Gold thanks to buying for China’s Lunar New Year – seems a little more plausible.
- The Q3 Canadian Gross Domestic Product contracted 1.1% from a year earlier.
- Canada will publish its monthly employment report on Friday, introducing further noise in USD/CAD.
- USD/CAD advances with the news as the CAD suffers from the negative surprise.
Canada’s Real Gross Domestic Product (GDP) edged up 0.1% MoM in September, better than the flat reading anticipated by financial markets. The Q3 annualized reading, however, posted a sharp 1.1% slide, much worse than the 0.2% advance anticipated by financial markets. The quarterly reading posted -0.3%, contracting from a 0.3% gain in Q2.
On Friday, Canada will publish its monthly employment report, expected to show an Unemployment Rate of 5.8%.
USD/CAD ticked north with GDP figures, as investors lifted bets on an on-hold Bank of Canada amid higher risk of recession.
- Initial Jobless Claims in the US increased by 7,000 in the week ending November 25.
- Continuing Claims rose to 1.927 million, highest level in two years.
- US Dollar Index stays in positive ground above 103.10 after Claims and Core PCE.
There were 218,000 initial jobless claims in the week ending November 25, the weekly data published by the US Department of Labor (DOL) showed on Thursday. This print followed the previous week's print of 211,000 (revised from 209,000) and came in better than the market expectation of 220,000.
Continuing Claims increased by 86,000 to 1.927 million in the week ended November 18, the highest level since November 27, 2021.
Market reaction
The US Dollar dropped after the Core Personal Consumption Expenditure report and weekly Jobless Claims, but it remained in positive territory and quickly trimmed losses. The US Dollar Index holds in positive territory for the day, hovering around 103.15.
(This story was corrected on November 30 at 13:47 GMT to say that the previous week's numbers were revised to 209,000. A previous version of the story said that they were revised to 211,000.)
GBP soft in line with broader USD tone. Economists at Scotiabank analyze Cable’s outlook.
A minor double top around 1.2730 has been struck
Sterling’s losses on the session look a little more challenging from a short-term technical point of view.
A minor double top around 1.2730 has been struck, targeting a drop in the Pound to around 1.2600. A lower close on the day will form the third leg of a bearish ‘evening star’ pattern on the daily chart which could herald more corrective weakness.
EUR/USD losses have picked up through the European session. Economists at Scotiabank analyze the pair’s outlook.
Additional losses through 1.09 would imply a little more downside risk
The EUR/USD pair is trading nearly a cent off of Wednesday’s high but losses have not extended far enough at this point to put the short-term uptrend at risk.
Additional losses through the 1.09 level would imply a little more downside risk for the EUR in the short run, however, towards stronger support in the 1.0825/1.0850 range.
USD losses are steadying but major headwinds remain, economists at Scotiabank report.
December is typically a weak month for the USD
The big Dollar has recovered some ground overall so far today, reflecting modestly higher US Treasury yields and weaker Eurozone data. That does not mean there is much scope for a significant USD recovery, however.
Broader trends remain bearish and December is typically a weak month for the USD broadly (average return of around -0.9% in the December month over the last 25 years).
Supposedly USD-negative month-end rebalancing flows have yet to show up but US data reports today may refresh USD-bearishness. Data are expected to reflect a softening labour market (rising claims), slower spending and weaker core inflation via the PCE deflator (3.5% YoY expected versus 3.7% in September).
- The Greenback trades in the green against all major currencies.
- US traders on the lookout for US Jobless Claims and Personal Consumption Expenditure Price Index numbers.
- The US Dollar Index climbs above 103 and could still flip this week’s overall performance into positive territory.
The US Dollar (USD) bulls are back, alive and kicking, as the Greenback is soaring on Thursday. The surprise revival comes on the back of a sudden meltdown in the Euro and other major pairs. Strong activity data in the US, coupled with lower-than-expected inflation figures in the Eurozone, are quickly shifting traders’ bets. Investors are pricing in a quick rate cut from the European Central Bank (ECB), whereas the interest rate differential between the US Dollar and the Euro got very tight at the beginning of the week.
On the economic front, traders already revised their earlier selling moves in the Greenback after the US Gross Domestic Product (GDP) numbers revealed the US economy performed strongly in the third quarter, despite headwinds from the elevated-rates-regime. More guidance to come from the US data on Thursday with the US Jobless Claims and Personal Consumption Expenditures (PCE) Price Index numbers, which are the Federal Reserve’s preferred inflation gauge. Any further decline in the index will be welcome, though a steady and marginal decline could still support a stronger US Dollar.
Daily digest: Fed will be watching
- At 13:30 GMT, this Thursday a big batch of data points is to be released:
- US Initial Jobless Claims are expected to head from 209,000 to 220,000.
- Continuing Jobless Claims were at 1,840,000 and are expected to head to 1,865,000.
- Monthly Headline Personal Consumption Expenditures Price Index for October is expected to decline from 0.4% to 0.1%.
- Headline Personal Consumption Expenditures Price Index on a yearly basis is expected to head from 3.4% to 3%.
- Monthly Core Personal Consumption Expenditures Price Index for October is expected to slow from 0.3% to 0.2%.
- Core Personal Consumption Expenditures Price Index on a yearly basis is forecast to head from 3.7% to 3.5%.
- Personal Income for October is seen declining from 0.7% to 0.2%.
- Personal Spending for October is set to decline alongside the Personal Income, from 0.7% to 0.2%.
- Near 14:05, New York Fed President John Williams will speak.
- The Chicago Purchasing Managers Index is due, staying in contraction from 44 to 45.4.
- At 15:00, the Pending Home Sales index will come out for October, with the monthly performance shrinking from 1.1% to -2%, while the yearly performance is expected to head from -11% to -8.8%.
- Right at the end of this Thursday, the US Treasury is heading to markets to allocate a 4-week bill.
- Equities are on track to print one of the best performing November in a long time. After a few days of hesitation, indices across the globe are in the green with all Asian major indices increasing near 0.50%. European equities are marginally in profit, while US Futures are rather in line with Asian profits, near 0.50%.
- The CME Group’s FedWatch Tool shows that markets are pricing in a 95.8% chance that the Federal Reserve will keep interest rates unchanged at its meeting in December.
- The benchmark 10-year US Treasury Note trades at 4.29%, and is finding a floor after the earlier decline this week.
US Dollar Index technical analysis: losing the elastic band
The US Dollar has been stretched long and far enough in its devaluation – like an elastic band. Earlier this week the Relative Strength Index (RSI) was indicating that the elastic band was overstretched to the downside after entering oversold, and some unwinding was granted. The unwinding is starting to take place and could still put this weekly performance of the US Dollar Index (DXY) in the green if the current trend continues into Friday’s US close.
The DXY is making its way up towards the 200-day Simple Moving Average (SMA), which is near 103.59. The DXY could still make it back up there, should US traders come back in the market and start buying the current dip. A two-tiered pattern of a daily close lower followed by an opening higher would quickly see the DXY back above 104.28, with the 200-day and 100-day SMA turned over to support levels.
To the downside, historic levels from August are coming into play, when the Greenback summer rally took place. The lows of June make sense to look for some support, near 101.92, just below 102. Should more events take place that initiate further declines in US rates, expect to see a near full unwind of the 2023 summer rally, heading to 100.82, followed by 100.00 and 99.41.
US Dollar FAQs
What is the US Dollar?
The US Dollar (USD) is the official currency of the United States of America, and the ‘de facto’ currency of a significant number of other countries where it is found in circulation alongside local notes. It is the most heavily traded currency in the world, accounting for over 88% of all global foreign exchange turnover, or an average of $6.6 trillion in transactions per day, according to data from 2022.
Following the second world war, the USD took over from the British Pound as the world’s reserve currency. For most of its history, the US Dollar was backed by Gold, until the Bretton Woods Agreement in 1971 when the Gold Standard went away.
How do the decisions of the Federal Reserve impact the US Dollar?
The most important single factor impacting on the value of the US Dollar is monetary policy, which is shaped by the Federal Reserve (Fed). The Fed has two mandates: to achieve price stability (control inflation) and foster full employment. Its primary tool to achieve these two goals is by adjusting interest rates.
When prices are rising too quickly and inflation is above the Fed’s 2% target, the Fed will raise rates, which helps the USD value. When inflation falls below 2% or the Unemployment Rate is too high, the Fed may lower interest rates, which weighs on the Greenback.
What is Quantitative Easing and how does it influence the US Dollar?
In extreme situations, the Federal Reserve can also print more Dollars and enact quantitative easing (QE). QE is the process by which the Fed substantially increases the flow of credit in a stuck financial system.
It is a non-standard policy measure used when credit has dried up because banks will not lend to each other (out of the fear of counterparty default). It is a last resort when simply lowering interest rates is unlikely to achieve the necessary result. It was the Fed’s weapon of choice to combat the credit crunch that occurred during the Great Financial Crisis in 2008. It involves the Fed printing more Dollars and using them to buy US government bonds predominantly from financial institutions. QE usually leads to a weaker US Dollar.
What is Quantitative Tightening and how does it influence the US Dollar?
Quantitative tightening (QT) is the reverse process whereby the Federal Reserve stops buying bonds from financial institutions and does not reinvest the principal from the bonds it holds maturing in new purchases. It is usually positive for the US Dollar.
USD/CAD climbs back to the low 1.36s. Economists at Scotiabank analyze the pair’s outlook.
Support intraday is 1.3570/1.3575
Canada gets an update on GDP today. Industry-level output for September is expected to come in flat. Q3 GDP is expected to gain a feeble 0.1% (SAAR) after falling 0.2% in Q2. Soft data will not help the CAD.
Short-term chart patterns are turning a little more USD-supportive. But USD gains have not – yet anyway – stretched meaningfully above levels (resistance in the 1.3610/1.3615 zone) that would imply potential for the USD rebound to stretch to 1.3650/1.3560 where firmer resistance should be expected.
Support intraday is 1.3570/1.3575 and 1.3540/1.3550.
An “invisible hand” in EUR/SEK? Economists at Commerzbank analyze the pair’s outlook.
A bit of an aftertaste in Sweden
The price move in EUR/SEK since the Riksbanks’s rate decision last week looks suspiciously like an ‘invisible hand’ having intervened on the market, trying to prevent a rise above 11.46.
I find it quite interesting that the downside potential in SEK seems to suddenly be limited (or being limited) following the rate decision last week which the market interpreted as not being sufficiently restrictive, reacting with SEK sales.
It is understandable that the Riksbank uses the FX sales, which it is going to implement anyway, at a time that ensures that undesirable losses in SEK following the rate meeting can be avoided, but they nonetheless leave a bitter aftertaste.
Economist at UOB Group Enrico Tanuwidjaja and Junior Economist Agus Santoso comment on the latest interest rate decision by the Bank Indonesia (BI).
Key Takeaways
Bank Indonesia (BI) kept its benchmark rate (7-Day Reverse Repo) unchanged at 6.00% following its Nov MPC meeting, in line with market consensus but not UOB's forecast, of which we expected a 25bps hike.
BI implied during the Board’s Q&A session that the main reason for last month’s rate hike (and not followed through...) was because of incipient upside risks to its inflation target trajectory next year. That factor has dissipated, according to BI, and underpinned the key reason for today's rate stay decision. In other words, as rupiah stabilized in recent sessions, BI is of the view that upside risks from imported inflation have declined.
Based on today's BI MPC, we had to adjust our BI rate forecast once again. Today's rhetoric seemed assuring for no more rate hike in the near-term (i.e. no more rate hikethis year in Dec) but the semantic of data-dependence still remains. However, considering uncertainty in the global market developments, US Fed rate directions and length of "higher-for-longer" along with other uncertainties surrounding Chinese economic growth and geopolitical tensions as well as on global food and energy prices, we revised our forecast and expect 1 more 25bps rate hike in 1Q24 to 6.25%. That will likely be the terminal rate for the current rate hike cycle.
Open interest in natural gas futures markets shrank by just 185 contracts on Wednesday, partially reversing the previous daily build according to preliminary readings from CME Group. Volume followed suit and went down by more than 107K contracts.
Natural Gas appears supported by the 200-day SMA
Wednesday’s downtick in prices of natural gas was accompanied by diminishing open interest and volume, exposing the likelihood of a bounce in the very near term. The commodity, in the meantime, seems to have entered some near-term consolidative phase in the lower end of the range south of the $3.000 mark, while it remains underpinned by the key 200-day SMA around the $2.600 region per MMBtu.
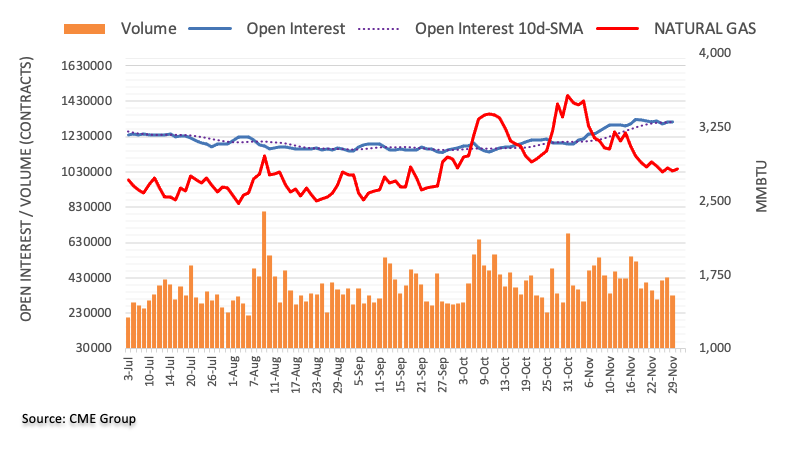
The October US PCE deflator is the main event today. Economists at OCBC Bank analyze how the report could impact the Dollar.
Any upside surprise to Core PCE may temporarily stall the USD downtrend
Consensus expects Core PCE to come in at 3.5% YoY for Oct (vs. 3.7% in Sep).
If Core PCE surprises to the downside, then USD may extend the move lower again. However, any upside surprise to Core PCE may temporarily stall the USD downtrend and concomitantly, see some unwinding of rate cut bets.
See – US Core PCE Preview: Forecasts from seven major banks, inflation falls, but remains too high
Upside USD correction offset post-RBNZ bounce in the NZD/USD pair. Economists at ANZ Bank analyze Kiwi’s outlook.
Will markets buy into the RBNZ’s hawkish tilt?
The big question is: will markets buy into the RBNZ’s hawkish tilt, or land on the side of it being jawboning, but reading the totality of the projections, the RBNZ does seem genuinely concerned that inflation isn’t falling quickly enough and that a housing bounce may give the economy a second wind.
That speaks to interest rates being risk higher and/or holding up for longer, which may be enough to put a floor under the Kiwi.
- WTI Oil soars as the OPEC+ meeting started online around 10:30 GMT.
- The US Dollar is roaring back after a few days of substantial weakness.
- Oil to rally ahead of the official OPEC+ outcome as impasse remains.
Oil prices are jumping higher for a second day in a row ahead of the OPEC+ meeting and outcome. With the OPEC+ meeting taking place at the time of writing, no official report has been issued and no consensus seems to be on the table when it comes down to distributing production cuts amongst all OPEC+ members. The African producing nations appear to be very reluctant to take any cuts, despite the recent downturn in Crude prices in global markets.
The US Dollar (USD) meanwhile is trying to set the record straight as markets might have devalued the Greenback a touch too much. While focussing on the end of the hiking cycle for the US Federal Reserve, markets got caught by surprise of a sudden substantial decline in the Eurozone in both its growth and inflation. At this pace, the Eurozone might even fall back into deflation by next year, which means quicker cuts, and thus again a widening rate differential which in its turn would favour a stronger US Dollar.
Crude Oil (WTI) trades at $79.47 per barrel and Brent Oil trades at $84.44 per barrel at the time of writing.
Oil news and market movers: OPEC+ developing story
- The OPEC+ meeting started around 10:30 GMT. . Both Nigeria and Angola approved a production cut in June, but are now backtracking on that promise.
- Recent numbers reveal that the opposing countries, Nigeria and Angola, are not meeting their maximum production quotas.
- All eyes of course will be on whether Saudi Arabia will succeed in passing on production cuts to all members, in order to create a substantial floor in Oil prices.
- Despite the surprise builds or less-than-expected draw downs from the US stockpile numbers measured by the American Petroleum Institute (API) and US Energy Information Administration (EIA), Oil prices keep soaring as the OPEC+ meeting is the leading story.
Oil Technical Analysis: Volatile day ahead
Oil prices will have a very eventful day as headlines emerge throughout the day on either a deal or no-deal on production quotas for all OPEC+ members. Commodity Traders will have their work cut out. Although an outcome is hard to predict, some deal will certainly get done as the current lacklustre demand side is likely to be countered by some production cuts, borne by at least sum or most OPEC+ members in order to create price stability.
On the upside, $80.00 is the resistance to watch out for. Should crude be able to jump above that again, look for $84.00 (purple line) as the next level to see some selling pressure or profit taking. Should Oil prices be able to consolidate above there, the topside for this fall near $93.00 could come back into play.
On the downside, traders are seeing a soft floor forming near $74.00. This level is acting as the last line of defence before entering $70.00 and lower. Watch out for $67.00 with that triple bottom from June as the next support level to trade at.
-638369386560255524.png)
US WTI Crude Oil: Daily Chart
WTI Oil FAQs
What is WTI Oil?
WTI Oil is a type of Crude Oil sold on international markets. The WTI stands for West Texas Intermediate, one of three major types including Brent and Dubai Crude. WTI is also referred to as “light” and “sweet” because of its relatively low gravity and sulfur content respectively. It is considered a high quality Oil that is easily refined. It is sourced in the United States and distributed via the Cushing hub, which is considered “The Pipeline Crossroads of the World”. It is a benchmark for the Oil market and WTI price is frequently quoted in the media.
What factors drive the price of WTI Oil?
Like all assets, supply and demand are the key drivers of WTI Oil price. As such, global growth can be a driver of increased demand and vice versa for weak global growth. Political instability, wars, and sanctions can disrupt supply and impact prices. The decisions of OPEC, a group of major Oil-producing countries, is another key driver of price. The value of the US Dollar influences the price of WTI Crude Oil, since Oil is predominantly traded in US Dollars, thus a weaker US Dollar can make Oil more affordable and vice versa.
How does inventory data impact the price of WTI Oil
The weekly Oil inventory reports published by the American Petroleum Institute (API) and the Energy Information Agency (EIA) impact the price of WTI Oil. Changes in inventories reflect fluctuating supply and demand. If the data shows a drop in inventories it can indicate increased demand, pushing up Oil price. Higher inventories can reflect increased supply, pushing down prices. API’s report is published every Tuesday and EIA’s the day after. Their results are usually similar, falling within 1% of each other 75% of the time. The EIA data is considered more reliable, since it is a government agency.
How does OPEC influence the price of WTI Oil?
OPEC (Organization of the Petroleum Exporting Countries) is a group of 13 Oil-producing nations who collectively decide production quotas for member countries at twice-yearly meetings. Their decisions often impact WTI Oil prices. When OPEC decides to lower quotas, it can tighten supply, pushing up Oil prices. When OPEC increases production, it has the opposite effect. OPEC+ refers to an expanded group that includes ten extra non-OPEC members, the most notable of which is Russia.
According to Eurostat's provisional calculations, annual inflation in the Eurozone inflation eased to 2.4% year-on-year. Economists at Commerzbank analyze the report the Eurozone Harmonised Index of Consumer Prices (HICP) report.
Euro Area inflation surprises again
In the Euro Area, inflation fell by 0.5 percentage points to 2.4% in November, a much stronger decline than expected. The sharp fall in the inflation rate for services was particularly surprising. Core inflation even fell from 4.2% to 3.6%.
Today's price data is likely to fuel speculation that the ECB will soon cut its key interest rate. However, we think it is too early to declare victory over inflation, given the strong rise in wages.
CME Group’s flash data for crude oil futures markets note traders added around 21K contracts to their open interest positions, resuming the uptrend following Wednesday’s pullback. Volume, on the other hand, set aside two daily builds in a row and shrank by around 32.8K contracts.
WTI: Next on the upside emerges $80.00
WTI prices rebounded further on Wednesday and flirted with the key 200-day SMA around the $78.00 region. The uptick was on the back of increasing open interest, which appears supportive of the continuation of the uptrend in the very near term. Against that backdrop, prices of WTI faces the next up-barrier at the key $80.00 mark per barrel.
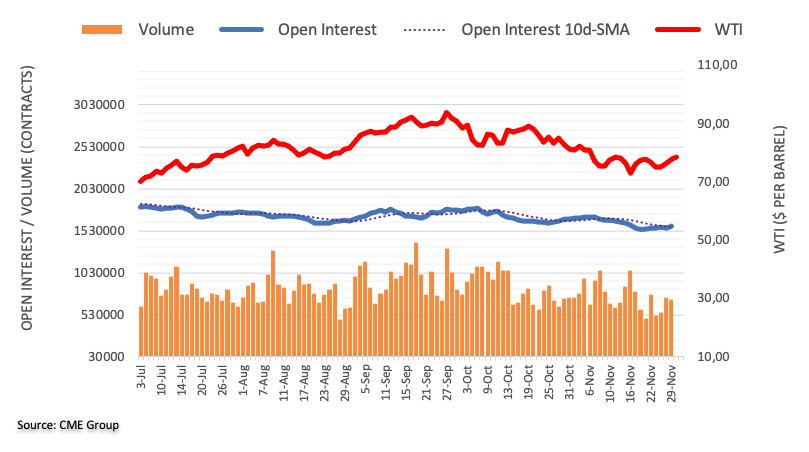
European Central Bank (ECB) executive board member Fabio Panetta said on Thursday, “the current interest rates level consistent to bring inflation down to target.”
Additional quotes
May be able to ease monetary conditions if persistently weak output accelerates the decline in inflation.
Monetary tightening has not yet had a full impact and will continue to dampen demand in the future.
Risks to the Eurozone economy are tilted to the downside.
The economy remains weak in Q4 2023.
Market reaction
Soft Eurozone inflation data combined with the above dovish remarks are batterin the Euro, as EUR/USD loses 0.51% on the day to trade currently at 1.0910.
Dollar rebound increasingly hinges on activity data, economists at ING report.
Data takes over
US activity data needs to do the heavy lifting in a Dollar recovery by reviving bond bears.
We are still doubtful the Fed will want to sit and watch as rates fall, given the lingering interest to keep financial conditions tight at the current juncture, so a more decisive pushback against rate cut bets remains a tangible risk for the FX market and a secondary path for the Dollar to find support outside of US data.
We still expect DXY to climb back above 103.00, but watch for growing selling interest around 103.50 until (and if) key data releases halt the UST rally.
Further decline in USD/CNH now faces a solid support around 7.1100, comment Economist Lee Sue Ann and Markets Strategist Quek Ser Leang at UOB Group.
Key Quotes
24-hour view: Yesterday, USD fell sharply, but briefly to 7.1143. There is no increase in momentum as USD rebounded strongly and rapidly from the low. Today, USD is likely to trade sideways, probably in a range of 7.1250/7.1550.
Next 1-3 weeks: We turned negative in USD about two weeks ago. In our most recent update from a week ago (23 Nov, spot at 7.1580), we indicated that “while downward pressure has eased somewhat, only a breach of 7.2050 (no change in ‘strong resistance’ level) would indicate that 7.1100 is out of reach this time around.” USD did not breach 7.2050. Yesterday, it dropped to a low of 7.1143 before rebounding. The price action suggests the USD weakness is intact, and the level to monitor is still at 7.1100. On the upside, the ‘strong resistance’ level has moved lower to 7.1660.
The Eurozone Harmonised Index of Consumer Prices (HICP) increased 2.4% on an annual basis in November, down from October’s 2.9% rise, the official data published by Eurostat showed on Thursday. The data missed the market expectations of a 2.7% print.
The Core HICP inflation eased to 3.6% YoY in November, as against October’s 4.2% uptick. The market consensus was for a 3.9% increase in the Core HICP.
On a monthly basis, the bloc’s HICP dropped 0.5% in November vs. a 0.1% increase registered in October. The core HICP inflation came in at -0.6% MoM in the reported month, compared to a 0.2% acceleration reported in October.
The European Central Bank’s (ECB) inflation target is 2.0%. The old continent’s HICP inflation data significantly influences the market’s pricing of the ECB interest rate outlook.
Following softer-than-expected German, French and Spanish inflation data, the “ECB euro short-term rate (ESTR) forwards priced in a policy rate reduction of over 110 basis points (bps) in 2024 from around 95 bps the day before. They also discount an around 95% chance of a first 25 bps rate cut in April 2024,” according to Reuters.
Key details from the Eurozone inflation report (via Eurostat)
“Looking at the main components of euro area inflation, food, alcohol & tobacco are expected to have the highest annual rate in November (6.9%, compared with 7.4% in October), followed by services (4.0%, compared with 4.6% in October), non-energy industrial goods (2.9%, compared with 3.5% in October) and energy (-11.5%, compared with -11.2% in October).”
Separately, the Eurozone Unemployment Rate for October came in at 6.5%, as expected.
EUR/USD reaction to the Eurozone inflation report
The Euro is accelerating its downside momentum on softer-than-expected Eurozone inflation data. EUR/USD is trading 0.38% lower on the day at 1.0925, at the press time.
Euro price today
The table below shows the percentage change of Euro (EUR) against listed major currencies today. Euro was the weakest against the US Dollar.
| USD | EUR | GBP | CAD | AUD | JPY | NZD | CHF | |
| USD | 0.42% | 0.34% | 0.12% | 0.07% | 0.30% | 0.02% | 0.17% | |
| EUR | -0.41% | -0.08% | -0.29% | -0.35% | -0.11% | -0.40% | -0.27% | |
| GBP | -0.34% | 0.09% | -0.20% | -0.27% | -0.03% | -0.32% | -0.17% | |
| CAD | -0.12% | 0.29% | 0.21% | -0.06% | 0.19% | -0.09% | 0.05% | |
| AUD | -0.10% | 0.35% | 0.27% | 0.06% | 0.24% | -0.05% | 0.09% | |
| JPY | -0.32% | 0.11% | 0.02% | -0.19% | -0.26% | -0.28% | -0.13% | |
| NZD | -0.01% | 0.41% | 0.32% | 0.11% | 0.04% | 0.28% | 0.15% | |
| CHF | -0.15% | 0.25% | 0.17% | -0.05% | -0.10% | 0.09% | -0.15% |
The heat map shows percentage changes of major currencies against each other. The base currency is picked from the left column, while the quote currency is picked from the top row. For example, if you pick the Euro from the left column and move along the horizontal line to the Japanese Yen, the percentage change displayed in the box will represent EUR (base)/JPY (quote).
The Reserve Bank of New Zealand (RBNZ) left the Official Cash Rate (OCR) unchanged but the forecast peak in the OCR was raised. Economists at OCBC Bank analyze NZD outlook after the last central bank meeting for the year.
Upward revisions to cash rate forecasts for 2024
RBNZ kept OCR on hold at 5.50% at its last MPC meeting for the year but the tone, language, projections in MPS and Governor Orr’s press conference were rather hawkish.
At the press conference, Governor Orr said that a rate hike was discussed at the policy meeting, MPC is willing to raise rates if necessary; nervous that inflation has been outside 1-3% band for so long that the MPC is showing an upward rate bias not probability.
There were upward revisions to cash rate forecasts for 2024 and projections show no rate cut until mid-2025.
Hawkish surprise keeps rate hike bets alive for RBNZ, and this should be supportive of Kiwi upside.
- The Euro adds to recent losses against the US Dollar.
- European stocks open Thursday’s session in a mixed tone.
- Flash EMU CPI, US PCE, ECB Lagarde will take centre stage.
The Euro accelerates its losses against the US Dollar on Thursday, forcing EUR/USD to retreat further south of 1.1000 the figure and revisit the 1.0920 region, or weekly lows.
On the other hand, the Greenback picks up extra upside traction and lifts the USD Index (DXY) back above the 103.00 barrier against the backdrop of a mild recovery attempt in US yields across the curve.
Further weakness around the European currency came in response to disappointing figures from the German labour market, where the Unemployment Rate ticked higher to 5.9% in November and the Unemployment Change increased by 22K individuals.
The current setting for monetary policy retains an unchanged character, with investors factoring in the potential for prospective interest rate reductions by both the Federal Reserve (Fed) and the European Central Bank (ECB) in the spring of 2024.
Extra data releases in Europe will see the publication of advanced inflation readings for the euro bloc for the month of November along with the Unemployment Rate. In addition, ECB’s President Christine Lagarde will speak at an event in Frankfurt.
In the US, inflation measured by the PCE and Core PCE will be the salient event, seconded by the usual weekly Initial Jobless Claims, Personal Income, Personal Spending and Pending Home Sales.
Daily digest market movers: Euro comes under pressure on data, USD recovery
- The EUR faces extra downside against the USD.
- US and German yields trade in a mixed fashion.
- Markets see the Fed trimming its interest rates in Q2 2024.
- Investors also expect the ECB to start reducing its rates in H1 2024.
- BoJ’s Nakamura said negative rates and YCC are still necessary.
- Lagarde will speak on “Europe: Banking on resilience”.
Technical Analysis: Euro faces a key support at the 200-day SMA
The acceleration of the downward trend sees EUR/USD retreating to the 1.0920 zone on Thursday, adding to Wednesday’s retracement.
Further weakness could see EUR/USD challenging the key 200-day SMA at 1.0816, ahead of the provisional 55-day SMA at 1.0676. Down from here emerges the weekly low of 1.0495 (October 13) prior to the 2023 low of 1.0448 (October 3) and the round level of 1.0400.
In case bulls regain the upper hand, the pair is expected to meet the next up-barrier at the November high of 1.1017 (November 29) ahead of the August top of 1.1064 (August 10) and another weekly peak of 1.1149 (July 27), all of which precede the 2023 high of 1.1275 (July 18).
Meanwhile, the pair is seen maintaining its constructive outlook while above the 200-day SMA.
Euro FAQs
What is the Euro?
The Euro is the currency for the 20 European Union countries that belong to the Eurozone. It is the second most heavily traded currency in the world behind the US Dollar. In 2022, it accounted for 31% of all foreign exchange transactions, with an average daily turnover of over $2.2 trillion a day.
EUR/USD is the most heavily traded currency pair in the world, accounting for an estimated 30% off all transactions, followed by EUR/JPY (4%), EUR/GBP (3%) and EUR/AUD (2%).
What is the ECB and how does it impact the Euro?
The European Central Bank (ECB) in Frankfurt, Germany, is the reserve bank for the Eurozone. The ECB sets interest rates and manages monetary policy.
The ECB’s primary mandate is to maintain price stability, which means either controlling inflation or stimulating growth. Its primary tool is the raising or lowering of interest rates. Relatively high interest rates – or the expectation of higher rates – will usually benefit the Euro and vice versa.
The ECB Governing Council makes monetary policy decisions at meetings held eight times a year. Decisions are made by heads of the Eurozone national banks and six permanent members, including the President of the ECB, Christine Lagarde.
How does inflation data impact the value of the Euro?
Eurozone inflation data, measured by the Harmonized Index of Consumer Prices (HICP), is an important econometric for the Euro. If inflation rises more than expected, especially if above the ECB’s 2% target, it obliges the ECB to raise interest rates to bring it back under control.
Relatively high interest rates compared to its counterparts will usually benefit the Euro, as it makes the region more attractive as a place for global investors to park their money.
How does economic data influence the value of the Euro?
Data releases gauge the health of the economy and can impact on the Euro. Indicators such as GDP, Manufacturing and Services PMIs, employment, and consumer sentiment surveys can all influence the direction of the single currency.
A strong economy is good for the Euro. Not only does it attract more foreign investment but it may encourage the ECB to put up interest rates, which will directly strengthen the Euro. Otherwise, if economic data is weak, the Euro is likely to fall.
Economic data for the four largest economies in the euro area (Germany, France, Italy and Spain) are especially significant, as they account for 75% of the Eurozone’s economy.
How does the Trade Balance impact the Euro?
Another significant data release for the Euro is the Trade Balance. This indicator measures the difference between what a country earns from its exports and what it spends on imports over a given period.
If a country produces highly sought after exports then its currency will gain in value purely from the extra demand created from foreign buyers seeking to purchase these goods. Therefore, a positive net Trade Balance strengthens a currency and vice versa for a negative balance.
Economists at Société Générale discuss how HICP inflation numbers for the Euro Area could impact EUR/USD.
Soft data could add fuel to the rally in European rates
In the Euro Area, flash core CPI is forecast to have returned below 4% YoY in November for the first time since June 2022. Our economists have pencilled in a drop in headline to 2.6% YoY from 2.9% and core to 3.8% YoY from 4.2%.
Soft data could add fuel to the rally in European rates, but the rally is stretched and potentially due or a correction in December.
Softer inflation data from the Eurozone should in theory not disrupt the upward trend in EUR/USD, but investors may choose to play the ranges until Nonfarm Payrolls next week.
See – Eurozone HICP Preview: Forecasts from nine major banks, inflation rate falls once again
- Silver oscillates in a range for the second successive day on Thursday.
- A slightly overbought RSI is holding back bulls from placing fresh bets.
- The technical setup supports prospects for a further appreciating move.
Silver (XAG/USD) continues with its struggle to find acceptance above the $25.00 psychological mark and seesaws between tepid gains/minor losses for the second successive day on Thursday. The white metal extends its sideways consolidative price move through the first half of the European session as traders look forward to the US PCE Price Index for some meaningful impetus.
From a technical perspective, the Relative Strength Index (RSI) on the daily chart is flashing slightly overbought conditions and holding back bulls from placing fresh bets. That said, the recent sustained move beyond the very important 200-day Simple Moving Average (SMA) and a subsequent breakout through a multi-month-old descending trend-line suggests that the path of least resistance for the XAG/USD is to the upside. However, it will still be prudent to wait for some near-term consolidation or a modest pullback before positioning for an extension of a well-established uptrend witnessed over the past three weeks or so.
In the meantime, the $24.75-$24.70 region is likely to protect the immediate downside. Any further corrective slide is likely to attract fresh buyers near the $24.20-$24.15 zone. This should help limit the downside for the XAG/USD near the aforementioned descending trend-line resistance breakpoint, around the $24.00 mark. The latter should act as a key pivotal point, which if broken decisively might prompt some technical selling and pave the way for deeper losses, towards retesting the 200-day SMA, near the $23.40-$23.35 area.
On the flip side, the $25.25 region, or over a four-month high touched on Wednesday, could offer some resistance. Some follow-through buying will be seen as a fresh trigger for bullish traders and lift the XAG/USD towards the next relevant hurdle near the $25.55-$25.60 zone. The momentum could get extended further and allow the white metal to reclaim the $26.00 mark and test the YTD peak, around the $26.15 region touched in May.
Silver daily chart
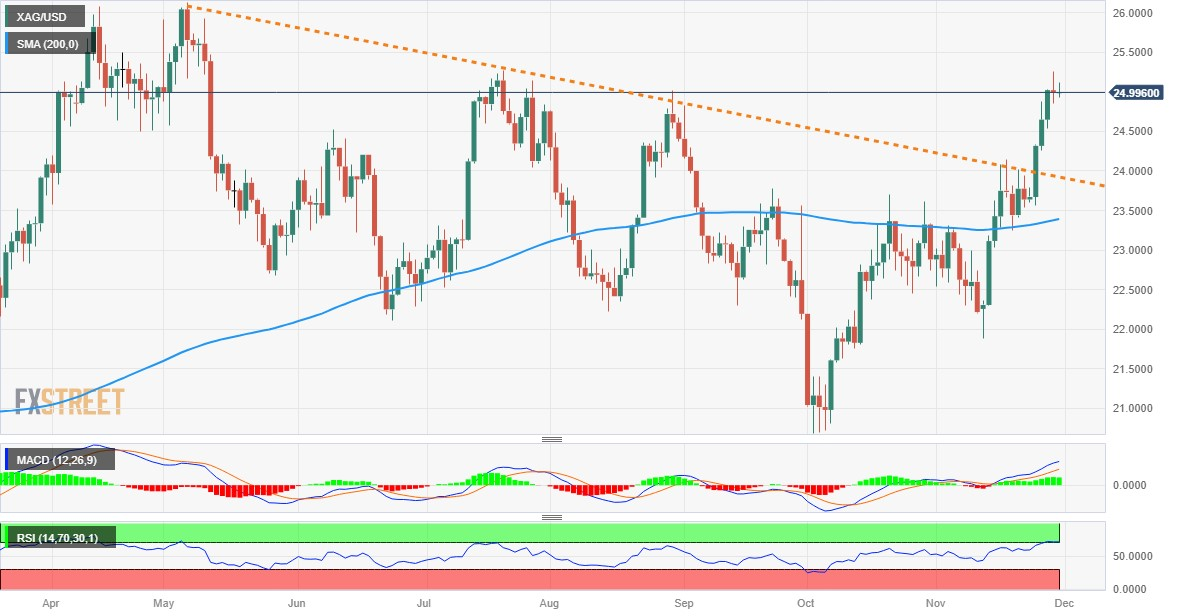
Technical levels to watch
- USD/CAD could extend its gains toward a 23.6% Fibonacci retracement.
- Technical indicators suggest support around the major level at 1.3550.
- A break above the seven-day EMA could approach the 1.3650 major level.
USD/CAD gains ground for the second consecutive session, maintaining its position near the 1.3600 psychological level during the European session on Thursday. A decisive breakthrough above the latter could open the doors for the USD/CAD pair to explore the barrier around 23.6% Fibonacci retracement at 1.3623 aligned with the seven-day Exponential Moving Average (EMA) at 1.3626.
The improved US Dollar (USD) could inspire the bulls of the USD/CAD pair to approach the major level at 1.3650, followed by the weekly high at 1.3661 if it breaks above the mentioned resistance.
However, the technical indicators for the USD/CAD pair support the current downward trend. The Moving Average Convergence Divergence (MACD) line is below the centerline and shows the divergence below the signal line, indicating a bearish momentum in the USD/CAD pair.
Furthermore, the 14-day Relative Strength Index (RSI) below 50 indicates a dovish sentiment, indicating that the USD/CAD pair could meet the support around the major level at 1.3550 before the weekly low at 1.3541.
If the USD/CAD pair convincingly falls below this level, it might prompt bearish momentum, potentially guiding the pair toward the psychological support zone near 1.3500.
USD/CAD: Daily Chart
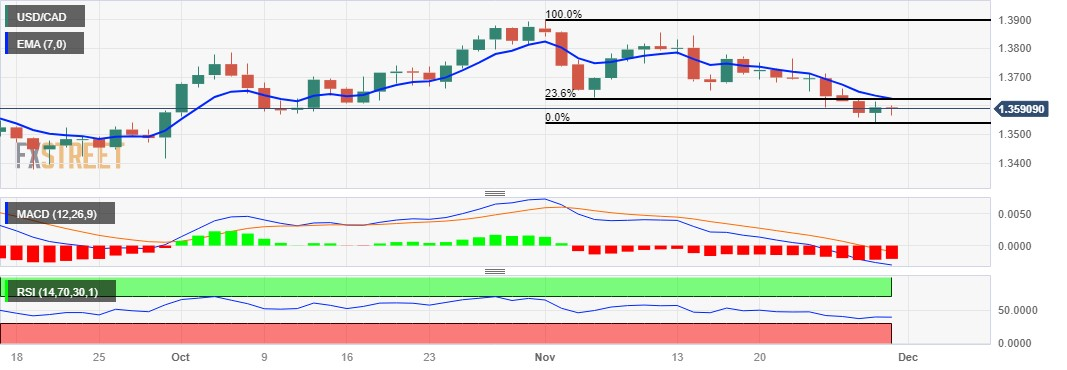
Gold surged past $2,000 as the Fed hinted at rate cuts in 2024. Economists at ANZ Bank analyze the yellow mental’s outlook.
Strong central bank purchases will be joined by strategic investment demand
Gold is benefitting from both geopolitical crisis and a recent USD sell-off.
Investment demand, which has been largely lacklustre this year, is firming up.
Weaker-than-expected economic data are bolstering expectations for early rate cuts by the US Federal Reserve. While retreating inflation raises risk of real rates rising in H1 2024, rate cuts later in the year should be supportive for Gold investment demand.
We expect Gold to trade above $2,000 next year as strong central bank purchases will be joined by strategic investment demand.
The continuation of the selling pressure could drag USD/JPY to the 146.00 neighbourhood in the next few weeks, according to Economist Lee Sue Ann and Markets Strategist Quek Ser Leang at UOB Group.
Key Quotes
24-hour view: Yesterday, USD dropped to a low of 146.65, rebounded to 147.90, and then ended the day at 147.24 (-0.16%). While downward momentum has slowed somewhat, there is scope for USD to dip to 146.50 before a more sustained recovery is likely. Today, the major support at 146.00 is unlikely to come into view. Resistance is at 147.50, followed by 147.90.
Next 1-3 weeks: USD dropped to a low of 146.65 yesterday, its lowest level since mid-September. Downward momentum is building rapidly, and USD is likely to continue to weaken. The levels to watch are 146.50 and 146.00. To keep the momentum going, USD must stay below 148.40 (‘strong resistance’ level).
Today, a wide further drop in Eurozone inflation is expected. Economists at ING analyze EUR/USD outlook ahead of the Eurozone HICP report.
Eurozone inflation figures may not have a huge impact on the Euro
Eurozone’s aggregate headline inflation is seen decelerating from 2.9% to 2.7%, with the core rate moving from 3.9% to 4.2%. The implications for the Euro would probably be material only if the figures come in surprisingly higher than expected.
Lower inflation is hardly ever good for a currency and may keep the Euro's upside room capped today, even though data from the US could cause large swings in EUR/USD regardless.
We still favour a return to sub-1.0900 as opposed to a sustainable rally beyond 1.1000.
See – Eurozone HICP Preview: Forecasts from nine major banks, inflation rate falls once again
- USD/MXN receives upward support on improved Greenback.
- US Dollar could extend gains as US bond yields rebound.
- Banxico revised economic growth to 3.3% and 3.0% for 2023 and 2024, respectively.
USD/MXN recovers its intraday losses on Wednesday. trading higher around 17.3000. The recovery in the US Dollar (USD) could be extended due to the upbeat US Gross Domestic Product Annualized data for Q3 showed robust growth at 5.2%, surpassing the anticipated 5.0%,
The US Dollar Index (DXY) receives upward support, possibly influenced by improved US bond yields. However, the Greenback might have faced challenges on mixed remarks from Federal Reserve (Fed) members. Cleveland Federal Reserve (Fed) President Loretta Mester emphasized that decisions regarding additional interest rate hikes would depend on data-driven considerations. On the other hand, Fed Governor Christopher Waller has suggested a more accommodative approach by reducing interest rates. However, markets are pricing in a cumulative 100 basis points (bps) of rate cuts by the Fed in 2024.
Investors are likely awaiting the release of the Personal Consumption Expenditure (PCE) Price Index data on Thursday, along with US weekly Jobless Claims, to gain further insights into the inflationary pressure in the United States.
The Bank of Mexico (Banxico) unveiled its quarterly report on Wednesday, bringing positive adjustments to economic growth forecasts. The projection for 2023 has been revised upward from 3.0% to 3.3%, with expectations that the economy will further accelerate from 2.1% to 3.0% in 2024. On the inflation front, Banxico anticipates a rate of 4.4% in Q4 2023, while the forecast for 2024 points to a moderation at 3.4%.
Furthermore, traders may observe Mexico’s Jobless Rate and Fiscal Balance for October on Thursday.
Gold prices rose in India on Thursday, according to data from India's Multi Commodity Exchange (MCX).
Gold price stood at 62,527 Indian Rupees (INR) per 10 grams, up INR 909 compared with the INR 61,618 it cost on Wednesday.
As for futures contracts, Gold prices decreased to INR 62,790 per 10 gms from INR 62,808 per 10 gms.
Prices for Silver futures contracts decreased to INR 77,350 per kg from INR 77,274 per kg.
| Major Indian city | Gold Price |
|---|---|
| Ahmedabad | 64,695 |
| Mumbai | 64,525 |
| New Delhi | 64,650 |
| Chennai | 64,660 |
| Kolkata | 64,695 |
An automation tool was used in creating this post.
Global Market Movers: Comex Gold price consolidates strong gains ahead of US PCE data
- The recent remarks from several Federal Reserve officials suggested that the central bank may be done raising interest rates and continue to act as a tailwind for the Comex Gold price.
- Fed Governor Christopher Waller flagged a possible rate cut in the months ahead and Cleveland Fed President Loretta Mester saw clear progress in getting inflation to 2%.
- The markets are now pricing in a cumulative 100 bps of rate cuts by the Fed in 2024, which is reinforced by a further decline in the US Treasury bond yields.
- The yield on the benchmark 10-year US government bond, which breached 5% in October for the first time in 16 years, languishes near its lowest level since September 14.
- Furthermore, the yield on the rate-sensitive two-year US Treasury note is at its lowest since July and continues to undermine the US Dollar, lending support to the XAU/USD.
- The second estimate of the US GDP showed that the world's largest economy grew by a 5.2% annualized pace during the third quarter as compared to the 4.9% reported previously.
- The upbeat US macro data did provide a modest lift to the USD on Wednesday, though dovish Fed expectations keep a lid on any meaningful recovery from a multi-month low.
- The latest data published by the National Bureau of Statistics (NBS) showed that China’s Manufacturing PMI ticked down to 49.4 in November from 49.5 in the prior month.
- The non-manufacturing PMI dropped to 50.2 in November from the 50.6 previous, fueling concerns about the worsening conditions in the world's second-largest economy.
Gold FAQs
Why do people invest in Gold?
Gold has played a key role in human’s history as it has been widely used as a store of value and medium of exchange. Currently, apart from its shine and usage for jewelry, the precious metal is widely seen as a safe-haven asset, meaning that it is considered a good investment during turbulent times. Gold is also widely seen as a hedge against inflation and against depreciating currencies as it doesn’t rely on any specific issuer or government.
Who buys the most Gold?
Central banks are the biggest Gold holders. In their aim to support their currencies in turbulent times, central banks tend to diversify their reserves and buy Gold to improve the perceived strength of the economy and the currency. High Gold reserves can be a source of trust for a country’s solvency. Central banks added 1,136 tonnes of Gold worth around $70 billion to their reserves in 2022, according to data from the World Gold Council. This is the highest yearly purchase since records began. Central banks from emerging economies such as China, India and Turkey are quickly increasing their Gold reserves.
How is Gold correlated with other assets?
Gold has an inverse correlation with the US Dollar and US Treasuries, which are both major reserve and safe-haven assets. When the Dollar depreciates, Gold tends to rise, enabling investors and central banks to diversify their assets in turbulent times. Gold is also inversely correlated with risk assets. A rally in the stock market tends to weaken Gold price, while sell-offs in riskier markets tend to favor the precious metal.
What does the price of Gold depend on?
The price can move due to a wide range of factors. Geopolitical instability or fears of a deep recession can quickly make Gold price escalate due to its safe-haven status. As a yield-less asset, Gold tends to rise with lower interest rates, while higher cost of money usually weighs down on the yellow metal. Still, most moves depend on how the US Dollar (USD) behaves as the asset is priced in dollars (XAU/USD). A strong Dollar tends to keep the price of Gold controlled, whereas a weaker Dollar is likely to push Gold prices up.
Norges Bank will announce the amount of daily FX purchases for December today. Economists at ING analyze Krone’s outlook.
Possible reduction in December FX purchases
Our model estimate based on Oil prices and petroleum revenue forecasts suggests purchases should be kept at 1,400mn for December. However, it’s worth highlighting that Norges Bank scaled back FX operations quite substantially in December (compared to the previous month) over the past three years, more than what our model would have suggested.
We are bullish on NOK in the medium term, but we suspect the rally has started too early. That is, however, only due to external factors, as markets have priced out the chance of a Norges Bank hike in December (20% priced in now) and a potential reduction in FX purchases in December is positive for the Krone.
Economists at Commerzbank analyze EUR/USD analyze EUR/USD outlook ahead of the US PCE deflator and November inflation data from the Eurozone
EUR/USD to settle above 1.10 if December’s US CPI surprises to the downside and inflation rate in the Eurozone rises back above 3%
We might see a draw between the Euro and the Dollar. Even though the USD optimism is increasingly being priced out, the USD will presumably only come under limited (new) pressure as the PCE deflator is unlikely to surprise. The EUR on the contrary might come under pressure as a result of the Eurozone inflation data.
It may require clearer and more convincing evidence for EUR/USD to appreciate above the 1.10 mark on a sustainable basis, which the inflation data from the US and the Eurozone for December might provide.
If we see another surprise to the downside in the US (please remember the reaction in November to the US CPI data when the Dollar came under huge pressure) and if at the same time, the inflation rate in the Eurozone rises back above 3% again (as the strong fall in energy prices in December 2022 (-6.6%) is eliminated from the YoY comparison) this might push EUR/USD sustainably above 1.10 before year-end.
See:
-
US Core PCE Preview: Forecasts from seven major banks, inflation falls, but remains too high
-
Eurozone HICP Preview: Forecasts from nine major banks, inflation rate falls once again
In the opinion of Economist Lee Sue Ann and Markets Strategist Quek Ser Leang at UOB Group, NZD/USD could still edge higher in the short term.
Key Quotes
24-hour view: NZD soared to a high of 0.6207 yesterday, but the advance was short-lived. The rapid pullback in overbought conditions suggests NZD is unlikely to advance further. Today, NZD is more likely to consolidate in a range of 0.6120/0.6185.
Next 1-3 weeks: Yesterday, NZD soared to a 4-month high of 0.6207 before pulling back sharply. Further NZD strength appears likely, but it might not have enough momentum to break the formidable resistance at 0.6225 (this level is near the top of the weekly Ichimoku cloud). On the downside, if NZD breaks below the ‘strong support’ level (now at 0.6080), it would mean that it is not ready to break 0.6225
- NZD/USD has marked a three-month high at 1.2733 on Wednesday.
- Greenback experienced strength from stronger GDP Annualized data.
- Traders price in a cumulative 100 bps of rate cuts by the Fed in 2024.
- Kiwi Building Permits rose significantly at 8.7% from the previous decline of 4.6%.
NZD/USD extends its gains for the sixth successive day, trading higher around 0.6170 during the early European session on Thursday. The NZD/USD pair reached near four-month highs on Wednesday on subdued US Dollar (USD). However, the Greenback experienced strength from upbeat Gross Domestic Product Annualized data, which indicated a growth of 5.2%, surpassing the anticipated increase of 5.0% in Q3.
Additionally, the lowered US bond yields over the past three sessions are attributed to the prevailing sentiment that the Federal Reserve (Fed) might conclude its interest rate hikes. Additionally, the markets are now factoring in a cumulative 100 basis points (bps) of rate cuts by the Fed in 2024.
The US Dollar Index (DXY) hovers around 102.80, showing indecision possibly influenced by mixed remarks from Federal Reserve (Fed) members. Cleveland Federal Reserve (Fed) President Loretta Mester emphasized that any decision for additional interest rate hikes would depend on data-driven considerations. In contrast, Fed Governor Christopher Waller has suggested a more accommodative approach by not insisting on maintaining high-interest rates.
On the Kiwi side, on Thursday, seasonally adjusted Building Permits for October showed monthly ratings increased significantly to 8.7% from a 4.6% decline previously.
The New Zealand Dollar (NZD) remains supported by the Reserve Bank of New Zealand's (RBNZ) hawkish stance. Despite keeping the cash rate unchanged at 5.5%, the central bank signaled the need for sustained restrictive measures to address inflation. RBNZ Governor Adrian Orr emphasized the upside risk to inflation and mentioned that rate hikes were discussed during the meeting.
Investors are expected to watch the US Initial Jobless Claims for the week ending on November 24 and the Personal Consumption Expenditure (PCE) Price Index data on Thursday. New Zealand’s ANZ Roy Morgan Consumer Confidence will be released on Friday.
The strong Dollar has kept GBP/USD pinned down. Economists at ING analyze Sterling’s outlook.
GBP/USD to trade in the 1.20-1.25 range for the next three to six months
We forecast that all of the BoE’s key inflation metrics will be heading in the right direction through 2024, allowing the BoE to deliver 100 bps of easing next year starting in August. This probably means that GBP/USD will struggle to sustain any gains over 1.30.
EUR/GBP realised volatility is not too far off the lows seen over the last two decades. This means that the broad EUR/USD trend will largely define that of GBP/USD – unless we get some enormous independent move in Sterling. That probably means GBP/USD trading in the 1.20-1.25 range for the next three to six months (with perhaps some downside risks), before better Eurozone growth in the second half of 2024 and lower US rates allow EUR/USD and GBP/USD to make their moves higher.
Germany's Retail Sales rose 1.1% MoM in October versus a 0.4% increase expected and -0.8% in September, the latest official data released by Destatis showed on Thursday.
Retail Sales in the Eurozone's top economy dropped 0.1% YoY in October versus a 4.3% annual decline seen in September. The market forecast a decrease of 2.0%.
EUR/USD reaction to the German data
The Euro is little moved after the mixed German consumer spending data. At the time of writing, the EUR/USD is dropping 0.05% on the day to trade at 1.0971.
About German Retail Sales
The Retail Sales released by the Statistisches Bundesamt Deutschland is a measure of changes in sales of the German retail sector. It shows the performance of the retail sector in the short term. Percent changes reflect the rate of changes of such sales. The changes are widely followed as an indicator of consumer spending. Positive economic growth is usually anticipated as "bullish" for the EUR, while a low reading is seen as negative, or bearish, for the EUR.
(This story was corrected on November 30 at 7.23GMT to say that Retail Sales in the Eurozone's top economy dropped 0.1% YoY in October versus a 4.3% annual decline seen in September, not August)
- The Core Personal Consumption Expenditures Price Index is set to rise 0.2% MoM and 3.5% YoY in October.
- Recent Federal Reserve commentary cements bets of a dovish pivot next year.
- The continued cooling of PCE inflation could exacerbate the pain in the US Dollar.
The Core Personal Consumption Expenditures (PCE) Price Index, the US Federal Reserve’s (Fed) preferred inflation measure, will be published by the US Bureau of Economic Analysis (BEA) on Thursday at 13:30 GMT.
What to expect in the Federal Reserve’s preferred PCE inflation report?
The Core PCE Price Index, which excludes food and energy, is seen as the more influential in terms of Fed positioning. It is seen increasing 0.2% on a monthly basis in October, as against a 0.3% rise in September, and at an annual pace of 3.5%, down from the 3.9% increase seen in September.
The headline PCE Price Index is set to rise 0.1% MoM in October while accelerating by 3.0% annually in the reported month after recording a 3.4% growth in September.
Meanwhile, the United States’ real Gross Domestic Product (GDP) expanded at an annualized rate of 5.2% in the third quarter, the second estimate reported by the BEA showed on Wednesday. The GDP data registered a sharp upward revision from the preliminary reading of 4.9%. Additional details showed that the PCE inflation was revised down to 2.8% on a quarterly basis in Q3 from 2.9% first readout while the Core PCE inflation was downgraded to 2.3% in Q3 from the flash estimate of 2.4%.
In the lead-up to the US PCE inflation showdown, markets are pricing a roughly 49% chance that the Fed could begin slashing rates as early as March. This is substantially higher compared with the 21.5% chance seen on Tuesday, according to CME Group’s FedWatch Tool. About 100 bps worth of cuts are also priced in for next year.
Recent dovish comments from Fed Governor Christopher Waller, a known hawk, flagged a policy pivot and bolstered Fed rate cut bets for next year, spelling disaster for the US Dollar and the US Treasury bond yields.
"I am increasingly confident that policy is currently well positioned to slow the economy and get inflation back to 2%," Waller said in his speech on Tuesday. If the decline in inflation continues "for several more months ... three months, four months, five months ... we could start lowering the policy rate just because inflation is lower," he added. Chicago Fed President Austan Goolsbee on Tuesday expressed concerns about keeping rates too high for too long.
These dovish commentary contrast with Fed Chair Jerome Powell’s hawkish remarks delivered earlier this month at an International Monetary Fund (IMF) event. Powell said that the Fed "is committed to achieving a stance of monetary policy that is sufficiently restrictive to bring inflation down to 2% over time; We are not confident that we have achieved such a stance," adding that “if it becomes appropriate to tighten policy further, we will not hesitate to do so."
Analysts at BBH offer a sneak peek at what to expect from the upcoming PCE inflation data:
“Data highlight will be October PCE data Thursday. Headline PCE is expected at 3.1% y/y vs. 3.4% in September, while core PCE is expected at 3.5% y/y vs. 3.7% in September. If so, the headline would be the lowest since March 2021 but still well above the Fed’s 2% target. Of note, the Cleveland Fed’s Nowcast model sees headline PCE at 3.09% y/y and core PCE at 3.55% y/y.”
When will be the PCE inflation report released and how could it affect EUR/USD?
The PCE inflation data is slated for release at 13:30 GMT. The monthly Core PCE Price Index gauge is the most preferred inflation reading by the Fed, as it’s not distorted by base effects and provides a clear view of the underlying inflation by excluding volatile items. Investors, therefore, pay close attention to the monthly Core PCE figure. A bigger-than-expected increase in monthly PCE inflation is likely to prompt investors to dial down Fed rate cut expectations for next year, lifting the US Dollar from multi-month troughs against its major counterparts. Even if the Core PCE Price Index comes out in line with estimates the Dollar could still find some support.
Conversely, softer US monthly PCE inflation data could exacerbate the pain in the US Dollar. Even though PCE inflation is a lagging indicator, it could still add to the dovish Fed pivot bets. However, the reaction to the PCE figures is expected to be limited, as traders would refrain from placing fresh directional bets on the Greenback ahead of Fed Chair Jerome Powell’s speech on Friday.
Powell is scheduled to participate in a fireside chat titled "Navigating Pathways to Economic Mobility" at Spelman College, in Atlanta. It will be his last public appearance, as the Fed enters the ‘blackout period’ on Saturday ahead of the December 12-13 policy meeting.
FXStreet Analyst Dhwani Mehta offers a brief technical outlook for EUR/USD and explains: “EUR/USD is on a six-day winning streak, close to its best level in three months above 1.1000 following a sustained downtrend in the US Dollar. The Relative Strength Index (RSI) indicator on the daily chart has eased from above the 70 level, suggesting that the pair has room for more upside. A 20-day Simple Moving Average (SMA) and 200-day SMA bullish crossover is in the making, keeping the bullish bias intact for EUR/USD.”
Dhwani also outlines the important technical levels for trading EUR/USD in the short term: “On the upside, the October high of 1.1065 is envisioned as the initial hurdle. If Euro buyers manage to find a strong foothold above the latter, the next resistance levels are seen at the 1.1100 round level and the July 27 high of 1.1150. Should EUR/USD fail to clear 1.1065, a fresh corrective decline toward Tuesday’s low of 1.0934 cannot be ruled out. Further down, the 1.0900 psychological level could come into play."
Economic Indicator
United States Core Personal Consumption Expenditures - Price Index (MoM)
The Core Personal Consumption Expenditures (PCE), released by the US Bureau of Economic Analysis on a monthly basis, measures the changes in the prices of goods and services purchased by consumers in the United States (US). The PCE Price Index is also the Federal Reserve’s (Fed) preferred gauge of inflation. The MoM figure compares the prices of goods in the reference month to the previous month.The core reading excludes the so-called more volatile food and energy components to give a more accurate measurement of price pressures. Generally, a high reading is bullish for the US Dollar (USD), while a low reading is bearish.
Read more.Next release: 11/30/2023 13:30:00 GMT
Frequency: Monthly
Source: US Bureau of Economic Analysis
Why it matters to traders
After publishing the GDP report, the US Bureau of Economic Analysis releases the Personal Consumption Expenditures (PCE) Price Index data alongside the monthly changes in Personal Spending and Personal Income. FOMC policymakers use the annual Core PCE Price Index, which excludes volatile food and energy prices, as their primary gauge of inflation. A stronger-than-expected reading could help the USD outperform its rivals as it would hint at a possible hawkish shift in the Fed’s forward guidance and vice versa.
Inflation FAQs
What is inflation?
Inflation measures the rise in the price of a representative basket of goods and services. Headline inflation is usually expressed as a percentage change on a month-on-month (MoM) and year-on-year (YoY) basis. Core inflation excludes more volatile elements such as food and fuel which can fluctuate because of geopolitical and seasonal factors. Core inflation is the figure economists focus on and is the level targeted by central banks, which are mandated to keep inflation at a manageable level, usually around 2%.
What is the Consumer Price Index (CPI)?
The Consumer Price Index (CPI) measures the change in prices of a basket of goods and services over a period of time. It is usually expressed as a percentage change on a month-on-month (MoM) and year-on-year (YoY) basis. Core CPI is the figure targeted by central banks as it excludes volatile food and fuel inputs. When Core CPI rises above 2% it usually results in higher interest rates and vice versa when it falls below 2%. Since higher interest rates are positive for a currency, higher inflation usually results in a stronger currency. The opposite is true when inflation falls.
What is the impact of inflation on foreign exchange?
Although it may seem counter-intuitive, high inflation in a country pushes up the value of its currency and vice versa for lower inflation. This is because the central bank will normally raise interest rates to combat the higher inflation, which attract more global capital inflows from investors looking for a lucrative place to park their money.
How does inflation influence the price of Gold?
Formerly, Gold was the asset investors turned to in times of high inflation because it preserved its value, and whilst investors will often still buy Gold for its safe-haven properties in times of extreme market turmoil, this is not the case most of the time. This is because when inflation is high, central banks will put up interest rates to combat it.
Higher interest rates are negative for Gold because they increase the opportunity-cost of holding Gold vis-a-vis an interest-bearing asset or placing the money in a cash deposit account. On the flipside, lower inflation tends to be positive for Gold as it brings interest rates down, making the bright metal a more viable investment alternative.
- Most Asian equities trade In positive territory on Thursday.
- China's Manufacturing PMI shrank further in November, worse than expected.
- Bank of Korea (BoK) maintained its benchmark interest rate at 3.5% on Thursday
- Indian GDP is expected to grow at 6.8% in the July–September quarter compared with a year earlier.
Asian stocks edge higher on Thursday due to investors' optimism improved, backed by indications of economic recovery and the weaker US Dollar (USD). Investors await the US Core Personal Consumption Expenditure Price Index (PCE) for October, which is expected to ease to 0.2% MoM and 3.5% YoY.
China’s Shanghai was up 0.20% to 3,027, the Shenzhen Component Index fell 0.19% to 9,726, Hong Kong’s Hang Sang rose 0.26% to 17,037, South Korea’s Kospi was up 0.30%, India’s NIFTY 50 was down 0.17%, and Japan’s Nikkei gained 0.50%.
Earlier Thursday, China’s National Bureau of Statistics (NBS) revealed that the nation’s Manufacturing PMI came in at 49.4 in November from 49.5 contraction registered in October, below the market consensus of 49.7 Additionally, the Non-Manufacturing PMI fell to 50.2 in the same month versus 51.1 expected and 50.6 in October. Investors are mounting pressure on Chinese authorities to implement more stimulus measures after Beijing is preparing to issue 1 trillion yuan ($140 billion) in bonds to bolster infrastructure expansion.
In Japan, Bank of Japan (BoJ) board member Toyoaki Nakamura said on Thursday that the central bank will likely require more time to phase out its massive stimulus, downplaying the possibility of the central bank's negative interest rate policy ending soon.
Apart from this, Japanese Retail Trade in October arrived at 4.2% YoY compared to the forecast of 5.9%. On a monthly basis, the figure declined to 1.6% from a 0.1% drop in the previous reading.
South Korea’s Factory Output registered its biggest decline in ten months in October, owing to lower chip production, raising concerns about the prospects for Asia's fourth-largest economy.
Furthermore, the Bank of Korea (BoK) maintained its benchmark interest rate at 3.5% on Thursday, the seventh consecutive pause. The BoK revised up its inflation prediction for 2024 to 2.6% from 2.4%, but cut its growth projection to 2.1% from 2.2%.
In India, the GDP growth number for the second quarter will be due later on Thursday, which is expected to grow at 6.8% in the July–September quarter compared with a year earlier.
Moving on, market players will monitor the US Core Personal Consumption Expenditure inflation report will be released in the American session. Federal Reserve (Fed) Chair Jerome Powell is also scheduled to speak on Friday and is likely to provide important insights into the Fed's policy strategy ahead of its December meeting. Additionally, the Chinese Caixin Manufacturing PMI will be released on Friday.
- The index trades slightly on the defensive near 102.80.
- US yields look to rebound from recent multi-week lows.
- PCE, Core PCE take centre stage later in the NA session.
The greenback appears under some selling pressure and gyrates around the 102.80 region when measured by the USD Index (DXY) on Thursday.
USD Index focuses on key data
The index now faces some headwinds following Wednesday’s decent rebound from three-month lows near 102.40.
The ongoing three-week retracement in the dollar has been magnified in response to increasing speculation of interest rate cuts by the Federal Reserve at some point in the spring of 2024, a view that seems to still be contested by some Fed rate setters.
Later in the NA session, all the attention is expected to be on the release of US inflation figures tracked by the PCE and Core PCE, seconded by usual weekly Initial Claims, Personal Income, Personal Spending and Pending Home Sales.
What to look for around USD
The index managed to regain some balance after bottoming out in three-week lows near 102.40 earlier in the week.
Looking at the broader picture, the dollar appears depressed against the backdrop of rising speculation of probable interest rate cuts in H1 2024, all in response to further disinflationary pressures and the gradual cooling of the labour market.
Some support for the greenback, however, still emerges the resilience of the US economy as well as a persistent hawkish narrative from some Fed rate setters.
Key events in the US this week: PCE, Core PCE, Initial Jobless Claims, Personal Income, Personal Spending, Pending Home Sales (Thursday) – Final S&P Global Manufacturing PMI, ISM Manufacturing PMI, Construction Spending, Fed’s Powell (Friday).
Eminent issues on the back boiler: Growing perception of a soft landing for the US economy. Speculation of rate cuts at some point in the spring of 2024. Omnipresent geopolitical effervescence vs. Russia and China. Potential spread of the Middle East crisis to other regions.
USD Index relevant levels
Now, the index is down 0.09% at 102.74 and faces immediate contention at 102.46 (monthly low November 29) ahead of 101.74 (monthly low August 4) and then 100.51 (weekly low July 27). On the upside, the breakout of 103.58 (200-day SMA) would open the door to 104.21 (weekly high November 22) and then 105.47 (55-day SMA).
Bank of Japan (BoJ) Board member Toyoaki Nakamura is back on the wires said on Thursday, expressing his take on the potential exit from the central bank’s ultra-loose monetary policy.
Key quotes
Hard to pinpoint timing of policy shift as of now.
It would be risky to change policy on assumption that things would improve moving forward with the Japanese economy.
Now is not the time to consider policy shift.
We can shift policy when Japan's economy sees wages, inflation rising sustainably.
Want to scrutinize firms' profitability in judging timing of policy shift.
Looking at upcoming MOF quarterly business sentiment survey among other data in gauging whether conditions are falling into place for any policy shift.
Market reaction
At the time of writing, the USD/JPY pair is sustaining the range play at around 147.00, down 0.16% on the day.
- GBP/USD has marked a three-month high at 1.2733 on Wednesday.
- BoE Governor Andrew Bailey is committed to taking necessary measures to bring inflation down to its 2.0% target.
- US Dollar Index is indecisive on the mixed remarks by Federal Reserve (Fed) members.
GBP/USD struggles to continue its winning streak that began on November 23, treading water around 1.2700 during the Asian session on Thursday. However, the GBP/USD pair marked a three-month high at 1.2733 on Wednesday on a softer US Dollar (USD).
Bank of England (BoE) Governor Andrew Bailey asserted that the central bank is committed to taking necessary measures to bring inflation down to its 2.0% target. He emphasized that despite efforts, the BoE has not observed sufficient progress to be confident in achieving this goal. This hawkish remark might have provided upward support for the Pound Sterling (GBP).
The decline in US bond yields over the past three sessions is attributed to the prevailing positive sentiment that the Federal Reserve (Fed) might conclude its interest rate hikes. However, as of the current press time on Thursday, the 10 and 2-year US Treasury yields stand slightly higher at 4.27% and 4.65%, respectively.
The US Dollar Index (DXY) hovers around 102.80, by the press time. The DXY seems indecisive, likely influenced by mixed remarks from Federal Reserve (Fed) members. Cleveland Federal Reserve (Fed) President Loretta Mester emphasized that any decision to implement additional interest rate hikes would depend on data-driven considerations.
Governor Michelle Bowman's expressed desire to keep the possibility of more rate hikes alive raises concerns about the persistence of inflationary pressure. In contrast, Fed Governor Christopher Waller has suggested a more accommodative approach by not insisting on maintaining high-interest rates.
Here is what you need to know on Thursday, November 30:
Financial markets remained tentative early Thursday, as Asian stocks traded listlessly, tracking the flattish close on Wall Street overnight. Disappointing official Chinese PMI data and renewed property market concerns were somewhat offset by hopes of more stimulus coming through from China.
The Purchasing Managers' Index (PMI) for China's manufacturing sector came in at 49.4 in November, down from 49.5 last month. The Non-Manufacturing PMI slipped to 50.2 in November from 50.6 in October, marking the weakest reading since December 2022.
Growing acceptance over a potential US Federal Reserve (Fed) policy pivot next year also kept investors going. Markets continue wagering a 49% probability of a Fed rate cut in March even after the US economy expanded at a faster pace in the third quarter than previously estimated.
Data published by the Bureau of Economic Analysis (BEA) showed on Wednesday, US Q3 GDP expanded at an annualized rate of 5.2%, revised up from the preliminary reading of 4.9%. Additional details from the publication showed that the PCE inflation was revised down to 2.8% on a quarterly basis in Q3 from 2.9% first readout while the Core PCE inflation was downgraded to 2.3% in Q3 from the flash estimate of 2.4%.
Attention now turns toward the US Core Personal Consumption Expenditures (PCE) Price index data and speeches from several Fed policymakers for fresh insights into the US central bank’s interest rate outlook. Traders also stay vigilant amid the end-of-the-month trading action, which could infuse volatility across the market.
At the time of writing, the US Dollar Index is keeping its recovery momentum intact at around 102.80, as the benchmark 10-year US Treasury bond yields see a modest uptick toward 4.30%. The US S&P 500 futures tick 0.12% higher on the day, reflecting some market optimism.
US Dollar price today
The table below shows the percentage change of US Dollar (USD) against listed major currencies today. US Dollar was the strongest against the Japanese Yen.
| USD | EUR | GBP | CAD | AUD | JPY | NZD | CHF | |
| USD | -0.02% | -0.04% | -0.13% | -0.45% | 0.02% | -0.31% | -0.04% | |
| EUR | 0.03% | -0.03% | -0.11% | -0.42% | 0.05% | -0.28% | -0.04% | |
| GBP | 0.05% | 0.04% | -0.07% | -0.41% | 0.08% | -0.25% | 0.00% | |
| CAD | 0.13% | 0.11% | 0.07% | -0.34% | 0.15% | -0.18% | 0.07% | |
| AUD | 0.44% | 0.45% | 0.42% | 0.34% | 0.50% | 0.16% | 0.41% | |
| JPY | -0.03% | -0.03% | -0.07% | -0.15% | -0.49% | -0.31% | -0.06% | |
| NZD | 0.30% | 0.29% | 0.25% | 0.17% | -0.14% | 0.32% | 0.26% | |
| CHF | 0.06% | 0.04% | 0.00% | -0.08% | -0.42% | 0.06% | -0.26% |
The heat map shows percentage changes of major currencies against each other. The base currency is picked from the left column, while the quote currency is picked from the top row. For example, if you pick the Euro from the left column and move along the horizontal line to the Japanese Yen, the percentage change displayed in the box will represent EUR (base)/JPY (quote).
Most major currencies are trading in familiar ranges but the Antipodeans are regaining lost momentum. The Australian Dollar (AUD) is standing tall on China’s stimulus hope. Aussie traders shrugged off dismal Australian Capex data for the third quarter. The New Zealand Dollar (NZD) is following suit, underpinned by a hawkish pause by the Reserve Bank of New Zealand (RBNZ) on Wednesday. AUD/USD is challenging the 0.6650 level while NZD/USD is holding gains near 0.6170.
The Japanese Yen is preserving its weekly gains against the US Dollar, as USD/JPY remains in a downside consolidative mode at around 147.00. Speculations that the Bank of Japan (BoJ) will likely end its negative interest rate policy (NIRP) early next year continue to support the domestic currency. However, the upside remains capped in the Yen amidst the dovish comments from the BoJ board member Toyoaki Nakamura, who said on Thursday that "we will need some more time before we can modify easy monetary policy.”
EUR/USD is holding lower ground below 1.1000, as the Euro feels the heat from softer German and Spanish inflation data. Markets eagerly await the preliminary Eurozone inflation data for fresh hints on the European Central Bank’s (ECB) path forward on interest rates. A modest US Dollar uptick is also keeping the pair’s upside attempts in check.
GBP/USD is better bid near 1.2700, underpinned by hawkish BoE commentary, implying that the British central bank is not done with its interest rate hiking cycle. BoE’s policymaker, Megan Greene, is due to speak at Leeds University. Greene was one of the hawkish dissenters who voted in favor of a 25 basis points (bps) rate hike at the latest meeting
Gold price has paused its five-day uptrend, on the back foot around $2,040 early Europe while WTI is holding fort above the $78 mark ahead of the critical OPEC+ meeting. Two OPEC+ sources said the alliance was discussing a deeper collective supply cut, with media speculating cuts to that extent of 1 million barrels per day (bpd).
Extra gains could still lift GBP/USD to the 1.2745 level in the next few weeks, suggest Economist Lee Sue Ann and Markets Strategist Quek Ser Leang at UOB Group.
Key Quotes
24-hour view: GBP traded between 1.2665 and 1.2733 yesterday before ending the day unchanged at 1.2695. The price action is likely part of a rangetrading phase. Today, GBP could continue to trade in a range, albeit a lower one of 1.2655/1.2720.
Next 1-3 weeks: Our most recent update was from a week ago (23 Nov, spot at 1.2490), wherein GBP “is likely to trade between 1.2360 and 1.2560 for the time being.” GBP then rose above 1.2560, and yesterday, it reached a high of 1.2733. Despite the advance, upward momentum has not increased much. However, as long as 1.2600 is not breached (‘strong support’ level), there is room for it to advance to 1.2745 before the risk of a pullback increases. At this time, the chance of GBP rising to the next resistance at 1.2795 is not high.
Considering advanced prints from CME Group for gold futures markets, open interest increased for the second session in a row on Wednesday, now by around 3.6K contracts. Volume, instead, shrank for the second consecutive session, this time by around 157.3K contracts.
Gold remains focused on the 2023 peak
Gold prices extended their rally on Wednesday, pushing further north of the key $2000 mark per troy ounce. The uptick was accompanied by increasing open interest and allows for the continuation of this trend in the very near term and with immediate target at the YTD top at $2067 (May 4).
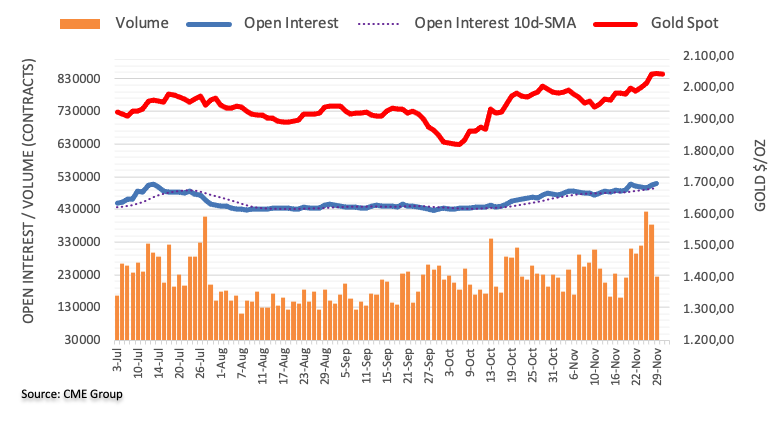
Economist Lee Sue Ann and Markets Strategist Quek Ser Leang at UOB Group note that further upside momentum in EUR/USD is now expected to meet the next hurdle around 1.1065.
Key Quotes
24-hour view: Yesterday, EUR rose to a 3-1/2-month high of 1.1017. The advance was short-lived, as EUR pulled back quickly and then traded sideways. Overbought conditions, combined with slowing momentum, suggest EUR is likely to continue to trade sideways. Expected range for today: 1.0945/1.1005.
Next 1-3 weeks: While EUR rose to a 3-1/2-month high of 1.1017 yesterday, upward momentum has not increased by much. The bias for EUR is on the upside, but it remains to be seen if it has enough momentum to break clearly above the major resistance at 1.1065. We will hold a positive EUR view as long as it stays above 1.0925.
- EUR/USD loses ground near 1.0970, down 0.02% ahead of Eurozone inflation data.
- The bullish outlook remains intact as it holds above 50- and 100-hour EMA; RSI indicator stands in bullish territory above 50.
- 1.1000 acts as an immediate resistance level; the critical support level is located at 1.0930.
The EUR/USD pair trades with modest intraday losses during the early European session on Thursday. The pair currently trades near 1.0970 after retreating from nearly four-month highs of 1.1017. Market players await the Italian, French, and Eurozone inflation data on Thursday. The Eurozone Harmonized Index of Consumer Prices (HICP) is estimated to grow 3.9% YoY in November from the previous reading of 4.2%.
From the technical perspective, EUR/USD maintains a positive vibe as the major holds above the 50- and 100-hour Exponential Moving Averages (EMA) on the four-hour chart. Additionally, the Relative Strength Index (RSI) stands in bullish territory above 50, indicating the path of least resistance for EUR/USD is to the upside.
The confluence of the boundary of the Bollinger Band and a psychological round mark at 1.1000 acts as an immediate resistance level for the pair. The next upside barrier will emerge at a high of November 29 at 1.1017, followed by a high of August 4 at 1.1042. Any follow-through buying above the latter will see the rally to a high of July 27 at 1.1150.
On the other hand, the key support level is located at 1.0930, portraying the lower limit of the Bollinger Band and the 50-hour EMA. Further south, the next contention is seen at a low of November 24 at 1.0895. The additional downside filter to watch is the 100-hour EMA at 1.0867, and finally a low of November 17 at 1.0825.
EUR/USD four-hour chart
-638369189717203265.png)
- Gold price struggles to gain any meaningful traction ahead of the US PCE Price Index.
- Fed rate cut bets, sliding US bond yields and a bearish USD continue to lend support.
- Concerns about the worsening economic conditions in China further act as a tailwind.
Gold price (XAU/USD) is seen oscillating in a narrow trading band during the Asian session on Thursday and consolidating its recent strong gains to its highest level since May 5, around the $2,052 area touched the previous day. Traders opt to move to the sidelines and await the release of the Personal Consumption Expenditures (PCE) data from the United States (USD), due later during the North American session. The core gauge – the Fed's preferred measure of inflation – will be looked for confirmation that inflation is slowing and reaffirm expectation of a dovish pivot by the Federal Reserve (Fed).
Heading into the key data risk, growing acceptance that interest rates in the US have peaked and rising bets that the Fed will start easing its monetary policy by the first half of the year continues to lend support to the non-yielding Gold price. The CME group's FedWatch tool indicates a more than 70% chance of a Fed rate cut move in May 2024, which leads to a further decline in the US Treasury bond yields. This, in turn, fails to assist the US Dollar (USD) to build on the overnight bounce from its lowest level since August 11, which, along with China's economic woes, acts as a tailwind for the XAU/USD.
Daily Digest Market Movers: Gold price holds steady just below a multi-month top amid dovish Fed expectations
- The recent remarks from several Federal Reserve officials suggested that the central bank may be done raising interest rates and continue to act as a tailwind for the Gold price.
- Fed Governor Christopher Waller flagged a possible rate cut in the months ahead and Cleveland Fed President Loretta Mester saw clear progress in getting inflation to 2%.
- The markets are now pricing in a cumulative 100 bps of rate cuts by the Fed in 2024, which is reinforced by a further decline in the US Treasury bond yields.
- The yield on the benchmark 10-year US government bond, which breached 5% in October for the first time in 16 years, languishes near its lowest level since September 14.
- Furthermore, the yield on the rate-sensitive two-year US Treasury note is at its lowest since July and continues to undermine the US Dollar, lending support to the XAU/USD.
- The second estimate of the US GDP showed that the world's largest economy grew by a 5.2% annualized pace during the third quarter as compared to the 4.9% reported previously.
- The upbeat US macro data did provide a modest lift to the USD on Wednesday, though dovish Fed expectations keep a lid on any meaningful recovery from a multi-month low.
- The latest data published by the National Bureau of Statistics (NBS) showed that China’s Manufacturing PMI ticked down to 49.4 in November from 49.5 in the prior month.
- The non-manufacturing PMI dropped to 50.2 in November from the 50.6 previous, fueling concerns about the worsening conditions in the world's second-largest economy.
Technical Analysis: Gold price consolidates before the next leg up amid slightly overbought RSI on the daily chart
From a technical perspective, the Relative Strength Index (RSI) on the daily chart is holding above the 70 mark, pointing to slightly overbought conditions and holding back bulls from placing fresh bets. That said, any meaningful corrective slide is more likely to attract fresh buyers near the overnight swing low, around the $2,035 region. This is followed by support near the $2,020 area and the $2,010-$2,008 strong horizontal resistance breakpoint.
The latter should act as a strong base for the Gold price, which if broken decisively should pave the way for deeper losses. On the flip side, the multi-month peak, around the $2,052 area touched on Wednesday, now seems to act as an immediate hurdle for the Gold price. A sustained strength beyond should allow bulls to aim back towards challenging the all-time high, around the $2,079-2,080 zone set in May.
US Dollar price this month
The table below shows the percentage change of US Dollar (USD) against listed major currencies this month. US Dollar was the weakest against the New Zealand Dollar.
| USD | EUR | GBP | CAD | AUD | JPY | NZD | CHF | |
| USD | -3.70% | -4.52% | -2.20% | -4.78% | -2.86% | -6.41% | -4.24% | |
| EUR | 3.56% | -0.79% | 1.47% | -1.05% | 0.82% | -2.61% | -0.52% | |
| GBP | 4.33% | 0.78% | 2.24% | -0.26% | 1.59% | -1.81% | 0.28% | |
| CAD | 2.16% | -1.48% | -2.27% | -2.54% | -0.63% | -4.11% | -2.00% | |
| AUD | 4.57% | 1.04% | 0.26% | 2.46% | 1.83% | -1.54% | 0.53% | |
| JPY | 2.77% | -0.82% | -1.62% | 0.65% | -1.89% | -3.47% | -1.31% | |
| NZD | 6.02% | 2.55% | 1.77% | 3.97% | 1.52% | 3.34% | 2.05% | |
| CHF | 4.07% | 0.51% | -0.27% | 1.96% | -0.54% | 1.31% | -2.08% |
The heat map shows percentage changes of major currencies against each other. The base currency is picked from the left column, while the quote currency is picked from the top row. For example, if you pick the Euro from the left column and move along the horizontal line to the Japanese Yen, the percentage change displayed in the box will represent EUR (base)/JPY (quote).
Gold FAQs
Why do people invest in Gold?
Gold has played a key role in human’s history as it has been widely used as a store of value and medium of exchange. Currently, apart from its shine and usage for jewelry, the precious metal is widely seen as a safe-haven asset, meaning that it is considered a good investment during turbulent times. Gold is also widely seen as a hedge against inflation and against depreciating currencies as it doesn’t rely on any specific issuer or government.
Who buys the most Gold?
Central banks are the biggest Gold holders. In their aim to support their currencies in turbulent times, central banks tend to diversify their reserves and buy Gold to improve the perceived strength of the economy and the currency. High Gold reserves can be a source of trust for a country’s solvency. Central banks added 1,136 tonnes of Gold worth around $70 billion to their reserves in 2022, according to data from the World Gold Council. This is the highest yearly purchase since records began. Central banks from emerging economies such as China, India and Turkey are quickly increasing their Gold reserves.
How is Gold correlated with other assets?
Gold has an inverse correlation with the US Dollar and US Treasuries, which are both major reserve and safe-haven assets. When the Dollar depreciates, Gold tends to rise, enabling investors and central banks to diversify their assets in turbulent times. Gold is also inversely correlated with risk assets. A rally in the stock market tends to weaken Gold price, while sell-offs in riskier markets tend to favor the precious metal.
What does the price of Gold depend on?
The price can move due to a wide range of factors. Geopolitical instability or fears of a deep recession can quickly make Gold price escalate due to its safe-haven status. As a yield-less asset, Gold tends to rise with lower interest rates, while higher cost of money usually weighs down on the yellow metal. Still, most moves depend on how the US Dollar (USD) behaves as the asset is priced in dollars (XAU/USD). A strong Dollar tends to keep the price of Gold controlled, whereas a weaker Dollar is likely to push Gold prices up.
- USD/CHF continues to lose ground as the US Dollar attempts to retrace recent gains.
- US GDP Annualized increased by 5.2% against the expected rise of 5.0% in Q3.
- Swiss ZEW Survey Expectations eased at the decline of 29.6 against the previous decline of 37.8.
USD/CHF moves on a five-session losing streak, primarily driven by US Dollar (USD) weakness and subdued US Treasury yields. The pair is trading near 0.8730 during the Asian session on Thursday.
The decline in US bond yields over the past three sessions is attributed to the prevailing positive sentiment that the Federal Reserve (Fed) might conclude its interest rate hikes. However, as of the current press time on Thursday, the 10 and 2-year US Treasury yields stand slightly higher at 4.27% and 4.65%, respectively.
Furthermore, stronger US Gross Domestic Product Annualized data provided support for the US Dollar (USD). The report showed an increase of 5.2%, exceeding the expected rise of 5.0% in the third quarter. Furthermore, Initial Jobless Claims for the week ending on November 24 and Personal Consumption Expenditure (PCE) Price Index data will be eyed on Thursday.
Cleveland Federal Reserve (Fed) President Loretta Mester has underscored that any decision to implement additional hikes would depend on data-driven considerations. She conveyed that the current monetary policy is well-placed to assess forthcoming data on the economy and financial conditions.
On the Swiss side, The Swiss Franc (CHF) remains supported and strengthened by the hawkish comments from Swiss National Bank (SNB) Chairman Thomas Jordan, who has not dismissed the possibility of future interest rate hikes.
ZEW Survey Expectations report showed a decline of 29.6 figures in November as compared to the previous contraction of 37.8. Additionally, Swiss Real Retail Sales for October on Thursday, and the Gross Domestic Product for the third quarter on Friday will be closely monitored.
- Indian Rupee edges higher on the softer US Dollar.
- India’s GDP number is expected to expand to 6.8% in the July–September quarter compared with the previous year.
- India’s GDP Quarterly for Q2 and US Core Personal Consumption Expenditure Price Index (PCE) will be in the spotlight on Thursday.
Indian Rupee (INR) drifts higher on Thursday as dovish comments from Federal Reserve (Fed) officials undermine the US Dollar demand. Asia's third-largest economy grew at 7.8% in the first quarter of the current fiscal year. India’s GDP number for the second quarter are scheduled to be released later in the day and is expected to grow at 6.8% in the July–September quarter compared with a year earlier.
Furthermore, Economic Affairs Secretary Ajay Seth expressed an optimistic view on the Indian economy on Wednesday, stating that the country is showing momentum and the growth rate in the second quarter is likely to be good. The Budget 2023-24 proposes to bring down the fiscal deficit to 5.9% of the GDP from 6.4% in the previous financial year. The government intends to decrease the budget deficit to less than 4.5% of GDP by 2025-26.
Investors will closely monitor India’s Gross Domestic Product (GDP) quarterly for the second quarter (Q2), which is scheduled for release on Thursday. Additionally, the development surrounding the last phase of state elections in India remains in focus, as a change in government might lead to policy modifications that could impact investors. On the US front, the Core Personal Consumption Expenditure Price Index (PCE) for October will be released, and this report could impact the expectations of the coming Fed decisions.
Daily Digest Market Movers: Indian Rupee strengthens amid the multiple headwinds
- Indian economy is projected to expand by 6.8% in the July-September quarter compared to the same period last year, according to a Reuters poll.
- Analysts anticipate that India's Gross Domestic Product will expand by more than 6.0% next year, making it the fastest-growing major economy.
- Reserve Bank of India (RBI) projected growth of 6.5% for the period of July to September.
- Domestic demand in India continues to be the primary driver of economic activity, as external demand remains fragile.
- US Gross Domestic Product Annualized for the third quarter (Q3) grew 5.2% in the third quarter (Q3) from the previous reading of 4.9%, above the market consensus of 5.0%.
- The US Core Personal Consumption Expenditure Price Index (PCE) for October is expected to ease to 0.2% MoM and 3.5% YoY.
- Federal Reserve (Fed) Governor Michelle Bowman said she sought to keep alive the possibility of more rate hikes, raising concerns about the longevity of inflationary pressure.
- Fed Governor Christopher Waller stated that the Fed won’t need to raise rates further and may begin cutting rates if inflation continues to ease over the next three to five months.
Technical Analysis: Indian Rupee keeps the positive outlook intact
The Indian Rupee trades strongly on the day. The USD/INR pair has traded in a familiar range of 82.80–83.40 since September. According to the daily chart, the continuation of the upward bias remains valid as the pair holds above the key 100-day Exponential Moving Average (EMA) with an upward slope. Further upside looks favorable, backed by the 14-day Relative Strength Index (RSI) that holds above the 50.0 midline.
The immediate target for bulls to beat will emerge at the upper boundary of the trading range at 83.40. The additional upside filter to watch is the year-to-date (YTD) high of 83.47, and finally a psychological round figure of 84.00. On the flip side, the 83.00 psychological mark offered support to USD/INR. A decisive break below 83.00 will see a drop to the confluence of the lower limit of the trading range and a low of September 12 at 82.80, followed by a low of August 11 at 82.60.
US Dollar price today
The table below shows the percentage change of US Dollar (USD) against listed major currencies today. US Dollar was the weakest against the New Zealand Dollar.
| USD | EUR | GBP | CAD | AUD | JPY | NZD | CHF | |
| USD | -0.02% | -0.04% | -0.07% | -0.29% | 0.05% | -0.37% | -0.09% | |
| EUR | 0.02% | -0.04% | -0.05% | -0.27% | 0.06% | -0.36% | -0.10% | |
| GBP | 0.04% | 0.03% | -0.02% | -0.24% | 0.11% | -0.32% | -0.04% | |
| CAD | 0.07% | 0.06% | 0.02% | -0.22% | 0.12% | -0.31% | -0.02% | |
| AUD | 0.26% | 0.27% | 0.23% | 0.22% | 0.33% | -0.10% | 0.18% | |
| JPY | -0.04% | -0.05% | -0.10% | -0.11% | -0.34% | -0.40% | -0.12% | |
| NZD | 0.36% | 0.36% | 0.33% | 0.30% | 0.09% | 0.41% | 0.28% | |
| CHF | 0.11% | 0.08% | 0.04% | 0.02% | -0.19% | 0.14% | -0.27% |
The heat map shows percentage changes of major currencies against each other. The base currency is picked from the left column, while the quote currency is picked from the top row. For example, if you pick the Euro from the left column and move along the horizontal line to the Japanese Yen, the percentage change displayed in the box will represent EUR (base)/JPY (quote).
Indian Rupee FAQs
What are the key factors driving the Indian Rupee?
The Indian Rupee (INR) is one of the most sensitive currencies to external factors. The price of Crude Oil (the country is highly dependent on imported Oil), the value of the US Dollar – most trade is conducted in USD – and the level of foreign investment, are all influential. Direct intervention by the Reserve Bank of India (RBI) in FX markets to keep the exchange rate stable, as well as the level of interest rates set by the RBI, are further major influencing factors on the Rupee.
How do the decisions of the Reserve Bank of India impact the Indian Rupee?
The Reserve Bank of India (RBI) actively intervenes in forex markets to maintain a stable exchange rate, to help facilitate trade. In addition, the RBI tries to maintain the inflation rate at its 4% target by adjusting interest rates. Higher interest rates usually strengthen the Rupee. This is due to the role of the ‘carry trade’ in which investors borrow in countries with lower interest rates so as to place their money in countries’ offering relatively higher interest rates and profit from the difference.
What macroeconomic factors influence the value of the Indian Rupee?
Macroeconomic factors that influence the value of the Rupee include inflation, interest rates, the economic growth rate (GDP), the balance of trade, and inflows from foreign investment. A higher growth rate can lead to more overseas investment, pushing up demand for the Rupee. A less negative balance of trade will eventually lead to a stronger Rupee. Higher interest rates, especially real rates (interest rates less inflation) are also positive for the Rupee. A risk-on environment can lead to greater inflows of Foreign Direct and Indirect Investment (FDI and FII), which also benefit the Rupee.
How does inflation impact the Indian Rupee?
Higher inflation, particularly, if it is comparatively higher than India’s peers, is generally negative for the currency as it reflects devaluation through oversupply. Inflation also increases the cost of exports, leading to more Rupees being sold to purchase foreign imports, which is Rupee-negative. At the same time, higher inflation usually leads to the Reserve Bank of India (RBI) raising interest rates and this can be positive for the Rupee, due to increased demand from international investors. The opposite effect is true of lower inflation.
- USD/CAD loses ground on soft US Dollar and higher Crude prices.
- WTI price extends its gains near $77.90 per barrel ahead of OPEC+ meeting.
- Canada’s GDP Annualized for the third quarter is expected to rise 0.2%.
USD/CAD seems to retrace its recent gains from the previous session, hovering around 1.3580 during the Asian session on Thursday. The Canadian Dollar (CAD) experiences upward support due to the weaker US Dollar (USD), coupled with improved Crude oil prices.
The US Dollar Index (DXY) looks to resume its downward trajectory after the gains observed on Wednesday, trading lower around 102.80, by the press time. The USD/CAD pair received upward support from stronger-than-expected US Gross Domestic Product Annualized data released by the US Bureau of Economic Analysis. The US GDP Annualized increased by 5.2% during the third quarter, surpassing the previous reading of 4.9% and exceeding the market consensus of 5.0%.
Western Texas Intermediate (WTI) price continues the winning streak for the third successive day, trading higher near $77.90 per barrel at the time of writing. The Crude oil prices gain momentum ahead of the meeting of the Organization of the Petroleum Exporting Countries and its allies (OPEC+) on Thursday. The expectation is that Saudi Arabia and Russia will likely propose an extension of oil supply cuts in 2024.
The concerns about oil demand have resurfaced following China's economic data. The NBS Manufacturing PMI for November declined to 49.4 from the previous reading of 49.5. The Non-Manufacturing PMI contracted to 50.02, falling below the expected 51.1.
Canada’s Gross Domestic Product Annualized for the third quarter is scheduled to be released on Thursday, expected to increase by 0.2%. On the other side, the United States will release crucial economic data, including the Initial Jobless Claims for the week ending on November 24 and Personal Consumption Expenditure (PCE) Price Index data.
- WTI lacks any firm intraday direction and oscillates in a narrow range on Thursday.
- Expectations for deeper supply cuts from OPEC+ act as a tailwind for the commodity.
- Signs of weak US demand and dismal Chinese data cap gains ahead of OPEC+ meeting.
West Texas Intermediate (WTI) Crude Oil prices struggle to capitalize on the weekly gains registered over the past two days and oscillate in a narrow band during the Asian session on Thursday. The commodity currently trades around the $77.75-$77.80 region, nearly unchanged for the day and just below a one-week high touched on Wednesday, as traders remain on the sidelines ahead of the OPEC+ meeting later today.
Heading into the key event risk, hopes of some form of a price-supportive resolution and deeper supply cuts from the cartel turn out to be a key factor lending support to the black liquid. Two OPEC+ sources said the group was discussing a deeper collective supply cut and media reports suggest that the cut could be of as much as 1 million barrels a day. That said, one of the sources said that OPEC+ may not be able to agree on this and it was possible the meeting could roll over existing policy. This, along with a jump in US crude stockpiles and dismal Chinese data, keeps a lid on any meaningful upside for Oil prices.
Data from the US Energy Information Administration (EIA) released on Wednesday, revealed an inventory build of 1.6 million barrels, reaching 449.7 million in the week to November 17. This missed consensus estimates for a 933,000-barrel drop by a big margin and pointed to weak demand. The impact, however, was neutralised by large draws in other refined products, like residual fuel oil. Meanwhile, official data released from China showed that manufacturing activity contracted for a second straight month in November, fuelling concerns about slowing economic growth in the world's largest oil importer.
The aforementioned mixed fundamental backdrop is holding back traders from placing aggressive directional bets around Oil prices. Market participants also prefer to wait on the sidelines ahead of the release of the US PCE Price Index later during the North American session. The core gauge is the Fed's preferred benchmark for measuring longer-term inflation trends and should influence the next policy move. This, in turn, will drive the US Dollar (USD) and provide some impetus to Oil prices.
Technical levels to watch
- Gold price faces downward pressure as China reported softer data.
- China’s Manufacturing and Non-Manufacturing PMI declined to 49.4 and 50.02, respectively.
- US Dollar gained ground as the US GDP Annualized increased by 5.2% against the 4.9% prior.
Gold price hovers lower around $2,040 per troy ounce during the Asian session on Thursday. The yellow metal has retreated from the six-month high it reached at $2,052 on Wednesday. The pullback in Gold's price suggests a shift in market sentiment or profit-taking after the recent rally.
Gold encountered challenges as the US Dollar (USD) saw a modest rebound. The US Dollar Index (DXY) struggles to sustain its gains, hovering around 102.80 at the moment. The US Dollar (USD) successfully halted its four-day losing streak in the previous session, thanks to stronger-than-expected US Gross Domestic Product Annualized data released by the US Bureau of Economic Analysis. The US GDP Annualized increased by 5.2% during the third quarter, surpassing the previous reading of 4.9% and exceeding the market consensus of 5.0%.
Furthermore, Cleveland Federal Reserve (Fed) President Loretta Mester expressed that monetary policy is currently in a favorable position to evaluate upcoming data on the economy and financial conditions. While Mester did not rule out the possibility of further rate hikes, she emphasized that the decision to implement additional hikes would data-dependent.
The NBS Manufacturing PMI for November declined to 49.4 from the previous reading of 49.5, falling short of the expected increase to 49.7. Moreover, the Non-Manufacturing PMI contracted to 50.02, below the expected 51.1 and the previous reading of 50.6. These data points indicate a contraction in both manufacturing and non-manufacturing activities in China, which could impact global economic sentiment and contribute to a stronger US Dollar, putting pressure on Gold prices.
Looking ahead, the United States is scheduled to release crucial economic data later in the North American session. Significant data include the Initial Jobless Claims for the week ending on November 24, with an expected increase to 220,000 from the previous 209,000. Additionally, the Core Personal Consumption Expenditure (PCE) Price Index for October will be released, with expectations of a slowdown in consumer inflation. The anticipated annual rate is expected to decrease from 3.7% to 3.5%.
| Raw materials | Closed | Change, % |
|---|---|---|
| Silver | 25.017 | -0.04 |
| Gold | 2044.096 | 0.14 |
| Palladium | 1028.13 | -2.02 |
- NZD/USD gains some positive traction for the sixth successive day on Thursday.
- The RBNZ’s hawkish pause continues to underpin the Kiwi amid a bearish USD.
- Traders now look to the US Core PCE Price Index for some meaningful impetus.
The NZD/USD pair attracts some dip-buying during the Asian session on Thursday and stalls the previous day's late pullback from levels just above the 0.6200 mark, or a four-month peak. Spot prices currently trade around the 0.6170 region, up for the sixth straight day, and seem poised to prolong its recent well-established uptrend witnessed over the past month or so.
The New Zealand Dollar (NZD) continues to be underpinned by the Reserve Bank of New Zealand's (RBNZ) hawkish pause on Wednesday. The central bank, as was widely anticipated, left its cash rate unchanged at 5.5% and warned that rates will need to remain at a restricted level for a sustained period of time to tackle inflation. Moreover, RBNZ Governor Adrian Orr, addressing the post-meeting press conference, noted that the risk to inflation is still more to the upside and the central bank did discuss raising rates. This, along with the underlying bearish sentiment surrounding the US Dollar (USD), validates the near-term positive outlook for the NZD/USD pair.
The recent remarks from several Federal Reserve officials offered a clear signal that the central bank may be finished with the policy tightening campaign in a bid to slow demand and cool inflation. Moreover, the markets are now pricing in a cumulative 100 bps of rate cuts by the Fed in 2024, which is reinforced by a further decline in the US Treasury bond yields. In fact, the yield on the rate-sensitive two-year US government bond is at its lowest since July. This, along with a generally positive risk tone, is seen undermining the safe-haven buck, which helps offset the disappointing release of the official Chinese PMI prints and continues to act as a tailwind for the Kiwi.
The latest data published by the National Bureau of Statistics (NBS) showed that China’s Manufacturing PMI ticked down to 49.4 in November from 49.5 in the prior month. Furthermore, the Non-Manufacturing PMI dropped to 50.2 in November versus the expected 51.1 figure and the 50.6 previous. The data, however, does little to influence the NZD/USD pair, which remains at the mercy of the USD price dynamics. Hence, the market focus will remain glued to the US PCE Price Index, due for release later during the North American session. The core gauge is the Fed's preferred benchmark for measuring longer-term inflation trends and should influence the buck.
Technical levels to watch
- GBP trades in a positive territory for the third consecutive week under 1.2700.
- US economy grew to 5.2% in Q3 from the previous reading of 4.9%, above the market consensus of 5.0%.
- BoE Governor Bailey said the central bank will do what it takes to bring inflation down to its 2% target.
- US Core PCE inflation data will be closely monitored by traders.
The GBP/USD pair attracts some buyers below the 1.2700 psychological mark during the early Asian session on Thursday. That being said, the softer US Dollar (USD) offers some support to the major pair. At press time, GBP/USD is trading near 1.2695, up 0.02% on the day.
The US Bureau of Economic Analysis (BEA) revealed on Thursday that the US economy grew to 5.2% in the third quarter (Q3) from the previous reading of 4.9%, above the market consensus of 5.0%. Federal Reserve (Fed) Governor Michelle Bowman said he sought to keep alive the possibility of more rate hikes, raising concerns about the longevity of inflationary pressure. Earlier this week, Fed Governor Christopher Waller stated that the Fed does not need to hike rates further from here.
Despite the mixed labor market and cooling inflation, investors will take more cues from the Core Personal Consumption Expenditure Price Index (PCE) for October. The monthly and annual Core PCE are expected to ease to 0.2% and 3.5%, respectively. These figures could convince the Fed of the coming Fed decisions.
On the UK’s front, Bank of England (BoE) Governor Andrew Bailey said on Wednesday that the central bank will do what it takes to bring inflation down to its 2% target, adding that the central bank has not seen the progress yet to be confident.
Looking ahead, traders will closely monitor the Core PCE inflation data, due later on Thursday. Additionally, the US weekly Jobless Claims, the Chicago PMI, and Pending Home Sales will be released. In the absence of top-tier economic data released from the UK docket, the GBP/USD pair remains at the mercy of USD price dynamics.
- The Japanese Yen continues with its relative outperformance amid hawkish BoJ expectations.
- Bets for a series of rate cuts by the Fed in 2024 undermines the USD and weighs on USD/JPY.
- Bears turn cautious and look to the US PCE Price Index before positioning for a fresh impetus.
The Japanese Yen (JPY) remains on the front foot against its American counterpart for the fifth successive day on Thursday amid expectations that the Bank of Japan (BoJ) will soon end its negative rate policy. The JPY bulls, meanwhile, seem rather unaffected by Wednesday’s less hawkish remarks by BoJ board member Seiji Adachi, saying that the economy is yet to reach a stage where the central bank could debate an exit from ultra-easy monetary policy. On the economic data front, Japanese Retail Trade for October missed consensus estimates, though the disappointment was offset by an upward revision of the previous month's reading and better-than-expected Industrial Production figures.
Apart from this, the underlying bearish sentiment surrounding the US Dollar (USD) – amid growing acceptance that the Federal Reserve (Fed) is done raising interest rates – keeps the USD/JPY pair depressed near a three-month low touched on Wednesday. The recent dovish remarks by several Fed officials lifted market bets that the US central bank may start easing its monetary policy as early as March 2024. This overshadows the upbeat US GDP print, which showed that the economy grew at a faster pace than estimated originally during the July-September period. The data, however, does little to provide any respite to the USD, suggesting that the path of least resistance for the pair is to the downside.
That said, bearish traders now seem reluctant to place aggressive bets ahead of the release of the US PCE Price Index, due later during the early North American session. The core gauge is the Fed's preferred benchmark for measuring longer-term inflation trends and will play a key role in influencing the next policy move. This, in turn, should provide some meaningful impetus to the buck and help determine the near-term trajectory for the USD/JPY pair ahead of Fed Chair Jerome Powell's speech on Friday.
Daily Digest Market Movers: Japanese Yen bulls shrug off the overnight less hawkish remarks by BoJ’s Adachi
- The Japanese Yen draws support from hawkish Bank of Japan expectations even though board member Seiji Adachi on Wednesday downplayed speculations about an imminent shift in the policy stance.
- BoJ's Adachi says that Japan is yet to see a positive wage-inflation cycle become embedded enough and it is appropriate to patiently maintain the current easy policy.
- Adachi added that BoJ will take additional easing steps if needed and the move in October to make YCC flexible was not aimed at laying the groundwork for policy normalisation.
- Japanese Retail Trade fell 1.6% in October and grew by 4.2% from a year earlier and the previous month's reading was revised higher to show a rise of 6.2% against 5.8% reported.
- Japanese Industrial Production rose more than expected, by 1% in October, as compared to the previous month's 0.5% uptick and increased 0.9% compared with a year earlier.
- The second estimate of the US GDP showed that the world's largest economy grew by a 5.2% annualized pace during the third quarter as compared to the 4.9% reported previously.
- The upbeat US macro data, however, was largely offset by more dovish comments by Federal Reserve officials, which reaffirmed bets for a series of rate cuts in 2024.
- Cleveland Fed President Loretta Mester saw clear progress in getting inflation to 2% and said that monetary policy must be nimble in current circumstances.
- Separately, Richmond Fed President Tom Barkin believes that inflation will be more stubborn than what they would like and is unwilling to take another interest rate hike off the table.
- US rates futures markets are now pricing in more than 100 bps of rate cuts next year, starting in May, and the yield on the rate-sensitive two-year US government bond is its lowest since July.
- This keeps the US Dollar bulls on the defensive and exerts some pressure on the USD/JPY pair for the fifth straight day, ahead of the release of the US PCE Price Index later this Thursday.
Technical Analysis: USD/JPY needs to find acceptance below 100-day SMA for bears to seize near-term control
From a technical perspective, the USD/JPY pair, so far, has been showing some resilience below the 100-day Simple Moving Average (SMA), warranting caution for bearish traders. That said, oscillators on the daily chart are holding deep in negative territory and are still far from being in the oversold zone. This, in turn, suggests that the path of least resistance for spot prices remains to the downside and any meaningful recovery attempt could be seen as a selling opportunity.
Meanwhile, the multi-month trough, around the 146.65 region touched on Wednesday, now seems to protect the immediate downside, below which the USD/JPY pair could accelerate the fall towards the 146.00 round figure. On the flip side, the 147.30-147.35 zone is likely to act as an immediate hurdle ahead of the overnight swing high, around the 147.90 area and the 148.00 mark. Any further move up could attract fresh sellers and remain capped near the 148.30 strong horizontal support breakpoint, now turned resistance.
Japanese Yen price today
The table below shows the percentage change of Japanese Yen (JPY) against listed major currencies today. Japanese Yen was the strongest against the Canadian Dollar.
| USD | EUR | GBP | CAD | AUD | JPY | NZD | CHF | |
| USD | -0.03% | 0.00% | 0.00% | -0.03% | -0.03% | -0.19% | -0.10% | |
| EUR | 0.04% | 0.03% | 0.03% | 0.00% | 0.01% | -0.16% | -0.09% | |
| GBP | 0.00% | -0.03% | 0.01% | -0.02% | -0.02% | -0.18% | -0.09% | |
| CAD | 0.00% | -0.04% | -0.01% | -0.03% | -0.02% | -0.19% | -0.10% | |
| AUD | 0.00% | 0.00% | 0.02% | 0.03% | 0.05% | -0.17% | -0.09% | |
| JPY | 0.00% | 0.00% | 0.02% | 0.03% | -0.05% | -0.14% | -0.08% | |
| NZD | 0.19% | 0.16% | 0.19% | 0.18% | 0.16% | 0.16% | 0.10% | |
| CHF | 0.10% | 0.06% | 0.09% | 0.08% | 0.07% | 0.06% | -0.11% |
The heat map shows percentage changes of major currencies against each other. The base currency is picked from the left column, while the quote currency is picked from the top row. For example, if you pick the Euro from the left column and move along the horizontal line to the Japanese Yen, the percentage change displayed in the box will represent EUR (base)/JPY (quote).
Japanese Yen FAQs
What key factors drive the Japanese Yen?
The Japanese Yen (JPY) is one of the world’s most traded currencies. Its value is broadly determined by the performance of the Japanese economy, but more specifically by the Bank of Japan’s policy, the differential between Japanese and US bond yields, or risk sentiment among traders, among other factors.
How do the decisions of the Bank of Japan impact the Japanese Yen?
One of the Bank of Japan’s mandates is currency control, so its moves are key for the Yen. The BoJ has directly intervened in currency markets sometimes, generally to lower the value of the Yen, although it refrains from doing it often due to political concerns of its main trading partners. The current BoJ ultra-loose monetary policy, based on massive stimulus to the economy, has caused the Yen to depreciate against its main currency peers. This process has exacerbated more recently due to an increasing policy divergence between the Bank of Japan and other main central banks, which have opted to increase interest rates sharply to fight decades-high levels of inflation.
How does the differential between Japanese and US bond yields impact the Japanese Yen?
The BoJ’s stance of sticking to ultra-loose monetary policy has led to a widening policy divergence with other central banks, particularly with the US Federal Reserve. This supports a widening of the differential between the 10-year US and Japanese bonds, which favors the US Dollar against the Japanese Yen.
How does broader risk sentiment impact the Japanese Yen?
The Japanese Yen is often seen as a safe-haven investment. This means that in times of market stress, investors are more likely to put their money in the Japanese currency due to its supposed reliability and stability. Turbulent times are likely to strengthen the Yen’s value against other currencies seen as more risky to invest in.
Bank of Japan (BoJ) Board member Toyoaki Nakamura said on Thursday, "we will need some more time before we can modify easy monetary policy.”
Additional comments
Now is a time to be cautious in our policy response.
Current inflation is mostly driven by cost-push factors.
We haven't reached a stage where we can say with conviction that sustained, stable achievement of 2% inflation accompanied by wage growth is in sight.
We are seeing signs Japan will see wage growth exceeding the rate of inflation.
Must patiently maintain current monetary easing for the time being.
Japan's economy recovering moderately.
Expect Japan's economy to recover moderately accompanied by wage increases.
Market reaction
At the time of writing, the USD/JPY pair is keeping its offered tone intact at around 147.00, down 0.14% on the day.
China’s official Manufacturing Purchasing Managers' Index (PMI) contraction deepened in November, coming in at 49.4 as against the 49.5 contraction registered in October, the latest data published by the country’s National Bureau of Statistics (NBS) showed on Thursday. Markets expected a 49.7 readout in the reported month.
The index dropped further below the 50 mark, which separates expansion from contraction.
The NBS Non-Manufacturing PMI dropped to 50.2 in November versus the expected 51.1 figure and October’s 50.6 figure.
AUD/USD reaction to China's PMI data
The downbeat Chinese PMIs is serving a negative impact on the Australian Dollar, with AUD/USD holding lower ground near 0.6620. The spot is up 0.05% on the day.
On Thursday, the People’s Bank of China (PBoC) set the USD/CNY central rate for the trading session ahead at 7.1018 as compared to the previous day's fix of 7.1031 and 7.1273 Reuters estimates.
- Australian Dollar recovers the recent losses as the Greenback struggles to hold ground.
- Australia’s Private Capital Expenditure declined by 0.6% in Q3, against the expected rise of 1.0%.
- US GDP Annualized increased by 5.2% as compared to the 4.9% prior.
The Australian Dollar (AUD) attempts to recover the recent losses, despite downbeat economic data from Australia on Thursday. The AUD/USD pair retraced from its nearly four-month high at 0.6676 in the previous session. The downward pressure on the Aussie pair can be attributed to the recovery in strength of the US Dollar (USD).
Australia's Private Capital Expenditure experienced a decline of 0.6% in Q3, contrasting with the previous growth of 2.8%. This contraction fell short of the expected rise of 1.0%. The data, released by the Australian Bureau of Statistics, indicates a decrease in both current and future capital expenditure intentions within the private sector of the country. This could ease the inflationary pressure, which reduces the likelihood of an interest rate hike by the Reserve Bank of Australia (RBA)
The US Dollar Index (DXY) managed to halt its four-day losing streak on Wednesday. This stabilization was supported by stronger-than-expected US Gross Domestic Product Annualized data released by the US Bureau of Economic Analysis. The US GDP data indicated an increase in the value of the final goods and services produced in the United States during the third quarter. However, the index struggles to maintain its position on Thursday.
United States is set to release crucial economic data later in the North American session. Among the notable reports are the weekly Jobless Claims for the week ending on November 24, with an expected increase to 220K from the previous 209K. Additionally, the Core Personal Consumption Expenditure (PCE) Price Index for October will be released, with expectations of a slowdown in consumer inflation. The anticipated annual rate is expected to decrease from 3.7% to 3.5%.
Daily Digest Market Movers: Australian Dollar receives upward support amid hawkish RBA
- Australia's Monthly Consumer Price Index (CPI) for October shows a reading of 4.9%, a decrease from the previous reading of 5.6% in September and slightly below the expected 5.2%.
- Australia’s seasonally adjusted Retail Sales data showed monthly readings for October, which declined by 0.2% against the market expectations of a 0.1% rise and 0.9% prior.
- Reserve Bank of Australia (RBA) Governor Michele Bullock highlighted that the current monetary policy is on the restrictive side, with rate hikes putting a damper on demand, particularly in the context of persistent services inflation.
- Governor Bullock emphasized the need for caution in employing high interest rates to combat inflation without inadvertently raising the unemployment rate.
- US Federal Reserve Governor Christopher Waller suggested that if inflation consistently declines, there's no need to maintain high-interest rates.
- US Gross Domestic Product Annualized increased by 5.2% during the third quarter from the previous reading of 4.9%, above the market consensus of 5.0.
- US Housing Price Index (MoM) remained consistent at 0.6% in September against the expected figure of 0.4%.
- The CB Consumer Confidence Index experienced an increase in November, rising to 102.0. This uptick comes after a downward revision of October figures, which were adjusted from 102.6 to 99.1.
Technical Analysis: Australian Dollar hovers below the barrier at 0.6650 major level
The Australian Dollar trades at higher levels, approximately around 0.6630 on Thursday. The major level at 0.6650 could be the immediate resistance, followed by a significant barrier at the psychological level of 0.6700. A successful breakthrough above this level may provide support for the AUD/USD pair, opening the possibility of testing the resistance around August's high at 0.6723. Conversely, key support is positioned around the seven-day Exponential Moving Average (EMA) at 0.6597. A decisive break below the EMA could potentially lead the pair to reach support near the 23.6% Fibonacci retracement level at 0.6576, followed by the major level at 0.6550.
AUD/USD: Daily Chart
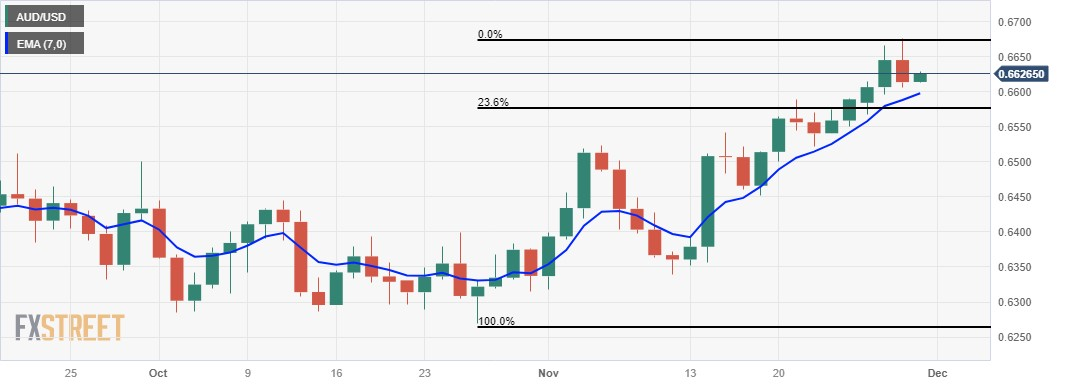
Australian Dollar price today
The table below shows the percentage change of Australian Dollar (AUD) against listed major currencies today. Australian Dollar was the strongest against the Japanese Yen.
| USD | EUR | GBP | CAD | AUD | JPY | NZD | CHF | |
| USD | -0.05% | 0.00% | -0.03% | -0.10% | 0.02% | -0.24% | -0.10% | |
| EUR | 0.05% | 0.03% | 0.01% | -0.07% | 0.08% | -0.20% | -0.07% | |
| GBP | 0.00% | -0.04% | -0.02% | -0.10% | 0.04% | -0.23% | -0.09% | |
| CAD | 0.03% | -0.02% | 0.03% | -0.08% | 0.05% | -0.21% | -0.07% | |
| AUD | 0.07% | 0.07% | 0.10% | 0.08% | 0.13% | -0.16% | 0.00% | |
| JPY | -0.03% | -0.06% | -0.05% | -0.04% | -0.15% | -0.25% | -0.12% | |
| NZD | 0.23% | 0.19% | 0.22% | 0.21% | 0.14% | 0.25% | 0.13% | |
| CHF | 0.11% | 0.05% | 0.09% | 0.07% | 0.00% | 0.11% | -0.13% |
The heat map shows percentage changes of major currencies against each other. The base currency is picked from the left column, while the quote currency is picked from the top row. For example, if you pick the Euro from the left column and move along the horizontal line to the Japanese Yen, the percentage change displayed in the box will represent EUR (base)/JPY (quote).
Australian Dollar FAQs
What key factors drive the Australian Dollar?
One of the most significant factors for the Australian Dollar (AUD) is the level of interest rates set by the Reserve Bank of Australia (RBA). Because Australia is a resource-rich country another key driver is the price of its biggest export, Iron Ore. The health of the Chinese economy, its largest trading partner, is a factor, as well as inflation in Australia, its growth rate and Trade Balance. Market sentiment – whether investors are taking on more risky assets (risk-on) or seeking safe-havens (risk-off) – is also a factor, with risk-on positive for AUD.
How do the decisions of the Reserve Bank of Australia impact the Australian Dollar?
The Reserve Bank of Australia (RBA) influences the Australian Dollar (AUD) by setting the level of interest rates that Australian banks can lend to each other. This influences the level of interest rates in the economy as a whole. The main goal of the RBA is to maintain a stable inflation rate of 2-3% by adjusting interest rates up or down. Relatively high interest rates compared to other major central banks support the AUD, and the opposite for relatively low. The RBA can also use quantitative easing and tightening to influence credit conditions, with the former AUD-negative and the latter AUD-positive.
How does the health of the Chinese Economy impact the Australian Dollar?
China is Australia’s largest trading partner so the health of the Chinese economy is a major influence on the value of the Australian Dollar (AUD). When the Chinese economy is doing well it purchases more raw materials, goods and services from Australia, lifting demand for the AUD, and pushing up its value. The opposite is the case when the Chinese economy is not growing as fast as expected. Positive or negative surprises in Chinese growth data, therefore, often have a direct impact on the Australian Dollar and its pairs.
How does the price of Iron Ore impact the Australian Dollar?
Iron Ore is Australia’s largest export, accounting for $118 billion a year according to data from 2021, with China as its primary destination. The price of Iron Ore, therefore, can be a driver of the Australian Dollar. Generally, if the price of Iron Ore rises, AUD also goes up, as aggregate demand for the currency increases. The opposite is the case if the price of Iron Ore falls. Higher Iron Ore prices also tend to result in a greater likelihood of a positive Trade Balance for Australia, which is also positive of the AUD.
How does the Trade Balance impact the Australian Dollar?
The Trade Balance, which is the difference between what a country earns from its exports versus what it pays for its imports, is another factor that can influence the value of the Australian Dollar. If Australia produces highly sought after exports, then its currency will gain in value purely from the surplus demand created from foreign buyers seeking to purchase its exports versus what it spends to purchase imports. Therefore, a positive net Trade Balance strengthens the AUD, with the opposite effect if the Trade Balance is negative.
- EUR/USD hovers around 1.0975 on the weaker German inflation data.
- The November German HICP came in at -0.7% MoM vs. -0.2% prior, worse than expected.
- US GDP for Q3 arrived at 5.2% from 4.9% in the previous reading.
- All eyes are on the Eurozone HICP and US Core PCE data on Thursday.
The EUR/USD pair struggles to gain ground above 1.1000 during the early Asian trading hours on Thursday. The weaker-than-expected German and Spain inflation data weighed on the Euro (EUR). Investors await the Italian, French, and Eurozone inflation data on Thursday for fresh impetus. The major pair currently trades near 1.0975, up 0.01% for the day.
The November German Harmonized Index of Consumer Prices (HICP) fell 0.7% MoM from a 0.2% drop in the previous reading. On an annual basis, HICP inflation eased to 2.3% YoY versus 3.0% prior. This is the lowest point of inflation since April 2021. It is nearly at target and declined from a record high of 11.6% YoY in October 2022. However, the reading came in worse than market expectations and suggested downside risks to Eurozone HICP inflation for November.
On Tuesday, Bundesbank chief Joachim Nagel said the European Central Bank (ECB) may need to raise interest rates again if the inflation outlook worsens. Nonetheless, the market is pricing 95 basis points (bps) of rate cuts next year, beginning in April.
Across the pond, the US Gross Domestic Product Annualized for the third quarter (Q3) arrived at 5.2% from 4.9% in the previous reading, above the market consensus of 5.0%. However, the upside of the Greenback was limited despite the upbeat US growth numbers.
Federal Reserve (Fed) Governor Christopher Waller said Tuesday that inflation currently remains too high, but he stated that progress has been made and the Fed won’t need to hike rates further from here. While Fed Governor Michelle Bowman said he sought to keep alive the possibility of another rate hike, raising concerns about the longevity of inflationary pressure.
Market participants will take more cues from more inflation data, due later on Thursday. The Eurozone HICP annual rate is expected to rise 3.9% in November, below the 4.2% recorded in October. Additionally, the German Retail Sales for October and the Unemployment Rate for November will be released. On the US docket, the US weekly Jobless Claims, the Core Personal Consumption Expenditure Price Index (PCE) for October, the Chicago PMI, and Pending Home Sales will be due on Thursday. These figures could give a clear direction to the EUR/USD pair.
| Index | Change, points | Closed | Change, % |
|---|---|---|---|
| NIKKEI 225 | -87.17 | 33321.22 | -0.26 |
| Hang Seng | -360.7 | 16993.44 | -2.08 |
| KOSPI | -1.95 | 2519.81 | -0.08 |
| ASX 200 | 20.1 | 7035.3 | 0.29 |
| DAX | 173.78 | 16166.45 | 1.09 |
| CAC 40 | 17.51 | 7267.64 | 0.24 |
| Dow Jones | 13.44 | 35430.42 | 0.04 |
| S&P 500 | -4.31 | 4550.58 | -0.09 |
| NASDAQ Composite | -23.27 | 14258.49 | -0.16 |
| Pare | Closed | Change, % |
|---|---|---|
| AUDUSD | 0.66167 | -0.45 |
| EURJPY | 161.49 | -0.29 |
| EURUSD | 1.097 | -0.2 |
| GBPJPY | 186.868 | -0.14 |
| GBPUSD | 1.26936 | 0.03 |
| NZDUSD | 0.61558 | 0.35 |
| USDCAD | 1.35867 | 0.13 |
| USDCHF | 0.87371 | -0.44 |
| USDJPY | 147.214 | -0.17 |
Japanese Retail Trade for the year into October missed the mark after printing at 4.2% compared to the median forecast of 5.9%, while the previous period saw an upside revision from 5.8% to 6.2%.
October's MoM Retail Trade accelerated declines, coming in at -1.6% compared to September's -0.1%Q print.
Japanese Large Retailer Sales held on the upside, printing at 4% in October, but still fell back from September's reading of 5% MoM.
Market Reaction
The USD/JPY is holding steady just above the 147.00 handle after testing into an early Thursday low of 146.84 prior to the data release.
About Japan's Retail Trade
The Retail Trade released by the Ministry of Economy, Trade and Industry captures the aggregate sales made through a business location (usually a store) in which the principal activity is the sale of merchandise and related services to the general public, for household or personal consumption. Consumer spending is a key important indicator for the Japanese economy. A high reading is positive for the JPY, while a low reading is negative.
About Japan's Large Retailer Sales
The Large Retailer Sales released by the Ministry of Economy, Trade and Industry captures the total value of goods sold in large stores, chain convenience stores, and supermarkets. It indicates the level of consumption and consumer confidence. A high level of Large Retailers´ Sales stimulates economic expansion while a low level drives to economic downturn. A high reading is positive for the JPY, while a low reading is bearish.


© 2000-2026. Уcі права захищені.
Cайт знаходитьcя під керуванням TeleTrade DJ. LLC 2351 LLC 2022 (Euro House, Richmond Hill Road, Kingstown, VC0100, St. Vincent and the Grenadines).
Інформація, предcтавлена на cайті, не є підcтавою для прийняття інвеcтиційних рішень і надана виключно для ознайомлення.
Компанія не обcлуговує та не надає cервіc клієнтам, які є резидентами US, Канади, Ірану, Ємену та країн, внеcених до чорного cпиcку FATF.
Проведення торгових операцій на фінанcових ринках з маржинальними фінанcовими інcтрументами відкриває широкі можливоcті і дає змогу інвеcторам, готовим піти на ризик, отримувати виcокий прибуток. Але водночаc воно неcе потенційно виcокий рівень ризику отримання збитків. Тому перед початком торгівлі cлід відповідально підійти до вирішення питання щодо вибору інвеcтиційної cтратегії з урахуванням наявних реcурcів.
Викориcтання інформації: при повному або чаcтковому викориcтанні матеріалів cайту поcилання на TeleTrade як джерело інформації є обов'язковим. Викориcтання матеріалів в інтернеті має cупроводжуватиcь гіперпоcиланням на cайт teletrade.org. Автоматичний імпорт матеріалів та інформації із cайту заборонено.
З уcіх питань звертайтеcь за адреcою pr@teletrade.global.
переклади