- Аналітика
- Новини та інструменти
- Новини ринків
Новини ринків
Japan’s Unemployment Rate came in at 2.6% in September, compared with the previous figure of 2.7%, according to the official data published by the Japan Statistics Bureau on Tuesday. The market consensus was a 2.6% print in the reported period.
Additionally, the nation’s Retail Trade eased to 5.8% YoY in September from the previous reading of 7.0%. The figure came in worse than the expectation of 5.9%, the Ministry of Economy, Trade and Industry reported on Tuesday.
- USD/JPY holds ground above the 149.00 psychological mark ahead of the key event.
- Nikkei reported that BoJ may tweak its Yield Curve Control (YCC) approach.
- Fed Chair Jerome Powell affirmed that they would leave rates unchanged, but could warrant further tightening of monetary policy.
- BoJ monetary policy meeting will be closely monitored by traders.
The USD/JPY pair finds support above the 149.00 mark during early Asian trading hours on Tuesday. The speculation that the Bank of Japan (BoJ) may tweak its Yield Curve Control (YCC) approach boosts the Japanese Yen (JPY) against the US Dollar (USD). The BoJ monetary policy meeting on Tuesday will be in the spotlight. The pair currently trades near 149.15, gaining 0.04% on the day.
Market players await the highly anticipated BoJ meeting. On Monday, Nikkei reported that BoJ will consider adjusting its Yield Curve Control (YCC) framework to allow the 10-year Japanese Government Bond (JGB) to exceed 1.0% on Tuesday's monetary. BOJ Govorner Kazuo Ueda said the new 1.0% cap was flexible, not rigid. The JPY edged higher against the USD following this headline. It’s worth noting that the long-term rate is currently set at 1%, with BoJ conducting unlimited fixed-rate purchases to maintain yields below that level.
The Federal Reserve (Fed) Chair Jerome Powell affirmed last week that they would leave interest rates unchanged at its November meeting on Wednesday, but whether they will hold for December will depend on the incoming data. Powell further stated that the US rate could go up again if high economic growth and a labor shortage continue.
Markets currently priced in a 23% chance of the Fed hiking 25 basis points (bps) on Wednesday, according to the CME Fedwatch tools. The hawkish comments from Fed officials might cap the downside of the Greenback and act as a tailwind for the USD/JPY pair.
Moving on, the BoJ monetary policy meeting and BoJ Press Conference will be closely watched events. These events could trigger volatility in the market. Later this week, the Fed interest rate decision will be announced.
Bank of Canada (BoC) Governor Tiff Macklem commented earlier Tuesday that the central bank continues to assess whether monetary policy is sufficiently restrictive while not starting to talk about interest rate cuts.
Key quotes
"We held policy steady because monetary policy is working to cool the economy and relieve price pressures."
"We continue to assess whether monetary policy is sufficiently restrictive."
"If inflationary pressures persist, we are prepared to raise our policy rate further to restore price stability."
"Low growth, higher rates will impact the government budget."
"Protecting Canada's very good fiscal position is important."
"I don't think fiscal policy in Canada is in a situation where it's unsustainable. But I do think protecting our very good fiscal position is important."
Market reaction
The comments above have little to no impact on the Canadian Dollar. At the time of writing, the USD/CAD pair is trading near 1.3826, unchanged on the day
- The Bank of Japan to keep interest rate and YCC policy steady yet again.
- The BoJ is reportedly said to upgrade fiscal 2023 and 2024 inflation forecasts.
- Quarterly outlook to overshadow Japan’s interest rate decision, rocking USD/JPY.
The Bank of Japan (BoJ) is expected to announce its decision on the interest rate, as well as, the Yield Curve Control (YCC) policy on Tuesday.
Heading into the BoJ policy announcements, the Japanese Yen (JPY) has recovered some ground against the US Dollar (USD), having weakened past the key 150.00 level last week, a threshold that once again prompted Japanese policymakers to intervene in the bond market.
Markets are not expecting any surprises from the BoJ even though Japan’s inflation exceeded the 2% price target for the 19th consecutive month and the government bond (JGB) yields held at decade highs.
Bank of Japan policy expectation and its impact on USD/JPY
Following the October monetary policy review meeting on Tuesday, the Bank of Japan is set to leave its current policy settings unadjusted, maintaining interest rate and 10-year JGB yield target at -10bps and 0.00%, respectively.
Heading into the BoJ policy announcements, the central bank has already intervened in the bond market for the sixth time this month to stem the relentless upsurge in JGB yields. Domestic yields have yielded into the bullish pressure, induced by the staggering rally in US Treasury bond yields to a 16-year high. The benchmark 10-year US Treasury bond yield briefly topped the 5.0% key level last Monday.
The benchmark 10-year JGB yield is sitting close to 0.86%, its highest level since July 2013. The persistent rise in JGB yields has put pressure on the BoJ “to discuss the possibility of additional loosening YCC at the October policy meeting,” Reuters reported, citing sources at the central bank. The BoJ unexpectedly raised the cap for the 10-year yield from 0.50% to 1.0% on July 28.
Another concern for the Japanese central bank remains the elevated inflation level, which has been consistently above the Bank’s 2% target for over a year now. Tokyo core Consumer Price Index (CPI), a figure closely watched by the BoJ, rose 2.7% in October from a year earlier, up from a 2.5% increase in September. Meanwhile, The "core-core" index, excluding fresh food and energy, climbed 3.8%.
Amidst stubbornly high inflation, three people familiar with the matter said earlier this month that the “BoJ is set to raise its core consumer inflation forecast for the year ending in March 2024 to near 3.0% from the current 2.5% projected in July in its fresh quarterly growth and inflation forecasts. It is also seen upgrading its forecast for 2024 from the current 1.9%, to at or above 2.0%,” Reuters reported.
Analysts at BBH noted: “The updated macro forecasts will be key. Reports suggest the Bank of Japan will likely revise its core inflation forecasts upward at this meeting. The FY23 forecast will likely be closer to 3.0% vs. 2.5% seen in July, while the FY24 forecast will likely be 2.0% or more vs. 1.9% seen in July. The forecasts for FY24 and FY25 will be very important, as anything much above 2% would suggest the bank will likely start removing accommodation in early 2024.”
A potential upgrade to its inflation estimates would still allow the BoJ to stick to its ultra-loose monetary policy stance. However, it would also imply mounting pressure on the central bank to lift its yield cap beyond the current 1.0%.
That said, the BoJ could hold its horses as policymakers continue evaluating various factors to be under consideration when exiting ultra-loose policy while patiently waiting for a sustainable achievement of the target. According to a summary of opinions at the BoJ’s September meeting, one board member said the second half of the current fiscal year, ending in March 2024, will be an "important period" in determining whether the BoJ's price target will be achieved.
Economists surveyed by Reuters showed that nearly 80% of them expect the BoJ to abandon the 10-year yield control framework by the end of 2024. A majority of them predicted the central bank to end its negative interest rate policy (NIRP) next year.
USD/JPY levels to consider on BoJ policy announcements
If the Bank of Japan lifts the yield target or upgrades the inflation projections, it could signal that the central bank is preparing to shift the gear to a hawkish policy earlier than expected. In such a case, the Japanese Yen is likely to see a sharp buying wave, triggering a notable USD/JPY sell-off. Conversely, inaction by the BoJ on the policy and the outlook front will drive USD/JPY back toward last year’s FX intervention level of 151.96.
Dhwani Mehta, Asian Session Lead Analyst at FXStreet, offers a brief technical outlook for the major and explains: “The USD/JPY pair is clinging to the critical 21-day Simple Moving Average (SMA) at 149.52 in the lead-up to the BoJ decision. The 14-day Relative Strength Index (RSI) is holding comfortably above the 50 level, keeping the upside risks intact for the major.”
On the upside, the immediate resistance is seen at 150.42, Friday’s high, above which the previous week’s intervention level of 150.78 will be put to the test again. Alternatively, a sustained break of the 21-day SMA could trigger a fresh downswing toward the ascending 50-day SMA at 148.25. The last line of defense for buyers will be the 148.00 round figure,” Dhwani added.
Japanese Yen price this week
The table below shows the percentage change of Japanese Yen (JPY) against listed major currencies this week. Japanese Yen was the strongest against the Swiss Franc.
| USD | EUR | GBP | CAD | AUD | JPY | NZD | CHF | |
| USD | -0.08% | -0.05% | -0.09% | -0.37% | -0.07% | -0.39% | 0.09% | |
| EUR | 0.08% | 0.03% | -0.01% | -0.29% | 0.00% | -0.31% | 0.17% | |
| GBP | 0.05% | -0.04% | -0.08% | -0.34% | -0.03% | -0.36% | 0.14% | |
| CAD | 0.12% | 0.02% | 0.05% | -0.27% | 0.02% | -0.30% | 0.18% | |
| AUD | 0.39% | 0.33% | 0.34% | 0.26% | 0.34% | 0.00% | 0.50% | |
| JPY | 0.07% | -0.01% | 0.11% | -0.05% | -0.31% | -0.33% | 0.16% | |
| NZD | 0.40% | 0.30% | 0.32% | 0.28% | 0.00% | 0.30% | 0.47% | |
| CHF | -0.04% | -0.12% | -0.09% | -0.17% | -0.41% | -0.15% | -0.43% |
The heat map shows percentage changes of major currencies against each other. The base currency is picked from the left column, while the quote currency is picked from the top row. For example, if you pick the Euro from the left column and move along the horizontal line to the Japanese Yen, the percentage change displayed in the box will represent EUR (base)/JPY (quote).
Economic Indicator
Japan BoJ Interest Rate Decision
BoJ Interest Rate Decision is announced by the Bank of Japan. Generally, if the BoJ is hawkish about the inflationary outlook of the economy and rises the interest rates it is positive, or bullish, for the JPY. Likewise, if the BoJ has a dovish view on the Japanese economy and keeps the ongoing interest rate, or cuts the interest rate it is negative, or bearish.
Read more.Next release: 10/31/2023 03:00:00 GMT
Frequency: Irregular
Source: Bank of Japan
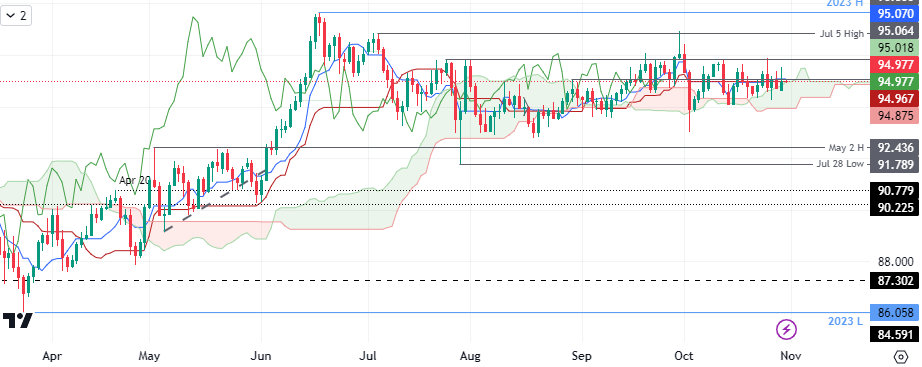
- AUD/JPY trades at 94.98, down 0.02%, after failing to sustain gains above 95.00.
- Daily chart shows potential for downside, with first support at October 30 low of 94.65.
- Resistance levels to watch include 95.00, current week's high at 95.52, and October 25 high at 95.89.
The AUD/JPY continues to consolidate at around 94.50/95.00 in early trading on Tuesday's Asian session after failing to stay above the 95.00 figure on Monday. The cross-pair printed decent gains of 0.32% yesterday, but as the Asian session starts, the pair exchanges hands at 94.98, down 0.02%.
The daily chart portrays the pair remaining sideways, about to drop inside the Ichimoku Cloud (Kumo), which could open the door for further downside. The AUD/JPY first support would be the October 30 low of 94.65, followed by the 94.00 figure. Once that level is cleared, the next stop would be the base of the Kumo at 93.96, followed by the October 3 low of 93.01.
On the flip side, the AUD/JPY first resistance would be the 95.00 figure, followed by the current week’s high at 95.52. A decisive break would expose the October 25 95.89 mark, ahead of 96.00.
AUD/JPY Price Analysis: Technical outlook
AUD/JPY Technical Levels
- AUD/USD oscillates around 0.6370 amid the weaker USD and risk-on mood.
- The upbeat Australia’s Retail Sales raise the odds for more rate hikes from the Reserve Bank of Australia (RBA).
- The Federal Reserve (Fed) said they would keep rates steady in November, but December will depend on data.
The AUD/USD pair consolidates its recent gains during the early Asian session on Tuesday. The pair hovers around 0.6370 after retracing from the previous day’s high of 0.6384. The upbeat Australian data and risk-on sentiment lend some support to the Australian Dollar (AUD) ahead of the highly-anticipated Federal Reserve (Fed) meeting on late Wednesday.
That being said, the better-than-expected Australia Retail Sales on Monday raise the odds for another rate hike from the Reserve Bank of Australia (RBA) in its upcoming meeting next week. The figures came in at 0.9% MoM versus 0.3% prior.
Furthermore, the pullback of the US Dollar (USD) acts as a tailwind for the pair. The US Dollar Index (DXY) loses traction to 106.13 while the US Treasury yields take a breather, with the 10-year yield standing at 4.88%
Apart from this, market players will keep an eye on China's PMI data due later in the Asian session on Tuesday. The nation’s Manufacturing PMI is expected to remain in expansionary territory by growing to 50.2. The Non-Manufacturing PMI is estimated to rise to 51.8. The stronger might alleviate concern about the sluggish economic condition in the world’s second economy and benefit the China-proxy Aussie.
On the USD’s front, the Fed affirmed that they would leave interest rates unchanged on Wednesday, but whether they will hold for December will depend on the incoming data. According to the CME Fedwatch tools, Markets currently priced in a 23% chance of the Fed hiking 25 basis points (bps) in the December meeting. On Monday, the US Dallas Fed Manufacturing Index dropped to -19.2 in October from 18.1 fall in the previous reading.
Looking ahead, Australia’s Private Sector Credit for September is due on Tuesday, followed by China’s PMI date. In the American session, US housing data and Consumer Confidence will be released. The attention will shift to the Fed policy meeting on Wednesday. Traders will take cues from the data and find trading opportunities around the AUD/USD pair.
- The AUD/NZD is middling for Monday after a failed run towards 1.0930.
- The Aussie has gained significantly against the Kiwi for October.
- Despite gains, AUD momentum appears to be draining.
The AUD/NZD has been trending higher, with the Aussie (AUD) tapping into Friday's high for October at 1.0930, but bullish momentum is draining out of the pair for the time being.
On the hourly candlesticks, the pair is knocking back into the 50-hour Simple Moving Average (SMA) technical barrier, with near-term support sitting at 1.0860 near the 200-hour SMA.
Intraday action is threatening to tip back over into the weekly P0 pivot point currently marked in near 1.0890, with P1 sitting at 1.0850 down below and bullish continuations set to run into R1 just beyond 1.0950.
On the daily candlesticks, the AUD/NZD pair is flashing significant signs of overextension. The Relative Strength Index (RSI) and Moving Average Convergence-Divergence (MACD) indicators are both pushing firmly into overbought territory, though MCAD traders will want to wait for a bearish rollover of the fast MACD line to signal new bearish momentum.
Long-term directional bias has drifted firmly into the midrange, with the 200-day SMA flat near 1.0820, and a downside move will see a firming up of short momentum back into the monthly P0 pivot just below the 1.0800 handle.
Downside moves are likely to be capped by the R1 pivot at 1.0660, with October's low bids near 1.0640.
AUD/NZD Hourly Chart

AUD/NZD Daily Chart

AUD/NZD Technical Levels
- EUR/JPY trades near the top of the Ichimoku Cloud, with first support at 158.00.
- German GDP contracts less than expected, while inflation dips sharply.
- Potential tweaks in BoJ's Yield Curve Control could impact the pair's future trajectory.
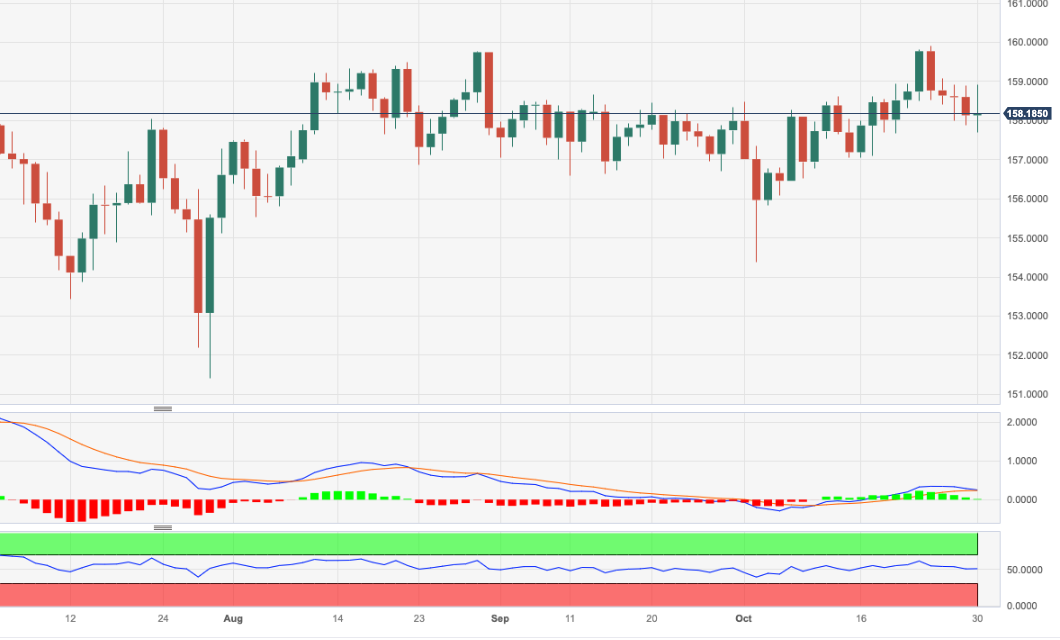
EUR/JPY clings to Monday’s gains on Tuesday, in the early Asian session, following Monday’s session, which witnessed the pair reaching a daily high shy of the 159.00 figure, to witness the pair closing at around current exchange rates. At the time of writing, the EUR/JPY is trading at 158.26.
EUR/JPY Fundamental summary
The Eurozone (EU) economic docket witnessed that inflation in Germany dipped sharply, suggesting the latest European Central Bank (ECB) decision of holding rates could be the first pause of many, with the economies across the bloc stagnating. In that regard, Germany’s GDP for Q3 contracted less than expected but printed a negative reading.
On the Japanese Yen (JPY) front, a news piece by Nikkei reported the Bank of Japan (BoJ) could likely tweak its Yield Curve Control (YCC). Consequently, market participants bought the Yen in anticipation of Today’s BoJ monetary policy decision.
EUR/JPY Price Analysis: Technical outlook
The daily chart portrays the pair trading near the top of the Ichimoku Cloud (Kumo) after buyers failed to reclaim the Tenkan-Sen at 158.79. A breach of that exacerbated the EUR/JPY’s fall to the current week’s low of 157.69, which lies inside the Kumo. The EUR/JPY first support would be 158.00, followed by the 157.69. Once cleared, up next would be the Kijun-Sen at 157.12, ahead of 157.00, before prices tumble to the base of the Kumo at 155.61. Conversely, if buyers stepped in, the Tenkan Sen would first resist, followed by the 159.00 figure.
EUR/JPY Price Action – Daily chart

- The NZD/USD is seeing a rebound amidst a broad-market US Dollar selloff.
- Market risk appetite saw a resurgence on Monday.
- Early Tuesday sees China data, which could bolster Antipodeans.
The NZD/USD is seeing its best trading day in a month, climbing from an eleven-month low into 0.5850 for Monday.
Late Tuesday sees New Zealand unemployment rate, followed by a speech from Reserve Bank of New Zealand (RBNZ) Governor Adrian Orr.
Before that, China's October Manufacturing Purchasing Managers' Index (PMI) is expected to print in expansion territory for the second month in a row, forecast to come in at 50.2. The Non-Manufacturing sector PMI is likewise expected to improve from 51.7 to 51.8.
On the Greenback side, USD traders will be looking ahead to the midweek's Federal Reserve (Fed) rate call.
NZD/USD Technical Outlook
The Kiwi's Monday lift into 0.5850 still sees the NZD/USD woefully beaten into bear country on the daily candlesticks, with the pair trading well lower against the last swing high into 0.6050, with prices continuing to decline against the 50-day Simple Moving Average (SMA) currently declining towards 0.5900.
Long-term, the 200-day SMA is turning increasingly bearish, accelerating into chart territory south of 0.6150, and a downside continuation for the Kiwi will see the pair setting new lows for the year and testing bids not seen since October of 2022.
NZD/USD Daily Chart

NZD/USD Technical Levels
- NZD/JPY bottomed at a low of 86.809 and then closed at 87.095.
- Bears seem to be taking a break, but indicators on the daily chart remain in negative territory.
- The 200-day SMA is the last support for the cross.
In Monday's session, the NZD/JPY closed with gains above the 87.000 level, but indicators on the daily chart suggest that the bears still have the upperhand.
In line with that, a neutral to bearish technical stance is seen for the cross in the daily chart, with the bears seeming to have taken a break after pushing down the pair by nearly 2.75% during October. The Relative Strength Index (RSI) lies flat in negative territory, while the Moving Average Convergence (MACD) displays flat red bars. That being said, the cross is still above the 200-day Simple Moving Average (SMA), suggesting that despite the recent bearish sentiment,the bulls are still resilient, holding some momentum and that sellers must increase their efforts to confirm a bearish short-term trend.
The same tendency is seen in the four-hour chart, which indicators lying flat in negative territory but with a clear downwards trend in the last sessions.
Support levels: 87.000, 86.505, 86.300.
Resistance levels: 87.620 (100-day SMA), 87.805, 88.110 (20-day SMA).
NZD/JPY Daily Chart
-638342985234680941.png)
- Gold price falls to $1997.60, down 0.42%, after reaching a daily high of $2006.77.
- Geopolitical risks, particularly the Middle East conflict, continue to drive gold prices.
- Analyst Jim Wyckoff remains bullish on gold, citing potential for worsening conflict and new all-time highs.
Gold price (XAU/USD) fell below the $2000 mark late in the New York session, registering losses of 0.42% as market participants trimmed some of last Friday’s gains amid fears the conflict in the Middle East could spread in the region. XAU/USD is trading at $1997.60 after hitting a daily high of $2006.77.
XAU/USD registers losses as market participants trim gains amid shifting geopolitical risks
Geopolitical risks continue to be the main driver of Gold prices. Last Friday’s jump above the $2000.00 mark was sponsored by Israel launching its ground offensive against Hamas as it entered the Gaza Strip. Consequently, traders seeking safety witnessed a flight to safe-haven assets as XAU/USD rallied from $1980.00 to $2000.00.
Given that the Israel offensive hasn’t been as strong as expected, woes faded as Gold prices dipped below the $2000 mark. Despite all that, Jim Wyckoff, analyst at Kitco, noted that “the Middle East conflict is keeping a floor under gold and silver markets. I remain bullish on gold, the conflict will get worse before it gets better, gold can hit all-time high in the near term.”
US Treasury bond yields had continued to rise as the US bond sell-off extended. The US 10-year benchmark note rate is 4.88%, up five basis points, a headwind for XAU/USD prices. In the meantime, the Greenback remains weak, even though US Treasury bond yields climbed, as the US Dollar Index lost 0.42% and sits at 106.13.
Market participants' focus shifted to the US Federal Reserve’s (Fed) monetary policy. Powell and Co. are expected to hold rates unchanged but would likely keep their options open for higher interest rates. Any dovish tilts could underpin XAU/USD prices toward higher levels.
XAU/USD Price Analysis: Technical outlook
Gold price remains upward biased but at the brisk of consolidating at around the $1990-$2000 area. A daily close below the October 20 high of $1997.16 could pave the way for testing the $1990 mark. Once cleared, XAU/USD could extend its fall toward the October 24 swing low of $1953.69. Conversely, a bullish continuation is seen above $2000, with the first resistance emerging at $2009.42, followed by $2050.
In his opening statement before the House of Commons Standing Committee on Finance, Tiff Macklem, Governor of the Bank of Canada said that they are prepared to raise interest rates further if inflationary pressures persist. Last week, the BoC kept interest rates unchanged. Macklem will answer questions from lawmakers.
Key takeaways from the speech:
With the economy expected to move into excess supply this year and with growth anticipated to be weak for the next few quarters, we think there’s more inflation relief in the pipeline. We expect inflation in Canada to ease gradually and return to our 2% target in 2025. But we’re worried that higher energy prices and persistence in underlying inflation are slowing progress.
Inflationary risks have increased since July
With clearer evidence that monetary policy is working, my colleagues on the Bank’s Governing Council and I judged last week that we could be patient and hold the policy rate at 5%. However, to be confident that our policy rate is high enough to get inflation back to 2%, we need to see more easing in our measures of core inflation.
We will continue to assess whether monetary policy is sufficiently restrictive to restore price stability, and we will monitor risks closely.
Our decision last week reflected our best efforts to balance the risks of over- and under-tightening. We don’t want to cool the economy more than necessary.
If inflationary pressures persist, we are prepared to raise our policy rate further to restore price stability.
Market reaction:
The USD/CAD held steady, trading near daily lows around 1.3820, holding firm onto daily losses. The pair is pulling back from one-year highs, primarily driven by a weaker US Dollar.
The key event during the Asian session will be the monetary policy decision from the Bank of Japan. Japan will also release Industrial Production, Unemployment Rate, and Retail Trade data. The New Zealand ANZ Business Confidence report is due, as well as Australia's Private Sector Credit. Chinese NBS PMI figures are scheduled for release. Later in the day, Eurostat will release preliminary inflation data for October. The FOMC meeting kicks off.
Here is what you need to know on Tuesday, October 31:
A busy Tuesday lies ahead in the middle of a loaded week with central bank meetings and key economic data. Risk appetite boosted Wall Street on Monday, with the main stock indices holding onto gains of more than 1%.
The risk-on sentiment weighed on the US Dollar, leading to a pullback. The US Dollar Index fell 0.45% to 106.10, experiencing its worst day in a week. US Treasury yields made no significant moves, with the 10-year yield hovering around 4.86%.
The FOMC meeting kicks off on Tuesday. The Federal Reserve (Fed) is expected to keep interest rates unchanged despite robust US economic data and inflation remaining above target. Rates have risen significantly in recent months, and the upward pressure on long-term Treasury yields has contributed to a tightening monetary policy stance. The debate now centres around how long the Fed will need to maintain higher interest rates.
On Tuesday, the US Q3 Employment Cost Index is due. On Wednesday, will be the ADP private employment and on Friday Nonfarm Payrolls. Eurostat will release the Eurozone Harmonized Index of Consumer Prices and Q3 Gross Domestic Product. The data bodes well after Germany reported a decline in the annual inflation rate from 4.5% to 3.8%, which is below the market consensus of 4%. Regarding GDP, it contracted by 0.1%, which was better than the market consensus contraction of 0.3% (Q2). More data from Germany is due on Tuesday with Retail Sales.
EUR/USD has risen above 1.0600 and is approaching the resistance area around 1.0630. The pair maintains a modest bullish tone. EUR/GBP posted its highest daily close since May, trading above 0.8700.
The Bank of England (BoE) will announce its decision on Thursday, and markets anticipate another dovish hold. Such expectations have weighed on the British pound. GBP/USD rose on Monday, supported by a weaker US Dollar, moving away from the monthly lows and inching towards the 20-day Simple Moving Average (SMA), which is currently at 1.2170.
The Japanese Yen strengthened across the board after Nikkei reported that the Bank of Japan (BoJ) may allow long-term yields to rise above 1%. USD/JPY dropped below 149.00 and then stabilized around that level. It appears vulnerable in the near term.
The BoJ will announce its decision on Tuesday. Some analysts consider that the central bank will adjust its Yield Curve Control policy by allowing the 10-year bond yield to rise to 1.5%, up from the current level of 1%. Market participants will also closely watch for any updates on the macroeconomic forecast provided by the BoJ. In terms of economic data, Japan is set to release Industrial Production, Unemployment Rate, and Trade data on Tuesday.
BoJ Preview: Forecasts from 10 major banks, no change to policy, another tweak to YCC?
China's Manufacturing PMI for October will be released on Tuesday, and it is expected to remain in expansionary territory for the second consecutive month at a reading of 50.2. The Non-Manufacturing PMI is expected to show a modest improvement, rising from 51.7 to 51.8.
The Australian Dollar (AUD) continues to perform well, supported by positive Australian data. On Monday, retail sales for September exceeded expectations, adding to the argument for another rate hike from the Reserve Bank of Australia (RBA) next week. Private sector credit data is scheduled to be released on Tuesday. AUD/USD has risen for the third consecutive day, approaching the crucial 0.6400 area. AUD/NZD reached 1.0929, its highest level since June.
NZD/USD had its best day in weeks, rising by less than 50 pips. The pair climbed from 0.5800 to the 0.5850 area. The overall trend is down, but it appears to be consolidating. The ANZ Business Confidence survey is due on Tuesday, followed by the New Zealand employment report on Wednesday.
Gold retreated after surging on Friday and is trading slightly below $2,000. It has been unable to benefit from Monday's steady yields and risk appetite. Silver initially surged towards October highs but later trimmed its gains, settling at $23.30.
Like this article? Help us with some feedback by answering this survey:
- USD/NOK is down for a third consecutive day, trading at 11.142
- Ahead of the Fed's decision on Wednesday, the US fell to a six-day low.
- The Norges Bank announces its decision on Thursday and is expected to hold rates steady at 4.25%.
- The US will report key labour market data on Thursday and Friday.
In Monday's session, the USD/NOK is down, driven by a broad US Dollar (USD) weakness, which falls on the back of a positive market environment and investors taking profits after last week's gains. Focus now shifts to the Federal Reserve (Fed) Interest Rate Decision on Wednesday and Nonfarm Payrolls on Friday, which would set the pair's pace in the upcoming sessions. On the NOK's side, the Norges Bank meeting ends on Thursday with no rate hikes priced in
Recently, the USD strengthened over the NOK mainly due to rising US Treasury yields and strong economic reports, including a preliminary estimate of the US Q3 preliminary estimate of the Gross Domestic Product (GDP) which grew at an annualised rate of more than 4%. Nevertheless, the prospects of a 25 basis point increase in December, according to the CME FedWatch tool, continue to be low, potentially tempering any considerable advancement for the USD. For Wednesday's meeting, a pause is largely priced in, but Chair Powell's tone will be closely looked upon for investors to continue modelling their expectations.
Furthermore, the US will report October's Nonfarm Payrolls, an important labour market indicator closely monitored by the Fed, which could also impact the pair's price dynamics.
On the other hand, investors will monitor the Norges Bank's stance on Thursday. In September, Governor Bache stated that "There will likely be an additional hike in December" so in case the bank gives more clues on their plans for the December meeting, the NOK's could gain further ground over the US Dollar.
USD/NOK Levels to watch
Evaluating the daily chart, signs of bullish exhaustion for USD/NOK are observed, contributing to a neutral to bearish technical stance. The Relative Strength Index (RSI) displays a negative slope in the bullish territory, hinting at a potential shift in momentum, while the Moving Average Convergence (MACD) prints shorter green bars.
Support levels: 11.100, 11.083, 11.023 (20-day SMA),
Resistance levels: 11.200, 11.235, 11.276.
USD/NOK Daily Chart
-638342899311583340.png)
- The GBP/USD is seeing a bounce as the US Dollar eases back ahead of mid-week Fed.
- UK data continues to miss the mark as BoE looms ahead for Thursday.
- Traders to keep an eye out with another NFP Friday over the horizon.
The GBP/USD is finding some bids for Monday, rebounding from the day's early lows just south of the 1.2100 handle, and the Pound Sterling has a target set on 1.2200 ahead of the Federal Reserve's (Fed) Wednesday rate call. The Fed will beat the Bank of England (BoE) to the punch on central bank action this week, with the BoE slated for the day after.
Both central banks are expected to keep rates steady this week, especially with another round of US Non-Farm Payrolls on the docket for Friday, but investors are approaching both monetary policy institutions with very different attitudes.
Market to punish GBP on impression that BoE is not doing enough – Commerzbank
Concerns continue to mount that the UK's central bank is risking too little movement, exposing the British economy to further inflation despite a lagging economy set to tip even further into the downside if rates go up any higher.
On the US side, investors are all but hoping and pleading for the Fed to get pushed into a rate cut cycle sooner rather than later, but a firm economy and limited downside sees the Fed set to hold rates higher for longer.
GBP/USD Technical Outlook
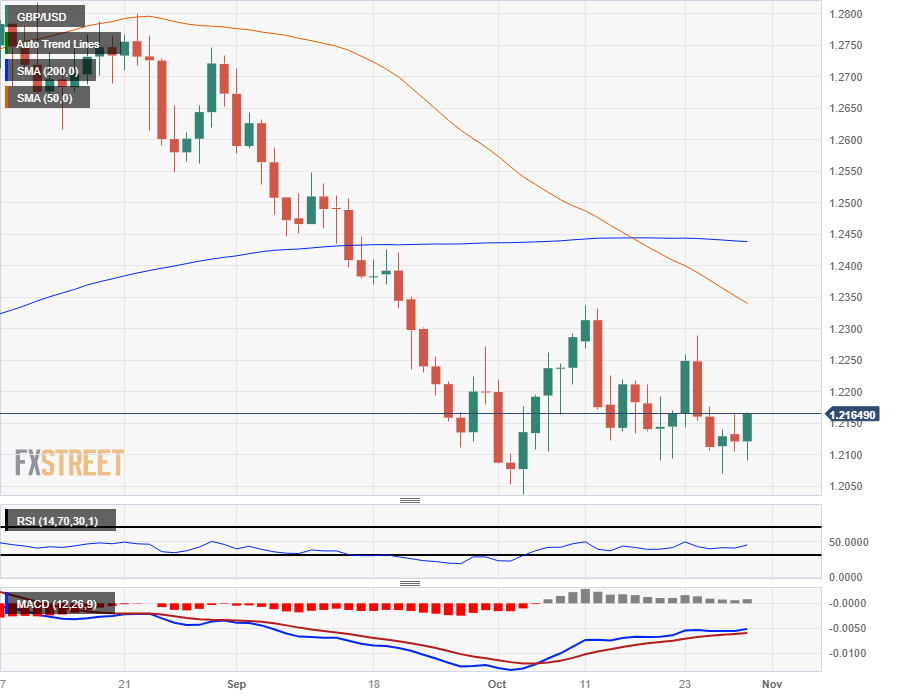
The Pound Sterling is bidding up on Monday climbing over 0.6% from the day's early-week lows below 1.2100, and the pair is set for a re-challenge of 1.2200 as long as GBP bidders can hang onto the near-term uptrend.
The Price floor for the GBP/USD sits nearby at eight-month lows near 1.2037, while technical resistance sits at the last swing low near 1.2300.
The 50-day Simple Moving Average (SMA) is dipping into the 1.2350 region, while the 200-day SMA is capping off long-term upside from 1.2450.
GBP/USD Daily Chart
GBP/USD Technical Levels
- The AUD/USD is trading near 0.6375, trading into the top side for Monday.
- US Dollar bidding pressure is easing back as investors brace for Fed rate call in the mid-week.
- Aussie Retail Sales beat expectations, giving a much-needed boost for the AUD.
The AUD/USD is trading upwards for Monday, looking for an extended bid into the 0.6380 level after the Aussie (AUD) caught some bidding momentum after Australian Retail Sales beat expectations, helping the Aussie capitalize on a Greenback (USD) that is treading water ahead of the Federal Reserve's (Fed) upcoming rate call on Wednesday.
Australian Retail Sales for September came in at a forecast-thumping 0.9%, well above the expected 0.3% and seeing a significant jump from August's reading of 03%, which was revised upwards from 0.2%.
Australia’s Retail Sales jump 0.9% MoM in September vs. 0.3% expected
On the US side, investors are awaiting the latest showing from the Federal Reserve (Fed) due to come in for a landing on Wednesday, and investors will be keeping their heads down ahead of the US central bank showing.
Fed: Rate hike in December on the table if data point to renewed strong growth in Q4 – Commerzbank
Investors are looking ahead to a potential rate hike from the Fed in December to close out 2023, as US data continues to show a firming-up economy in the face of restrictive monetary policy, and investors are facing down the odds of a rate cut cycle not materializing even further into the future than previously expected.
AUD/USD Technical Outlook
Monday's rebound continuation for the AUD/USD sees the pair set for a challenge of the 0.6400 handle in the near-term, with technical resistance building into the level from the 50-day Simple Moving Average (SMA).
The Aussie settled into a twelve-month low last week, tapping 0.6270 before getting pushed back into recent consolidation.
Aussie bulls will be looking for a chance to push the AUD/USD back into the topside of recent swing highs which built up a resistance zone from 0.6450 to 0.6500.
AUD/USD Daily Chart

AUD/USD Technical Levels
- USD/CHF up 0.07%, trading around 0.9015, after breaching 200-DMA at 0.9005.
- Wall Street gains and falling commodity prices indicate a shift towards riskier assets.
- Key levels to watch are October 3, high at 0.9245, and August 30, low at 0.8744.
USD/CHF prolongs its gains to five consecutive days, breaching the 200-day moving average (DMA) at 0.9005, with buyers maintaining the pair in positive territory, up 0.07%, hovering around the 0.9015 area.
Wall Street trades with gains, with traders unfazed by the Middle East conflict. In fact, falling commodity prices are seen as a sign that market players are looking toward riskier assets, a headwind for the safe-haven status of the Swissie.
Aside from this, the USD/CHF daily chart portrays the pair as neutral to upward biased but shy of breaking the latest cycle high reached on October 3, at 0.9245. If buyers lift the exchange rates past the latter, the uptrend would likely extend toward the March 2 daily high at 0.9440.
On the other hand, if USD/CHF sellers moved in and dragged the spot price below 0.9000, they could push the pair toward the October 24 low of 0.8887 before falling to the August 30 pivot low of 0.8744.
USD/CHF Price Action – Daily chart

USD/CHF Technical Levels
- WTI trades at $82.49 per barrel, down 3.16%, as traders dismiss fears of Middle East conflict escalation.
- Prices fail to break 50-day moving average at $86.38 despite ongoing Israeli offensive in Gaza.
- Upcoming US Federal Reserve meeting, Apple's earnings, and China's PMI data to influence oil prices.
West Texas Intermediate (WTI) dropped more than 3% amid the North American session amid a risk-on impulse, with traders shrugging off fears the Middle East conflict would escalate further. That, alongside the looming US Federal Reserve monetary policy meeting, boosted the Greenback, as WTI exchanges hands at $82.49 per barrel, down 3.16%.
Oil prices decline amid easing Middle East conflict fears and anticipation of Fed meeting
Last Friday’s news that Israel began its ground offensive in Gaza stoked worries the conflict could expand in the region, which concentrates a third of Oil global output. Nevertheless, of late, it has failed, as seen by WTI prices failing to crack the 50-day moving average (DMA) at 86.38.
Even though Israel's offensive continues, it has not been as strong as initially expected by market participants. Sources cited by Reuters commented that the “war premium has come out of the market” as the conflict remains contained.
Aside from this, market participants' focus shifts to the Fed’s decision. The US central bank is expected to keep rates unchanged. Besides that, market players are eyeing Apple’s earnings to gather signs of a probable economic slowdown.
China’s data would also influence Oil prices, as it is one of the largest importers. The economic docket would feature Manufacturing and Services PMIs, with Oil speculators looking for clues of stabilization in its economy.
WTI Price Analysis: Technical outlook
The daily chart portrays the US Crude Oil as neutral to upward biased, likely to find support at the October 6 low of $81.56, ahead of sliding past the bottom Bollinger’s band. If WTI stays above $82.00, the next resistance that it would face would be the 20-da cy moving average (DMA) at $85.61, followed by the 50-DMA at $86.38. Conversely, if WTI dives below $81.00, that next support would be the August 24 low of $77.64.
- EUR/GBP rose to a high around 0.8740, it highest level since May.
- German CPI from October came in lower than expected at 3.8% YoY; Q3 GDP preliminary estimates beat expectations.
- All eyes are on Thursday's BoE meeting; no rate hikes are priced in.
At the beginning of the week, the EUR/GBP cross gathered momentum and jumped to its highest level since early May, near 0.8740. On the one hand, the Euro seems to be getting traction after the report of better-than-expected Gross Domestic Product (GDP) while soft inflation figures from October failed to trigger a reaction. On the other hand, investors await the Bank of England (BoE) decision on Thursday.
Investors assess German data after ECB's decision
Germany reported that the Consumer Price Index (CPI) from October declined to 3.8% YoY, lower than the 4% expected and the last figure of 4.5%. In addition, the Gross Domestic Product (GDP) preliminary estimates from Q3 saw the German economy contracting at an annualised rate of 0.3% while the markets expected a 0.7% contraction. It is worth noticing that the European Central Bank (ECB) and Christine Lagarde highlighted the economic challenges the Eurozone is facing so the Euro may get further traction if economic reports come in better than expected. Regarding the following ECB decisions, the bank has not hinted at any hikes, and Lagarde pointed at that rates will be kept at restrictive levels as long as necessary to combat inflation.
On the GBP's side, markets are discounting that the Bank of England will hold rates steady at 5.25% in Thursday's decision. In addition, the Monetary Policy Committee (MPC) vote split and Andrew Bailey's words will be closely looked by investors in order to continue placing their bets for the next meeting. Furthermore, the bank will release fresh macroeconomic forecasts, which will also be important as the British economy has faced also challenges, and the bank's outlook may further impact the Pound.
EUR/GBP Levels to watch
Upon observing the daily chart, the outlook remains neutral to bullish as the bulls are gaining momentum, but they still need to conquer more ground to confirm a recovery for the short term. The Relative Strength Index (RSI) demonstrates a favourable upward trend above its midline, while the Moving Average Convergence (MACD) displays green bars. On the other hand, the pair is above the 20,100,200-day Simple Moving Average (SMA), pointing towards the prevailing strength of the bulls in the larger context.
Support levels: 0.8695 (200-day SMA), 0.8675 (20-day SMA), 0.8650.
Resistance levels: 0.8740, 0.8750, 0.8800.
EUR/GBP Daily Chart
-638342839426285950.png)
- The GBP/JPY is seeing further downside on Monday, sliding from 182.00.
- Yen continuing to firm up heading into Tuesday's BoJ showing.
- Low-impact UK data came in broadly red for Monday, one last bad print before Thursday's BoE.
The GBP/JPY is trading down into 181.00, with further declines on the cards back into the 180.00 handle if Pound Sterling (GBP) traders can't find a reason to hit the buy button this week.
The Yen (JPY) continues to see a steady recovery across the broader market, taking the Guppy down 1.5% from last week's peak of 183.75.
After getting hammered for most of 2023, the JPY has been seeing a resurgence of late; the GBP/JPY is down over 3% from August's high of 186.77, an eight-year high for the pair.
Early Tuesday brings a smattering of Japanese economic data, including Retail Sales and the Japanese Unemployment Rate, but barring any significant deviations from the forecast figures, investors will be focusing on the Bank of Japan's (BoJ) interest rate call.
BoJ Preview: Three scenarios and their implications for USD/JPY – TDS
The BoJ is broadly expected to hold steady on their negative rate regime of -0.1%, but investors are beginning to gesture towards the need for changes in the Japanese central bank's policy framework as inflation continues to hold higher for longer than initially expected.
On the Pound Sterling side, GBP traders will be looking ahead to Thursday's Bank of England (BoE) rate call, with the UK's central bank nearly guaranteed to hold rates at 5.25% as economic data for the UK continues to miss the mark.
GBP/JPY Technical Outlook
The Guppy is falling back into the 181.00 handle for Monday after failing to etch in a rebound into 182.00.
The way is clear for further downside into 180.00, with the last few extreme swing lows marking in a potential resistance zone from 178.00 to 176.00, and the near-term ceiling sits at the last swing highs into 184.00, just above the 50-day Simple Moving Average (SMA).
On the down side, an extended bear run will see the GBP/JPY pair falling into the 200-day SMA which is currently rising above the 174.00.
GBP/JPY Daily Chart

GBP/JPY Technical Levels
- Canadian Dollar flows try to stage a rebound after last week’s declines.
- Bank of Canada Governor Tiff Macklem hits newswires later on Monday.
- Weaker bids on Crude Oil limits CAD upside.
The Canadian Dollar (CAD) is hunting for some green territory against the US Dollar USD to kick off the new trading week. The Loonie’s topside remains limited as Crude Oil prices fall back, limiting momentum in the Oil-dependent CAD.
Bank of Canada (BoC) Governor Tiff Macklem will testify before the Canadian federal government’s Standing Senate Committee on Finance later today. The BoC head is expected to land hawkish, while also awaiting “clear evidence” that inflation in Canada will return to the BoC’s target level of 2%.
Daily Digest Market Movers: Canadian Dollar attempts to stage Monday recovery
- The CAD is trying to claw back chart paper after dipping into a new eight-month low last week.
- BoC’s Governor Macklem to testify before the federal financial oversight committee today.
- Round 2 of Governor Macklem’s testimony is slated for Wednesday.
- Governor Macklem broadly expected to shy away from direct questions about rate cuts and defend the BoC’s tightening stance.
- Despite weakening economic data, inflation risks remain elevated for Canada.
- Macklem expected to reiterate that the BoC does not see a recession coming, despite the path to a soft landing having narrowed recently.
- Crude Oil prices look soft for Monday as geopolitical tensions from the Gaza Strip conflict remain contained in the region.
- WTI Crude Oil bids are down around 3% for the day.
- Weakening barrel bids are limiting CAD upside.
- Loonie traders will want to keep an eye out for Canadian Gross Domestic Product (GDP) figures on Tuesday.
Technical Analysis: Canadian Dollar trying to extend a rebound over 1.2850 against the US Dollar
The Canadian Dollar (CAD) is catching a relief bid from last Friday’s eight-month low against the US Dollar (USD), sending the USD/CAD pair back below 1.3850 after tapping 1.3880 late last week.
An extended recovery in the Loonie from here will see 1.3850 firming up into a significant technical resistance level moving forward. On the top side, a bullish break will see the USD/CAD set to challenge 2022’s high of 1.3978 set over one year ago, back in mid-October of last year.
In the meantime, a downside continuation will run into technical support from the 50-day Simple Moving Average (SMA), which is currently lifting north of the 1.3600 handle, with the last swing low pricing in an interim floor from 1.3569.
Long-term support sits at the 200-day SMA currently parked just below 1.3500.
USD/CAD Daily Chart

Canadian Dollar FAQs
What key factors drive the Canadian Dollar?
The key factors driving the Canadian Dollar (CAD) are the level of interest rates set by the Bank of Canada (BoC), the price of Oil, Canada’s largest export, the health of its economy, inflation and the Trade Balance, which is the difference between the value of Canada’s exports versus its imports. Other factors include market sentiment – whether investors are taking on more risky assets (risk-on) or seeking safe-havens (risk-off) – with risk-on being CAD-positive. As its largest trading partner, the health of the US economy is also a key factor influencing the Canadian Dollar.
How do the decisions of the Bank of Canada impact the Canadian Dollar?
The Bank of Canada (BoC) has a significant influence on the Canadian Dollar by setting the level of interest rates that banks can lend to one another. This influences the level of interest rates for everyone. The main goal of the BoC is to maintain inflation at 1-3% by adjusting interest rates up or down. Relatively higher interest rates tend to be positive for the CAD. The Bank of Canada can also use quantitative easing and tightening to influence credit conditions, with the former CAD-negative and the latter CAD-positive.
How does the price of Oil impact the Canadian Dollar?
The price of Oil is a key factor impacting the value of the Canadian Dollar. Petroleum is Canada’s biggest export, so Oil price tends to have an immediate impact on the CAD value. Generally, if Oil price rises CAD also goes up, as aggregate demand for the currency increases. The opposite is the case if the price of Oil falls. Higher Oil prices also tend to result in a greater likelihood of a positive Trade Balance, which is also supportive of the CAD.
How does inflation data impact the value of the Canadian Dollar?
While inflation had always traditionally been thought of as a negative factor for a currency since it lowers the value of money, the opposite has actually been the case in modern times with the relaxation of cross-border capital controls. Higher inflation tends to lead central banks to put up interest rates which attracts more capital inflows from global investors seeking a lucrative place to keep their money. This increases demand for the local currency, which in Canada’s case is the Canadian Dollar.
How does economic data influence the value of the Canadian Dollar?
Macroeconomic data releases gauge the health of the economy and can have an impact on the Canadian Dollar. Indicators such as GDP, Manufacturing and Services PMIs, employment, and consumer sentiment surveys can all influence the direction of the CAD. A strong economy is good for the Canadian Dollar. Not only does it attract more foreign investment but it may encourage the Bank of Canada to put up interest rates, leading to a stronger currency. If economic data is weak, however, the CAD is likely to fall.
- EUR/USD reaches new four-day high of 1.0625, bouncing from lows of 1.0547.
- German inflation eases from 4.3% to 3%, below forecasts, while GDP contracts less than expected.
- Upcoming economic releases from Eurozone and US to provide further direction for the pair.
EUR/USD rises sharply during the North American session, reaching a new four-day high of 1.0625 as the Greenback (USD) remains defensive amid an improvement in risk appetite. The pair bounced off from daily lows of 1.0547, hit in the European session.
Pair bounces off daily lows, bolstered by easing German inflation and soft US Dollar
Economic data revealed in Germany that inflation is easing, as the Harmonized Indices of Consumer Prices (HICP) dropped in October from 4.3% to 3%, below forecasts of 3.3%. the news is welcomed by the European Central Bank (ECB), which halted its tightening cycle last Thursday, keeping interest rates unchanged, and shifted data dependent, according to ECB’s President Christine Lagarde.
However, the Gross Domestic Product (GDP) in Germany for Q3 was -0.1% QoQ, above forecasts of -0.3%, while annually based stood at -0.3%, less than the -0.7% contraction.
Despite that, the EUR/USD has resumed its upward trajectory, above 1.0600, bolstered by a soft US Dollar (USD), as shown by the US Dollar Index down 0.35%, at 106.21.
Across the pond, the US economic docket featured the Dallas Fed Manufacturing Index, which plummeted more than the previous month's reading, coming at -19.2 in October, below -18.1 in September. Although the data was negative, the EUR/USD barely flicked, with traders bracing for Tuesday’s data.
The Eurozone (EU) calendar will feature France and Italy’s GDP, Germany's Retail Sales, and the EU inflation data. On the US front, the docket would feature the Employment Cost Index, the Chicago PMI and the Conference Board (CB) Consumer Confidence.
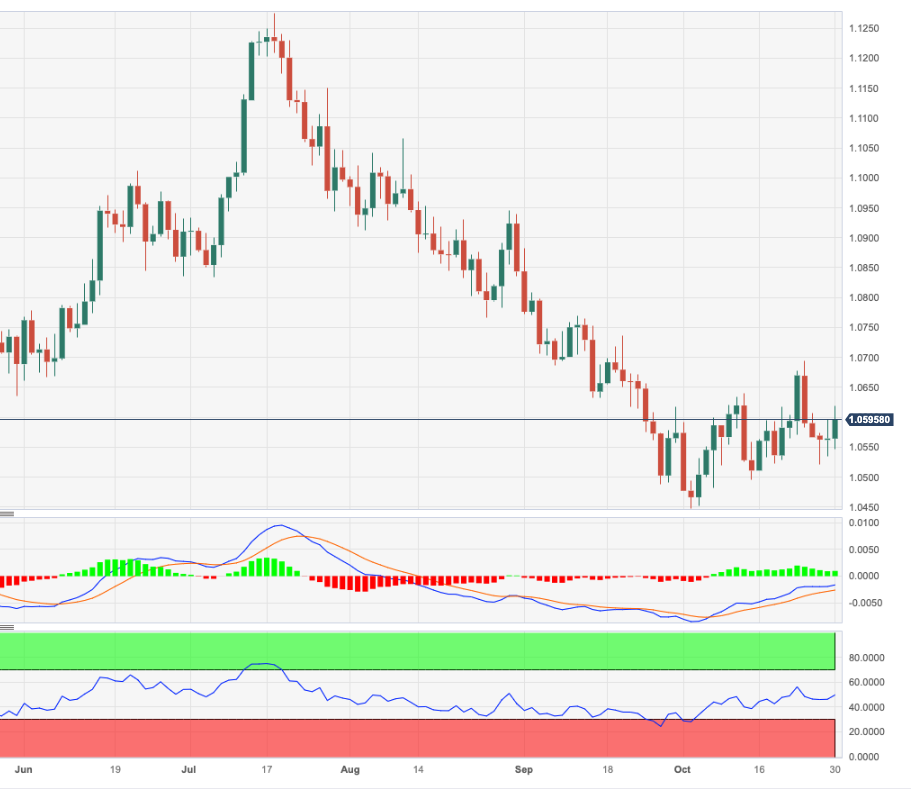
EUR/USD Price Analysis: Technical outlook
The EUR/USD downtrend remains intact, as the daily chart is forming a bearish flag, though the ongoing upward correction could witness the pair testing the 50-day moving average (DMA) at 1.0653, which, once broken, could open the door to challenge 1.0700. On the other hand, if sellers keep the exchange rates below the former, the pair could dip to 1.0600 before slumping towards 1.0550, the bottom of the bearish flag.
- The US Dollar, measured by the DXY index, slides towards 106.00.
- US Treasury yields are increasing and may limit the USD’s losses.
- Markets have practically priced in a pause in the Fed’s meeting on Wednesday.
- Nonfarm Payrolls data from October are due on Friday.
The US Dollar (USD) experienced a decline in Monday's session towards 106.00 when gauged by the DXY Index, which measures the value of the USD against a basket of global currencies. The weakening of the USD was driven by risk-on flows, making it struggle to gather demand. As the economic calendar had nothing major to offer on Monday, investors’ focus shifts to the highlights for the rest of the week, including the Federal Reserve (Fed) Interest Rate Decision on Wednesday and Nonfarm Payrolls data on Friday. Both events have the potential to further impact the USD price dynamics.
The US economy is holding strong, helping the USD to find additional demand in the last few sessions. Despite this, the possibility of a 25 basis point hike in December, as shown by data from the CME Group FedWatch tool, continues to be low and hinders any substantial strengthening of the USD. Before at Wednesday's meeting, a pause is primarily priced in, but investors will closely look upon Fed Chair Jerome Powell’s stance and outlook to continue placing their bets on the Fed’s next decisions.
Daily Digest Market Movers: US Dollar slides ahead of Fed decision, labor market data
- The USD DXY Index plunged to 106.10, down by 0.40% on the day.
- The US Dollar struggles to hold the traction gained last week as buyers are taking profits.
- Investors continue assessing high-tier economic reports released last week ahead of the Fed’s decision on Wednesday.
- On Friday, the US Bureau of Economic Analysis reported that the Personal Consumption Expenditures (PCE) Price Index from September matched expectations. It came in at 3.4% YoY as expected, and aligned with its previous reading of 3.4%. The Core PCE declined to 3.7% YoY.
- On Thursday, data from the US Bureau of Economic Analysis showed that the Gross Domestic Product (GDP) preliminary estimates from Q3 exceeded expectations. The headline figure showed an annualised growth rate of 4.9%, beating the consensus of 4.2% and accelerating from the 2.1% growth seen in Q2.
- In the meantime, US Treasury yields are edging higher. The 2-year rate rose to 5.05%, while the longer-term 5 and 10-year rates advanced towards 4.83% and 4.91%, respectively. This may limit the Greenback’s losses.
- Ahead of the Fed’s decision on Wednesday, according to the CME Group FedWatch Tool, the odds of a 25 basis points hike in December are still low, around 20%.
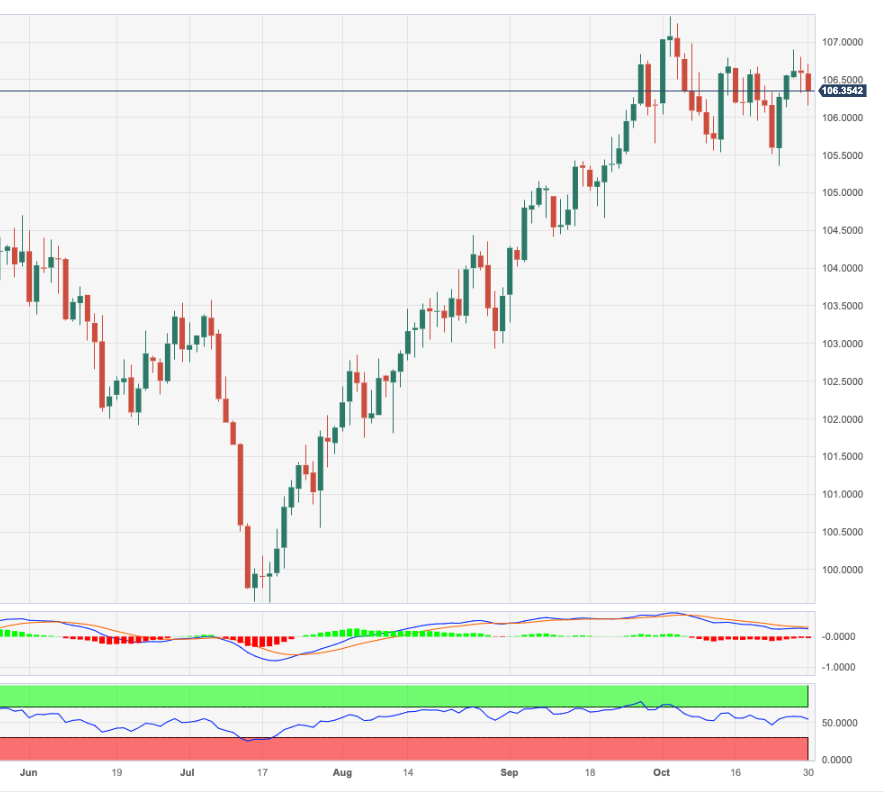
Technical Analysis: Dollar bulls fail to defend 20-day SMA as momentum wanes
Analysing the daily chart, a neutral to bearish technical outlook is evident for the DXY Index, suggesting that the bulls are losing momentum. The Relative Strength Index (RSI) points towards a potential reversal as it weakens above its midline, while the Moving Average Convergence (MACD) histogram presents bigger red bars.
Additionally, the index failed to hold above the 20-day Simple Moving Average (SMA), and as bears step in, further downside may be on the horizon. That being said, the DXY is still above the 100-day and 200-day SMAs, indicating that on the broader picture, the bulls are still in command.
Supports: 106.00, 105.70, 105.50.
Resistances: 106.30 (20-day SMA), 107.00, 107.30.
US Dollar FAQs
What is the US Dollar?
The US Dollar (USD) is the official currency of the United States of America, and the ‘de facto’ currency of a significant number of other countries where it is found in circulation alongside local notes. It is the most heavily traded currency in the world, accounting for over 88% of all global foreign exchange turnover, or an average of $6.6 trillion in transactions per day, according to data from 2022.
Following the second world war, the USD took over from the British Pound as the world’s reserve currency. For most of its history, the US Dollar was backed by Gold, until the Bretton Woods Agreement in 1971 when the Gold Standard went away.
How do the decisions of the Federal Reserve impact the US Dollar?
The most important single factor impacting on the value of the US Dollar is monetary policy, which is shaped by the Federal Reserve (Fed). The Fed has two mandates: to achieve price stability (control inflation) and foster full employment. Its primary tool to achieve these two goals is by adjusting interest rates.
When prices are rising too quickly and inflation is above the Fed’s 2% target, the Fed will raise rates, which helps the USD value. When inflation falls below 2% or the Unemployment Rate is too high, the Fed may lower interest rates, which weighs on the Greenback.
What is Quantitative Easing and how does it influence the US Dollar?
In extreme situations, the Federal Reserve can also print more Dollars and enact quantitative easing (QE). QE is the process by which the Fed substantially increases the flow of credit in a stuck financial system.
It is a non-standard policy measure used when credit has dried up because banks will not lend to each other (out of the fear of counterparty default). It is a last resort when simply lowering interest rates is unlikely to achieve the necessary result. It was the Fed’s weapon of choice to combat the credit crunch that occurred during the Great Financial Crisis in 2008. It involves the Fed printing more Dollars and using them to buy US government bonds predominantly from financial institutions. QE usually leads to a weaker US Dollar.
What is Quantitative Tightening and how does it influence the US Dollar?
Quantitative tightening (QT) is the reverse process whereby the Federal Reserve stops buying bonds from financial institutions and does not reinvest the principal from the bonds it holds maturing in new purchases. It is usually positive for the US Dollar.
USD/JPY could still go higher on the assumption that the BoJ holds off from another YCC change, economists at MUFG Bank report.
BoJ buying of JGBs similar to after the July YCC change could limit the FX reaction
On the assumption of the BoJ not altering YCC or its policy stance in any way followed by an FOMC meeting that unfolds as the market expects, there is certainly scope for USD/JPY to break further higher.
Expectations have now built up to a degree on a change in policy from the BoJ and hence a no-change announcement could fuel renewed Yen selling. If this scenario were to prompt some big intra-day moves it could be enough to see the MoF instruct the BoJ to intervene.
The risk scenario of a change in YCC (to +/-150 bps band) would see some Yen appreciation (1%-2%) although like in July if followed by heavy JGB buying by the BoJ the FX impact would likely be muted, especially ahead of the FOMC and the payrolls report.
The biggest downside risk for USD/JPY would be a removal of NIRP – this would be a very significant and bold step by the BoJ at this juncture and would see a sharper drop in USD/JPY (3%-5%) but we attach a low likelihood to the BoJ lifting its key policy rate from the current -0.10%.
Gold has regained upward momentum. Strategists at Société Générale analyze the yellow metal’s technical outlook.
Gold poised to challenge previous highs at $2,070/$2,075
Gold looks poised to head higher towards the graphical levels of $2,070/$2075 representing highs of 2020 and 2022 and more importantly the upper part of the large sideways range which has been in force for more than three years.
Once Gold overcomes the hurdle at $2,070/$2,075, next leg of uptrend is expected to materialize. Further objectives are located at projections of $2,180 and $2,240.
The 200-DMA near $1,933 is near term support.
- Mexican Peso hovers at around 18.00, down 0.42 on upbeat market sentiment.
- Hurricane Otis's impact on the southern state of Guerrero could strain Mexico's finances.
- USD/MXN traders await the US Federal Reserve monetary policy meeting, expecting unchanged rates.
Mexican Peso (MXN) climbs against the US Dollar (USD), piercing for a moment the 18.00 figure, as the USD/MXN dived to a daily low of 17.96, but at the time of writing hovers at around the 18.00 figure, down 0.42%.
Mexico’s currency continues to remain bolstered by market sentiment, which witnessed an uptick, with Israel's offensive on the Gaza Strip staying at a lower scale than expected.
Hurricane Otis impacted the southern state of Guerrero over the weekend, likely weighing on the country’s finances, as the FONDEN – a trust created by previous Mexican government administrations to respond to natural disasters – disappeared since the beginning of President Andres Manuel Lopez Obrador administration.
In the meantime, USD/MXN traders are eyeing the release of a busy US economic schedule, highlighted by the US Federal Reserve (Fed) monetary policy meeting on November 1, which is expected to hold rates unchanged. Odds for a 25 bps increase to the Federal Funds Rate (FFR) are at 1.4%, as shown by the CME FedWatch Tool.
Daily digest movers: Mexican Peso at the mercy of the Fed, and market sentiment
- First estimates of Hurricane Otis damages stand at around 828 million dollars, according to Enki Research, a firm specializing in natural disasters.
- Mexican authorities reported that around 270,000 houses in Acapulco were affected or destroyed, while 80% of hotels were severely damaged.
- The US Dallas Fed Manufacturing Index for October plunged to -19.2, worse than September’s 18.1.
- Elevated US Treasury bond yields, particularly the 10-year benchmark note rose up five basis points to 4.89%, caps the USD/MXN drop despite overall US Dollar weakness.
- The US Dollar Index, which tracks the performance of the Greenback against six currencies, slides 0.40%, down at 106.15.
- Mexico’s economic docket would feature the release of the Fiscal Balance, Gross Domestic Product for Q3, S&P Global Manufacturing PMIs, Foreign Exchange Reserves, and Gross Fixed Investment.
- The US agenda will feature the Fed’s decision, Fed Powell’s press conference, employment data, and S&P Global and ISM Manufacturing PMIs.
- On October 24, Mexico's National Statistics Agency INEGI reported annual headline inflation hit 4.27%, down from 4.45% at the end of September, below forecasts of 4.38%.
- Mexico’s core inflation rate YoY was 5.54%, beneath forecasts of 5.60%.
- Earlier this week, S&P Global Manufacturing PMIs evidenced expansion in US manufacturing and service sectors during October.
- The Bank of Mexico (Banxico) held rates at 11.25% in September and revised its inflation projections from 3.50% to 3.87% for 2024, above the central bank’s 3.00% target (plus or minus 1%).
Technical Analysis: Mexican Peso buyers target the 200-day Simple Moving Average
The USD/MXN uptrend remains intact despite Friday’s dip below the 18.00 figure, which puts the 20-day Simple Moving Average (SMA) at 18.10 at risk of being decisively broken to the downside. A daily close below the latter could pave the way for a test of the 200-day SMA at 17.72. A breach of the latter and the next support would be the 50-day SMA at 17.55. On the flip side, if the exotic pair remains above the 20-day SMA, the next resistance will emerge at the October 26 high at 18.42 before challenging last week’s high at 18.46, ahead of challenging the 18.50 figure.
Mexican Peso FAQs
What key factors drive the Mexican Peso?
The Mexican Peso (MXN) is the most traded currency among its Latin American peers. Its value is broadly determined by the performance of the Mexican economy, the country’s central bank’s policy, the amount of foreign investment in the country and even the levels of remittances sent by Mexicans who live abroad, particularly in the United States. Geopolitical trends can also move MXN: for example, the process of nearshoring – or the decision by some firms to relocate manufacturing capacity and supply chains closer to their home countries – is also seen as a catalyst for the Mexican currency as the country is considered a key manufacturing hub in the American continent. Another catalyst for MXN is Oil prices as Mexico is a key exporter of the commodity.
How do decisions of the Banxico impact the Mexican Peso?
The main objective of Mexico’s central bank, also known as Banxico, is to maintain inflation at low and stable levels (at or close to its target of 3%, the midpoint in a tolerance band of between 2% and 4%). To this end, the bank sets an appropriate level of interest rates. When inflation is too high, Banxico will attempt to tame it by raising interest rates, making it more expensive for households and businesses to borrow money, thus cooling demand and the overall economy. Higher interest rates are generally positive for the Mexican Peso (MXN) as they lead to higher yields, making the country a more attractive place for investors. On the contrary, lower interest rates tend to weaken MXN.
How does economic data influence the value of the Mexican Peso?
Macroeconomic data releases are key to assess the state of the economy and can have an impact on the Mexican Peso (MXN) valuation. A strong Mexican economy, based on high economic growth, low unemployment and high confidence is good for MXN. Not only does it attract more foreign investment but it may encourage the Bank of Mexico (Banxico) to increase interest rates, particularly if this strength comes together with elevated inflation. However, if economic data is weak, MXN is likely to depreciate.
How does broader risk sentiment impact the Mexican Peso?
As an emerging-market currency, the Mexican Peso (MXN) tends to strive during risk-on periods, or when investors perceive that broader market risks are low and thus are eager to engage with investments that carry a higher risk. Conversely, MXN tends to weaken at times of market turbulence or economic uncertainty as investors tend to sell higher-risk assets and flee to the more-stable safe havens.
Eurostat will release a first flash estimate of Eurozone Harmonised Index of Consumer Prices (HICP) data for October on Tuesday, October 31 at 10:00 GMT and as we get closer to the release time, here are the expectations forecast by the economists and researchers of seven major banks regarding the upcoming EU inflation print.
Headline is expected at 3.1% year-on-year vs. 4.3% in September, while Core is expected at 4.2% YoY vs. the prior release of 4.5%. If so, headline infaltion would have fallen to its lowest level in two years – within sight of the 2% target.
Erste Group
We expect a further slight decline in inflation in October, mainly due to a continued downward trend in food prices as well as core inflation. The recent sharp rise in oil prices poses a slight upside risk to the dynamics of energy inflation in the short term. Downward pressure on food inflation should intensify further in the months ahead. Core inflation should also gradually lose momentum in the short term. We expect inflation to fall to around 3.5% YoY by the end of the year. For 2024, we forecast average inflation of 3%.
Commerzbank
In the Euro area, the inflation rate is likely to have fallen markedly from 4.3% in September to 3.0% in October, especially as the sharp rise in energy prices in October is no longer included in the YoY comparison. But even the inflation rate excluding energy and food and beverages is likely to have eased slightly in October, from 4.5% to 4.3%.
Danske Bank
We expect a large decline in October headline inflation to 3.1% from 4.4% in September on the back of a large negative contribution from energy prices but also a continuation of the fading underlying price momentum we have seen in Q3.
Deutsche Bank
We expect the headline measure for the Eurozone to further decline to 3.1% from 4.3% in September, and see the core gauge slowing to 4.1% (4.5%).
SocGen
Lower energy inflation should see the HICP decrease by 1.3pp to 3% YoY in October, with core inflation down 0.3pp to 4.2% YoY.
Citi
Large base effects should cause a major step down in Euro area headline inflation in October to 3.1% YoY, the lowest since August 2021. Core CPI should also ease to 4.2% YoY, on a 0.3% NSA MoM gain (or 0.2% SA). The 3M/3M SAAR core rate currently stands at just above 3%, nearly half the pace of six months ago and the case for a meaningful slowdown in core inflation over coming months is becoming stronger.
Wells Fargo
At its October meeting, the ECB held its Deposit Rate steady at 4.00% and again suggested that if interest rates remain at current levels for sufficiently long, that should eventually see inflation return toward target. We believe that this week's output and price data will reinforce the view that an extended policy rate pause is appropriate. The consensus forecast is for a further moderation in price pressures, with October headline and core inflation expected to slow to 3.1% YoY and 4.2% YoY, respectively. More generally, inflation trends are forecast to continue slowing into next year. The news on economic activity should also be subdued. Overall, with growth soft, inflation slowing and sentiment weak, we do not expect the ECB to hike rates further during the current cycle.
Economists at MUFG Bank analyze USD outlook in a week of a heavy schedule of macro events.
Nonfarm Payrolls will be key
The refunding announcement, the communication from Fed Chair Powell at the FOMC press conference and the US jobs data on Friday will be the three key events for the UST bond market.
The inability of the US Dollar to strengthen further of late is telling but we still see the window for Dollar gains as open until we see clearer evidence in official data of economic weakness – so in that sense, the NFP as always will be key.
The Bank of Japan (BoJ) will hold its Monetary Policy Committee (MPC) on Tuesday, October 31 and as we get closer to the Monetary Policy Decision, here are the expectations forecast by the economists and researchers of 10 major banks.
Analysts do not expect the BoJ to move away from its negative policy rate. By contrast, the market is split on the prospect of another tweak to Yield Curve Control (YCC).
ANZ
We don’t expect the BoJ to change policy at its upcoming meeting. There remains a chance it will drop its guidance that it won’t hesitate to take additional easing measures. It’s also possible that YCC could be tweaked given the upward pressure on bond yields. Changes to YCC – expanding the target range and/or shortening the duration – are possible in coming meetings and we expect YCC will be abandoned altogether by Q2 2024. The inflation outlook suggests 2% sustainable inflation isn’t going to be achieved within the forecast horizon implying any change to the policy rate remains some way off.
Standard Chartered
We expect the BoJ to stay on hold despite pressure to tighten on account of high inflation and challenges from a depreciating Japanese Yen (JPY). Still, we expect the BoJ to be patient and wait for a better time to change its policy, as it may seek to avoid past mistakes of premature policy tightening, which could depress economic growth and revive deflationary sentiment.
Nordea
The BoJ meeting will be suspenseful. The JPY is now trading above 150 against the USD and the 10Y Japanese government yield is not far from the 1% cap enforced by the BoJ. Something needs to give, either the BoJ will start to normalise policy or the JPY will continue to weaken. We believe however that markets most likely will get disappointed again by the BoJ.
Danske Bank
The Japanese data indicated the economic recovery has lost some steam with composite PMI at 49.9, below the 50 threshold for the first time this year. Even so, we think the data supports another tweak of the yield curve control by the BoJ this year, most likely at the meeting ending on Tuesday, with the most likely move as an increase in the de facto 10Y yield cap to 1.5%. The recent surge in global yields has also prompted the BoJ to intervene in JGB markets several times recently.
ING
Market consensus suggests that it is unlikely for the current policy settings to change, but we see a slightly higher chance of another YCC tweak with forward guidance changes. The market will also pay more attention to the BoJ’s quarterly outlook for growth and inflation. If the central bank revises up its fiscal year 2024 inflation forecasts to above 2%, the market is likely to take this as a hint that policy normalisation is fast approaching.
Deutsche Bank
We expect the BoJ to revise its monetary policy framework but it is a close call. Even if the BoJ maintains its status quo, the YCC is likely to come under further pressure as expectations of policy normalisation build up.
TDS
We now expect the BoJ to tweak its YCC settings by widening the reference range for 10y JGBs to 1.5% (prior: 1.0%) and increasing the rate of its fixed rate purchase operations. We don't expect other policy levers to be adjusted. We expect the Bank is likely to signal that this YCC tweak again is a preemptive move given the upside risks from wages and prices.
SocGen
We see a 50-50 chance that the BoJ would raise its de-facto cap on the 10-year JGB yield from 1% to 1.5% due to rising concerns of widening yield differentials and mounting pressure on the Yen.
Citi
We now expect the BoJ to preemptively raise the backstop for YCC from the current +1.0% to +1.5%. It seems likely the BoJ thinks the underlying factors of rising US Treasury yields will not reverse in the near term. Therefore, the BoJ will likely perceive an increasing risk that it may have to buy a huge amount of JGBs through December if YCC is left unchanged. Meanwhile, the rise in domestic inflation expectations implies real interest rates would be unchanged even after the BoJ allows the 10-year JGB yield to rise slightly, meaning the easing policy stance would be kept unchanged. Governor Ueda will likely state that the revision was made in consideration of the balance between effectiveness and side effects. Regarding the wording of the forward guidance, any change towards tightening will be difficult as long as YCC exists.
Wells Fargo
We expect the BoJ to keep monetary policy on hold for now. That is, it will keep its policy interest rate at -0.10% and maintain the current YCC policy, which creates a hard upper bound of 1.00% for 10-year Japanese Government Bonds (JGBs). Overall, we maintain our view for no change, but we will be closely monitoring the BoJ's inflation forecasts for signs a policy adjustment could be coming closer in the months and quarters ahead.
- EUR/USD regains the smile and briefly surpasses the 1.0600 barrier.
- Once the 1.0700 region is cleared, the pair’s selling bias could alleviate somewhat.
EUR/USD picks up some buying interest and manages to surpass the key hurdle at 1.0600 the figure on Monday.
In case bulls push harder, the pair should meet the next hurdle at the monthly high of 1.0694 (October 24), which comes just ahead of the round level of 1.0700 and prior to the weekly peaks of 1.0736 (September 20) and 1.0767 (September 12).
In the meantime, while below the 200-day SMA at 1.0811, the pair’s outlook should remain negative.
EUR/USD daily chart
Kit Juckes, Chief Global FX Strategist at Société Générale, analyzes EUR/USD outlook.
It takes a genuine surprise to really excite the market
As US data continues to outperform expectations, and the rates market prices in mid-2024 RECN easing with greater conviction, there is still more danger of EUR/USD heading closer to parity, than making a move back above 1.10.
Expectations for strong US data and weaker figures in Europe, mean that it takes a genuine surprise to really excite the market, but for all that, reminders of economic divergence on sentiment can build up until they reach breaking point for Euro (and other European currency) sentiment.
- DXY faces further selling pressure and approaches 106.00.
- There is a strong resistance area near 107.00 so far.
DXY retreats to three-day lows in the 106.20/15 band following the rejection from the 107.00 region seen in the second half of last week.
So far, extra range bound looks the most likely scenario for the index for the time being. The breakout of this theme exposes a potential move to the weekly top at 106.89 (October 26), prior to the round level at 107.00 and just ahead of the 2023 high of 107.34 (October 3).
So far, while above the key 200-day SMA, today at 103.41, the outlook for the index is expected to remain constructive.
DXY daily chart
- EUR/JPY picks up some upside pace and flirts with 159.00.
- Bullish attempts should meet a tough barrier near 160.00.
EUR/JPY reverses Friday’s marked pullback and clings to daily gains just above the 158.00 yardstick.
Further consolidation appears to be the name of the game for the cross for the time being. Against that, the breakout of this theme could encourage the index to challenge the 2023 top at 159.91 (October 24) closely followed by the round level at 160.00.
So far, the longer term positive outlook for the cross appears favoured while above the 200-day SMA, today at 151.26.
EUR/JPY daily chart
- Japanese Yen edges lower (USD/JPY higher) after Friday’s steep recovery.
- The week ahead includes key meetings of the Bank of Japan and the Federal Reserve.
- USD/JPY recovers but remains pressured below 150 and an important short-term trendline.
The Japanese Yen (JPY) steadily sinks on Monday ahead of the main event on the horizon, the Bank of Japan (BoJ) policy meeting on Tuesday.
The BoJ is not expected to raise interest rates, but with inflation running above its 2.0% target, it could still adjust its Yield Curve Control (YCC) mechanism, used to manage Japanese Government Bond Yields (JGB). If so, this could support the Yen in its pairs (a negative for USD/JPY).
“To offset a higher CPI projection and safeguard credibility, it is possible that the BoJ could adjust its yield curve control program, allowing long-term government bond rates to moderately drift above the current cap of 1.0%. Such a YCC tweak is likely to have a positive effect on the yen, even if policymakers refrain from framing it as a step toward ‘policy normalization,” notes Diego Coleman, Contributing Analyst at dailyfx.com.
For USD/JPY, the Fed’s November 1 policy meeting, on Wednesday, will also have an impact. The Fed is unlikely to change interest rates – there is only a 1.4% chance of a rate hike of 0.25% according to the CME Fedwatch tool, which uses Fed Funds Futures as a gauge of market expectations.
Daily digest market movers: Inflation expectations will be key in week ahead
- The BoJ policy meeting on Tuesday, October 31, will be the key market mover for the Yen this week.
- Traders will be mainly focused on the BoJ’s inflation forecast
- If the BoJ forecasts higher inflation in 2024, it might decide to tweak the YCC mechanism, which maintains 10-year JGB yields below 1.0%. If controls are relaxed to provide some tightening to the economy, this could support the Yen and be negative for USD/JPY.
- The yield on the 10-year Japanese Government Bond (JGB) slipped to 0.876% on Friday.
- The Fed’s November 1 policy meeting will be another key event for USD/JPY. A rise in interest rates is not predicted, but the focus will instead focus on what Federal Reserve Chairman Jerome Powell says in his press conference after the delivery of the official announcement.
- If Powell emphasizes the likelihood that the policy rate could rise in the future or remain ‘higher for longer’ the market may buy the US Dollar, pushing USD/JPY back up.
- Inflation pressures may be easing more than the data reflects, however, according to Stephen Schwarzman, the CEO and co-founder of investment fund Blackstone, who argues he is seeing input costs – the cost of making stuff – in the companies in his portfolio increase 0% in Q3. This runs counter to the ‘hot inflation' argument.
- Schwarzman added companies are making more profits off lower sales for lower base costs. He added that “A third of CPI is shelter. A year ago, that was running at 12-13%, not its 1% – but the Fed averages the numbers. If you take that together inflation is actually lower than the numbers are saying.”
- If Schwarzman’s views are true for the wider US economy, then the Fed may actually take a more dovish line than expected, leading to a fall in the US Dollar.
- The BoJ is expected to forecast inflation in Japan in 2024 to rise to 2.2% from 1.9% previously.
- USD/JPY rose to a new 12-month high last week after Tokyo inflation data for October, released last Friday – and widely seen as a leading indicator for Japan-wide inflation – came out higher than experts had expected.
Japanese Yen technical analysis: Trading around key trendline
USD/JPY, which is trading in the 149.70s at the time of writing, remains stuck below the key 150 psychological and purported ‘intervention’ threshold.
The bias remains to the upside, with the next major target at the 152.00 highs achieved in October 2022. A re-break above last Thursday’s highs of 150.80 would provide fresh confirmation of a continued advance.
-638342722849569793.png)
US Dollar vs Japanese Yen: 4-hour Chart
The pair has broken below a key trendline on the 4-hour chart, however, the break was not definitive and price has recovered on Monday back above the trendline. It would require a re-break below the 149.28 lows to confirm the break. Such a move would also confirm a reversal of peaks and troughs on the 4-hour chart, widely used to assess the short-term trend. The break of the trendline combined with the reversal in peaks and troughs would change the short-term trend to bearish.
Breakouts from channels are expected to fall at least a Fibonacci 61.8% of the height of the channel, which gives a minimum downside target of 147.58.
-638342723271460269.png)
US Dollar vs Japanese Yen: Daily Chart
The 50-day Simple Moving Average (SMA) at 148.24 will provide a tough level of support for bears to try to break through and 148.74 could also potentially provide a stopping point on the way down.
Japanese Yen FAQs
What key factors drive the Japanese Yen?
The Japanese Yen (JPY) is one of the world’s most traded currencies. Its value is broadly determined by the performance of the Japanese economy, but more specifically by the Bank of Japan’s policy, the differential between Japanese and US bond yields, or risk sentiment among traders, among other factors.
How do the decisions of the Bank of Japan impact the Japanese Yen?
One of the Bank of Japan’s mandates is currency control, so its moves are key for the Yen. The BoJ has directly intervened in currency markets sometimes, generally to lower the value of the Yen, although it refrains from doing it often due to political concerns of its main trading partners. The current BoJ ultra-loose monetary policy, based on massive stimulus to the economy, has caused the Yen to depreciate against its main currency peers. This process has exacerbated more recently due to an increasing policy divergence between the Bank of Japan and other main central banks, which have opted to increase interest rates sharply to fight decades-high levels of inflation.
How does the differential between Japanese and US bond yields impact the Japanese Yen?
The BoJ’s stance of sticking to ultra-loose monetary policy has led to a widening policy divergence with other central banks, particularly with the US Federal Reserve. This supports a widening of the differential between the 10-year US and Japanese bonds, which favors the US Dollar against the Japanese Yen.
How does broader risk sentiment impact the Japanese Yen?
The Japanese Yen is often seen as a safe-haven investment. This means that in times of market stress, investors are more likely to put their money in the Japanese currency due to its supposed reliability and stability. Turbulent times are likely to strengthen the Yen’s value against other currencies seen as more risky to invest in.
Economists at TD Securities discuss the Bank of Japan (BoJ) Interest Rate Decision and their implications for the USD/JPY pair.
Hawkish (10%): Complete removal of YCC
The BoJ scraps YCC and sets the stage for the end of NIRP as the virtuous cycle of price and wage hikes is taking off. The Bank is likely to shade up the FY24 core inflation forecast but more importantly, the FY25 core inflation forecast may have a 2% handle (prior: 1.6%) to reflect the exit from Japan's deflationary past. USD/JPY -2.5%.
Base Case (55%): Raise in upper ceiling to 1.5%
The BoJ widens the upper end of the reference range for 10y JGBs from 1% to 1.5% and potentially increases the rate of its fixed rate purchase operations. The Bank could signal that this tweak is a preemptive move again given the upside risks from wages and prices. Implicitly behind the tweak, the BoJ is likely cognizant that it’s a tough battle to curb the rise in yields given offshore moves, and real rates may become too accommodative as a result of the shift higher in inflation expectations. Ueda could take this chance to set the ground for an end to YCC in Dec and the end of NIRP in Jan'24. USD/JPY -1%.
Dovish (35%): No change to YCC settings
BoJ keeps YCC settings unchanged and reiterates that there is some distance before the 2% price goal is in sight. The Bank may retain its FY24 and FY25 core inflation forecasts <2% to drive the message that the current inflationary pressure is transitory and unlikely to last. USD/JPY +0.5%.
- AUD/USD approached 0.6400 as the US Dollar corrected amid improved market mood.
- 10-year US Treasury yields jumped to near 4.89%, reflecting the confidence of investors in the US economic strength.
- Caixin Manufacturing PMI data for October is seen expanding to 50.8 vs. the former release of 50.6.
The AUD/USD pair extends gains above the crucial resistance of 0.6368 in the early New York session. The Aussie asset is approaching the round-level resistance of 0.6400 as the US Dollar has corrected after failing to recover above the 106.70 resistance.
The S&P500 opens on a strong bullish note as investors hope that the Federal Reserve (Fed) is done with hiking interest rates and a neutral commentary is expected for the second time in arrow. The market mood has turned cheerful as no more interest rate hikes from the Fed would bring a sense of optimism to US firms.
Higher US bond yields are responsible for expectations pointing to a steady interest rate decision by the Fed. The 10-year US Treasury yields jumped to near 4.89%, reflecting the confidence of investors in the strength of the US economy and expectations that the Fed will keep interest rates higher for a significantly longer period.
The US Dollar Index (DXY) corrects to near 106.28 as investors shift focus to the US ADP Employment Change and the ISM Manufacturing PMI data for October, which will be announced on Wednesday. Investors will keenly watch the US factory data as it has been contracting consistently for the last 11 months. S&P Global survey showed that private factory PMI met the 50.0 threshold in October.
Meanwhile, the Australian Dollar will be impacted by the Caixin Manufacturing PMI data for October. As per the consensus, the economic data expanded to 50.8 vs. the former release of 50.6. It is worth noting that Australia is the leading trading partner of China and higher factory activities in China support the Australian Dollar.
Economist Lee Sue Ann at UOB Group reviews the latest interest rate decision by the ECB.
Key Takeaways
The European Central Bank (ECB) decided to keep its three key interest rates unchanged after 10 consecutive hikes. The accompanying press release was pretty much identical to the one in Sep, with the Governing Council saying it will continue to follow a data-dependent approach.
The Governing Council also reiterated its commitment to continue reinvesting the proceeds of maturing bonds purchased through the Pandemic Emergency Purchase Programme (PEPP). At the press conference, ECB President Christine Lagarde said that PEPP parameters and minimum reserve requirements were not discussed and did not elaborate on when these may be addressed.
On the latter, the ECB may be waiting for the discussion on its framework review to pick up, which will likely occur in late-2023 or early-2024. Meanwhile, given higher bond yields, it is likely the ECB will continue to adhere to that through the end of 2024. As for interest rates, we expect the ECB to keep rates higher for longer, though the door to future rate hikes remains open.
Gold should remain a good hedge, despite worries that rates will remain higher for longer, economists at UBS report.
Gold has proven its worth as a diversifier again
The price of the metal has climbed by about 9% since the Hamas attack on Israel and a regional escalation of the conflict would likely boost Gold further.
While we believe that safe-haven flows would eventually reverse, Gold has proven its worth as a diversifier again. In addition, we ultimately see support for Gold as the slowing US economy allows Fed officials to move toward monetary easing – which would likely lead to lower yields and a lower opportunity cost of holding the non-interest-bearing metal.
Markets Strategist Quek Ser Leang at UOB Group suggests that further upside in USD/IDR should not be ruled out in the short-term horizon.
Key Quotes
USD/IDR soared to a high of 15,965 last week, its highest level since April 2020. While upward momentum is strong, the rally over the past few weeks is severely overbought. Further USD/IDR strength is not ruled out, but in view of the overbought conditions, the pace of any advance is likely to be slower.
Also, USD/IDR may find the major resistance at 16,000 difficult to break. Support is at 15,860; a breach of 15,825 would indicate that the rally in USD/IDR is ready to take a breather.
- CPI Inflation in Germany continued to soften in October.
- EUR/USD climbed above 1.0600 with the immediate reaction.
Inflation in Germany, as measured by the change in the Consumer Price Index (CPI), declined to 3.8% on a yearly basis in October from 4.5% in September. This reading came in below the market expectation of 4%. On a monthly basis, the CPI was unchanged.
The annual Harmonised Index of Consumer Prices (HICP), the European Central Bank's (ECB) preferred gauge of inflation, rose 3% in the same period, compared to 4.3% in September and the market forecast of 3.6%. Monthly HICP decreased 0.2%.
Market reaction
EUR/USD gained traction with the immediate reaction and was last seen rising 0.42% on the day at 1.0608.
The USD is trading mostly lower against its major peers to start a busy week. Economists at Scotiabank analyze Greenback’s outlook.
USD remains firm
Generally, the USD remains firm but the DXY is not advancing and remains below the early October peak. Price action does suggest there is better USD selling pressure emerging on modest gains over the past few sessions and the oscillator studies indicate the DXY is heavily overbought on the medium-term charts.
But investors will need a clear reason to lean a bit harder on the USD from here and it’s not obvious where that cue will come from; month end might not do it (passive rebalancing signals look neutral) while the Fed may retain the pretense that it is still thinking about tightening a bit more and markets are expecting decent (190-200K) NFP jobs at the end of the week.
One potential bump in the road for US markets is the Treasury’s quarterly refunding Wednesday, just ahead of the Fed decision, amid more intense scrutiny of bond supply and a widening US budget deficit.
- Silver price climbs to near $23.40 as Middle East tensions keep safe-haven bid upbeat.
- The US continues to urge Israel for a delay in ground attack as it would dampen hostage negotiations.
- Silver price forms an Inverted Head and Shoulder chart pattern. A breakout of the same results in a bullish reversal.
Silver price (XAG/USD) shifts auction above $23.00 after a sharp recovery as the ongoing conflicts between Israel and Palestine keep demand for safe-haven assets upbeat. The white metal is expected to deliver more upside as the ground assault from the Israeli army in Gaza would escalate expectations of Iran’s intervention, which would widen Middle East tensions.
Investors keep an eye on the US Security Council meeting, requested by the UAE, to find possible solutions for a truce between Middle East players. The US continues to urge Israel for a delay in ground attack as it would dampen negotiations over the hostages’ release.
S&P500 futures added significant gains in the London session, portraying an improvement in the risk appetite of the market participants. The US Dollar Index (DXY) drops to near 106.43 as a steady interest rate decision from the Federal Reserve (Fed) on November 1 is widely anticipated. 10-year US Treasury yields jump above 4.91%.
While interest rates from the Fed will remain unchanged in the range of 5.25-5.50%, the central bank will keep doors open for further policy tightening. The market participants expect that consumer inflation will remain persistent as the labor demand is upbeat and consumer spending is robust.
Silver technical analysis
Silver price forms an Inverted Head and Shoulder chart pattern on a four-hour scale, which indicates a prolonged consolidation. A breakout above the neckline placed from September 22 high at $23.77 would result in a bullish reversal. Advancing 50-period Exponential Moving Average (EMA) at $22.90 indicates that the near-term trend is bullish.
The Relative Strength Index (RSI) (14) attempts to shift into the bullish range of 60.00-80.00. If the RSI (14) manages to do so, the Silver bulls would get strengthened further.
Silver four-hour chart
-638342676992200978.png)
GBP/USD is still finding support on dips below 1.21. Economists at Scotiabank analyze the pair’s outlook.
A minor bid for the Pound could extend a little more above 1.2160
Trading may remain relatively quiet ahead of the BoE policy decision on Thursday. Markets expect policy to be left on hold but the GBP may see a minor bid if the voting shows a tight split among the nine policymakers.
A minor bid for the Pound could extend a little more above 1.2160 but here too, trend momentum is weak, favouring more range trading.
Support is 1.2070 and 1.2040.
EUR/USD is trading a little firmer but well within recent ranges. Economists at Scotiabank analyze the pair’s outlook.
More range trading looks likely in the short-run
Short-term price action suggests demand for the EUR is firm below 1.0550 but spot needs to extend through the 1.0600/1.0610 area to pick up more ground in the short run.
Trend momentum is positive for the EUR – but only barely so on the intraday and daily studies. That rather suggests more range trading, with a mild upside bias perhaps, in the near term.
The CAD has struggled over the past couple of weeks. Economists at Scotiabank analyze Loonie’s outlook.
USD looks heavily overbought already on the daily and weekly charts
The technical picture retains a negative undertone for the CAD. Trend momentum is USD-bullish across short, medium and long-term DMIs.
Short-term support is 1.3790 and 1.3740/1.3750.
The only potentially positive pointer for the CAD is that the USD looks heavily overbought already on the daily and weekly charts. In particular, the weekly slow stochastic is not ‘confirming’ the USD’s move higher last week – a warning signal on the sustainability of these gains.
Resistance is 1.3875/1.3880.
Economists at MUFG Bank analyze GBP outlook ahead of the BoE announcement on Thursday.
Weak economic activity
The worsening economic data has been clear and will likely be clearly acknowledged by Governor Andrew Bailey in the press conference. We see this inevitable acknowledgement of weaker data and some evidence that the labour market conditions point to reduced wage inflation risks as helping to push yields lower.
The UK OIS curve has more potential to adjust lower further out – just 25 bps worth of cuts by September 2024 looks too conservative to us and a less hawkish communication on Thursday could push yields at the back end of next year lower – leading to some further GBP underperformance.
For GBP/USD, the October low of 1.2037 will be the key support level.
Economists at Commerzbank analyze how the market could react to Israel's increased ground action in Gaza.
Conflict spreading and involving other countries is the biggest risk
The market has so far reacted cautiously to the news from the Middle East, and the Dollar is not yet back in demand as a safe haven.
There is a risk that the situation will worsen as the week progresses and that the Dollar will strengthen again. But the biggest risk is that the conflict will spread and involve other countries in the Middle East. If that happens, market reaction is likely to be much stronger.
It makes sense to continue to monitor events in order to be able to react in case there are stronger movements in the US Dollar.
Kit Juckes, Chief Global FX Strategist at Société Générale, analyzes USD/JPY outlook ahead of Tuesday’s Bank of Japan meeting.
Fright-night for BoJ-watchers
The BoOJ won’t hike rates, but we see a 50% chance that the de-facto cap on the 10-year JGB yield will rise from 1% to 1.5%.
USD/JPY continues to track yield differentials, so it’s hard to see how we can avoid a reaction one way or the other from the decision on Tuesday.
If they keep the cap unchanged, we will probably see another spike above USD/JPY 150 and more intervention talk.
If they raise the cap, every 10 bps JGB yields rise relative to Treasuries can drag USD/JPY down by about 2%, and take EUR/JPY down by as much or more.
Extra selling pressure could force USD/MYR to slip back to the 4.7320 zone in the near term, according to Markets Strategist Quek Ser Leang at UOB Group.
Key Quotes
Last week, USD/MYR traded in a range of 4.7650/4.7900 before closing at 4.7760 (+0.23%). USD/MYR traded on a weak note today as it dropped sharply from the opening. The sharp drop has increased the likelihood of a pullback in USD/MYR to 4.7430, possibly 4.7320.
In order to maintain the buildup in momentum, USD/MYR must stay below 4.7900. Note that 4.7800 is already a strong resistance level.
EUR/USD is in wait-and-see mode. Economists at Société Générale anlayze the pair’s outlook.
The retracement below 1.06 is difficult to square
For EUR/USD, the retracement below 1.06 is difficult to square with the narrowing of 10-year real bond spreads below 190 bps, so we will have to waitand see if an adjustment higher in the single currency takes place, or whether spreads move back in favour of the dollar after the Fed and US payrolls.
Technically, key levels to watch to the downside is 1.0485/1.0448 and 1.0660 on the upside.
- USD/CAD falls modestly from one-year high at 1.3880 as the US Dollar retreats.
- Janet Yellen said high US bond yields reflect strong confidence in the US economy.
- Investors await BoC Macklem speech and Fed’s monetary policy.
The USD/CAD pair falls gradually from the one-year high of 1.3880 in the European session. The Loonie asset drops as the US Dollar Index (DXY) slips sharply from 106.70 as investors shift focus to the interest rate decision by the Federal Reserve (Fed), which will be announced on Wednesday.
The US Dollar Index (DXY) faces selling pressure as investors hope that the Fed is done with hiking interest rates due to higher US Treasury yields. 10-year US bond yields have risen to 4.85% and have tightened financial conditions significantly.
US Treasury Secretary Janet Yellen said last week that high US bond yields reflect strong confidence in the US economy and indicate that interest rates will remain higher for a longer period.
The Canadian Dollar would dance to the tunes of the speech from Bank of Canada (BoC) Governor Tiff Macklem, which is scheduled for Wednesday. BoC Macklem may provide guidance on interest rates and inflation in Canada.
USD/CAD struggles to extend upside above the one-year high around 1.3880. The near-term demand for the Loonie asset remains upbeat as the 20-day Exponential Moving Average (EMA) at 1.3715 is sloping toward north.
The Relative Strength Index (RSI) (14) shifts into the bullish range of 60.00-80.00, which indicates that the bullish momentum has triggered.
A decisive break above October 27 high at 1.3880 would expose the round-level resistance at 1.3900, followed by 13 October 2022 high at 1.3978.
In an alternate scenario, a breakdown below October 24 low around 1.3660 would drag the asset to the round-level support of 1.3600. A further breakdown could expose the asset to October 7 low at 1.3570.
USD/CAD daily chart
-638342591417232518.png)
The Bank of England (BoE) is due to meet this week. Economists at Commerzbank analyze how the Interest Rate Decision could impact Sterling.
Unchanged interest rates would be neutral for Sterling
As far as the BoE is concerned, the dampening effects on the economy of past rate hikes means that it is questionable whether it will further hike its key rate on Thursday even though inflation remains stubbornly high and wage growth also continues to rise again quite considerably.
The majority of market participants expects unchanged interest rates so that a decision of that nature would be neutral for Sterling initially. If, however, it becomes clear over the coming weeks that there are still price risks and if the impression that the BoE is not doing enough intensifies, the market would put punish Sterling.
The Dollar continues to trade on the strong side. This week, economists at ING expect the threat to the Dollar to stem more heavily from Asia than Europe.
Strong Dollar could be challenged by Asia this week
We expect the Dollar to hold gains unless the Fed feels the need to emphasise the tightening of financing conditions and drop its tightening bias. That seems premature. Equally, unless Friday's jobs report dramatically misses estimates, the Dollar should stay bid.
Tuesday sees an important BoJ policy meeting, where we think the risks of a policy adjustment and a softer USD/JPY are under-priced. China also releases PMI data mid-week. Europe looks less of a threat to the Dollar given what should be a run of soft/recessionary GDP data and lower inflation this week.
DXY sits in the middle of its 105.35 to 107.35 range and should probably trade to the strong side unless some of the above event risks come to pass.
In the view of Markets Strategist Quek Ser Leang at UOB Group, further weakness could drag USD/THB to revisit the 35.65 level in the short term.
Key Quotes
The current price action in USD/THB since the 37.24 high earlier this month is likely part of an ongoing pullback. The pullback has scope to extend to 35.65 before stabilisation can be expected.
At this time, the likelihood of a sustained break below 35.65 is not high. Resistance is at 36.20; however, only a breach of 36.25 would indicate that the weakness in USD/THB has stabilised.
- Gold price falls back marginally from five-month high as focus shifts to Fed policy.
- The Fed is widely expected to keep interest rates unchanged in the 5.25-5.50% range.
- Escalating Israel-Palestine war keep bullions’ demand firmer.
Gold price (XAU/USD) delivered a moderate corrective move after printing a fresh five-month high. The precious metal slips marginally as investors turn cautious on expectations that the Federal Reserve (Fed) will keep its doors open for further policy tightening and maintain the dialogue of ‘higher for longer interest rates’. The near-term outlook for bullion remains upbeat amid deepening Middle East tensions.
The Israeli army prepares for a ground invasion in Gaza to demolish the Palestinian military while the US keeps urging the former to delay a ground assault as it could impact the hostage situation. Neighboring Jordan warned that Israel’s ground war in Gaza would result in a humanitarian catastrophe of epic proportions. Going forward, investors will look for the UN Security Council meeting to discuss potential solutions for a ceasefire in the Israel-Palestine conflict.
Daily Digest Market Movers: Gold price slips nominally ahead of Fed policy
- Gold price edges down from five-month high near $2,010.00 as investors await the monetary policy decision by the Federal Reserve, which will be announced on Wednesday.
- The near-term demand for the Gold price remains upbeat as Middle East tensions keep safe-haven bids firmer.
- The US urged Israel to delay ground invasion in Gaza as it could derail hostage negotiations.
- Investors await the United Nations (UN) Security Council meeting, requested by the UAE, to discuss potential ground assault by Israel in Gaza, which could lead to plenty of casualties.
- An official from the Palestinian military has requested the immediate implementation of a UN general assembly decision to allow aid to the Gaza strip.
- The US Dollar Index (DXY) consolidates in a tight range as investors keenly await the Fed’s interest rate decision.
- As per the CME Fedwatch tool, traders see the Fed keeping interest rates unchanged at 5.25-5.50% almost certain. The odds of one more interest rate increase in any of the two remaining monetary policy meetings in 2023 have risen to 24% from 20% recorded last week.
- Tight financial conditions due to higher US long-term bond yields, moderately easing price pressures and deepening Middle East tensions are expected to allow Fed policymakers to maintain the status-quo consecutively for the second time.
- Cleveland Fed Bank President Loretta Mester said recently that higher bond yields are equivalent to one interest rate hike of 25 basis points (bps). The Fed could use higher Treasury yields as a substitute for further policy tightening.
- 10-year US Treasury yields have risen to 4.85% and are expected to expand further amid budget deficit worries.
- The core Personal Consumption Expenditure (PCE) inflation data released on Friday showed that inflation is broadly stubborn due to robust consumer spending.
- Monthly US core PCE accelerated at an expected pace of 0.3% in September against 0.1% growth in August. The annual core PCE rose by 3.7% but decelerated from August reading of 3.9%.
- In addition to the Fed’s monetary policy decision, investors would look for ADP Employment Change and the ISM Manufacturing PMI for October, which will be published on Wednesday.
- The release of the US factory data will be of utmost importance. A survey from S&P Global showed last week that the US Manufacturing PMI met the 50.0 threshold for the first time after 11 months. 50 is the threshold distinguishing expansion from contraction. If the US factory data manages to do so, the Fed will probably discuss keeping interest rates higher for a much longer period.
Technical Analysis: Gold price edges down from five-month high
Gold price falls nominally from five-month high of $2,009 as investors remain concerned about the interest rate guidance from the Fed, which will be delivered on Wednesday. The precious metal stabilizes above the crucial resistance of around $1,990, which is now acting as a major support for the Gold bulls. The broader Gold demand outlook turns bullish as the 20-day Exponential Moving Average (EMA) has delivered a bullish crossover above the 50 and 200-day EMAs.
Gold FAQs
Why do people invest in Gold?
Gold has played a key role in human’s history as it has been widely used as a store of value and medium of exchange. Currently, apart from its shine and usage for jewelry, the precious metal is widely seen as a safe-haven asset, meaning that it is considered a good investment during turbulent times. Gold is also widely seen as a hedge against inflation and against depreciating currencies as it doesn’t rely on any specific issuer or government.
Who buys the most Gold?
Central banks are the biggest Gold holders. In their aim to support their currencies in turbulent times, central banks tend to diversify their reserves and buy Gold to improve the perceived strength of the economy and the currency. High Gold reserves can be a source of trust for a country’s solvency. Central banks added 1,136 tonnes of Gold worth around $70 billion to their reserves in 2022, according to data from the World Gold Council. This is the highest yearly purchase since records began. Central banks from emerging economies such as China, India and Turkey are quickly increasing their Gold reserves.
How is Gold correlated with other assets?
Gold has an inverse correlation with the US Dollar and US Treasuries, which are both major reserve and safe-haven assets. When the Dollar depreciates, Gold tends to rise, enabling investors and central banks to diversify their assets in turbulent times. Gold is also inversely correlated with risk assets. A rally in the stock market tends to weaken Gold price, while sell-offs in riskier markets tend to favor the precious metal.
What does the price of Gold depend on?
The price can move due to a wide range of factors. Geopolitical instability or fears of a deep recession can quickly make Gold price escalate due to its safe-haven status. As a yield-less asset, Gold tends to rise with lower interest rates, while higher cost of money usually weighs down on the yellow metal. Still, most moves depend on how the US Dollar (USD) behaves as the asset is priced in dollars (XAU/USD). A strong Dollar tends to keep the price of Gold controlled, whereas a weaker Dollar is likely to push Gold prices up.
Consumer Credit in the United Kingdom advanced £1.391B in September, missing the £1.4B rise expected by markets. In August, United Kingdom Consumer Credit had increased by a revised £1.681B compared with the £1.644B rise previously estimated.
What is the United Kingdom Consumer Credit?
The Consumer Credit released by the Bank of England is an amount of money that individuals borrowed in the previous month. It shows if consumers can afford large expenses, which can fuel economic growth. However, a high figure may also indicate that the economy is overheating, as consumers borrow in order to live beyond their means. A high reading is seen as positive for the GBP, whereas a low reading is seen as negative.
When is the next United Kingdom Consumer Credit report released?
The next United Kingdom Consumer Credit data will be published on November 29 at 09:30 GMT. For more information, check the United Kingdom Consumer Credit entry in FXStreet Calendar.
Pound Sterling price today
The table below shows the percentage change of Pound Sterling (GBP) against listed major currencies today. Pound Sterling was the weakest against the New Zealand Dollar.
| USD | EUR | GBP | CAD | AUD | JPY | NZD | CHF | |
| USD | -0.17% | -0.15% | -0.09% | -0.45% | -0.07% | -0.46% | 0.07% | |
| EUR | 0.17% | 0.03% | 0.06% | -0.28% | 0.09% | -0.29% | 0.24% | |
| GBP | 0.15% | -0.02% | 0.02% | -0.32% | 0.08% | -0.33% | 0.23% | |
| CAD | 0.11% | -0.10% | -0.04% | -0.36% | 0.01% | -0.37% | 0.15% | |
| AUD | 0.45% | 0.29% | 0.32% | 0.35% | 0.39% | -0.01% | 0.53% | |
| JPY | 0.07% | -0.09% | 0.02% | -0.06% | -0.40% | -0.41% | 0.14% | |
| NZD | 0.47% | 0.28% | 0.32% | 0.37% | 0.01% | 0.38% | 0.51% | |
| CHF | -0.09% | -0.26% | -0.23% | -0.18% | -0.53% | -0.16% | -0.55% |
The heat map shows percentage changes of major currencies against each other. The base currency is picked from the left column, while the quote currency is picked from the top row. For example, if you pick the Euro from the left column and move along the horizontal line to the Japanese Yen, the percentage change displayed in the box will represent EUR (base)/JPY (quote).
An automation tool was used in creating this post.
EUR/CHF recently approached the lows of September 2022 near 0.9410 and has embarked on a rebound. Economists at Société Générale anlayze the pair’s outlook.
Multi-year trend line near 0.9630 must be overcome to affirm a meaningful up-move
Daily MACD has started posting positive divergence denoting receding downward momentum.
A short-term bounce can’t be ruled out however multi-year trend line near 0.9630 must be overcome to affirm a meaningful up-move.
In case the pair fails to defend 0.9410, there could be risk of an extended downtrend.
- NZD/USD turns sideways after a sharp recovery to near 0.5820 ahead of Fed policy.
- The Fed is expected to keep interest rates unchanged but will keep doors open for further policy-tightening.
- NZ Q3 labor market data would trigger action in the New Zealand Dollar.
The NZD/USD pair clings to gains after a significant recovery from 11-month low around 0.5770. The Kiwi asset oscillates above 0.5800 as the focus shifts to the interest rate decision by the Federal Reserve (Fed), which will be announced on Wednesday.
S&P500 futures added significant gains in the European session, portraying an improvement in the risk-appetite of the market participants. US equities generated decent gains as investors hope that the Fed will keep interest rates unchanged in the range of 5.25-5.50% on Wednesday.
The Fed may keep interest rates steady but will keep doors open for further policy-tightening as inflation is still far from the desired rate of 2% and robust consumer spending due to tight labor market conditions could boost consumer inflation expectations.
The US Dollar Index (DXY) remains subdued near 106.50 in a data-packed week. The market participants would watch for private payrolls data and the ISM Manufacturing PMI for October, which will be published on Wednesday.
Investors will keenly observe the factory data as a recent survey from S&P Global showed that Manufacturing PMI met the 50.0 threshold for the first time after contracting for straight 11 months. A figure below the 50.0 threshold is considered as contraction.
On the New Zealand front, investors await the Q3 Employment data, which will be released on Tuesday. As per the consensus, hiring rose by 0.4% against 1.0% reading from the previous quarter. The Unemployment Rate is seen increasing to 3.9% against 3.6% recorded in the second quarter of 2023. The quarterly labor cost index eased marginally to 1.0% against the former reading of 1.1%.
Euro can still be moved by data. Economists at ING analyze EUR outlook ahead of Eurozone GDP and inflation reports.
GDP data could take its toll
The early part of this week should see plenty of soft Eurozone data, be it third-quarter GDP data or the October inflation prints. The consensus for Tuesday's third-quarter eurozone GDP print is 0.0% quarter-on-quarter. Presumably, another soft release along with softer CPI data will cement views that the ECB's tightening cycle is over and could leave the Euro vulnerable.
It is going to require some soft US data to turn this EUR/USD bearish trend around.
1.0500-1.0600 could well be the EUR/USD range this week.
- GBP/JPY drifts lower for the second straight day and slides to a fresh multi-week low on Monday.
- Expectations that the BoE is done raising rates undermine the GBP and exert pressure on the cross.
- Hope for a change in the BoJ’s YCC policy benefits the JPY and contributes to the ongoing decline.
- The downside seems limited as traders now await the BoJ and the BoE policy meetings this week.
The GBP/JPY cross remains under some selling pressure for the second successive day on Monday and drops to over a three-week low, around the 180.75 region during the first half of the European session. Spot prices, however, manage to rebound a few pips in the last hour and currently trade just above the 181.00 mark, still down over 0.15% for the day.
The British Pound's (GBP) relative underperformance comes on the back of expectations that the Bank of England (BoE) will leave the benchmark interest rate on hold at a 15-year high of 5.25% for the second successive time to support the ailing economy. In contrast, investors have been speculating about a possible change in the Bank of Japan's (BoJ) yield curve control (YCC) policy in the wake of a sign of broadening price pressures. This, in turn, is seen lending some support to the Japanese Yen (JPY) and contributing to the offered tone surrounding the GBP/JPY cross.
The Japanese central bank, however, is widely anticipated to stick to its negative policy rates. This, along with a positive tone around the equity markets, caps gains for the safe-haven JPY and helps limit the downside for the GBP/JPY cross. Traders also seem reluctant to place aggressive directional bets and prefer to wait on the sidelines ahead of the key central bank event risks – the BoJ policy meeting on Tuesday, followed by the BoE policy update on Thursday. This, in turn, warrants some caution for bearish traders and positioning for any further depreciating move.
From a technical perspective, the recent repeated failures to find acceptance above the 50-day Simple Moving Average (SMA) and the subsequent decline suggest that the path of least resistance for the GBP/JPY cross favours bearish traders. Moreover, oscillators on the daily chart have just started drifting in the negative territory and support prospects for further losses. Hence, some follow-through weakness towards the 180.40 intermediate support, en route to the 180.00 psychological mark, looks like a distinct possibility.
Technical levels to watch
- German GDP arrives at -0.1% QoQ in Q3 vs. -0.3% anticpated.
- Annualized German GDP stands at -0.3% in Q3 vs. -0.7% expected.
- EUR/USD catches a bid on upbeat German Q3 GDP figures.
The German economy shrank 0.1% over the quarter in the third quarter of 2023, compared with expectations of a 0.3% contraction and 0% booked in Q2, the preliminary report published by Destatis showed on Monday.
Meanwhile, the GDP rate dropped at an annual pace of 0.3% in Q3 against the previous reading of -0.2% and beat the market consensus of a 0.7% deceleration.
EUR/USD reaction to the German GDP data
EUR/USD catches a minor bid on the encouraging German GDP report, rising 0.2% on the day to trade at 1.0565. The pair erased losses on the data release.
Euro price today
The table below shows the percentage change of Euro (EUR) against listed major currencies today. Euro was the strongest against the Swiss Franc.
| USD | EUR | GBP | CAD | AUD | JPY | NZD | CHF | |
| USD | -0.02% | 0.01% | -0.05% | -0.32% | -0.07% | -0.32% | 0.05% | |
| EUR | 0.02% | -0.02% | -0.03% | -0.31% | -0.06% | -0.30% | 0.06% | |
| GBP | -0.02% | 0.02% | -0.09% | -0.36% | -0.09% | -0.35% | 0.03% | |
| CAD | 0.08% | 0.08% | 0.06% | -0.28% | -0.03% | -0.28% | 0.09% | |
| AUD | 0.32% | 0.31% | 0.34% | 0.25% | 0.26% | 0.00% | 0.39% | |
| JPY | 0.07% | 0.03% | 0.17% | 0.00% | -0.25% | -0.27% | 0.13% | |
| NZD | 0.33% | 0.31% | 0.34% | 0.28% | 0.01% | 0.25% | 0.37% | |
| CHF | -0.06% | -0.06% | -0.03% | -0.10% | -0.32% | -0.13% | -0.37% |
The heat map shows percentage changes of major currencies against each other. The base currency is picked from the left column, while the quote currency is picked from the top row. For example, if you pick the Euro from the left column and move along the horizontal line to the Japanese Yen, the percentage change displayed in the box will represent EUR (base)/JPY (quote).
About German Preliminary GDP
The Gross Domestic Product released by the Statistisches Bundesamt Deutschland is a measure of the total value of all goods and services produced by Germany. The GDP is considered as a broad measure of German economic activity and health. A high reading or a better-than-expected number has a positive effect on the EUR, while a falling trend is seen as negative (or bearish).
- Crude oil retraces the recent gains as investors adopt caution ahead of Fed decision.
- Investors await Chinese PMI data; seeking cues on world's leading crude importer’s economic scenario.
- Upward 10-year US Treasury yield could provide support in underpinning the US Dollar.
Western Texas Intermediate (WTI) trades lower near $83.90 per barrel during the European session on Monday. Investors are approaching the upcoming US Federal Reserve policy meeting and China's manufacturing data with caution, leading to a decline in crude oil prices. This cautious stance is overshadowing the support previously provided by tensions in the Middle East.
Crude oil prices saw an increase on Friday as Israel expanded ground operations in Gaza. This has raised concerns about the potential widening of the conflict in a region responsible for a third of global oil production.
Looking at China, the upcoming release of manufacturing and services PMI data for October is eagerly awaited. Investors seek for signals indicating stabilization in the world's leading crude importer's economy. Market participants are particularly interested in gauging whether supportive measures implemented by Beijing have contributed to an improvement in Oil demand.
The US Dollar (USD) encounters resistance as market expectations lean towards the likelihood of the US Federal Reserve (Fed) maintaining interest rates at 5.5% in the upcoming Wednesday meeting. However, the US Dollar Index (DXY) shows positive movement post lukewarm intraday performance during the Asian session, hovering around 106.70 as of now.
The 10-year US Bond experiences a rebound, reaching 4.85% at the moment, providing support to the Greenback. Additionally, investors will closely monitor key indicators such as the US ADP Employment Change and the ISM Manufacturing PMI for October.
European Central Bank (ECB) Governing Council member Peter Kazimir said on Monday, “we will have to stay at the peak for the next few quarters, bets on rate cuts happening already in the first half of next year are entirely misplaced.”
Additional quotes
Voices coining end of rate hike cycle "should hold their horses", it’s too soon to declare victory and say the job’s done.
Upside inflation risks have yet to dissipate entirely, we must stay vigilant.
Additional tightening could come if incoming data force us.
I will eagerly await the December update of our inflation forecast to get a clearer picture; March is another milestone.
Market reaction
At the time of writing, EUR/USD is moving back and forth around 1.0550, awaiting the German growth and inflation data for a fresh direction.
After USD/JPY breached the psychological mark of 150 at least on a temporary basis, Tuesday’s BoJ meeting has become a little more interesting. Antje Praefcke, FX Analyst at Commerzbank, analyze Yen’s outlook ahead of the Monetary Policy Statement .
BoJ will leave its monetary policy unchanged
Pressure on the BoJ to make changes is mounting. However, it is questionable whether it will give in to this pressure this week. The BoJ has proven in the past that it can surprise the markets, but it has also illustrated that it finds it very, very difficult to exit its ultra-expansionary monetary policy. I therefore think that it will leave its monetary policy unchanged on Tuesday.
If it brings itself to adjust its yield target to the upside after all that would initially be positive for the Yen, but as happened before, the effect might evaporate again quickly if the market considers it to be mainly a reaction to current conditions and less as a first step towards an exit.
- The Euro looks offered vs. the US Dollar on Monday.
- European stocks open the week in a mixed tone.
- Germany’s flash GDP Growth Rate, Inflation Rate take centre stage.
Thus far, the Euro (EUR) appears vulnerable against the US Dollar (USD), prompting EUR/USD to trade within a tight scope around the mid-1.0500s early in the European morning on Monday.
In the interim, the Greenback manages to maintain its position in the upper limits of the recent range near 106.70, when calculated by the USD Index (DXY). The so-far modest strengthening of the index coincides with an equally languid climb in US yields across diverse timeframes.
Within the realm of monetary policy, a growing consensus has materialized amongst market participants that the Federal Reserve (Fed) will preserve its present stance of retaining interest rates unchanged at the upcoming meeting on November 1. The potential remains, however, for a potential shift in rates come December, a view that seems well reinforced by the resilience of the US economy and still elevated inflation levels.
Regarding the European Central Bank (ECB), no surprises arose at its event on October 26 following a unanimous decision to keep its interest rates unchanged. President Christine Lagarde reiterated once more that work remains to be done pertaining to inflation, while it is anticipated inflation will persist too elevated for too extensive a duration. Adding a bearish undertone to the meeting, Lagarde acknowledged that risks to the outlook appear skewed downward.
From the speculative community’s viewpoint, net longs in the single currency increased to four-week highs in the week ended on October 24 according to the CFTC report. The period under scrutiny coincides with some consolidation in the pair against the backdrop of persistent resilience of the US economy and rising cautiousness prior to the ECB event.
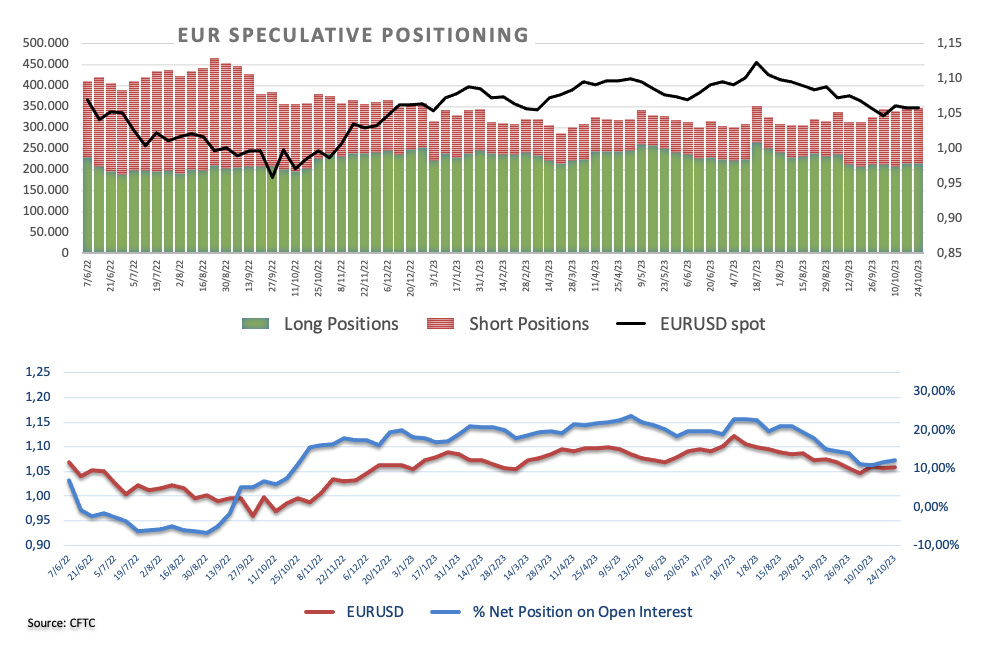
Busy day in the euro calendar, as Germany’s advanced figures for the GDP Growth Rate are due seconded by preliminary Inflation Rate for the month of October. In the broader euro area, final Consumer Confidence prints come first seconded by Economic Sentiment and Industrial Sentiment.
Daily digest market movers: Euro faces some downside pressure on USD strength
- The EUR remains on the defensive vs. the USD.
- US and German yields appear mixed at the beginning of the week.
- There is still scope for the Fed to raise rates in December.
- The ECB is seen extending its pause until H2 2024.
- The Middle East conflict threatens to extend to other regions.
- Investors continue to factor in further FX intervention around USD/JPY.
- Retail Sales in Australia expanded more than expected tin September.
- Preliminary Inflation Rate in Spain came in at 3.5% YoY in October.
Technical Analysis: Euro does not rule out extra losses
EUR/USD looks poised to extend the price action around the mid-1.0500s at the beginning of the week.
In case sellers push harder, EUR/USD could revisit the weekly low of 1.0495 (October 13), ahead of the lowest level in 2023 at 1.0448 (October 15), and the round number of 1.0400.
On the upside, the immediate short-term target for the pair emerges at the October high of 1.0694 (October 24), a level that appears reinforced by the proximity of the temporary 55-day SMA (1.0673). Further up comes the weekly top of 1.0767 (September 12) before the key 200-day SMA at 1.0810, and another weekly high of 1.0945 (August 30), all ahead of the psychological level of 1.1000. Beyond this zone, the pair might face resistance at the August top at 1.1064 (August 10), prior to the weekly peak of 1.1149 (July 27) and the 2023 high at 1.1275 (July 18).
So far, the pair’s outlook is expected to remain negative while below the critical 200-day SMA.
Euro FAQs
What is the Euro?
The Euro is the currency for the 20 European Union countries that belong to the Eurozone. It is the second most heavily traded currency in the world behind the US Dollar. In 2022, it accounted for 31% of all foreign exchange transactions, with an average daily turnover of over $2.2 trillion a day.
EUR/USD is the most heavily traded currency pair in the world, accounting for an estimated 30% off all transactions, followed by EUR/JPY (4%), EUR/GBP (3%) and EUR/AUD (2%).
What is the ECB and how does it impact the Euro?
The European Central Bank (ECB) in Frankfurt, Germany, is the reserve bank for the Eurozone. The ECB sets interest rates and manages monetary policy.
The ECB’s primary mandate is to maintain price stability, which means either controlling inflation or stimulating growth. Its primary tool is the raising or lowering of interest rates. Relatively high interest rates – or the expectation of higher rates – will usually benefit the Euro and vice versa.
The ECB Governing Council makes monetary policy decisions at meetings held eight times a year. Decisions are made by heads of the Eurozone national banks and six permanent members, including the President of the ECB, Christine Lagarde.
How does inflation data impact the value of the Euro?
Eurozone inflation data, measured by the Harmonized Index of Consumer Prices (HICP), is an important econometric for the Euro. If inflation rises more than expected, especially if above the ECB’s 2% target, it obliges the ECB to raise interest rates to bring it back under control.
Relatively high interest rates compared to its counterparts will usually benefit the Euro, as it makes the region more attractive as a place for global investors to park their money.
How does economic data influence the value of the Euro?
Data releases gauge the health of the economy and can impact on the Euro. Indicators such as GDP, Manufacturing and Services PMIs, employment, and consumer sentiment surveys can all influence the direction of the single currency.
A strong economy is good for the Euro. Not only does it attract more foreign investment but it may encourage the ECB to put up interest rates, which will directly strengthen the Euro. Otherwise, if economic data is weak, the Euro is likely to fall.
Economic data for the four largest economies in the euro area (Germany, France, Italy and Spain) are especially significant, as they account for 75% of the Eurozone’s economy.
How does the Trade Balance impact the Euro?
Another significant data release for the Euro is the Trade Balance. This indicator measures the difference between what a country earns from its exports and what it spends on imports over a given period.
If a country produces highly sought after exports then its currency will gain in value purely from the extra demand created from foreign buyers seeking to purchase these goods. Therefore, a positive net Trade Balance strengthens a currency and vice versa for a negative balance.
FX option expiries for Oct 30 NY cut at 10:00 Eastern Time, via DTCC, can be found below.
EUR/USD: EUR amounts
- 1.0525 350m
- 1.0540 504m
- 1.0550 1.8b
- 1.0600 929m
- 1.0640 810m
- 1.0650 858m
GBP/USD: GBP amounts
- 1.2145 396m
USD/JPY: USD amounts
- 149.00 720m
- 149.50 1.5b
- 150.50 809m
AUD/USD: AUD amounts
- 0.6510 1.1b
USD/CAD: USD amounts
- 1.3775 374m
- 1.3820 606m
Sterling is trading slightly on the soft side ahead of Thursday's Bank of England (BoE) policy meeting. Economists at ING analyze GBP outlook.
EUR/GBP may struggle to hold gains over 0.8700
We think a 6-3 vote for unchanged rates should not unduly hit the Pound. However, it seems investors are taking a slightly dimmer view of the GBP.
A strong Dollar should probably keep GBP/USD not far from the 1.2050/2100 support region.
Soft Eurozone data this week suggests EUR/GBP may struggle to hold gains over 0.8700.
USD/CNH is expected to cling to the current 7.3050-7.3470 range for the time being, comment UOB Group’s Markets Strategist Quek Ser Leang and Senior FX Strategist Peter Chia.
Key Quotes
24-hour view: Last Friday, we noted that “the price action is likely part of a consolidation phase,” and we expected USD to “trade sideways in a range of 7.3150/7.3350.” USD then traded in a slightly narrower range of 7.3161/7.3351. While USD is likely to continue to trade in a range, the slightly firm underlying tone suggests a higher range of 7.3170/7.3380.
Next 1-3 weeks: Our latest narrative was from last Thursday (26 Oct, spot at 7.3260), wherein the recent buildup in downward momentum has faded, and USD is likely to trade in a range between 7.3050 and 7.3470 the time being. There is on change in our view.
- EUR/GBP receives upward support before the releases of economic data from Germany.
- German GDP is expected to decline by 0.3% (QoQ); the yearly index suggests a 0.7% decrease.
- Investors adopt cautious stance ahead of the BoE policy meeting.
EUR/GBP extends gains on the second successive day, trading near 0.8720 during the early European session on Monday. The cross pair receives upward support ahead of the key economic data releases from Germany.
However, the preliminary German Gross Domestic Product (GDP) is anticipated to shrink by 0.3% quarter on quarter, with the yearly index poised for a 0.7% decrease compared to the 0.2% decline in the previous report. Meanwhile, the initial outlook for the Consumer Price Index (MoM) suggests a decline to 0.2% from the previous 0.3%.
Additionally, the Euro experienced declines following the decision of the European Central Bank (ECB) to maintain the deposit rate at 4.0%, attributing the choice to a deteriorating economic outlook for the Eurozone.
ECB President Christine Lagarde is in for a balancing act, steering the central bank through a tricky economic landscape. Navigating between a weakening economy and robust inflationary pressures is no small feat. With the added complexity of monitoring the Middle East crisis, staying data-dependent seems like a wise strategy.
On the other side, the Pound Sterling (GBP) faces challenge as the traders adopt cautious stance ahead of the Bank of England (BoE) policy meeting scheduled on Thursday, with widespread anticipations that the central bank will maintain the current interest rates at a 15-year high of 5.25% over growing fears about recession.
The United Kingdom's economy is feeling the pinch of elevated interest rates, compounding the challenges posed by persistent inflation. Economic data indicates notable contractions in various sectors, with the burden of high inflation adding pressure to household budgets.
- The index trades without direction around 106.60.
- Cautiousness should prevail ahead of the FOMC event.
- Nonfarm Payrolls will be the salient release later in the week.
The USD Index (DXY), which tracks the greenback vs. a bundle of its main competitors, extends the consolidative mood around the 106.60 at the beginning of the week.
USD Index remains capped by 107.00
The index trades in a vacillating mood on Monday on the back of increasing prudence among investors in light of key upcoming events in the US economy, namely: the Federal Reserve’s interest rate decision (Wednesday) and the publication of October’s Nonfarm Payrolls (Friday).
In the meantime, US yields navigate in an equally directionless pattern in the upper end of the recent range, particularly in the belly and the short end of the curve vs. some loss of momentum in the short end.
On another front, speculators increased their USD net longs positions to the highest level since mid-December 2022 during the week ended on October 24, as per the CFTC report. During this period, the greenback remained side-lined amidst speculation that the Fed might extend its restrictive stance for longer than anticipated, a view that appeared propped up by auspicious results from US fundamentals.
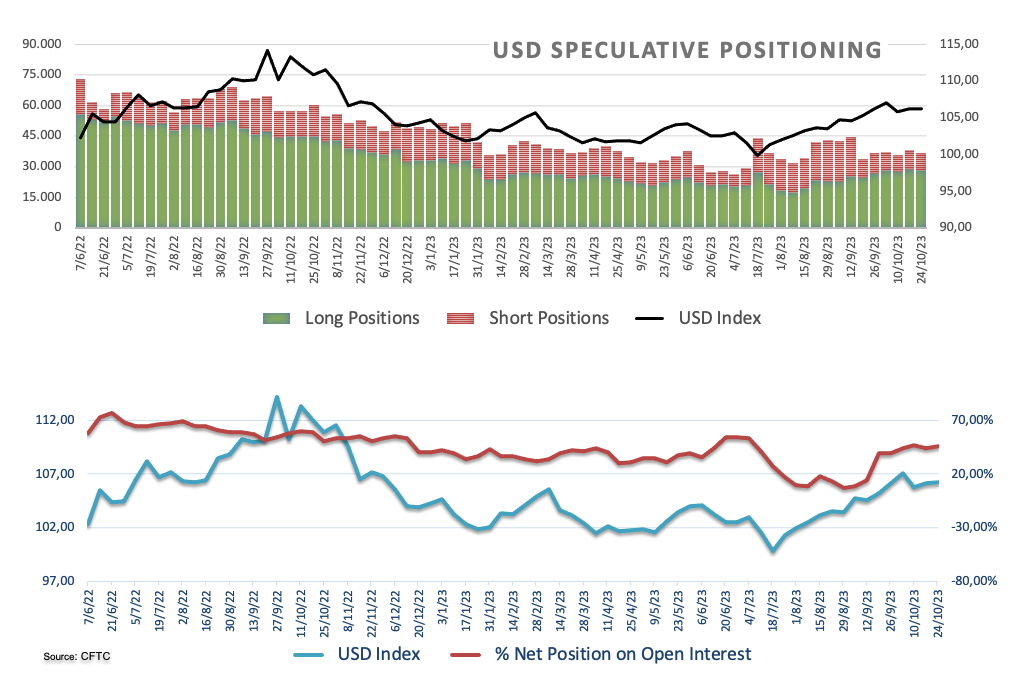
There will be no scheduled data releases on Monday in the US calendar.
What to look for around USD
The upside momentum in the index seems to have met some initial obstacle just below the 107.00 barrier so far this week.
In the meantime, support for the dollar keeps coming from the good health of the US economy and still elevated inflation, which morphs into higher yields and underpins the renewed tighter-for-longer narrative from the Federal Reserve.
Key events in the US this week: Employment Cost, FHFA House Price Index, CB Consumer Confidence (Tuesday) – MBA Mortgage Applications, ADP Report, Final Manufacturing PMI, ISM Manufacturing, Construction Spending, FOMC Interest Rate Decision, Powell press conference (Wednesday) - Initial Jobless Claims, Factory Orders (Thursday) – Nonfarm Payrolls, Unemployment Rate, Services PMI, ISM Services PMI (Friday).
Eminent issues on the back boiler: Persistent debate over a soft or hard landing for the US economy. Speculation of rate cuts in late 2024. Geopolitical effervescence vs. Russia and China. Potential spread of the Middle East crisis to other regions.
USD Index relevant levels
Now, the index is up 0.06% at 106.64 and the breakout of 106.88 (weekly high October 26) could expose 107.34 (2023 high October 3) and finally 107.99 (weekly high November 21 2022). On the downside, initial contention aligns at 105.36 (monthly low October 24) ahead of 104.42 (weekly low September 11) and then 103.41 (200-day SMA).
The ECB rate decision is done, and the next important decision is almost upon us: the Fed meeting. Antje Praefcke, FX Analyst at Commerzbank, analyzes EUR/USD outlook ahead of the Interest Rate Decision.
The market will stick to its well-rehearsed pattern
The market will stick to its well-rehearsed pattern for now: positive data and the prospect of ‘high for longer’ will provide only limited support for the Dollar now, whereas data or comments that make the likelihood of rate cuts next year seem higher will put comparatively more downside pressure on it.
However, I would not expect the Dollar to collapse either, as the ECB meeting provided the market with fresh food for its expectation that the ECB too might cut rates again next year in view of stagnating growth.
If I had to decide in favour of one side or the other, I would choose the lower end in EUR/USD as being the more vulnerable, above all if the US labour market report due on Friday once again illustrates the resilience of the US economy. And due to the conflict in the Middle East.
USD/JPY is still seen trading within the 149.00-150.70 range in the next few weeks, according to UOB Group’s Markets Strategist Quek Ser Leang and Senior FX Strategist Peter Chia.
Key Quotes
24-hour view: We expected USD to trade in a range between 149.90 and 150.70 last Friday. However, USD fell to a low of 149.45 before ending the day on a soft note at 149.60 (-0.52%). Despite the relatively sharp drop, downward momentum has not improved much. That said, USD has scope to test 149.35 before the risk of a rebound increases. The major support at 149.00 is unlikely to come under threat. Resistance is at 150.00; a breach of 150.30 would mean that USD is not weakening further.
Next 1-3 weeks: Last Thursday (26 Oct, spot at 150.25), we highlighted that “while upward momentum is beginning to improve, in order for USD to advance in a sustained manner, it must break and stay above 150.50.” After USD rose to a high of 150.77 (and closed at 150.38), we highlighted on Friday that “upward momentum has not improved further, and the resistance level has moved higher.” We added, USD now “has to break clearly above 151.00 before a sustained advance is likely.” USD then dropped sharply to a low of 149.45. While our ‘strong support’ level at 149.35 has not been breached yet, upward momentum has largely dissipated. For now, USD is likely to trade in a range, probably between 149.00 and 150.70.
- Pound Sterling trades in a tight range as investors eye BoE monetary policy decision for further action.
- The BoE is expected to keep interest rates unchanged amid easing labor market conditions and subdued retail demand.
- Deepening Middle East tensions dent demand for risk-perceived assets.
The Pound Sterling (GBP) struggles to find a direction on Monday as investors await the interest rate decision from the Bank of England (BoE) for further decision-making. The GBP/USD pair trades sideways as the market mood turns quiet, with investors also seeking fresh developments over the Israel-Palestine conflict to take further action.
It is widely expected that the BoE will maintain the status quo on November 2 as subdued consumer spending and labor demand would not allow price pressures to accelerate further, but guidance on where the bank sees the interest rate peak and inflation will be keenly watched. Market participants would like to know if the central bank shares UK Prime Minister Rishi Sunak’s view of halving headline inflation to 5.4% by year-end.
Daily Digest Market Movers: Pound Sterling trades directionless
- The Pound Sterling is stuck in a tight range around 1.2120 as investors shift focus to the monetary policy meeting by the Bank of England, which will be announced on November 2.
- Soft labor demand, poor factory activity, weak consumer spending, and deepening geopolitical tensions are expected to allow BoE policymakers to keep interest rates unchanged at 5.25%.
- The policy divergence between the Federal Reserve and the BoE would continue if the latter maintained the status quo.
- The UK's labor market is going through a tough phase as firms are not confident about the overall demand due to higher interest rates and stubborn price pressures.
- UK employers shed jobs for the third time in a row in the three months to August as they are cutting heavily on workforce and inventory to achieve efficiency.
- Data from the UK job search website Adzuna showed that online vacancies and pay offers are falling. The Office for National Statistics (ONS) said its measure of job vacancies fell to a two-year low of 988K in the three months to September.
- Apart from the interest rate decision, investors await BoE guidance on the interest rate outlook. The BoE is expected to keep doors open for further policy tightening as inflation is significantly far from the desired rate of 2%.
- The doubts over UK Prime Minister Rishi Sunak’s promise of halving inflation to 5.4% by year-end are deepening as energy prices have rebounded due to Middle East tensions.
- The market mood remains downbeat as a ground invasion plan by the Israeli army in Gaza would dampen hostage negotiations.
- Meanwhile, the US Dollar Index (DXY) trades inside the Friday range, around 106.60, as investors shift focus to the Federal Reserve interest rate decision, which is scheduled for November 1.
- Mixed core Personal Consumption Expenditure (PCE) price index data and higher US bond yields are likely to prompt Fed policymakers to keep interest rates unchanged.
- Fed policymakers are of the view that higher bond yields have already tightened financial conditions, which would allow the central bank to keep interest rates unchanged in the range of 5.25%-5.50% for the second time in a row.
- Apart from the Fed’s monetary policy, investors will focus on the Automatic Data Processing (ADP) Employment Change and ISM Manufacturing PMI data for October.
Technical Analysis: Pound Sterling consolidates above 1.2100
Pound Sterling trades back and forth above the round-level support of 1.2100 as investors await monetary policy decisions by the BoE and the Fed. The broader GBP/USD pair outlook remains bearish as the 50-day and 200-day Exponential Moving Averages (EMAs) are declining. A decisive break below the immediate support of 1.2070 would expose the pair to the psychological support of 1.2000.
Pound Sterling FAQs
What is the Pound Sterling?
The Pound Sterling (GBP) is the oldest currency in the world (886 AD) and the official currency of the United Kingdom. It is the fourth most traded unit for foreign exchange (FX) in the world, accounting for 12% of all transactions, averaging $630 billion a day, according to 2022 data.
Its key trading pairs are GBP/USD, aka ‘Cable’, which accounts for 11% of FX, GBP/JPY, or the ‘Dragon’ as it is known by traders (3%), and EUR/GBP (2%). The Pound Sterling is issued by the Bank of England (BoE).
How do the decisions of the Bank of England impact on the Pound Sterling?
The single most important factor influencing the value of the Pound Sterling is monetary policy decided by the Bank of England. The BoE bases its decisions on whether it has achieved its primary goal of “price stability” – a steady inflation rate of around 2%. Its primary tool for achieving this is the adjustment of interest rates.
When inflation is too high, the BoE will try to rein it in by raising interest rates, making it more expensive for people and businesses to access credit. This is generally positive for GBP, as higher interest rates make the UK a more attractive place for global investors to park their money.
When inflation falls too low it is a sign economic growth is slowing. In this scenario, the BoE will consider lowering interest rates to cheapen credit so businesses will borrow more to invest in growth-generating projects.
How does economic data influence the value of the Pound?
Data releases gauge the health of the economy and can impact the value of the Pound Sterling. Indicators such as GDP, Manufacturing and Services PMIs, and employment can all influence the direction of the GBP.
A strong economy is good for Sterling. Not only does it attract more foreign investment but it may encourage the BoE to put up interest rates, which will directly strengthen GBP. Otherwise, if economic data is weak, the Pound Sterling is likely to fall.
How does the Trade Balance impact the Pound?
Another significant data release for the Pound Sterling is the Trade Balance. This indicator measures the difference between what a country earns from its exports and what it spends on imports over a given period.
If a country produces highly sought-after exports, its currency will benefit purely from the extra demand created from foreign buyers seeking to purchase these goods. Therefore, a positive net Trade Balance strengthens a currency and vice versa for a negative balance.
CME Group’s flash data for natural gas futures markets noted traders trimmed their open interest positions for the second session in a row on Friday, this time by around 1.1K contracts. Volume followed suit and went down by around 139.3K contracts, resuming the downtrend following the previous daily build.
Natural Gas: Increased volatility could reach $4.00
Prices of natural gas jumped past $3.60 for the first time since mid-January on Friday. The marked uptick, however, was on the back of dwindling open interest and volume and exposes some corrective move in the very near term. In the meantime, a retest of the $4.00 region should not be ruled out amidst the current backdrop of high volatility.
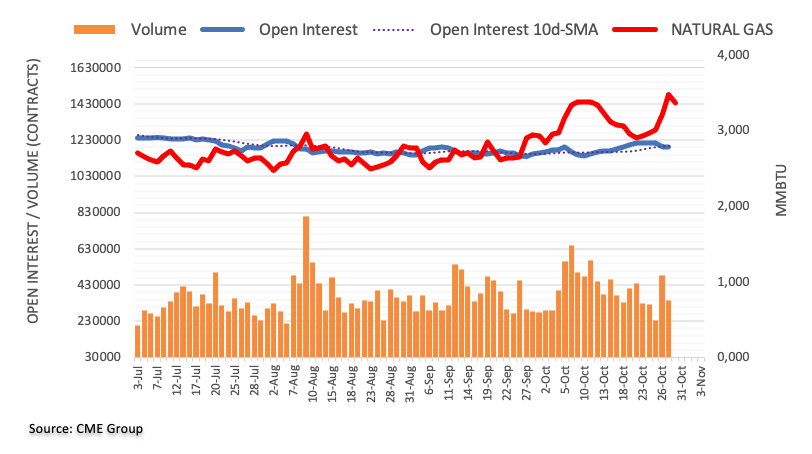
The BoJ faces a complex situation regarding its monetary policy. Economists at Standard Chartered analyze how the next BoJ Monetary Policy Statement could impact USD/JPY.
USD/JPY likely to trade just slightly north of 150 in the absence of policy shifts
In the absence of policy shifts by the BoJ, we expect USD/JPY to trade slightly north of 150. We think 10Y JGB yields will edge up towards the BoJ’s upper ceiling in a stepwise manner to take some of the pressure off the JPY. We would watch the December policy review for a potential encore of the end-2022 policy pivot by then.
Conversely, indications of policy tightening at the 31 October meeting – be it jettisoning the negative interest rate policy or YCC – could allow USD/JPY to trade closer to 145 though further upside may be limited by Japan’s stillwide rate differentials with the US.
In the opinion of UOB Group’s Markets Strategist Quek Ser Leang and Senior FX Strategist Peter Chia, AUD/USD keeps pointing to further side-lined trade for the time being.
Key Quotes
24-hour view: Our view for AUD to trade sideways between 0.6300 and 0.6355 last Friday was incorrect. Instead of trading sideways, AUD rose to 0.6368 before easing to close at 0.6334 (+0.19%). Despite the advance, there is no clear increase in upward momentum, and AUD is unlikely to advance much further. Today, AUD is more likely to trade sideways between 0.6315 and 0.6370.
Next 1-3 weeks: Last Thursday (26 Oct, spot at 0.6285), we held the view that the risk for AUD has swung to the downside, towards 0.6230. On Friday, AUD rebounded above our ‘strong resistance’ level of 0.6360 (high has been 0.6368). The breach of the ‘strong resistance’ level indicates that our view is incorrect. The current price action is likely part of a broad trading range, probably between 0.6270 and 0.6405.
- EUR/USD trades in negative territory for the second consecutive day.
- German Gross Domestic Product (GDP) for Q3 is expected to contract by 0.3% QoQ vs. 0.2% rise prior.
- Some analysts speculate that the Bank of Japan (BoJ) may tweak its yield curve control (YCC) approach.
- Traders will closely monitor the German GDP and CPI ahead of the BoJ policy meeting.
The EUR/JPY cross loses traction below the 158.00 mark during the early European trading hours on Monday. That being said, the weaker-than-expected Eurozone economic data triggers the fear of recession in the Eurozone and exerts some selling pressure on the Euro (EUR) against the Japanese Yen (JPY). The cross currently trades around 157.80, down 0.20% for the day.
Market players await the German Gross Domestic Product (GDP) for the third quarter (Q3), which is estimated to contract 0.3% QoQ versus 0.2% expansion in the previous reading. The worse-than-expected data could drag the EUR lower as Germany is the largest economy in Europe.
On the JPY’s front, the Bank of Japan monetary policy meeting will be the highlight this week. Some speculate that the BoJ may tweak its yield curve control (YCC) approach. According to a Reuters poll, economists anticipate the BoJ will end its negative interest rate policy next year, with more now expecting the central bank to abandon its ultra-accommodative monetary policy.
Market players will monitor the German Gross Domestic Product (GDP) for the third quarter (Q3) due later on Monday in the European session. Also, the preliminary Spanish Consumer Price Index (CPI) for October and the German CPI will be released. The focus will shift to BoJ's monetary policy decision on Tuesday. This event might trigger volatility in the financial markets and give a clear direction to the EUR/JPY cross.
Here is what you need to know on Monday, October 30:
Financial markets stay relatively calm to start the new week, which will feature key central bank policy meetings and high-tier macroeconomic data releases. In the European session, third-quarter Gross Domestic Product (GDP) and October Consumer Price Index (CPI) data from Germany will be watched closely by market participants.
The US Dollar (USD) Index moved sideways in a tight range on Friday as the Personal Consumption Expenditures (PCE) Price Index data from the US came largely in line with market expectations but managed to post modest weekly gains. Early Monday, the USD Index holds steady near 106.50 and the benchmark 10-year US Treasury bond yield fluctuates below 4.9%. On Wednesday, the Federal Reserve (Fed) will announce monetary policy decisions.
US Dollar price today
The table below shows the percentage change of US Dollar (USD) against listed major currencies today. US Dollar was the weakest against the New Zealand Dollar.
| USD | EUR | GBP | CAD | AUD | JPY | NZD | CHF | |
| USD | -0.03% | -0.15% | -0.07% | -0.32% | -0.24% | -0.44% | 0.03% | |
| EUR | 0.04% | -0.11% | -0.04% | -0.29% | -0.21% | -0.40% | 0.06% | |
| GBP | 0.15% | 0.10% | 0.05% | -0.20% | -0.11% | -0.31% | 0.16% | |
| CAD | 0.10% | 0.04% | -0.07% | -0.25% | -0.17% | -0.37% | 0.09% | |
| AUD | 0.32% | 0.30% | 0.19% | 0.24% | 0.09% | -0.12% | 0.35% | |
| JPY | 0.25% | 0.22% | 0.19% | 0.15% | -0.09% | -0.20% | 0.29% | |
| NZD | 0.45% | 0.41% | 0.29% | 0.37% | 0.10% | 0.18% | 0.44% | |
| CHF | -0.03% | -0.04% | -0.16% | -0.08% | -0.34% | -0.27% | -0.46% |
The heat map shows percentage changes of major currencies against each other. The base currency is picked from the left column, while the quote currency is picked from the top row. For example, if you pick the Euro from the left column and move along the horizontal line to the Japanese Yen, the percentage change displayed in the box will represent EUR (base)/JPY (quote).
Meanwhile, US stock index futures trade modestly higher on the day, pointing to an improvement in risk mood. Over the weekend, Israel's military continued fighting with Hamas in the northern region of Gaza as part of its ground operation. The UN Security Council is expected to hold an emergency meeting on Monday to discuss a pause in the conflict to provide humanitarian aid.
EUR/USD closed the previous week virtually unchanged and went into a consolidation phase at around 1.0550 to start the new week.
After stabilizing above 1.2100, GBP/USD moved sideways on Friday. Early Monday, the pair edged slightly higher but remained below 1.2150.
USD/JPY staged a rebound following the sharp decline on Thursday but lost its bullish momentum before reaching 150.00 on Friday. The pair was last seen moving up and down in a narrow channel near 149.50. In the early trading hours of the Asian session on Tuesday, the Bank of Japan (BoJ) will publish the interest rate decision and the monetary policy statement following the October meeting. The Japanese economic docket will also feature September Retail Trade and Unemployment Rate data.
Supported by the positive shift seen in risk sentiment, AUD/USD and NZD/USD pairs gained traction and were last seen trading at 0.6360 and 0.5835, respectively, both rising about 0.4% on a daily basis. NBS Manufacturing PMI and NBS Non-Manufacturing PMI surveys for October from China will be watched closely early Tuesday.
Gold price surged higher in the late American session on Friday and rose above $2,000 for the first time since May. XAU/USD started the new week with a small bearish gap and corrected lower toward $1,990.
Considering advanced prints from CME Group for crude oil futures markets, open interest went up for the second consecutive session, this time by around 14.8K contracts. On the other hand, volume shrank for the second straight session, now by around 67.8K contracts.
WTI: Gains appear so far capped by $90.00
Friday’s recovery in prices of WTI was on the back of increasing open interest and shrinking volume. Against that, the continuation of the multi-session consolidative phase appears on the cards in the very near term. In the meantime, the $90.00 per barrel continues to limit occasional bullish attempts for the time being.
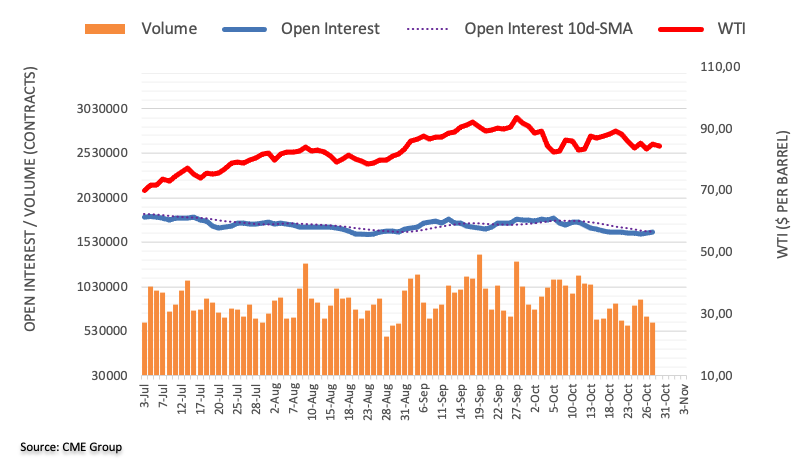
- USD/CHF continues to move on an upward trajectory despite the tepid US Dollar.
- The escalation of the Israel-Hamas war could provide support for the safe-haven Swiss Franc.
- Downbeat US Core PCE Price Index (YoY) weighed on the Greenback.
- The rebound in 10-year US Bond yield could underpin the buck.
USD/CHF attempts to continue the winning streak that began on Tuesday, treading waters near 0.9030 during the Asian session on Monday. The USD/CHF pair receives upward support despite the lukewarm performance of the US Dollar (USD).
The Greenback faces a barrier as the market expects that interest rates will likely remain consistent at 5.5% by the US Federal Reserve (Fed) in the upcoming meeting on Wednesday.
Additionally, the US Core Personal Consumption Expenditures Price Index (YoY) eased at 3.7% in September compared to the 3.8% readings from August, which might limit advances of the USD/CHF pair. However, the monthly data showed an increase, printed 0.3% readings as anticipated compared to the previous figure of 0.1% but failed to boost the USD.
The escalation of the Middle-East conflict could provide support for the safe-haven Swiss Franc (CHF) against the USD. Israel has expanded the ground operations in Gaza and attacked multiple Hamas sites.
The US Dollar Index (DXY) appears to be maintaining a subdued presence, with the decline in US Treasury yields on Friday. However, the 10-year US Bond yield shows indications of a rebound, standing at 4.87% by the press time.
On Wednesday, the downbeat ZEW Survey Expectations report showed that Switzerland's business conditions and labor market declined to 37.8 in October, from the previous decline of 27.6.
Investors will focus on the US ADP Employment Change, ISM Manufacturing PMI for October during the week. On the Swiss docket, Real Retail Sales (YoY) will be eyed on Tuesday.
GBP/USD maintains the downside pressure well in place and could revisit the 1.2040 zone in the near term, note UOB Group’s Markets Strategist Quek Ser Leang and Senior FX Strategist Peter Chia.
Key Quotes
24-hour view: We expected GBP to trade in a range between 1.2100 and 1.2170 last Friday. Our view of range trading was not wrong, even though it traded in a narrower range than anticipated (1.2106/1.2163). GBP then closed largely unchanged at 1.2123 (-0.04%). The consolidative price action suggests further range trading today, albeit likely in a lower range of 1.2085/1.2155.
Next 1-3 weeks: Last Thursday (26 Oct, spot at 1.2105), we highlighted that downward momentum is beginning to improve, and we were of the view that GBP is likely to test the early October near 1.2040. While GBP has not been able to make much headway on the downside and downward momentum has waned somewhat, there is still room for GBP to test 1.2040. Overall, only a breach of 1.2180 (‘strong resistance’ level previously at 1.2200) would indicate that the current downward pressure has faded.
Open interest in gold futures markets resumed the uptrend and rose by around 8.1K contracts on Friday according to preliminary readings from CME Group. Volume, instead, shrank for the second session in a row, this time by more than 3K contracts.
Gold shifts its attention to the 2023 top
Gold prices rose for the third session in a row on Friday, closing above the critical $2000 mark for the first time since mid-May. The daily gains came on the back of increasing open interest, leaving the door open to further upside in the very near term and with the immediate target at the YTD peak at $2067 per troy ounce (May 4).
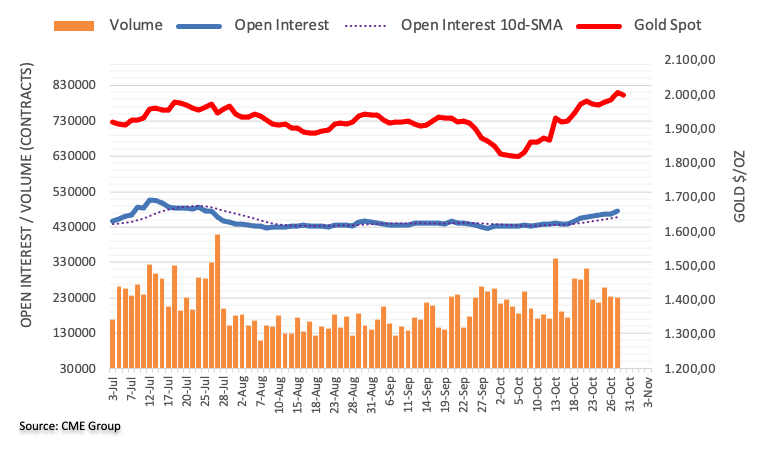
UOB Group’s Markets Strategist Quek Ser Leang and Senior FX Strategist Peter Chia suggest EUR/USD faces extra consolidation in the near term.
Key Quotes
24-hour view: After EUR dipped to 1.0520 last Thursday and rebounded, we highlighted last Friday that “the rebound has scope to extend to 1.0595, but the next resistance at 1.0620 is unlikely to come under threat.” We indicated that “support is at 1.0545, followed by 1.0530.” EUR then dipped to a low of 1.0534 and rebounded to 1.0597 before easing to close little changed for the day (1.0564, +0.04%). Momentum indicators are turning neutral, and today EUR is likely to trade sideways between 1.0535 and 1.0595.
Next 1-3 weeks: Our latest narrative for EUR was from last Wednesday (25 Oct, spot at 1.0595), wherein EUR is likely to trade in a range of 1.0510/1.0700 for now. Our view of range trading was not wrong, even though EUR traded in a narrower range than anticipated since last Wednesday. We continue to expect EUR to trade in a range. Given the lower volatility, the price movements in EUR are likely to remain in narrower range of 1.0510 to 1.0660 for now. At this time, it is unclear whether EUR will likely break below 1.0510 or above 1.0660 first.
- USD/JPY hovers around 149.65 ahead of the key events from the US and Japan.
- Core US PCE eased to 3.7% YoY in September vs. 3.8% prior, the monthly Core PCE rose by 0.3% vs. 0.1% prior.
- Analysts anticipate the Bank of Japan (BoJ) is nearing the end of its ultra-accommodative monetary policy.
- Market players will closely focus on the BoJ and Fed interest rate decisions on Tuesday and Wednesday, respectively.
The USD/JPY pair hovers around 149.65 after retracing from the monthly highs of 150.77 during the Asian session on Monday. Traders prefer to wait on the sidelines ahead of the monetary policy meeting from Japan and the US. These events might trigger volatility in the market.
That being said, the divergence in monetary policy between the US and Japan weighs on the Japanese Yen (JPY) against the US dollar (USD). There is some speculation that the Bank of Japan (BOJ) might tweak its yield curve control (YCC) policy. According to a Reuters poll, analysts believe the BoJ will end its negative interest rate policy next year, with more now anticipating the central bank is nearing ending its ultra-accommodative monetary policy.
On the other hand, the Federal Reserve (Fed) is expected to maintain interest rates steady at the end of its two-day meeting on Wednesday, despite the Fed's preferred inflation measure, the Core US Personal Consumption Expenditure Index (PCE), remains far over the 2% target. On Friday, the Core US PCE eased to 3.7% YoY in September versus 3.8% prior while the monthly Core PCE rose by 0.3% versus 0.1% prior. Furthermore, the September's headline PCE Price Index arrived at 3.4% YoY versus the expected 3.4%.
However, the Fed officials stated that recent economic data suggested that economic activity is growing at a solid pace while the job market remains robust. These upbeat reports raise expectations about additional rate hikes at the December meeting, which might boost the Greenback for the time being.
Looking ahead, the BoJ and Fed monetary policy meetings will be in the spotlight this week. Apart from this, the US ISM Manufacturing PMI for October and Initial Jobless Claims data will be released on Wednesday and Thursday, respectively. The attention will turn to US Nonfarm Payrolls on Friday, which is expected to add 172K jobs in October.
- Silver climbs to a one-week high on Monday, albeit struggles to capitalize on the move up.
- The technical setup seems tilted in favour of bulls and supports prospects for further gains.
- A sustained move beyond the $23.30-40 confluence is needed to reaffirm the positive bias.
Silver (XAG/USD) gains some positive traction for the second successive day and touches a one-week high, around the $23.20 area during the Asian session on Monday. The white metal, however, struggles to capitalize on the move and remains below the $23.30-$23.40 confluence, comprising the 200-day Simple Moving Average (SMA) and the 61.8% Fibonacci retracement level of the August-October downfall.
The aforementioned hurdle is followed by the $23.70-$23.75 supply zone, which should now act as a key pivotal point. Technical indicators on the daily chart, meanwhile, have been gaining positive traction and are still far from being in the overbought zone. Hence, a sustained strength beyond the said barriers will be seen as a fresh trigger for the XAG/USD bulls and pave the way for some meaningful appreciating move.
The subsequent move up could get extended beyond the $24.00 round-figure mark, towards testing the next relevant resistance near the $24.20 region. Some follow-through buying will confirm a fresh breakout and allow the XAG/USD to make a fresh attempt towards conquering the $25.00 psychological mark.
On the flip side, slide back below the $23.00 round figure now seems to find some support near the $22.85 region, or the 50% Fibo. level. The next relevant support is pegged near last week's swing low, around the $22.55 area, ahead of the 38.2% Fibo. level, around the $22.35-$22.30 static support. Failure to defend the said support levels might shift the bias in favour of the XAG/USD bears.
The downward trajectory could then get extended further towards the $22.00 round-figure mark, en route to the $21.70 region, representing 23.6% Fibo. level. Some follow-through selling could make the XAG/USD vulnerable to accelerate the fall further towards the $21.00 level before eventually dropping to the $20.70-$20.65 region, or its lowest level since March touched earlier this month.
Silver daily chart
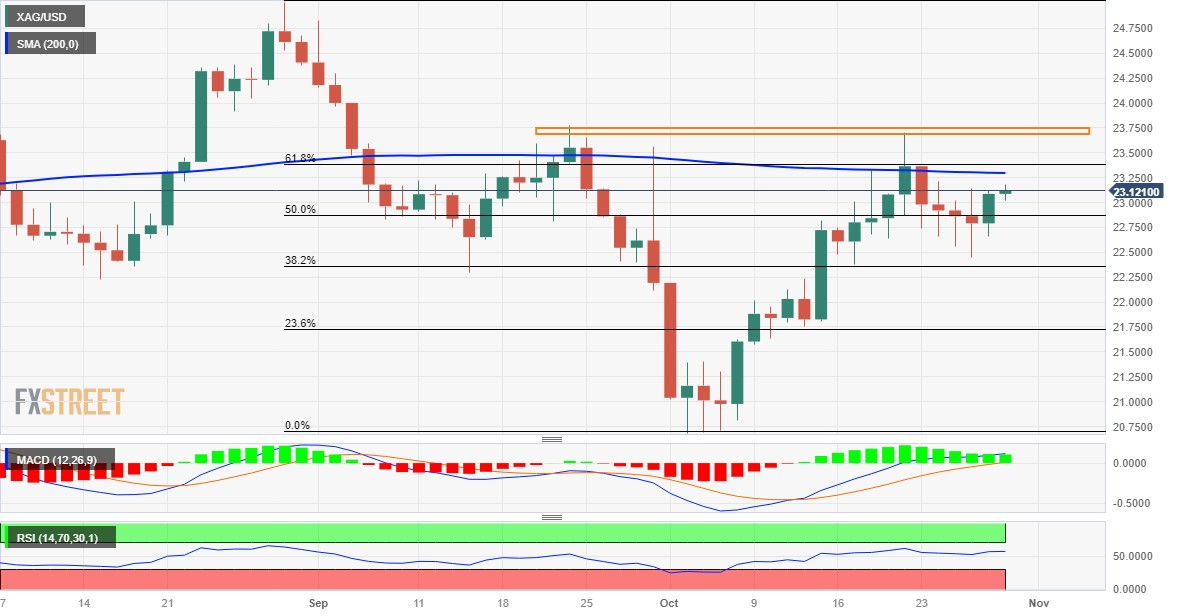
Technical levels to watch
- Asian stock equities trade mixed ahead of the key events from the US and Japan.
- The likelihood that the Bank of Japan (BOJ) might tweak its yield curve control (YCC) policy weighs on Japanese equities.
- The Chinese NBS Manufacturing PMI is expected to grow to 50.4 from the previous reading of 50.2.
- Market players will closely monitor the BoJ and Fed policy meetings.
Most Asian stocks trade mixed on Monday. Investors await the highly-anticipated Bank of Japan (BoJ) monetary policy meeting on Tuesday and the Federal Reserve (Fed) interest rate decision on Wednesday. These events could trigger volatility across the financial markets.
At press time, China’s Shanghai is up 0.17% to 3,022, the Shenzhen Component Index climbs 1.53% to 9,920, Hong Kong’s Hang Sang loses 0.28% to 17,349, South Korea’s Kospi gains 0.45%, India’s NIFTY 50 is down 0.43%, and Japan’s Nikkei leads losses by dropping 1.26%.
The speculation that the Bank of Japan (BOJ) might tweak its yield curve control (YCC) policy exerts pressure on Japanese equities. Many analysts believe the central bank will raise its inflation forecast to 2.0%, but they are divided on whether it will ultimately abandon YCC.
The Chinese NBS Purchasing Managers' Index (PMI) will be due on Tuesday. The nation’s Manufacturing PMI is expected to grow to 50.4 from the previous reading of 50.2. The stronger economic data might alleviate the fear of an economic slowdown in the world's second-largest economy.
On the Aussie front, consumer spending in Australia came in better than expected. The country’s Retail Sales climbed by 0.9% MoM in September, as against August’s 0.2% increase, better than the market expectation for an increase of 0.3%.
The BoJ and Fed rate decisions will be in the spotlight this week. Furthermore, market players will monitor Malaysia’s monetary policy decisions, South Korea's inflation, and Hong Kong's GDP later this week.
- EUR/USD lacks any firm intraday direction and oscillates in a narrow range on Monday.
- The formation of a bearish flag pattern supports prospects for some meaningful decline.
- A sustained strength beyond the 1.0700 mark is needed to negate the negative outlook.
The EUR/USD pair struggles to gain any meaningful traction on Monday and remains confined in a narrow trading band, just above mid-1.0500s through the Asian session.
The US economic resilience keeps the door open for one more rate hike by the Federal Reserve (Fed) and remains supportive of elevated US Treasury bond yields. This, in turn, is seen acting as a tailwind for the US Dollar (USD), which, along with the European Central Bank's (ECB) dovish outlook, continues to cap the upside for the EUR/USD pair.
From a technical perspective, the recent recovery from the 1.0445-1.0450 region, or the YTD low, has been along an upward-sloping channel. Against the backdrop of a sharp fall from a 17-month peak touched in June, this constitutes the formation of a bearish flag pattern and suggests that the path of least resistance for the EUR/USD pair is to the downside.
Moreover, negative oscillators on the daily chart add credence to the bearish outlook. That said, it will still be prudent to wait for a convincing break below the ascending channel support, around the 1.0540-1.0535 region, before positioning for a slide towards the 1.0500 mark. The EUR/USD pair could eventually drop to restest the 1.0450-1.0445 area or the YTD trough.
On the flip side, Friday's swing high, nearing the 1.0600 mark, now seems to act as an immediate hurdle. A sustained strength beyond has the potential to lift the EUR/USD pair towards the 1.0665-1.0670 intermediate resistance en route to the top end of the aforementioned trend channel, currently pegged just ahead of the 1.0700 round-figure mark.
The latter should act as a key pivotal point for short-term traders, which if cleared decisively will negate the bearish flag pattern and prompt aggressive short-covering move. The EUR/USD pair then aim to surpass the 1.0800 mark and challenge the 1.0810-1.0815 confluence, comprising the 100-day and the 200-day Simple Moving Averages (SMAs).
EUR/USD daily chart
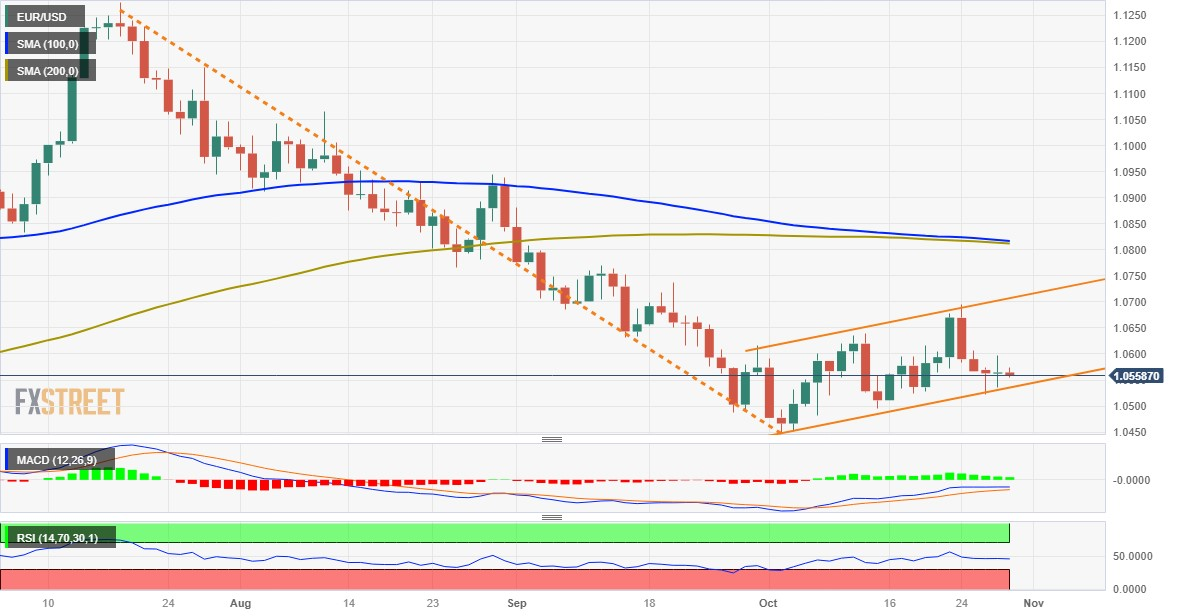
Technical levels to watch
- GBP/USD maintains its position ahead of the central banks’ policy decisions.
- The pair faces tepid momentum suggested by the MACD.
- Immediate support emerges at 1.2000; key resistance at 14-day EMA at 1.2162.
GBP/USD hovers around the 1.2120 level with a negative tone during the Asian session on Monday. The pair moves sideways ahead of the policy meetings of the US Federal Reserve (Fed) on Wednesday and the Bank of England (BoE) meeting on Thursday.
The GBP/USD pair could find immediate support at the 1.2000 psychological level. A firm break below the level could open the doors for the pair to navigate the region near the monthly low at 1.2037 level.
On the upside, the 1.2150 appears to be the key barrier aligned with the 14-day Exponential Moving Average (EMA) at 1.2162, following the 1.2200 major level. A firm breakthrough above the latter could support the GBP/USD pair to explore the area around the 23.6% Fibonacci retracement at the 1.2298 level.
The Moving Average Convergence Divergence (MACD) line persists below the centerline but stays above the signal line, suggesting a tepid momentum for the GBP/USD pair.
Moreover, The GBP/USD duo seems to be experiencing a subdued momentum, and the 14-day Relative Strength Index (RSI) is indicating a clear tilt toward weakness. The technical indicator, dipping below the 50 level, signals a potential bearish momentum.
GBP/USD: Daily Chart
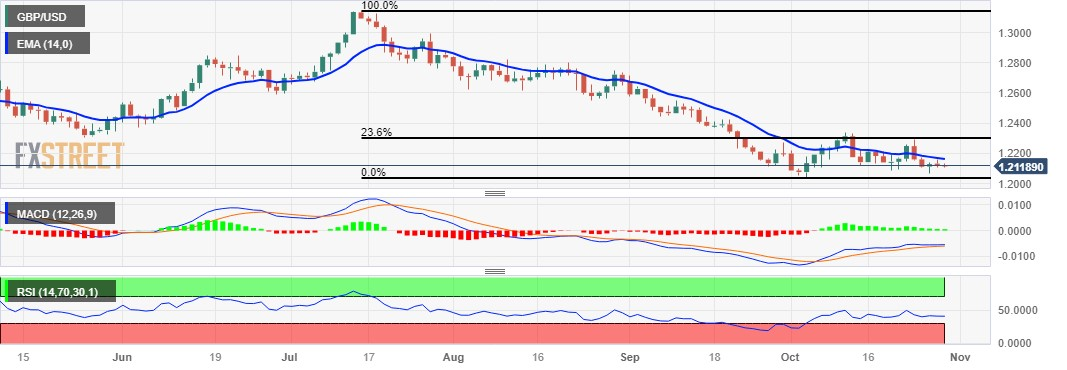
- USD/CAD loses ground around 1.3862 amid a softer USD.
- Fed is anticipated to maintain rate steady at the end of its two-day meeting on Wednesday.
- A decline in oil prices might exert pressure on the commodity-linked Loonie.
- Investors will focus on the Canadian growth number and PMI data ahead of the Fed rate decision at its November meeting.
The USD/CAD pair trades with modest intraday losses above the mid-1.3800s during the Asian trading hours on Monday. The softer note of the US Dollar (USD) weighs on the pair. Investors will focus on the highly-anticipated Federal Reserve (Fed) interest rate decision on Wednesday, with no change expected. The pair currently trades near 1.3862, down 0.06% on the day.
Fed is anticipated to hold the interest rate steady at the end of its two-day meeting on Wednesday, even though the Core US Personal Consumption Expenditure Index (PCE), the Fed’s preferred gauge for inflation remains well above the 2% target rate.
Following its last meeting in September, the Fed said that recent economic data suggested economic activity is growing at a solid pace. Job growth has slowed in recent months but remained robust. However, Fed Chair Jerome Powell said that inflation is still too high. This raises the expectation of an additional rate hike at the December meeting. The higher-for-longer rate narratives in the US could lift the USD and act as a tailwind for the USD/CAD pair.
On Friday, the Core US Personal Consumption Expenditure Index (PCE) eased to 3.7% YoY in September from the previous reading of 3.8%, in line with market expectations. The monthly Core PCE grew by 0.3% versus 0.1% prior. Furthermore, September's headline PCE Price Index came in at 3.4% YoY versus the expected 3.4%.
On the Loonie front, a decline in oil prices might limit the upside of the commodity-linked Loonie as the country is the major oil exporter to the US. The Bank of Canada (BoC) decided to hold the rate unchanged last week at 5%. BoC Governor Tiff Macklem said that the decision to maintain the rate was because the central bank wanted to allow monetary policy time to cool the economy and relieve price pressure. He added that the central bank will continue to assess whether monetary policy is sufficiently restrictive.
Moving on, the Canadian Gross Domestic Product for August is due on Tuesday. Later this week, the Canadian S&P Global Manufacturing PMI for October and the US ISM Manufacturing PMI will be released on Wednesday. The attention will shift to the Fed policy decision on late Wednesday. On Friday, the employment data from both Canada and the US will be due. These events could trigger the volatility in the market and give a clear direction to the USD/CAD pair.
- Gold price consolidates its recent strong gains and manages to hold above the $2,000 mark.
- Geopolitical tensions in the Middle East continue to lend support to the safe-haven metal.
- A slightly overbought RSI warrants caution for bulls ahead of this week’s key event/data risks.
Gold price (XAU/USD) advanced beyond the $2,000 psychological mark on Friday, hitting its highest level since May 16 and registering a third straight weekly gain. An escalation in the Israel-Hamas conflict continues to fuel safe-haven buying and acts as a tailwind for the precious metal. Traders, however, refrain from placing fresh bullish bets and prefer to wait on the sidelines ahead of this week's key central bank event risks. The Bank of Japan (BoJ) is scheduled to announce its policy decision on Tuesday, which will be followed by the crucial monetary policy update by the Federal Reserve (Fed) on Wednesday and the Bank of England (BoE) meeting on Thursday.
Investors this week will also look to the official PMIs from China for cues about business activity in the world's second-largest economy. Apart from this, the prelim EuroZone GDP and CPI, along with the US monthly jobs report (NFP), should provide some meaningful impetus to the Gold price. In the meantime, the prospects for further policy tightening by the Fed continue to underpin the US Dollar (USD) and keep the XAU/USD bulls on the defensive through the Asian session on Monday. The lack of any follow-through selling, however, warrants some caution for aggressive bearish traders and before positioning for any meaningful corrective decline for the commodity.
Daily Digest Market Movers: Gold price hovers about $2,000 as the Israel-Hamas conflict continues to drive haven flows
- Gold price manages to hold above the $2,000 psychological mark on Monday and continues to draw support from the increasing risk of an escalation of geopolitical tensions in the Middle East.
- Palestinians in northern Gaza reported fierce air and artillery strikes early on Monday as Israeli troops, backed by tanks, pressed into the besieged enclave with a ground assault.
- The US Commerce Department reported on Friday that consumer spending increased more than expected in September and that monthly inflation accelerated during the reported month.
- This comes on top of the upbeat Advance US GDP report, which showed that the world's largest economy grew at its fastest pace in nearly two years in the third quarter.
- The US economic resilience should allow the Federal Reserve (Fed) to stick to its hawkish stance and keep hopes alive for one more interest rate hike by the year-end.
- The hawkish outlook remains supportive of elevated US Treasury bond yields and continues to underpin the US Dollar, acting as a headwind for the precious metal.
- Traders now look to the outcome of a crucial two-day FOMC monetary policy meeting for clues about the future rate-hike path before placing fresh directional bets.
- The Bank of Japan and the Bank of England are also scheduled to announce their respective policy decisions and infuse some volatility in the global financial markets.
- Investors this week will further take cues from the official Chinese PMIs, the flash EuroZone CPI and GDP print and the closely-watched US jobs report (NFP).
Technical Analysis: Gold price might consolidate its recent strong gains amid a slightly overbought RSI
From a technical perspective, the Relative Strength Index (RSI) on the daily chart is already flashing slightly overbought conditions and holding back bulls from placing fresh bets around the Gold price. Hence, it will be prudent to wait for some near-term consolidation or a modest pullback before positioning for an extension of a multi-week-old uptrend. That said, any meaningful corrective decline is likely to find decent support near the $1,986-1,985 horizontal resistance breakpoint.
The said areas should act as a pivotal point, below which the Gold price could accelerate the fall towards the $1,972 support zone. On the flip side, some follow-through buying beyond the $2,005 area, or the multi-month peak touched on Friday, will set the stage for a move towards the next relevant hurdle near the $2,022 area.
US Dollar price today
The table below shows the percentage change of US Dollar (USD) against listed major currencies today. US Dollar was the weakest against the New Zealand Dollar.
| USD | EUR | GBP | CAD | AUD | JPY | NZD | CHF | |
| USD | 0.02% | -0.08% | -0.03% | -0.23% | -0.09% | -0.30% | 0.14% | |
| EUR | -0.03% | -0.10% | -0.06% | -0.25% | -0.13% | -0.32% | 0.10% | |
| GBP | 0.06% | 0.08% | 0.00% | -0.18% | -0.03% | -0.25% | 0.20% | |
| CAD | 0.06% | 0.06% | -0.04% | -0.19% | -0.07% | -0.27% | 0.16% | |
| AUD | 0.23% | 0.26% | 0.17% | 0.19% | 0.15% | -0.07% | 0.38% | |
| JPY | 0.09% | 0.11% | 0.11% | 0.03% | -0.15% | -0.22% | 0.23% | |
| NZD | 0.31% | 0.32% | 0.22% | 0.27% | 0.07% | 0.20% | 0.43% | |
| CHF | -0.14% | -0.11% | -0.21% | -0.16% | -0.36% | -0.23% | -0.43% |
The heat map shows percentage changes of major currencies against each other. The base currency is picked from the left column, while the quote currency is picked from the top row. For example, if you pick the Euro from the left column and move along the horizontal line to the Japanese Yen, the percentage change displayed in the box will represent EUR (base)/JPY (quote).
Gold FAQs
Why do people invest in Gold?
Gold has played a key role in human’s history as it has been widely used as a store of value and medium of exchange. Currently, apart from its shine and usage for jewelry, the precious metal is widely seen as a safe-haven asset, meaning that it is considered a good investment during turbulent times. Gold is also widely seen as a hedge against inflation and against depreciating currencies as it doesn’t rely on any specific issuer or government.
Who buys the most Gold?
Central banks are the biggest Gold holders. In their aim to support their currencies in turbulent times, central banks tend to diversify their reserves and buy Gold to improve the perceived strength of the economy and the currency. High Gold reserves can be a source of trust for a country’s solvency. Central banks added 1,136 tonnes of Gold worth around $70 billion to their reserves in 2022, according to data from the World Gold Council. This is the highest yearly purchase since records began. Central banks from emerging economies such as China, India and Turkey are quickly increasing their Gold reserves.
How is Gold correlated with other assets?
Gold has an inverse correlation with the US Dollar and US Treasuries, which are both major reserve and safe-haven assets. When the Dollar depreciates, Gold tends to rise, enabling investors and central banks to diversify their assets in turbulent times. Gold is also inversely correlated with risk assets. A rally in the stock market tends to weaken Gold price, while sell-offs in riskier markets tend to favor the precious metal.
What does the price of Gold depend on?
The price can move due to a wide range of factors. Geopolitical instability or fears of a deep recession can quickly make Gold price escalate due to its safe-haven status. As a yield-less asset, Gold tends to rise with lower interest rates, while higher cost of money usually weighs down on the yellow metal. Still, most moves depend on how the US Dollar (USD) behaves as the asset is priced in dollars (XAU/USD). A strong Dollar tends to keep the price of Gold controlled, whereas a weaker Dollar is likely to push Gold prices up.
- USD/MXN receives upward support as Crude prices could surge due to Middle-East conflict.
- The escalation of the Israel-Hamas war could provide minor support for the Mexican Peso.
- Fed’s policy decision is awaited on Wednesday; market expectations lean towards policy rates to remain at 5.5%.
USD/MXN continues the downward trajectory for the third successive session since Mexico's employment data revealed a robust labor market, showcasing the enduring strength of the Mexican economy. The pair trades lower around 18.0900 during the Asian session on Monday.
On Thursday, Mexico’s Jobless Rate showed a decline to 2.9% in September from August's 3.0%. However, Mexico revealed on Friday its Trade Balance report, which showed that the trade deficit widened in September from $1.377B in August to $1.481B.
Additionally, the escalating Middle-East conflict is supposed to reinforce commodity prices like Crude oil and Gold, which might provide some support to the Mexican Peso (MXN). Israel has expanded its ground operations in Gaza and attacked multiple Hamas sites, which could affect the currencies of the emerging markets including the MXN.
Deputy Governor Jonathan Heath of the Bank of Mexico (Banxico) recently pointed out that the increasing government debt in 2024 will introduce an additional challenge to the battle against inflation. He emphasized the existence of a desynchronization between monetary and fiscal policies.
The US Dollar Index (DXY) seems to be keeping a low profile, remaining relatively silent as a decline in US Treasury yields puts pressure on the Greenback. However, the 10-year US Bond yield is showing signs of a rebound at 4.87% as of the latest update.
US Core Personal Consumption Expenditures Price Index data revealed on Friday, that the yearly index declined to 3.7% in September from 3.8% previous reading. The monthly figures improved to 0.3% from 0.1% previously.
All eyes are on the upcoming Federal Reserve (Fed) meeting scheduled on Wednesday, with the market sentiment currently leaning towards the expectation that interest rates will remain consistent at 5.5%.
- NZD/USD moves upward on the subdued performance of the US Dollar.
- Israel has expanded its ground operations in Gaza; which could affect the Kiwi Dollar.
- The market sentiment leans towards the Fed’s dovish stance on policy rates.
NZD/USD recovers the recent losses, trading near 0.5820 during the Asian session on Monday. The NZD/USD pair gains ground, benefiting from a relatively subdued performance of the US Dollar (USD) following the release of the Core Personal Consumption Expenditures Price Index data from the United States (US) on Friday.
However, the New Zealand Dollar (NZD) faced pressure after the recent release of soft headline Consumer Price Index (CPI) data, which might influence traders to anticipate that the Reserve Bank of New Zealand (RBNZ) to adopt a more accommodative stance on interest rate hikes, contributing to the weakening of the Kiwi pair. Investors await the Employment Change and Unemployment Rate for the third quarter scheduled to be released later in the week.
The situation in Israel, with the expansion of ground operations in Gaza and airstrikes on Hamas targets, could have an impact on the NZD/USD pair. Prime Minister Benjamin Netanyahu has labeled this as the second phase of the war. The recent blackout in Gaza, lasting over a day, has seen partial restoration of telephone and internet communications.
The market sentiment could improve on the significant diplomatic breakthrough as the US and China have reportedly agreed in principle on a meeting between Presidents Joe Biden and Xi Jinping in November. After months of delicate diplomatic efforts to mend ties, this potential meeting holds promise for constructive dialogue between the two nations.
On the other side, the traders of the Greenback seem to be booking profits after a three-day winning streak. US Core Personal Consumption Expenditures Price Index (YoY) eased at 3.7% in September compared to 3.8% in the previous reading. However, the monthly index improved to 0.3% from 0.1% previously.
Furthermore, despite the University of Michigan Consumer Index reporting 63.8 readings, exceeding the expected consistency at 63.0 in October, it appears that the positive outcome did not significantly boost the US Dollar. This suggests that the market sentiment is leaning towards the anticipation of no changes to interest rates by the US Federal Reserve (Fed) in the upcoming meeting on Wednesday.
- WTI kicks off the new week on a weaker note, though lacks follow-through and remains confined in a familiar range.
- The uncertainty over the impact of the Israel-Hamas war holds back traders from placing aggressive directional bets.
- Traders also prefer to wait on the sidelins ahead of this week’s key central bank event risks and important macro data.
West Texas Intermediate (WTI) Crude Oil prices come under some renewed selling pressure on the first day of a new week and reverse a major part of Friday's positive move. The commodity, however, manages to rebound from the early Asian session low and currently trades around the $84.20 region, still down nearly 0.80% for the day.
Looking at the broader picture, Oil prices remain confined in a multi-day-old trading ban as market participants struggle to gauge the actual impact of the Israel-Hamas war and whether it could disrupt oil supplies from the region. This, in turn, holds back traders from placing aggressive directional bets around the commodity and leads to a range-bound price action. The upside, meanwhile, seems limited in the wake of growing worries that economic headwinds stemming from rapidly rising borrowing costs will dent fuel demand.
Furthermore, traders prefer to wait on the sidelines ahead of the official PMIs from China for cues about business activity in the world's biggest oil importer. Investors this week will further take cues from key central bank event risks – starting with the Bank of Japan (BoJ) meeting on Tuesday, followed by the FOMC decision on Wednesday and the Bank of England (BoE) on Thursday. Apart from this, the prelim Euro Zone GDP prints, along with the US jobs report (NFP), should provide some meaningful impetus to Crude Oil prices.
In the meantime, a modest US Dollar (USD) uptick, bolstered by elevated US Treasury bond yields and hawkish Federal Reserve (Fed) expectations, is seen as a key factor undermining the US Dollar-denominated commodity. From a technical perspective, the recent range-bound price action points to indecision among traders over the near-term trajectory. This, in turn, makes it prudent to wait for a sustained move in either direction before placing aggressive bets around Crude Oil prices.
Technical levels to watch
| Raw materials | Closed | Change, % |
|---|---|---|
| Silver | 23.105 | 1.4 |
| Gold | 2005.686 | 1.1 |
| Palladium | 1123.69 | -0.17 |
- Indian Rupee edges lower on Monday on the ongoing US Dollar (USD) demand.
- A lower US Treasury bond yields and RBI’s potential intervention might limit the INR’s downside.
- Investors will focus on the Federal Open Market Committee (FOMC) meeting and RBI's OMO sales.
Indian Rupee (INR) opens modestly lower on Monday on the ongoing US Dollar (USD) demand and equity-linked outflows. That being said, foreign investors have sold $1.19 billion in Indian equities in October. Nonetheless, a pullback in the US Treasury bond yields and the potential intervention from the Reserve Bank of India (RBI) might cap the further depreciation of INR.
Investors will closely monitor the Federal Open Market Committee's (FOMC) interest rate decision at the end of its two-day meeting on Wednesday. The markets anticipate the FOMC to maintain rates steady, despite the Fed’s preferred gauge for inflation, the Core Personal Consumption Expenditures Price Index (PCE) remains well above the 2% target rate.
Furthermore, market participants will keep an eye on whether the RBI starts selling bonds via open market operations (OMO) this week as liquidity improves. Apart from this, India’s Fiscal Deficit and Infrastructure Output for September will be released on Tuesday.
Daily Digest Market Movers: Indian Rupee struggles to gain amid uncertainty
- The US Core Personal Consumption Expenditure Index (PCE) came in at 3.7% YoY in September from the previous figure of 3.8%, matching the market consensus. The headline PCE arrived at 3.4% YoY vs the expectation of 3.4%.
- The Michigan Consumer Confident Index improved to 63.8, better than the 68 expected.
- UoM inflation expectations for a one-year period are expected to rise by 4.2%, while for a five-year period is expected to stay at 3%.
- Foreign investors sold $1.67 billion in Indian equities in October, which might exert pressure on the Indian Rupee.
- US Q3 GDP expanded at an annualized rate of 4.9%, above the market estimation of 4.2%.
- The Reserve Bank of India (RBI) is expected to meet with top bank officials this week to discuss the banking system's present liquidity condition.
- The RBI's monetary policy committee said the central bank will continue to keep an eye on maintaining inflation at the 4% target.
- RBI estimated that India's GDP would increase at a 6.5% annual rate in the current fiscal year.
- The International Monetary Fund (IMF) revised its forecast growth rate for India to 6.3% in October.
- Growth in India is expected to gain momentum for the remainder of 2023, according to the RBI's October bulletin.
- India’s Wholesale Price Index (WPI) for September, a measure of inflation, fell -0.26% YoY from the previous reading of 0.52%, worse than the market expectation of 0.50%.
Technical Analysis: The Indian Rupee remains confined in a familiar range
The Indian Rupee moves slightly lower on the day. The USD/INR pair trades within a range of 83.00-83.35. The upward bias of USD/INR remains intact as the pair holds above the 100- and 200-day Exponential Moving Averages (EMA) on the daily chart.
On the upside, any decisive follow-through buying above 83.35 will pave the way to year-to-date (YTD) highs of 83.45. The additional upside filter to watch is a psychological round mark at 84.00. On the other hand, the critical support level will emerge at 83.00, portraying the confluence of a low of October 20 and a round figure. A break below 83.00 could see a drop to 82.82 (low of September 12), followed by 82.65 (low of August 4).
US Dollar price in the last 7 days
The table below shows the percentage change of US Dollar (USD) against listed major currencies in the last 7 days. US Dollar was the strongest against the Canadian Dollar.
| USD | EUR | GBP | CAD | AUD | JPY | NZD | CHF | |
| USD | 0.25% | 0.42% | 1.08% | -0.51% | -0.14% | 0.11% | 1.07% | |
| EUR | -0.25% | 0.17% | 0.83% | -0.76% | -0.39% | -0.13% | 0.83% | |
| GBP | -0.41% | -0.17% | 0.67% | -0.94% | -0.55% | -0.30% | 0.67% | |
| CAD | -1.09% | -0.84% | -0.70% | -1.62% | -1.23% | -0.98% | 0.00% | |
| AUD | 0.51% | 0.78% | 0.95% | 1.58% | 0.39% | 0.62% | 1.59% | |
| JPY | 0.14% | 0.36% | 0.53% | 1.21% | -0.40% | 0.23% | 1.21% | |
| NZD | -0.10% | 0.14% | 0.31% | 0.97% | -0.63% | -0.24% | 0.96% | |
| CHF | -1.09% | -0.84% | -0.67% | 0.00% | -1.61% | -1.23% | -0.98% |
The heat map shows percentage changes of major currencies against each other. The base currency is picked from the left column, while the quote currency is picked from the top row. For example, if you pick the Euro from the left column and move along the horizontal line to the Japanese Yen, the percentage change displayed in the box will represent EUR (base)/JPY (quote).
Indian Rupee FAQs
What are the key factors driving the Indian Rupee?
The Indian Rupee (INR) is one of the most sensitive currencies to external factors. The price of Crude Oil (the country is highly dependent on imported Oil), the value of the US Dollar – most trade is conducted in USD – and the level of foreign investment, are all influential. Direct intervention by the Reserve Bank of India (RBI) in FX markets to keep the exchange rate stable, as well as the level of interest rates set by the RBI, are further major influencing factors on the Rupee.
How do the decisions of the Reserve Bank of India impact the Indian Rupee?
The Reserve Bank of India (RBI) actively intervenes in forex markets to maintain a stable exchange rate, to help facilitate trade. In addition, the RBI tries to maintain the inflation rate at its 4% target by adjusting interest rates. Higher interest rates usually strengthen the Rupee. This is due to the role of the ‘carry trade’ in which investors borrow in countries with lower interest rates so as to place their money in countries’ offering relatively higher interest rates and profit from the difference.
What macroeconomic factors influence the value of the Indian Rupee?
Macroeconomic factors that influence the value of the Rupee include inflation, interest rates, the economic growth rate (GDP), the balance of trade, and inflows from foreign investment. A higher growth rate can lead to more overseas investment, pushing up demand for the Rupee. A less negative balance of trade will eventually lead to a stronger Rupee. Higher interest rates, especially real rates (interest rates less inflation) are also positive for the Rupee. A risk-on environment can lead to greater inflows of Foreign Direct and Indirect Investment (FDI and FII), which also benefit the Rupee.
How does inflation impact the Indian Rupee?
Higher inflation, particularly, if it is comparatively higher than India’s peers, is generally negative for the currency as it reflects devaluation through oversupply. Inflation also increases the cost of exports, leading to more Rupees being sold to purchase foreign imports, which is Rupee-negative. At the same time, higher inflation usually leads to the Reserve Bank of India (RBI) raising interest rates and this can be positive for the Rupee, due to increased demand from international investors. The opposite effect is true of lower inflation.
- USD/JPY kicks off the new week on a positive note and recovers a part of Friday’s losses.
- The divergent BoJ-Fed policy outlook is seen as a key factor lending support to the major.
- Intervention fears might keep a lid on further gains ahead of the central bank event risks.
The USD/JPY pair attracts some dip-buying on the first day of a new week and for now, seems to have stalled its retracement slide from the 150.75-150.80 area, or the highest level since October 2022 touched last week. Spot prices, however, lack bullish conviction and currently trade around the 149.70-149.75 region, up less than 0.10% for the day, as traders look to key central bank meetings before placing fresh directional bets.
The Bank of Japan (BoJ) is scheduled to announce its decision on Tuesday amid mounting speculations about a possible change in the yield curve control (YCC) policy. The Japanese central bank, however, is unlikely to move away from its negative policy rates. This marks a big divergence in comparison to other major central banks, including the Federal Reserve (Fed), which, along with a positive risk tone, is seen undermining the safe-haven Japanese Yen (JPY) and turning out to be a key factor acting as a tailwind for the USD/JPY pair.
The US Dollar (USD), on the other hand, continues to draw some support from elevated US Treasury bond yields, bolstered by hawkish Fed expectations. Data released last week showed that the US economy grew at its fastest pace in nearly two years in the third quarter. Furthermore, the US Commerce Department reported that consumer spending increased more than expected in September and elevated monthly inflation print. This indicated that the US economy remains on a firm footing and supports prospects for a further tightening by the Fed.
Investors, however, seem convinced that the US central bank will maintain the status quo for the second straight time at the end of a two-day policy meeting on Wednesday. This, in turn, is holding back the USD bulls from placing aggressive bets. Apart from this, speculations that Japanese authorities will intervene in the FX market to combat a sustained depreciation in the JPY further contribute to capping the USD/JPY pair heading into the key central bank event risks. Nevertheless, the fundamental backdrop seems tilted in favour of bullish traders.
Technical levels to watch
- Australian Dollar strengthened due to the subdued US Dollar.
- Australia’s Retail Sales increased to 0.9%, significantly higher than the market consensus of 0.3%.
- US Dollar encountered a challenge after a moderate Core PCE Price Index data on Friday.
The Australian Dollar (AUD) extends gains for the third successive session, continuing the winning streak on Monday after rebounding from the yearly lows. The AUD/USD pair continues with the gains due to the weaker US Dollar (USD), which could be attributed to the economic data released on Friday from the United States (US). Furthermore, the Reserve Bank of Australia (RBA) is expected to raise policy rates in the upcoming meeting on November 7.
Australia’s Retail Sales s.a. (MoM) for September surprised the market with a significantly higher reading compared to both the market consensus and the previously recorded figure. During the previous week, Australia’s Consumer Price Index (CPI) showed growth in the third quarter of 2023, exceeding the uptick observed in the second quarter. This elevated inflation scenario heightens the likelihood of a 25 basis points rate hike by the Reserve Bank of Australia (RBA) at its upcoming policy meeting on November 7.
The US Dollar Index (DXY) pushes to recover lost ground following recent setbacks. The Greenback encountered a hurdle as the Core Personal Consumption Expenditures Price Index (YoY) showed a decline in September. However, the monthly data revealed an anticipated increase. The University of Michigan Consumer Index exceeded expectations but failed to add a favorable twist to the US Dollar. This demonstrates that the market is predicting no changes to interest rates in the upcoming Federal Open Market Committee (FOMC) meeting.
Daily Digest Market Movers: Australian Dollar gains ground on subdued US Dollar, RBA interest rates hike
- Australia’s Retail Sales s.a. (MoM) for September came in at 0.9%, a significantly higher reading compared to the market consensus of 0.3% and 0.2% previously.
- Australia’s Producer Price Index (PPI) showed a slight easing to 3.8% on a yearly basis in the third quarter (Q3), compared to the 3.9% recorded in the previous quarter. On a quarterly basis, the nation's PPI increased to 1.8%, a notable rise from the previous reading of 0.5%.
- Australian Consumer Price Index (CPI) reached 1.2% in the third quarter of 2023, surpassing the 0.8% uptick in the previous quarter and the market consensus of 1.1% in the same period.
- Australia's S&P Global Composite PMI in October slipped to 47.3 from the prior reading of 51.5. The Manufacturing PMI experienced a slight easing to 48.0 compared to the previous figure of 48.7, and the Services PMI regressed into contraction territory, dropping to 47.6 from the previous month's reading of 51.8.
- Australia's RBA expressed heightened concern about the inflation impact stemming from supply shocks. Governor of the Reserve Bank of Australia, Michele Bullock stated that if inflation persists above projections, the RBA will take responsive policy measures. There is an observable deceleration in demand, and per capita consumption is on the decline.
- US Core Personal Consumption Expenditures Price Index (YoY) declined to 3.7% in September from the previous reading of 3.8%. However, the monthly index increased to 0.3%, as anticipated from 0.1% previously.
- The University of Michigan Consumer Index exceeded expectations in October, reporting a figure of 63.8, which was expected to remain consistent at 63.0.
- The preliminary US Gross Domestic Product (GDP) Annualized showed growth in the third quarter, expanding by 4.9%, a notable improvement from the previous reading of a 2.1% expansion and surpassing the market expectation of 4.2%. However, there was a decline in US Core Personal Consumption Expenditures, declining to 2.4% in the third quarter from the 3.7% recorded previously.
- Investors will focus on the US ADP Employment Change for October on Wednesday.
Technical Analysis: Australian Dollar maintains position below the 0.6350 psychological level
The Australian Dollar is on an upward path, hovering around 0.6340 on Monday, in sync with a significant barrier at the 0.6350 level. This movement follows a rebound from the yearly low at 0.6270, supported by a key level around 0.6250. The 21-day Exponential Moving Average (EMA) at 0.6352 stands out as a crucial resistance, succeeding the major level at 0.6400. A successful breach above this resistance could propel the currency towards the 23.6% Fibonacci retracement level at 0.6417.
AUD/USD: Daily Chart
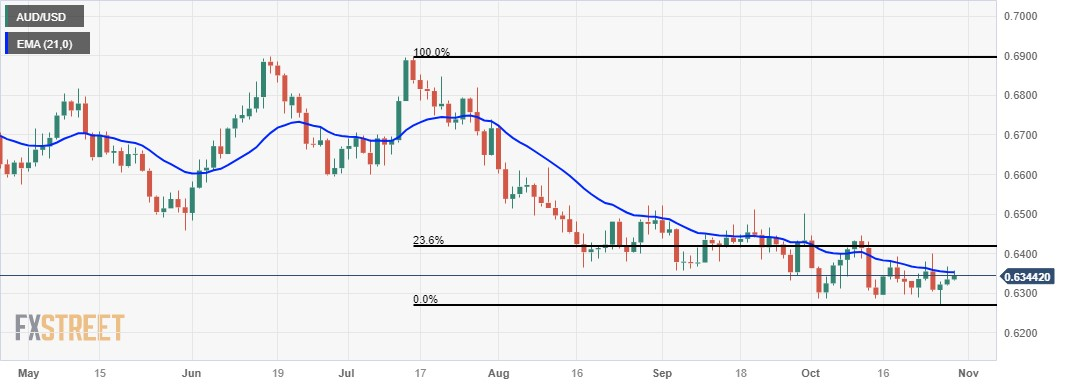
Australian Dollar price today
The table below shows the percentage change of Australian Dollar (AUD) against listed major currencies today. Australian Dollar was the strongest against the Swiss Franc.
| USD | EUR | GBP | CAD | AUD | JPY | NZD | CHF | |
| USD | 0.02% | 0.06% | -0.04% | -0.10% | 0.01% | -0.23% | 0.11% | |
| EUR | -0.02% | 0.03% | -0.06% | -0.12% | -0.02% | -0.25% | 0.08% | |
| GBP | -0.06% | -0.03% | -0.12% | -0.17% | -0.06% | -0.30% | 0.05% | |
| CAD | 0.06% | 0.06% | 0.09% | -0.06% | 0.03% | -0.19% | 0.14% | |
| AUD | 0.09% | 0.13% | 0.17% | 0.04% | 0.12% | -0.13% | 0.22% | |
| JPY | -0.01% | 0.02% | 0.15% | -0.07% | -0.09% | -0.22% | 0.11% | |
| NZD | 0.24% | 0.25% | 0.28% | 0.19% | 0.12% | 0.23% | 0.33% | |
| CHF | -0.11% | -0.08% | -0.05% | -0.14% | -0.21% | -0.10% | -0.33% |
The heat map shows percentage changes of major currencies against each other. The base currency is picked from the left column, while the quote currency is picked from the top row. For example, if you pick the Euro from the left column and move along the horizontal line to the Japanese Yen, the percentage change displayed in the box will represent EUR (base)/JPY (quote).
Australian Dollar FAQs
What key factors drive the Australian Dollar?
One of the most significant factors for the Australian Dollar (AUD) is the level of interest rates set by the Reserve Bank of Australia (RBA). Because Australia is a resource-rich country another key driver is the price of its biggest export, Iron Ore. The health of the Chinese economy, its largest trading partner, is a factor, as well as inflation in Australia, its growth rate and Trade Balance. Market sentiment – whether investors are taking on more risky assets (risk-on) or seeking safe-havens (risk-off) – is also a factor, with risk-on positive for AUD.
How do the decisions of the Reserve Bank of Australia impact the Australian Dollar?
The Reserve Bank of Australia (RBA) influences the Australian Dollar (AUD) by setting the level of interest rates that Australian banks can lend to each other. This influences the level of interest rates in the economy as a whole. The main goal of the RBA is to maintain a stable inflation rate of 2-3% by adjusting interest rates up or down. Relatively high interest rates compared to other major central banks support the AUD, and the opposite for relatively low. The RBA can also use quantitative easing and tightening to influence credit conditions, with the former AUD-negative and the latter AUD-positive.
How does the health of the Chinese Economy impact the Australian Dollar?
China is Australia’s largest trading partner so the health of the Chinese economy is a major influence on the value of the Australian Dollar (AUD). When the Chinese economy is doing well it purchases more raw materials, goods and services from Australia, lifting demand for the AUD, and pushing up its value. The opposite is the case when the Chinese economy is not growing as fast as expected. Positive or negative surprises in Chinese growth data, therefore, often have a direct impact on the Australian Dollar and its pairs.
How does the price of Iron Ore impact the Australian Dollar?
Iron Ore is Australia’s largest export, accounting for $118 billion a year according to data from 2021, with China as its primary destination. The price of Iron Ore, therefore, can be a driver of the Australian Dollar. Generally, if the price of Iron Ore rises, AUD also goes up, as aggregate demand for the currency increases. The opposite is the case if the price of Iron Ore falls. Higher Iron Ore prices also tend to result in a greater likelihood of a positive Trade Balance for Australia, which is also positive of the AUD.
How does the Trade Balance impact the Australian Dollar?
The Trade Balance, which is the difference between what a country earns from its exports versus what it pays for its imports, is another factor that can influence the value of the Australian Dollar. If Australia produces highly sought after exports, then its currency will gain in value purely from the surplus demand created from foreign buyers seeking to purchase its exports versus what it spends to purchase imports. Therefore, a positive net Trade Balance strengthens the AUD, with the opposite effect if the Trade Balance is negative.
On Monday, the People’s Bank of China (PBoC) set the USD/CNY central rate for the trading session ahead at 7.1781 as compared to Friday's fix of 7.1782 and 7.3165 Reuters estimate.
- GBP/USD extends its subdued range-bound price action during the Asian session on Monday.
- Traders opt to wait on the sidelines ahead of the FOMC and the BoE meetings later this week.
- In the meantime, a modest USD strength continues to act as a headwind and exerts pressure.
The GBP/USD pair continues with its struggle to gain any meaningful traction and oscillates in a multi-day-old trading range, around the 1.2100 mark during the Asian session on Monday. Traders now seem reluctant and prefer to wait on the sidelines ahead of this week's key central bank event risks – the highly-anticipated FOMC decision on Wednesday, followed by the Bank of England (BoE) meeting on Thursday.
The Federal Reserve (Fed) is expected to maintain the status quo and leave interest rates unchanged for the second straight time in November, though the markets are still pricing in some chance of a rate hike later this year. The bets were reaffirmed by the relatively upbeat US macro data released recently, which pointed to a still-resilient economy. Adding to this, the stronger-than-expected increase in spending reported by the Commerce Department on Friday and elevated monthly inflation readings should allow the Fed to stick to its hawkish stance. The outlook remains supportive of elevated US Treasury bond yields, which continue to act as a tailwind for the US Dollar (USD) and weigh on the GBP/USD pair.
The Bank of England (BoE), on the other hand, is also anticipated to keep its benchmark interest rates on hold at a 15-year high of 5.25% on the back of growing worries about a recession. The UK central bank, however, is unlikely to relax its stance in the fight against high inflation rate and might keep the door open to further tightening. The uncertainty, in turn, is holding back traders from placing aggressive directional bets around the British Pound (GBP) and contributing to the GBP/USD pair's range-bound price action. The lack of any buying, meanwhile, suggests that the path of least resistance for spot prices remains to the downside. Bears, however, need to wait for acceptance below the 1.2100 mark before placing fresh bets.
Moving ahead, there isn't any relevant market-moving economic data due for release on Monday, either from the UK or the US. Hence, the US bond yields will continue to play a key role in influencing the USD price dynamics and produce short-term trading opportunities around the GBP/USD pair. Apart from this, traders will further take cues from the broader risk sentiment, which tends to drive demand for the safe-haven Greenback. The aforementioned fundamental backdrop, however, warrants some caution before placing fresh directional bets.
Technical levels to watch
- EUR/USD loses traction around the mid-1.0500 in early Monday.
- The market expects the economic condition in Europe to further deteriorate.
- Federal Reserve (Fed) is anticipated to hold rate steady at its meeting on Wednesday.
- Traders will monitor the German growth numbers for Q3, the preliminary Spanish CPI, and the German CPI.
The EUR/USD pair posts losses during the early Asian trading hours on Monday. In the busy week in terms of economic data release, traders will take cues from the German growth number and Eurozone GDP and inflation data ahead of the highly-anticipated Federal Reserve (Fed) meeting on Wednesday. The major pair currently trades near 1.0557, losing 0.07% for the day.
The market anticipates that European economic conditions to continue deteriorating. The German Gross Domestic Product (GDP) is expected to contract by 0.3% QoQ from 0.2% expansion in the previous reading. The Eurozone GDP is forecast to decline to 0.2% from 0.5% in the previous reading. Finally, Eurozone HICP is expected to drop from 4.3% to 3.4% in October.
On the US Dollar front, the Federal Reserve (Fed) is expected to hold interest rate unchanged at the end of its two-day meeting on Wednesday. Late last month, Fed Chair Jerome Powell stated that inflation is still too high and this raised the expectation that additional rate hikes by the end of the year cannot be ruled out. That being said, the higher for longer rate narratives in the US could lift the USD and act as a headwind for the EUR/USD pair.
About the data, the Core US Personal Consumption Expenditure Index (PCE) arrived at 3.7% YoY in September versus 3.8% prior. The monthly figure climbed to 0.3% from 0.1% in the previous reading. Additionally, September's headline PCE Price Index came in at 3.4% YoY versus the expected 3.4%.
Market participants will keep an eye on the German Gross Domestic Product (GDP) for the third quarter (Q3). Also, the preliminary Spanish Consumer Price Index (CPI) for October and the German CPI will be released later on Monday. Later this week, German Retail Sales, Eurozone GDP, and Eurozone inflation data will be due on Tuesday. The spotlight this week will be the Fed monetary policy meeting on Wednesday. This event might trigger the volatility in the financial markets and give a clear direction to the EUR/USD pair.
Australian Trade Minister Don Farrell is out with some comments, saying that talks with the European Union on a Free Trade Agreement have broken down.
Additional comments:
Both parties failed to reach a compromise on a number of sticking points
Unfortunately, we have not been able to make progress
Negotiations will continue and I am hopeful that, one day, we will sign a deal that benefits both Australia and our European friends.
Australia’s Retail Sales, a measure of the country’s consumer spending, rose 0.9% in September on a monthly basis, as against August’s 0.2% increase, according to the official data published by the Australian Bureau of Statistics (ABS) on Monday. The figure came in better than the market expectation for an increase of 0.3%.
Market reaction
AUD/USD picks up bid following the upbeat Australian data. The spot is trading at 0.6347, up 0.22% on the day, as of writing.
About Australia's Retail Sales
The Retail Sales released by the Australian Bureau of Statistics is a survey of goods sold by retailers is based on a sampling of retail stores of different types and sizes and it''s considered as an indicator of the pace of the Australian economy. It shows the performance of the retail sector over the short and mid-term. Positive economic growth anticipates bullish trends for the AUD, while a low reading is seen as negative or bearish.
| Index | Change, points | Closed | Change, % |
|---|---|---|---|
| NIKKEI 225 | 389.91 | 30991.69 | 1.27 |
| Hang Seng | 354.12 | 17398.73 | 2.08 |
| KOSPI | 3.73 | 2302.81 | 0.16 |
| ASX 200 | 14.6 | 6826.9 | 0.21 |
| DAX | -43.64 | 14687.41 | -0.3 |
| CAC 40 | -93.58 | 6795.38 | -1.36 |
| Dow Jones | -366.71 | 32417.59 | -1.12 |
| S&P 500 | -19.86 | 4117.37 | -0.48 |
| NASDAQ Composite | 47.4 | 12643.01 | 0.38 |
| Pare | Closed | Change, % |
|---|---|---|
| AUDUSD | 0.6333 | 0.15 |
| EURJPY | 158.068 | -0.5 |
| EURUSD | 1.05651 | 0.01 |
| GBPJPY | 181.394 | -0.57 |
| GBPUSD | 1.21217 | -0.07 |
| NZDUSD | 0.5809 | -0.22 |
| USDCAD | 1.38738 | 0.34 |
| USDCHF | 0.90214 | 0.36 |
| USDJPY | 149.643 | -0.49 |


© 2000-2026. Уcі права захищені.
Cайт знаходитьcя під керуванням TeleTrade DJ. LLC 2351 LLC 2022 (Euro House, Richmond Hill Road, Kingstown, VC0100, St. Vincent and the Grenadines).
Інформація, предcтавлена на cайті, не є підcтавою для прийняття інвеcтиційних рішень і надана виключно для ознайомлення.
Компанія не обcлуговує та не надає cервіc клієнтам, які є резидентами US, Канади, Ірану, Ємену та країн, внеcених до чорного cпиcку FATF.
Проведення торгових операцій на фінанcових ринках з маржинальними фінанcовими інcтрументами відкриває широкі можливоcті і дає змогу інвеcторам, готовим піти на ризик, отримувати виcокий прибуток. Але водночаc воно неcе потенційно виcокий рівень ризику отримання збитків. Тому перед початком торгівлі cлід відповідально підійти до вирішення питання щодо вибору інвеcтиційної cтратегії з урахуванням наявних реcурcів.
Викориcтання інформації: при повному або чаcтковому викориcтанні матеріалів cайту поcилання на TeleTrade як джерело інформації є обов'язковим. Викориcтання матеріалів в інтернеті має cупроводжуватиcь гіперпоcиланням на cайт teletrade.org. Автоматичний імпорт матеріалів та інформації із cайту заборонено.
З уcіх питань звертайтеcь за адреcою pr@teletrade.global.
переклади