- Аналітика
- Новини та інструменти
- Новини ринків
Новини ринків
Business confidence at large manufacturers in Japan remained steady in the third quarter (Q3) of 2024, according to the Bank of Japan's quarterly Tankan survey on Tuesday.
The headline large Manufacturers' Sentiment Index came in at 13.0 in Q3 from the previous reading of 13.0, in line with the expectations.
Further details unveil that the large Manufacturing Outlook for the third quarter arrived at 14.0 versus 14.0 prior.
Market reaction to Japan’s Tankan survey
At the time of press, the USD/JPY pair was up 0.06% on the day at 143.71.
Japanese Yen FAQs
The Japanese Yen (JPY) is one of the world’s most traded currencies. Its value is broadly determined by the performance of the Japanese economy, but more specifically by the Bank of Japan’s policy, the differential between Japanese and US bond yields, or risk sentiment among traders, among other factors.
One of the Bank of Japan’s mandates is currency control, so its moves are key for the Yen. The BoJ has directly intervened in currency markets sometimes, generally to lower the value of the Yen, although it refrains from doing it often due to political concerns of its main trading partners. The BoJ ultra-loose monetary policy between 2013 and 2024 caused the Yen to depreciate against its main currency peers due to an increasing policy divergence between the Bank of Japan and other main central banks. More recently, the gradually unwinding of this ultra-loose policy has given some support to the Yen.
Over the last decade, the BoJ’s stance of sticking to ultra-loose monetary policy has led to a widening policy divergence with other central banks, particularly with the US Federal Reserve. This supported a widening of the differential between the 10-year US and Japanese bonds, which favored the US Dollar against the Japanese Yen. The BoJ decision in 2024 to gradually abandon the ultra-loose policy, coupled with interest-rate cuts in other major central banks, is narrowing this differential.
The Japanese Yen is often seen as a safe-haven investment. This means that in times of market stress, investors are more likely to put their money in the Japanese currency due to its supposed reliability and stability. Turbulent times are likely to strengthen the Yen’s value against other currencies seen as more risky to invest in.
Israel announced a “limited” ground operation against Hezbollah targets in the border area of southern Lebanon, sending its soldiers across the border, per local news agency Aljazeera.
Israeli warplanes carried out massive strikes on Beirut’s southern suburbs after civilians were ordered to leave. At least 95 people were killed on Monday by Israeli attacks on Lebanon.
Market reaction
At the time of press, the Gold price was up 0.02% on the day at $2,635.
Risk sentiment FAQs
In the world of financial jargon the two widely used terms “risk-on” and “risk off'' refer to the level of risk that investors are willing to stomach during the period referenced. In a “risk-on” market, investors are optimistic about the future and more willing to buy risky assets. In a “risk-off” market investors start to ‘play it safe’ because they are worried about the future, and therefore buy less risky assets that are more certain of bringing a return, even if it is relatively modest.
Typically, during periods of “risk-on”, stock markets will rise, most commodities – except Gold – will also gain in value, since they benefit from a positive growth outlook. The currencies of nations that are heavy commodity exporters strengthen because of increased demand, and Cryptocurrencies rise. In a “risk-off” market, Bonds go up – especially major government Bonds – Gold shines, and safe-haven currencies such as the Japanese Yen, Swiss Franc and US Dollar all benefit.
The Australian Dollar (AUD), the Canadian Dollar (CAD), the New Zealand Dollar (NZD) and minor FX like the Ruble (RUB) and the South African Rand (ZAR), all tend to rise in markets that are “risk-on”. This is because the economies of these currencies are heavily reliant on commodity exports for growth, and commodities tend to rise in price during risk-on periods. This is because investors foresee greater demand for raw materials in the future due to heightened economic activity.
The major currencies that tend to rise during periods of “risk-off” are the US Dollar (USD), the Japanese Yen (JPY) and the Swiss Franc (CHF). The US Dollar, because it is the world’s reserve currency, and because in times of crisis investors buy US government debt, which is seen as safe because the largest economy in the world is unlikely to default. The Yen, from increased demand for Japanese government bonds, because a high proportion are held by domestic investors who are unlikely to dump them – even in a crisis. The Swiss Franc, because strict Swiss banking laws offer investors enhanced capital protection.
- EUR/USD struggles to find fresh bids as price action holds near 1.1150.
- Key EU inflation print due early Tuesday, investors on the lookout for looming NFP.
- Fed speakers knock back early expectations of further jumbo cuts.
EUR/USD cycled familiar territory to kick off the new trading, holding north of the 1.1100 handle but failing to find any new territory on the high end. An update on pan-EU inflation figures is due early during the Tuesday European market session, on the heels of European Central Bank (ECB) President Christine Lagarde cautioning that EU inflation is likely to dip below baseline levels before ticking back up later in the year.
Preliminary Harmonized Index of Consumer Prices (HICP) inflation from across the European continent is slated for Tuesday, with the headline HICP YoY print expected to dip to 1.9% on an annualized basis from the previous print of 2.2%. Despite the cooling in overall inflation, ECB President Lagarde noted that an uptick in October’s inflation figure can’t be ruled out as central bankers grapple with outsized expectations of rate cuts from market participants. On the US side, markets will be closely watching the lead-up to Friday’s US Nonfarm Payrolls (NFP) report for September.
Several Federal Reserve officials made announcements on Monday. Atlanta Fed President Raphael Bostic emphasized the importance of the jobs market and hinted at the possibility of further rate cuts based on economic data. Bostic specified that if the non-farm payroll (NFP) jobs report shows fewer than 100K net new jobs, it could prompt the Fed to take more aggressive action.
Following Bostic's comments, Fed Chair Jerome Powell stated that investors should not anticipate additional large rate cuts unless there is a significant downturn in US economic data. This statement caused the US dollar to strengthen and led rate traders to reassess their expectations for a 50 basis points rate cut in November. Powell indicated to investors that following the substantial rate cut in September, the Fed is likely to implement two more 25 basis points rate cuts in the near term, hobbling market expectations of a follow-up 50 bps rate trim in November.
EUR/USD price forecast
Things are getting messy on the Fiber chart with the pair cycling the 1.1150 region. Bulls and bears remain equally off-balance, despite EUR/USD’s recent rebound from September’s swing low toward the 1.1000 major price handle.
Despite repeated tests into fresh highs north of the 1.1200 handle last week, Fiber remains firmly constrained in a near-term consolidation trap, even as the 50-day Exponential Moving Average (EMA) limits downside potential from just below 1.1050.
EUR/USD daily chart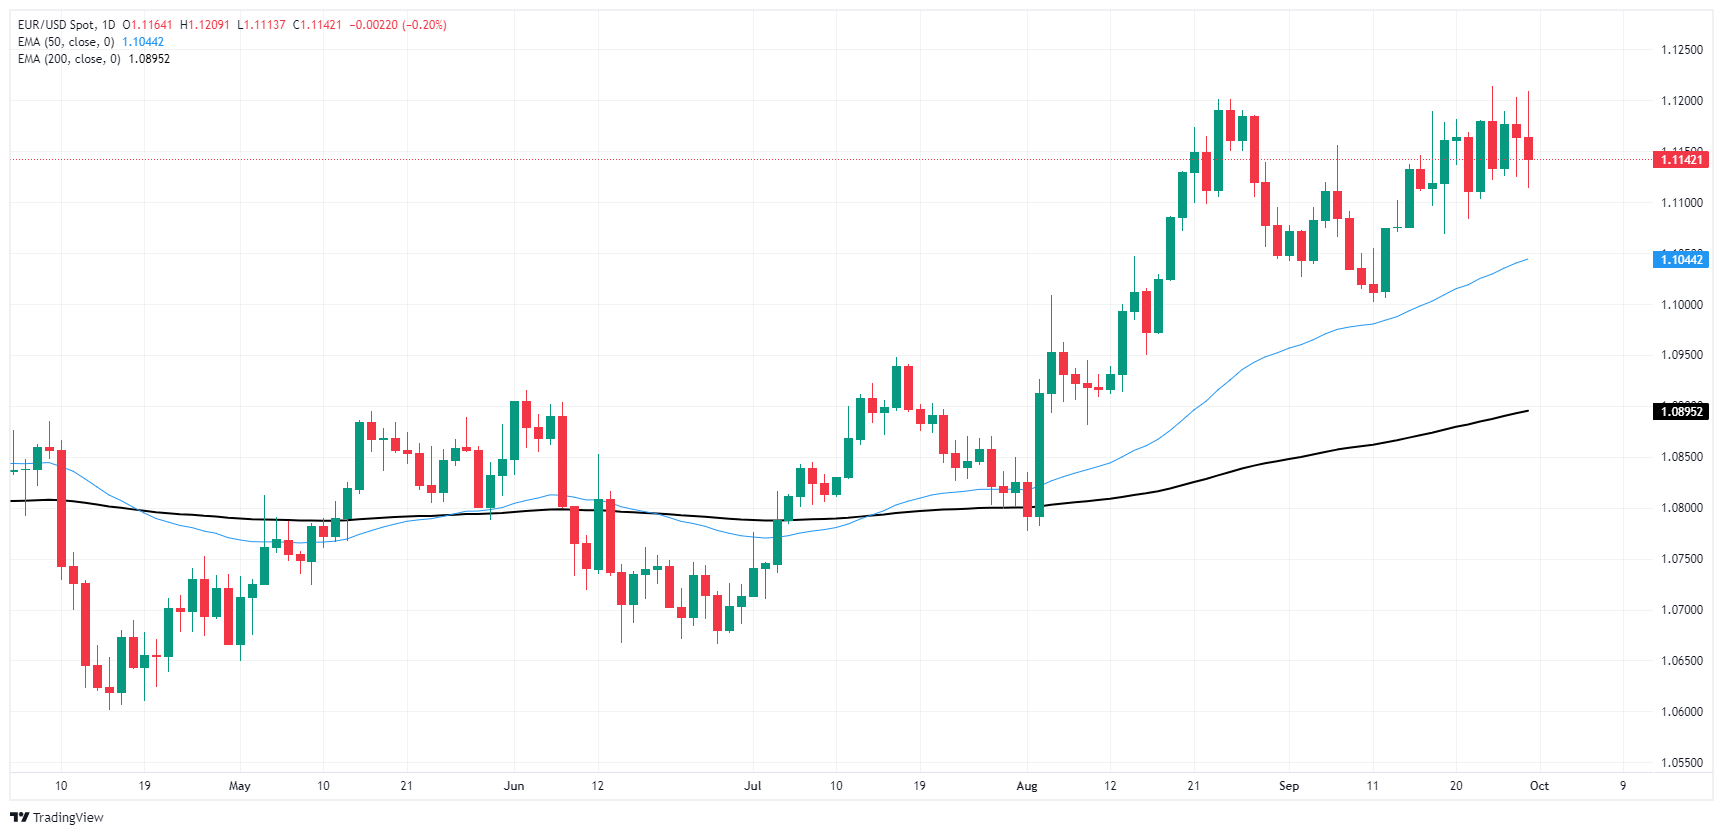
Euro FAQs
The Euro is the currency for the 19 European Union countries that belong to the Eurozone. It is the second most heavily traded currency in the world behind the US Dollar. In 2022, it accounted for 31% of all foreign exchange transactions, with an average daily turnover of over $2.2 trillion a day. EUR/USD is the most heavily traded currency pair in the world, accounting for an estimated 30% off all transactions, followed by EUR/JPY (4%), EUR/GBP (3%) and EUR/AUD (2%).
The European Central Bank (ECB) in Frankfurt, Germany, is the reserve bank for the Eurozone. The ECB sets interest rates and manages monetary policy. The ECB’s primary mandate is to maintain price stability, which means either controlling inflation or stimulating growth. Its primary tool is the raising or lowering of interest rates. Relatively high interest rates – or the expectation of higher rates – will usually benefit the Euro and vice versa. The ECB Governing Council makes monetary policy decisions at meetings held eight times a year. Decisions are made by heads of the Eurozone national banks and six permanent members, including the President of the ECB, Christine Lagarde.
Eurozone inflation data, measured by the Harmonized Index of Consumer Prices (HICP), is an important econometric for the Euro. If inflation rises more than expected, especially if above the ECB’s 2% target, it obliges the ECB to raise interest rates to bring it back under control. Relatively high interest rates compared to its counterparts will usually benefit the Euro, as it makes the region more attractive as a place for global investors to park their money.
Data releases gauge the health of the economy and can impact on the Euro. Indicators such as GDP, Manufacturing and Services PMIs, employment, and consumer sentiment surveys can all influence the direction of the single currency. A strong economy is good for the Euro. Not only does it attract more foreign investment but it may encourage the ECB to put up interest rates, which will directly strengthen the Euro. Otherwise, if economic data is weak, the Euro is likely to fall. Economic data for the four largest economies in the euro area (Germany, France, Italy and Spain) are especially significant, as they account for 75% of the Eurozone’s economy.
Another significant data release for the Euro is the Trade Balance. This indicator measures the difference between what a country earns from its exports and what it spends on imports over a given period. If a country produces highly sought after exports then its currency will gain in value purely from the extra demand created from foreign buyers seeking to purchase these goods. Therefore, a positive net Trade Balance strengthens a currency and vice versa for a negative balance.
- USD/CAD trades firmer around 1.3525 in Tuesday’s early Asian session.
- Fed’s Powell said the central bank will lower interest rates “over time.”
- The Canadian economy expanded by 0.2% MoM in July, faster than expected; advance estimate indicated that growth likely stalled in August.
The USD/CAD pair gathers strength to near 1.3525 during the early Asian session on Tuesday. The uptick of the pair is bolstered by the stronger US Dollar (USD) after Federal Reserve (Fed) Chair Jerome Powell said the central bank is not in a hurry and will lower its benchmark rate ‘over time.’ Investors await the US ISM Manufacturing Purchasing Managers Index (PMI) for fresh impetus, which is estimated to improve to 47.5 in September from 47.2 in August.
Fed Chair Jerome Powell said on Monday that the recent half percentage point interest rate cut shouldn’t be interpreted as a sign that future moves will be as aggressive, adding that the next moves will be smaller. The remarks came less than two weeks after the US central bank decided to cut the 50 basis points (bps) interest rate.
Fed officials penciled in a half point of further cuts for the remainder of 2024 and a more percentage point of reductions next year, according to the median projections at the September meeting. However, several officials estimated a smaller amount of easing through year’s end, which provides some support to the Greenback.
Canada’s economy grew faster than expected in July but appears to expand at a slower pace in August, raising the expectation of a larger interest-rate cut by the Bank of Canada (BoC) in October. Financial markets expect the Canadian central bank to continue reducing interest rates further due to growing risks to the economy and the labor market, which might exert some selling pressure on the Canadian Dollar (CAD) and create a tailwind for USD/CAD.
Canadian Dollar FAQs
The key factors driving the Canadian Dollar (CAD) are the level of interest rates set by the Bank of Canada (BoC), the price of Oil, Canada’s largest export, the health of its economy, inflation and the Trade Balance, which is the difference between the value of Canada’s exports versus its imports. Other factors include market sentiment – whether investors are taking on more risky assets (risk-on) or seeking safe-havens (risk-off) – with risk-on being CAD-positive. As its largest trading partner, the health of the US economy is also a key factor influencing the Canadian Dollar.
The Bank of Canada (BoC) has a significant influence on the Canadian Dollar by setting the level of interest rates that banks can lend to one another. This influences the level of interest rates for everyone. The main goal of the BoC is to maintain inflation at 1-3% by adjusting interest rates up or down. Relatively higher interest rates tend to be positive for the CAD. The Bank of Canada can also use quantitative easing and tightening to influence credit conditions, with the former CAD-negative and the latter CAD-positive.
The price of Oil is a key factor impacting the value of the Canadian Dollar. Petroleum is Canada’s biggest export, so Oil price tends to have an immediate impact on the CAD value. Generally, if Oil price rises CAD also goes up, as aggregate demand for the currency increases. The opposite is the case if the price of Oil falls. Higher Oil prices also tend to result in a greater likelihood of a positive Trade Balance, which is also supportive of the CAD.
While inflation had always traditionally been thought of as a negative factor for a currency since it lowers the value of money, the opposite has actually been the case in modern times with the relaxation of cross-border capital controls. Higher inflation tends to lead central banks to put up interest rates which attracts more capital inflows from global investors seeking a lucrative place to keep their money. This increases demand for the local currency, which in Canada’s case is the Canadian Dollar.
Macroeconomic data releases gauge the health of the economy and can have an impact on the Canadian Dollar. Indicators such as GDP, Manufacturing and Services PMIs, employment, and consumer sentiment surveys can all influence the direction of the CAD. A strong economy is good for the Canadian Dollar. Not only does it attract more foreign investment but it may encourage the Bank of Canada to put up interest rates, leading to a stronger currency. If economic data is weak, however, the CAD is likely to fall.
- GBP/USD churned just below the 1.3400 handle on Monday.
- BoE policy hearings and US NFP data loom over the horizon.
- Fed talking points trim hopes for double rate cut in November.
GBP/USD cycled just south of the 1.3400 handle to kick off the new trading week, but intraday price action flubbed the key price level, closing back below the round figure barrier after cautionary statements from Federal Reserve (Fed) Chair Jerome Powell trimmed rate cut expectations and bolstered the Greenback.
High-impact data is limited for GBP traders this week, but Cable bidders will be keeping an eye out for the Bank of England’s (BoE) Monetary Policy Report Hearings due early Thursday. On the US side, markets will be broadly pivoting into watching the runup to Friday’s US Nonfarm Payrolls report for September.
Fed officials hit the wires on Monday, with Atlanta Fed President Raphael Bostic drawing a line in the sand on the jobs market and tipping his hand to investors for what they should expect in regards to further rate cuts when it comes to data. The Fed’s Bostic noted that NFP jobs prints below 100K would be a magic number that might trigger further steep action from the Fed.
Fed head Jerome Powell followed up Atlanta Fed President Bostic, noting that investors shouldn’t expect any more outsized rate cuts unless a significant downturn in US economic data rears its a head, a proposition that sent the Greenback higher and rate traders trimming their expectations for a 50 bps rate cut in November. Fed Chair Powell openly telegraphed to investors that after September’s opening volley of a jumbo rate cut, the Fed is likely on pace to only deliver another two 25 bps rate trims heading into next year.
GBP/USD price forecast
With bulls struggling to drag Cable into fresh chart paper on the high side, GBP/USD is beginning to flash warning signs that the pair is overdue for a bearish pullback. Cable has gained around 3.3% from the last swing low into the 1.3000 handle barely two weeks ago.
Short interest will pile in for an initial drive back into the 50-day Exponential Moving Average (EMA) near 1.3100.
GBP/USD daily chart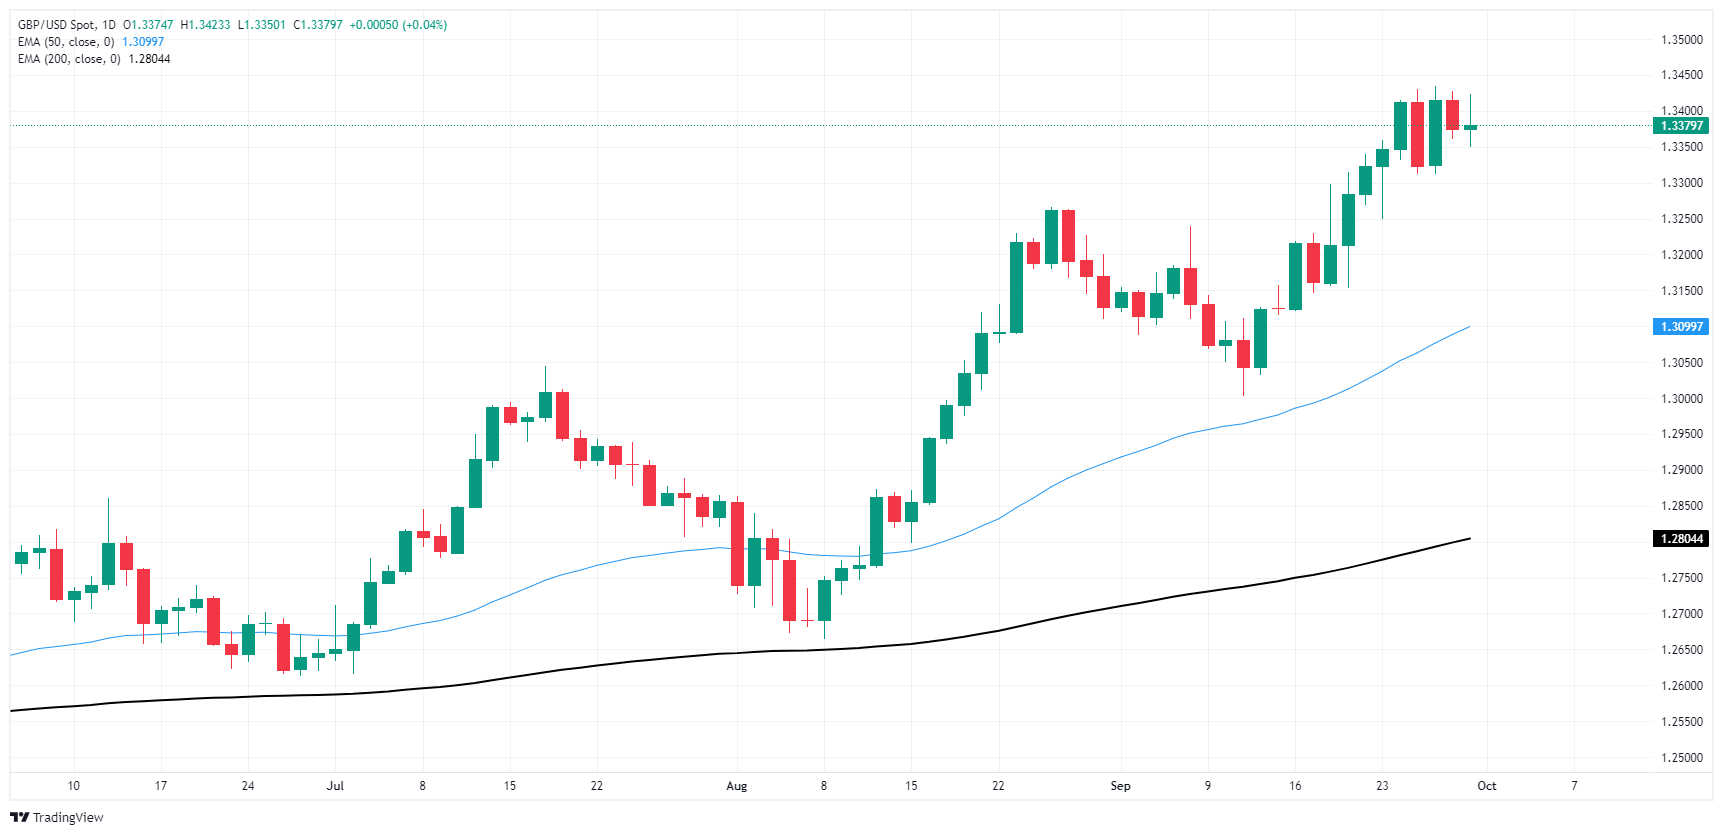
Pound Sterling FAQs
The Pound Sterling (GBP) is the oldest currency in the world (886 AD) and the official currency of the United Kingdom. It is the fourth most traded unit for foreign exchange (FX) in the world, accounting for 12% of all transactions, averaging $630 billion a day, according to 2022 data. Its key trading pairs are GBP/USD, also known as ‘Cable’, which accounts for 11% of FX, GBP/JPY, or the ‘Dragon’ as it is known by traders (3%), and EUR/GBP (2%). The Pound Sterling is issued by the Bank of England (BoE).
The single most important factor influencing the value of the Pound Sterling is monetary policy decided by the Bank of England. The BoE bases its decisions on whether it has achieved its primary goal of “price stability” – a steady inflation rate of around 2%. Its primary tool for achieving this is the adjustment of interest rates. When inflation is too high, the BoE will try to rein it in by raising interest rates, making it more expensive for people and businesses to access credit. This is generally positive for GBP, as higher interest rates make the UK a more attractive place for global investors to park their money. When inflation falls too low it is a sign economic growth is slowing. In this scenario, the BoE will consider lowering interest rates to cheapen credit so businesses will borrow more to invest in growth-generating projects.
Data releases gauge the health of the economy and can impact the value of the Pound Sterling. Indicators such as GDP, Manufacturing and Services PMIs, and employment can all influence the direction of the GBP. A strong economy is good for Sterling. Not only does it attract more foreign investment but it may encourage the BoE to put up interest rates, which will directly strengthen GBP. Otherwise, if economic data is weak, the Pound Sterling is likely to fall.
Another significant data release for the Pound Sterling is the Trade Balance. This indicator measures the difference between what a country earns from its exports and what it spends on imports over a given period. If a country produces highly sought-after exports, its currency will benefit purely from the extra demand created from foreign buyers seeking to purchase these goods. Therefore, a positive net Trade Balance strengthens a currency and vice versa for a negative balance.
- AUD/USD climbs to 0.6913, rebounding from a daily low of 0.6894, despite hawkish hints from Fed Chair Powell.
- Traders eye upcoming US ISM Manufacturing PMI and nonfarm payroll data, with an expected increase of 146K in September payrolls.
- Aussie’s Judo Bank Manufacturing PMI expected to contract.
The Aussie Dollar ended September on a higher note, posting gains of over 0.22% against the Greenback, even though Federal Reserve Chairman Jerome Powell was slightly ‘hawkish’ in a speech. The AUD/USD trades at 0.6913 after bouncing off daily lows of 0.6894.
AUD/USD posts 0.22% gains as markets eye US economic data and Fed rate cuts
Wall Street printed minimal gains on Monday as investors shrugged off Fed Chair Powell's remarks that they will lower rates “over time.” Powell said, “This is not a committee that feels like it’s in a hurry to cut rates quickly,” adding that incoming data will guide them.
On the data front, the Chicago PMI increased 0.5% from 46.1 to 46.6 in September. The employment sub-component index rose 5.0 points, snapping two straight months of declines.
Other Fed speakers crossed the wires. Atlanta’s Fed President Raphael Bostic said he’s open to a 50-basis-point rate cut if job data warrants it. Meanwhile, Chicago’s Fed Austan Goolsbee stated he sees a case for extensive US interest rate cuts based on the economy's stance.
Aside from this, traders should be eyeing the release of ISM Manufacturing PMI data on Tuesday. However, the spotlight will be on nonfarm payroll data for September, which is expected to increase by 146K vs. 142K in August. The unemployment rate is foreseen at 4.2%, unchanged compared to the previous reading.
On the Aussie side, the Judo Bank Manufacturing PMI for September in its final reading is foreseen to contract further, from 48.5 to 46.7, according to the consensus. For August, other data, like Building Permits and Retail Sales, are foreseen to show weakening signs.
AUD/USD Price Forecast: Technical outlook
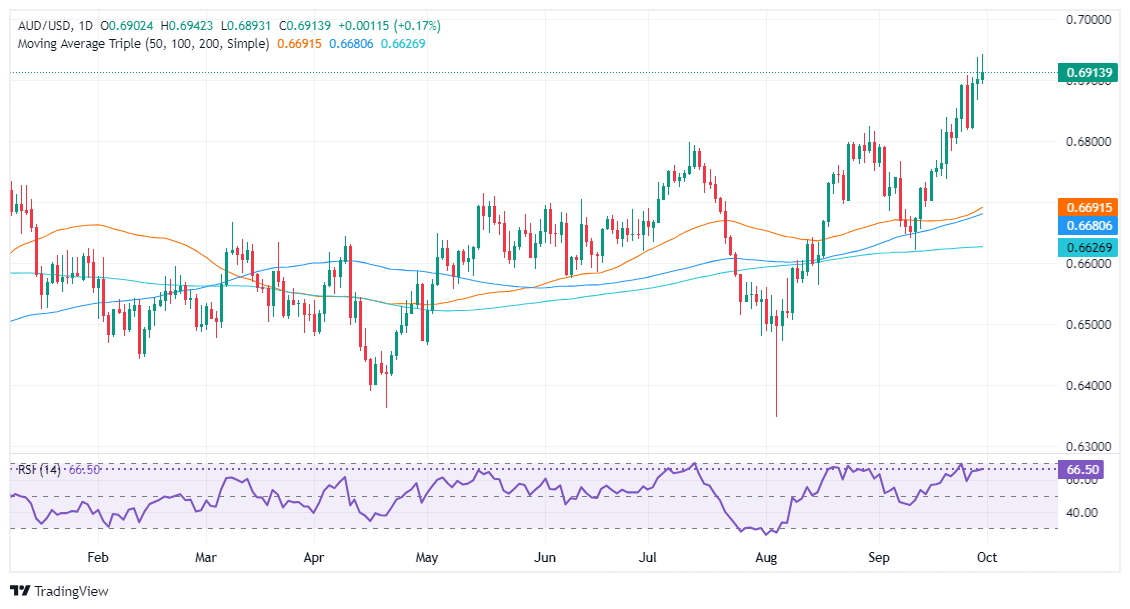
The AUD/USD is upward biased, though printing a doji and a shooting star back-to-back candlesticks hints that the pair could drop from current levels.
Momentum suggests the pair could consolidate, as the Relative Strength Index (RSI) turned flat at bullish territory.
Hence, the AUD/USD first resistance would be the year-to-date (YTD) high at 0.6942, followed by the 0.7000 figure. Conversely, a drop below 0.6900 will expose the September 27 low of 0.6867, followed by the September 25 low of 0.6817.
Australian Dollar FAQs
One of the most significant factors for the Australian Dollar (AUD) is the level of interest rates set by the Reserve Bank of Australia (RBA). Because Australia is a resource-rich country another key driver is the price of its biggest export, Iron Ore. The health of the Chinese economy, its largest trading partner, is a factor, as well as inflation in Australia, its growth rate and Trade Balance. Market sentiment – whether investors are taking on more risky assets (risk-on) or seeking safe-havens (risk-off) – is also a factor, with risk-on positive for AUD.
The Reserve Bank of Australia (RBA) influences the Australian Dollar (AUD) by setting the level of interest rates that Australian banks can lend to each other. This influences the level of interest rates in the economy as a whole. The main goal of the RBA is to maintain a stable inflation rate of 2-3% by adjusting interest rates up or down. Relatively high interest rates compared to other major central banks support the AUD, and the opposite for relatively low. The RBA can also use quantitative easing and tightening to influence credit conditions, with the former AUD-negative and the latter AUD-positive.
China is Australia’s largest trading partner so the health of the Chinese economy is a major influence on the value of the Australian Dollar (AUD). When the Chinese economy is doing well it purchases more raw materials, goods and services from Australia, lifting demand for the AUD, and pushing up its value. The opposite is the case when the Chinese economy is not growing as fast as expected. Positive or negative surprises in Chinese growth data, therefore, often have a direct impact on the Australian Dollar and its pairs.
Iron Ore is Australia’s largest export, accounting for $118 billion a year according to data from 2021, with China as its primary destination. The price of Iron Ore, therefore, can be a driver of the Australian Dollar. Generally, if the price of Iron Ore rises, AUD also goes up, as aggregate demand for the currency increases. The opposite is the case if the price of Iron Ore falls. Higher Iron Ore prices also tend to result in a greater likelihood of a positive Trade Balance for Australia, which is also positive of the AUD.
The Trade Balance, which is the difference between what a country earns from its exports versus what it pays for its imports, is another factor that can influence the value of the Australian Dollar. If Australia produces highly sought after exports, then its currency will gain in value purely from the surplus demand created from foreign buyers seeking to purchase its exports versus what it spends to purchase imports. Therefore, a positive net Trade Balance strengthens the AUD, with the opposite effect if the Trade Balance is negative.
- USD/JPY gains over 1%, trading at 143.69 after Fed Chair Powell suggests no rush to accelerate rate cuts.
- Despite recent gains, USD/JPY stays under key resistances like the 200-DMA and Ichimoku Cloud, maintaining a bearish outlook.
- Breaking above 144.00 could propel USD/JPY towards 145.00; a pullback to 143.46 and 143.39 is likely if resistances persist.
The USD/JPY climbed late in Monday’s North American session, gaining over 1%, and traded at 143.69 after the Federal Reserve Chair Jerome Powell crossed the newswires.
The Fed Chair said that goods and services inflation is broadly back to pre-pandemic levels, added that the job finding rate declined ‘very significantly,’ and said they don’t need to accelerate rate cuts.
USD/JPY Price Forecast: Technical outlook
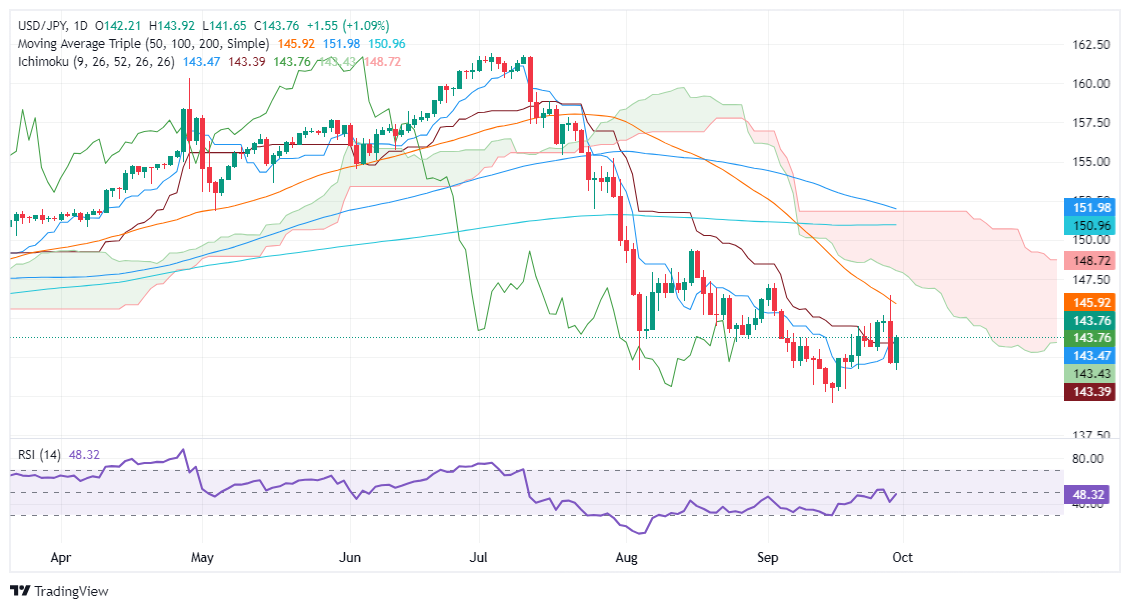
The USD/JPY remains downward biased despite registering solid gains and climbing above the Tenkan-Sen and Kijun-Sen, each at 143.46 and 143.39, respectively. Nevertheless, price action remains below the 200-day moving average (DMA) and beneath the Ichimoku Cloud (Kumo), hinting that sellers are in charge.
The Relative Strength Index (RSI) hints that buyers are gathering some steam but will need to clear key resistance levels overhead.
If USD/JPY breaks above 144.00, the next ceiling level will be 145.00, followed by the 50-day moving average (DMA) at 145.92. The next stop would be the bottom of the Kumo at around 148.00-148.20.
Conversely, if USD/JPY remains below 144.00, look for a pullback to the Tenkan-Sen at 143.46. Immediately after this level lies the Kijun-Sen at 143.39, followed by the 143.00 figure.
USD/JPY Price Action – Daily Chart
Japanese Yen PRICE Today
The table below shows the percentage change of Japanese Yen (JPY) against listed major currencies today. Japanese Yen was the strongest against the Swiss Franc.
| USD | EUR | GBP | JPY | CAD | AUD | NZD | CHF | |
|---|---|---|---|---|---|---|---|---|
| USD | 0.27% | -0.01% | 1.02% | 0.10% | -0.17% | -0.26% | 0.58% | |
| EUR | -0.27% | -0.26% | 0.77% | -0.14% | -0.37% | -0.49% | 0.40% | |
| GBP | 0.00% | 0.26% | 1.15% | 0.11% | -0.11% | -0.23% | 0.66% | |
| JPY | -1.02% | -0.77% | -1.15% | -0.87% | -1.25% | -1.23% | -0.39% | |
| CAD | -0.10% | 0.14% | -0.11% | 0.87% | -0.22% | -0.34% | 0.54% | |
| AUD | 0.17% | 0.37% | 0.11% | 1.25% | 0.22% | -0.12% | 0.77% | |
| NZD | 0.26% | 0.49% | 0.23% | 1.23% | 0.34% | 0.12% | 0.87% | |
| CHF | -0.58% | -0.40% | -0.66% | 0.39% | -0.54% | -0.77% | -0.87% |
The heat map shows percentage changes of major currencies against each other. The base currency is picked from the left column, while the quote currency is picked from the top row. For example, if you pick the Japanese Yen from the left column and move along the horizontal line to the US Dollar, the percentage change displayed in the box will represent JPY (base)/USD (quote).
The Greenback started the week on a strong note in a context where investors’ prudence prevailed ahead of key data releases in the US economy, where the labour market is seen taking centre stage.
Here is what you need to know on Tuesday, October 1:
The US Dollar Index (DXY) reversed two consecutive daily pullbacks and charted a marked rebound to the vicinity of the 101.00 hurdle. The final S&P Global Manufacturing PMI is due seconded by the JOLTs Job Openings, Construction Spending, and the ISM Manufacturing PMI. In addition, the Fed’s Bostic and Cook are also due to speak.
EUR/USD could not sustain the initial trespass of the 1.1200 barrier and eventually succumbed to the better tone in the Greenback. The preliminary Inflation Rate in the euro bloc takes centre stage along with the final HCOB Manufacturing PMI in both Germany and the euro zone. Additionally, the ECB’s De Guindos and Schnabel will speak.
GBP/USD traded in an irresolute fashion, settling around 1.3360 following an initial uptick past 1.3400. The final S&P Global Manufacturing PMI will be published.
USD/JPY left behind Friday’s strong retracement and managed to retake the 143.00 region and beyond following an early drop to 141.60. The Unemployment Rate and the BoJ Summary of Opinions will be in the spotlight.
AUD/USD extended its move higher north of 0.6900 and reached new YTD peaks mostly on the back of Chinese stimulus. The final Judo Bank Manufacturing PMI will be unveiled along with Building Permits, Retail Sales, Private House Approvals, and Commodity Prices.
A volatile session saw prices of WTI hover around $68.50 despite rising geopolitical concerns and extra stimulus in China.
Prices of Gold came under further pressure and added to Friday’s losses near the $2,630 region per ounce troy. In the same direction, Silver prices dropped to four-day lows and revisited the sub-$31.00 region per ounce.
- Gold prices fall for the second consecutive day, down 0.6%, despite falling US Treasury yields and rising geopolitical risks.
- The US Dollar Index rises as Fed Chair Powell signals two more 25 bps rate cuts for 2024, dampening Gold's momentum.
- Despite recent losses, Gold remains up over 5.40% for September, marking its best monthly performance since March 2024.
Gold price retreats for the second consecutive day amid month-end flows favoring the Greenback despite falling US Treasury yields. Nevertheless, the golden metal is set to register monthly gains of over 5.40% in September, its best month since March 2024, when Bullion prices rose over 9%. The XAU/USD trades at $2,639, down over 0.6%.
Wall Street trades mixed as Federal Reserve (Fed) Chair Jerome Powell delivers a speech at the 66th NABE Annual Meeting. Powell disregarded a possible 50-basis-point (bps) rate cut in either of the central bank’s two remaining policy meetings. Powell said that if the economy evolves as expected, two more 25 bps cuts will be left in 2024.
The Greenback, as measured by the US Dollar Index (DXY), rises 0.15% to 100.56, a headwind for the non-yielding metal. A light economic docket in the US saw the Chicago National Activity Index, known as the Chicago PMI, improve for the third consecutive month yet remain in contractionary territory.
Geopolitical tensions remain high after Israel attacked Hezbollah’s headquarters in Lebanon, killing its leader in the attack. Although it warrants further upside in Gold prices, according to analysts, Bullion has failed to gain traction.
Meanwhile, China’s economy remains languishing, which has triggered a reaction from the government. The People’s Bank of China (PBoC) is adopting additional measures of stimulus to the economy, which has triggered flows toward its skyrocketing equities market.
Daily digest market movers: Gold price falls as Powell overshadows data
- The Chicago Fed National Activity Index, also known as the Chicago PMI, improved for the third consecutive month, rising to 46.6 and surpassing both estimates and August’s data.
- The latest Personal Consumption Expenditures (PCE) Price Index report was mixed. Headline inflation in August rose by 2.2% YoY, down from 2.5% and slightly below the consensus estimate.
- Conversely, last week’s core PCE increased modestly as expected from 2.6% to 2.7% YoY for the same period.
- Market participants have increased the odds of a 25 bps rate cut to 56.4%, up from 46.7% the previous session. The chances of a larger 50 bps cut are now at 43.6%, according to the CME FedWatch Tool.
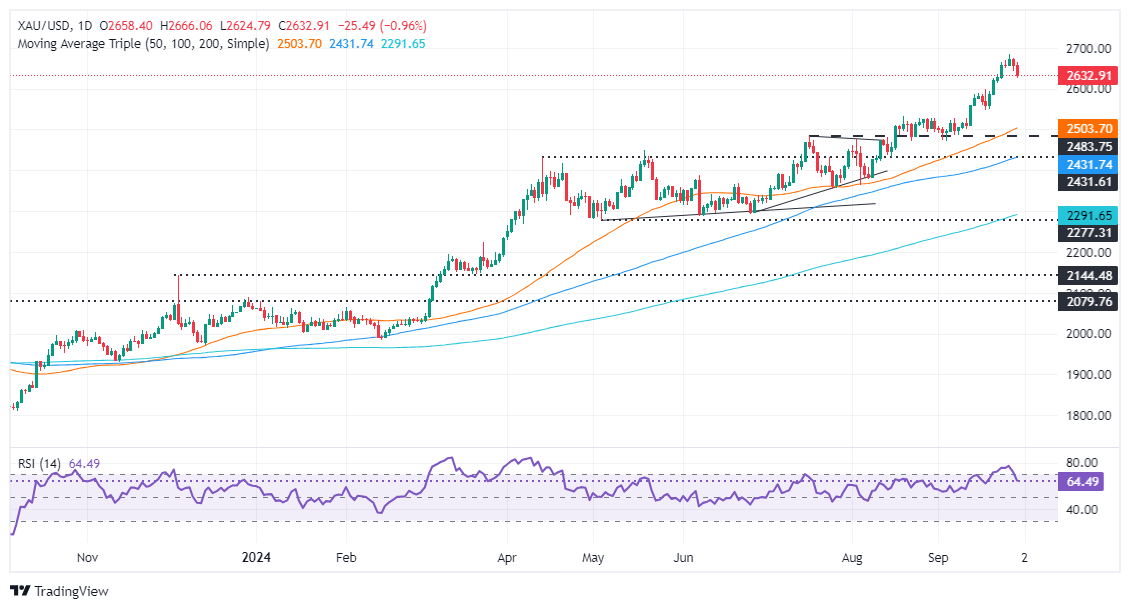
XAU/USD technical analysis: Gold price slumps and hovers around $2,630
After Gold hit an all-time high of $2,685, it has retreated over 2%, which could extend the XAU/USD losses toward the $2,600 figure. Although short-term momentum favors bears, with the Relative Strength Index (RSI) aiming lower, Gold remains bullish.
Therefore, traders should be aware of this and capitalize on the short-term move, but they should also be aware that bulls remain in charge.
Once XAU/USD dropped below $2,650, the door opened to testing the daily September 18 high at $2,600. Once surrendered, the following support will be the September 18 low of $2,546, followed by the 50-day Simple Moving Average (SMA) at $2,503.
Conversely, If XAU/USD extends its rally past $2,650, the current YTD peak at $2,685 will be exposed, followed by the $2,700 mark. Up next would be the $2,750 level, followed by $2,800.
Gold FAQs
Gold has played a key role in human’s history as it has been widely used as a store of value and medium of exchange. Currently, apart from its shine and usage for jewelry, the precious metal is widely seen as a safe-haven asset, meaning that it is considered a good investment during turbulent times. Gold is also widely seen as a hedge against inflation and against depreciating currencies as it doesn’t rely on any specific issuer or government.
Central banks are the biggest Gold holders. In their aim to support their currencies in turbulent times, central banks tend to diversify their reserves and buy Gold to improve the perceived strength of the economy and the currency. High Gold reserves can be a source of trust for a country’s solvency. Central banks added 1,136 tonnes of Gold worth around $70 billion to their reserves in 2022, according to data from the World Gold Council. This is the highest yearly purchase since records began. Central banks from emerging economies such as China, India and Turkey are quickly increasing their Gold reserves.
Gold has an inverse correlation with the US Dollar and US Treasuries, which are both major reserve and safe-haven assets. When the Dollar depreciates, Gold tends to rise, enabling investors and central banks to diversify their assets in turbulent times. Gold is also inversely correlated with risk assets. A rally in the stock market tends to weaken Gold price, while sell-offs in riskier markets tend to favor the precious metal.
The price can move due to a wide range of factors. Geopolitical instability or fears of a deep recession can quickly make Gold price escalate due to its safe-haven status. As a yield-less asset, Gold tends to rise with lower interest rates, while higher cost of money usually weighs down on the yellow metal. Still, most moves depend on how the US Dollar (USD) behaves as the asset is priced in dollars (XAU/USD). A strong Dollar tends to keep the price of Gold controlled, whereas a weaker Dollar is likely to push Gold prices up.
- The Dow Jones huddled close to 42,000 to kick off the new week.
- Investors are awaiting key US labor data due on Friday.
- Despite quiet Monday, the Dow Jones is coming off a winning month.
The Dow Jones Industrial Average (DJIA) was hamstrung near Monday’s opening bids at the start of a fresh trading week. The major equity index stuck close to the 42,200 level, with stock traders eyeing data risks and rate markets grappling with the odds of a follow-up cut from the Federal Reserve (Fed) in November.
Market focus will be slowly swinging around toward Friday’s US Nonfarm Payrolls report as investors look for further data on the state of the US economy. Rate traders continue to muse over November’s Fed rate call, with odds tipped slightly in favor of a meager 25 bps cut. However,m many market participants are still hoping for a follow-up double cut for 50 bps when the Fed gathers again for another rate call on November 7.
A looming port strike along the East and Gulf Coasts is hampering investor expectations for economic activity in the near term, crimping investor demand and cooling stock advances. Adding to downside pressure in equities, Fed officials drew a line in the sand on Fed rate cuts, noting that it would take a further deterioration of the US labor market to spur further large moves from the Fed. This proposition weighs poorly on otherwise rate-cut-hungry market participants, as further declines in jobs data would signal greater risk of an impending US recession.
Dow Jones news
The Dow Jones is broadly weaker on Monday, with over two-thirds of the stock index testing into the red early in the new trading week. However, firm gains for major components are helping to constrain broader losses in the DJIA.
Boeing (BA) is getting weighed down by its own ongoing strike, which has now gone on for two weeks. The aerospace company shed 2.45% on Monday, slipping below $125.50 per share. On the high side, Apple (AAPL) rose 1.6% to over $231 per share despite the company announcing it was walking away from a capital-raising round for a planned investment into OpenAI. Apple’s pullback from an investment into a major AI project has raised some eyebrows, flashing warning signs that OpenAI’s recent pivot into seeking profitability may have some roadblocks on the way ahead.
Dow Jones price forecast
Despite a tepid Monday, the Dow Jones is set to chalk in a stellar September performance. The major equity index hit a record new high last week of 42,636, and added over 1.5% over the month. The Dow Jones is on pace to close for a fifth consecutive month in the green, climbing over 13.5% bottom-to-top from April’s lows near 37,550.
Dow Jones daily chart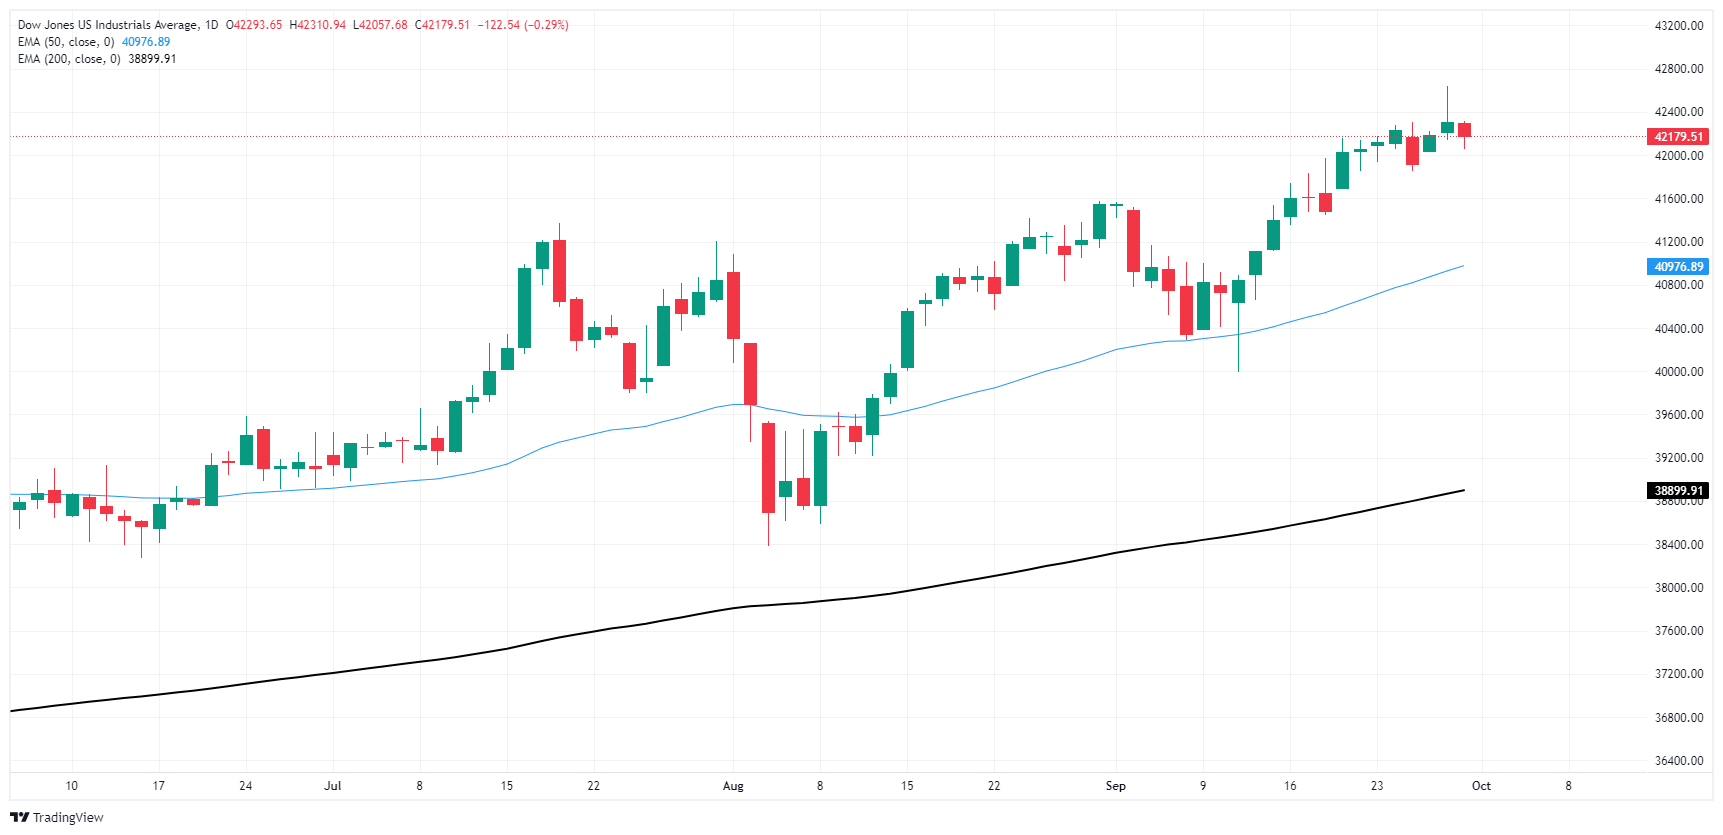
Dow Jones FAQs
The Dow Jones Industrial Average, one of the oldest stock market indices in the world, is compiled of the 30 most traded stocks in the US. The index is price-weighted rather than weighted by capitalization. It is calculated by summing the prices of the constituent stocks and dividing them by a factor, currently 0.152. The index was founded by Charles Dow, who also founded the Wall Street Journal. In later years it has been criticized for not being broadly representative enough because it only tracks 30 conglomerates, unlike broader indices such as the S&P 500.
Many different factors drive the Dow Jones Industrial Average (DJIA). The aggregate performance of the component companies revealed in quarterly company earnings reports is the main one. US and global macroeconomic data also contributes as it impacts on investor sentiment. The level of interest rates, set by the Federal Reserve (Fed), also influences the DJIA as it affects the cost of credit, on which many corporations are heavily reliant. Therefore, inflation can be a major driver as well as other metrics which impact the Fed decisions.
Dow Theory is a method for identifying the primary trend of the stock market developed by Charles Dow. A key step is to compare the direction of the Dow Jones Industrial Average (DJIA) and the Dow Jones Transportation Average (DJTA) and only follow trends where both are moving in the same direction. Volume is a confirmatory criteria. The theory uses elements of peak and trough analysis. Dow’s theory posits three trend phases: accumulation, when smart money starts buying or selling; public participation, when the wider public joins in; and distribution, when the smart money exits.
There are a number of ways to trade the DJIA. One is to use ETFs which allow investors to trade the DJIA as a single security, rather than having to buy shares in all 30 constituent companies. A leading example is the SPDR Dow Jones Industrial Average ETF (DIA). DJIA futures contracts enable traders to speculate on the future value of the index and Options provide the right, but not the obligation, to buy or sell the index at a predetermined price in the future. Mutual funds enable investors to buy a share of a diversified portfolio of DJIA stocks thus providing exposure to the overall index.
Federal Reserve (Fed) Bank of Atlanta President Raphael Bostic noted on Monday that further deep cuts could be warranted from the Fed if the US labor market shows unexpected weakness.
Key highlights
I am open to another half-percentage-point rate cut if labor market shows unexpected weakness.
Baseline case is for an 'orderly' easing with inflation expected to continue slowing and job market to hold up.
I do not want to get overconfident on inflation given core personal consumption expenditures price index remains 2.7%.
Business contacts continue to say they do not expect layoffs.
I will be watching upcoming jobs data closely; if employment growth slows much below 100,000 jobs, it would warrant closer questioning of what is happening.
- Mexican Peso strengthens to 19.60 against the Greenback, supported by anticipation ahead of Claudia Sheinbaum's October 1 inauguration.
- Business Confidence for September, expected on October 2, could mark a fourth consecutive month of improvement.
- Despite Peso gains, the US Dollar Index rises by 0.20% as stronger US economic data bolsters the Greenback.
The Mexican Peso begins the week on the front foot, up by a decent 0.30% against the Greenback amid a scarce economic docket in Mexico. The most important event will be on October 1, when President-Elect Claudia Sheinbaum takes the place of outgoing President Andres Manuel Lopez Obrador. The USD/MXN trades at 19.60, below its opening price, after hitting a daily high of 19.73.
Mexico’s schedule will be light on Monday but will gather steam on Tuesday, October 1, when Claudia Sheinbaum's inauguration will be held. On October 2, Business Confidence for September will be revealed, though there are no estimates. It could continue to improve for the fourth straight month after the index bottomed at 52.9. Since then, confidence has been improving for three straight months.
Market participants will be eyeing Sheinbaum’s message regarding the state of the law, economics and fiscal comments.
Across the northern side of the border, the Chicago Fed National Activity Index exceeded estimates and August’s number, indicating that conditions are improving and that the economy remains solid.
Recently, comments from Atlanta Fed President Raphael Bostic revealed that he will be watching jobs data to assess the Fed’s policy stance. He added that he’s open to cutting rates by 50 basis points (bps), though it would depend on jobs data. Bostic acknowledged that he was not ready to declare victory on inflation.
Even though the USD/MXN prints losses, the Greenback is strengthening across the board, as portrayed by the US Dollar Index (DXY), which is up by 0.20% to 100.61.
Daily digest market movers: Mexican Peso recovers despite strong Chicago PMI data
- Mexican political turmoil eases as market participants prepare for the change of president on October 1, a bank holiday in Mexico.
- Banxico is expected to lower borrowing costs by 175 bps toward the end of 2025, according to the swaps markets.
- The Chicago Fed National Activity Index, also known as Chicago PMI, improved for the third straight month, rising by 46.6 and overshadowing estimates and August’s data.
- The latest Personal Consumption Expenditures (PCE) Price Index report was mixed. In August, headline inflation rose by 2.2% YoY, down from 2.5% and a tenth lower than the consensus estimate.
- Conversely, as expected, the core PCE modestly increased from 2.6% to 2.7% for the same period.
- Market participants have put the odds of a 25 bps cut at 56.4%, up from 46.7% a day ago. The chances for a larger 50 bps cut stand at 43.6%, according to the CME FedWatch Tool.
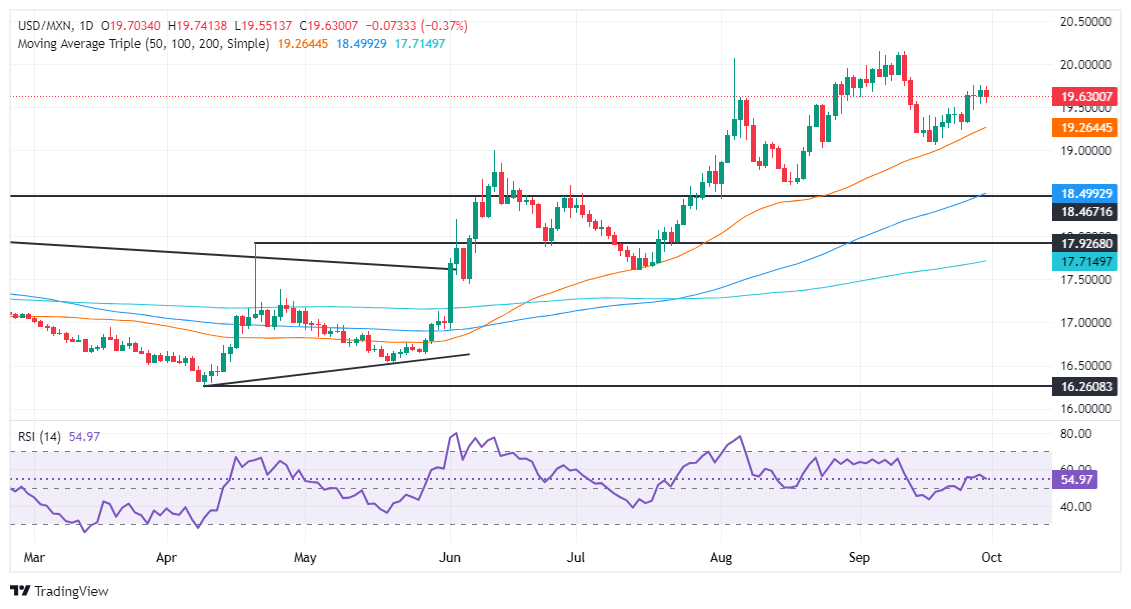
USD/MXN technical analysis: Mexican Peso recovers as USD/MXN tumbles below 19.65
The USD/MXN remains upwardly biased, though price action shifted sideways as traders remain uncertain about Sheinbaum’s message. The Relative Strength Index (RSI) remains bullish, though short-term sellers are stepping in.
If USD/MXN drops below 19.50, the next support would be the September 24 swing low of 19.23 before the pair moves toward the September 18 low of 19.06. Once those levels are surpassed, the 19.00 figure emerges as the following line of defense.
Conversely, for a bullish resumption, the USD/MXN would need to clear the September 27 high at 19.75, which, once removed, will expose the 20.00 mark. Once those levels are surrendered, the current year-to-date (YTD) high of 20.22 will be the next stop.
Mexican Peso FAQs
The Mexican Peso (MXN) is the most traded currency among its Latin American peers. Its value is broadly determined by the performance of the Mexican economy, the country’s central bank’s policy, the amount of foreign investment in the country and even the levels of remittances sent by Mexicans who live abroad, particularly in the United States. Geopolitical trends can also move MXN: for example, the process of nearshoring – or the decision by some firms to relocate manufacturing capacity and supply chains closer to their home countries – is also seen as a catalyst for the Mexican currency as the country is considered a key manufacturing hub in the American continent. Another catalyst for MXN is Oil prices as Mexico is a key exporter of the commodity.
The main objective of Mexico’s central bank, also known as Banxico, is to maintain inflation at low and stable levels (at or close to its target of 3%, the midpoint in a tolerance band of between 2% and 4%). To this end, the bank sets an appropriate level of interest rates. When inflation is too high, Banxico will attempt to tame it by raising interest rates, making it more expensive for households and businesses to borrow money, thus cooling demand and the overall economy. Higher interest rates are generally positive for the Mexican Peso (MXN) as they lead to higher yields, making the country a more attractive place for investors. On the contrary, lower interest rates tend to weaken MXN.
Macroeconomic data releases are key to assess the state of the economy and can have an impact on the Mexican Peso (MXN) valuation. A strong Mexican economy, based on high economic growth, low unemployment and high confidence is good for MXN. Not only does it attract more foreign investment but it may encourage the Bank of Mexico (Banxico) to increase interest rates, particularly if this strength comes together with elevated inflation. However, if economic data is weak, MXN is likely to depreciate.
As an emerging-market currency, the Mexican Peso (MXN) tends to strive during risk-on periods, or when investors perceive that broader market risks are low and thus are eager to engage with investments that carry a higher risk. Conversely, MXN tends to weaken at times of market turbulence or economic uncertainty as investors tend to sell higher-risk assets and flee to the more-stable safe havens.
- GBP/USD rises, supported by solid UK GDP figures, but fails to sustain above 1.3400.
- Momentum favors upside, with RSI in bullish territory; resistance stands at 1.3400, followed by YTD high at 1.3434.
- If GBP/USD fails to break higher, support lies at 1.3359, with further downside risk toward 1.3312 and 1.3248.
The Pound Sterling held to gains against the Greenback during the North American session and edged up 0.14%. Earlier, solid Gross Domestic Product (GDP) figures in the UK sponsored a leg-up above 1.3400, but bulls failed to hold the exchange rate above the latter. The GBP/USD trades at 1.3387.
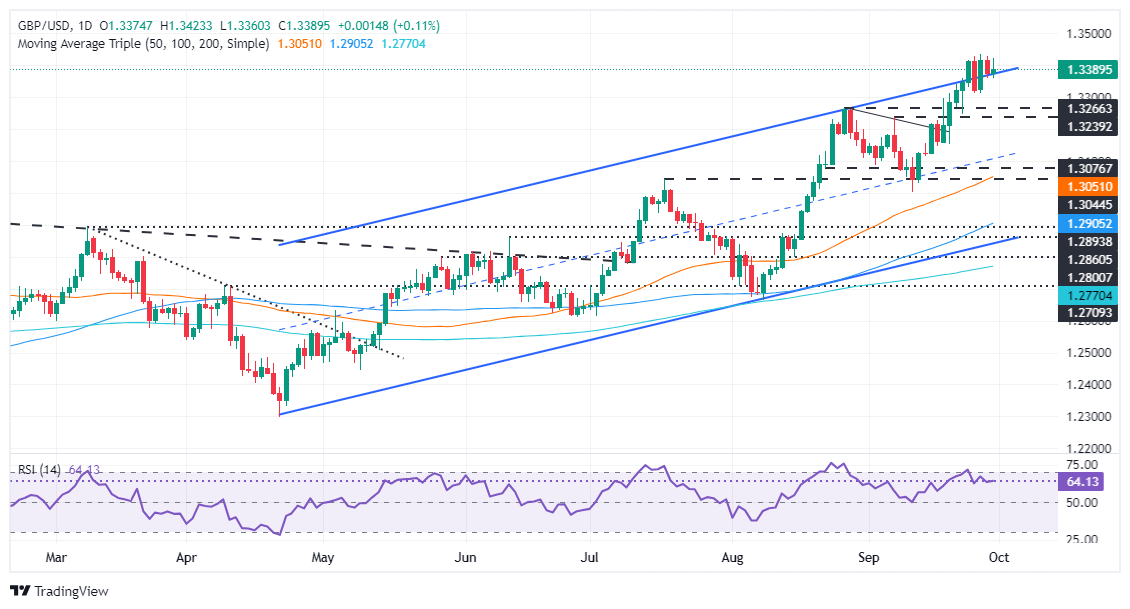
GBP/USD Price Forecast: Technical outlook
Even though the GBP/USD is bullish-biased, failure to decisively clear the year-to-date (YTD) high of 1.3434 might open the door for further downside.
Momentum favors buyers, with the Relative Strength Index (RSI) aiming up at bullish territory. Hence, the path of least resistance is tilted to the upside.
The GBP/USD first resistance would be 1.3400. A breach of the latter will expose the daily high of 1.3422, followed by the YTD peak at 1.3434.
Conversely, if bears keep the exchange rate below 1.3400, further losses lie ahead. The first support is 1.3359, today’s low, followed by the September 25 cycle low of 1.3312. If surrendered, up next lie the September 23 low of 1.3248.
GBP/USD Price Action – Daily Chart
Pound Sterling FAQs
The Pound Sterling (GBP) is the oldest currency in the world (886 AD) and the official currency of the United Kingdom. It is the fourth most traded unit for foreign exchange (FX) in the world, accounting for 12% of all transactions, averaging $630 billion a day, according to 2022 data. Its key trading pairs are GBP/USD, also known as ‘Cable’, which accounts for 11% of FX, GBP/JPY, or the ‘Dragon’ as it is known by traders (3%), and EUR/GBP (2%). The Pound Sterling is issued by the Bank of England (BoE).
The single most important factor influencing the value of the Pound Sterling is monetary policy decided by the Bank of England. The BoE bases its decisions on whether it has achieved its primary goal of “price stability” – a steady inflation rate of around 2%. Its primary tool for achieving this is the adjustment of interest rates. When inflation is too high, the BoE will try to rein it in by raising interest rates, making it more expensive for people and businesses to access credit. This is generally positive for GBP, as higher interest rates make the UK a more attractive place for global investors to park their money. When inflation falls too low it is a sign economic growth is slowing. In this scenario, the BoE will consider lowering interest rates to cheapen credit so businesses will borrow more to invest in growth-generating projects.
Data releases gauge the health of the economy and can impact the value of the Pound Sterling. Indicators such as GDP, Manufacturing and Services PMIs, and employment can all influence the direction of the GBP. A strong economy is good for Sterling. Not only does it attract more foreign investment but it may encourage the BoE to put up interest rates, which will directly strengthen GBP. Otherwise, if economic data is weak, the Pound Sterling is likely to fall.
Another significant data release for the Pound Sterling is the Trade Balance. This indicator measures the difference between what a country earns from its exports and what it spends on imports over a given period. If a country produces highly sought-after exports, its currency will benefit purely from the extra demand created from foreign buyers seeking to purchase these goods. Therefore, a positive net Trade Balance strengthens a currency and vice versa for a negative balance.
- USD/JPY soars above 143.00 as Japan Ishiba emphasized the need for an accommodative policy stance.
- Investors await Fed Powell’s speech for fresh interest rate guidance.
- The Fed is expected to cut interest rates further by 75 bps this year.
The USD/JPY pair surges strongly above 143.00 in Monday’s North American session. The asset strengthens as dovish remarks from Japan’s new leader Shigeru Ishiba, who came out victorious in the Prime Ministerial contest on Friday, weighs heavily on the Japanese Yen (JPY).
Shigeru Ishiba said in an interview with public broadcaster NHK in Monday’s Asian trading hours, "From the government's standpoint, monetary policy must remain accommodative as a trend given current economic conditions."
For more interest rate cues, investors will focus on the Bank of Japan (BoJ) Summary Of Opinions (SOP) for the latest monetary policy meeting that took place on September 20. In the monetary policy announcement, the BoJ left interest rates unchanged at 0.1%-0.25% and guided them to remain data-dependent. While investors were anticipating hawkish remarks for the last quarter of the year.
Meanwhile, a slight recovery in the US Dollar has also weighed on the pair. The US Dollar Index (DXY), which tracks the Greenback’s value against six major currencies, recovers its intraday losses and rises to near 100.50. The Greenback gains ahead of Federal Reserve (Fed) Chair Jerome Powell’s speech, which is scheduled at 17:00 GMT.
Investors will pay close attention to Powell’s interest rate guidance to know how much the Fed will cut interest rates in the remainder of the year.
According to the CME FedWatch tool, the Fed is expected to reduce interest rates further by 75 basis points (bps), suggesting that there will be another 50 basis points (bps) in any of the two remaining meetings in November and December. On September 18, the Fed started its rate-cut cycle with a larger-than-usual cut of 50 bps.
Japanese Yen FAQs
The Japanese Yen (JPY) is one of the world’s most traded currencies. Its value is broadly determined by the performance of the Japanese economy, but more specifically by the Bank of Japan’s policy, the differential between Japanese and US bond yields, or risk sentiment among traders, among other factors.
One of the Bank of Japan’s mandates is currency control, so its moves are key for the Yen. The BoJ has directly intervened in currency markets sometimes, generally to lower the value of the Yen, although it refrains from doing it often due to political concerns of its main trading partners. The BoJ ultra-loose monetary policy between 2013 and 2024 caused the Yen to depreciate against its main currency peers due to an increasing policy divergence between the Bank of Japan and other main central banks. More recently, the gradually unwinding of this ultra-loose policy has given some support to the Yen.
Over the last decade, the BoJ’s stance of sticking to ultra-loose monetary policy has led to a widening policy divergence with other central banks, particularly with the US Federal Reserve. This supported a widening of the differential between the 10-year US and Japanese bonds, which favored the US Dollar against the Japanese Yen. The BoJ decision in 2024 to gradually abandon the ultra-loose policy, coupled with interest-rate cuts in other major central banks, is narrowing this differential.
The Japanese Yen is often seen as a safe-haven investment. This means that in times of market stress, investors are more likely to put their money in the Japanese currency due to its supposed reliability and stability. Turbulent times are likely to strengthen the Yen’s value against other currencies seen as more risky to invest in.
- EUR/GBP pauses after temporarily bottoming and correcting higher.
- RSI momentum has exited oversold indicating a possible reversal higher, although the trend remains bearish overall.
EUR/GBP pauses after correcting back from the bottom the pair made on September 24.
Despite the pullback over recent days, the pair remains in a short and medium-term downtrend and given it is a principle of technical analysis that “the trend is your friend” the odds continue to favor bears.
EUR/GBP Daily Chart
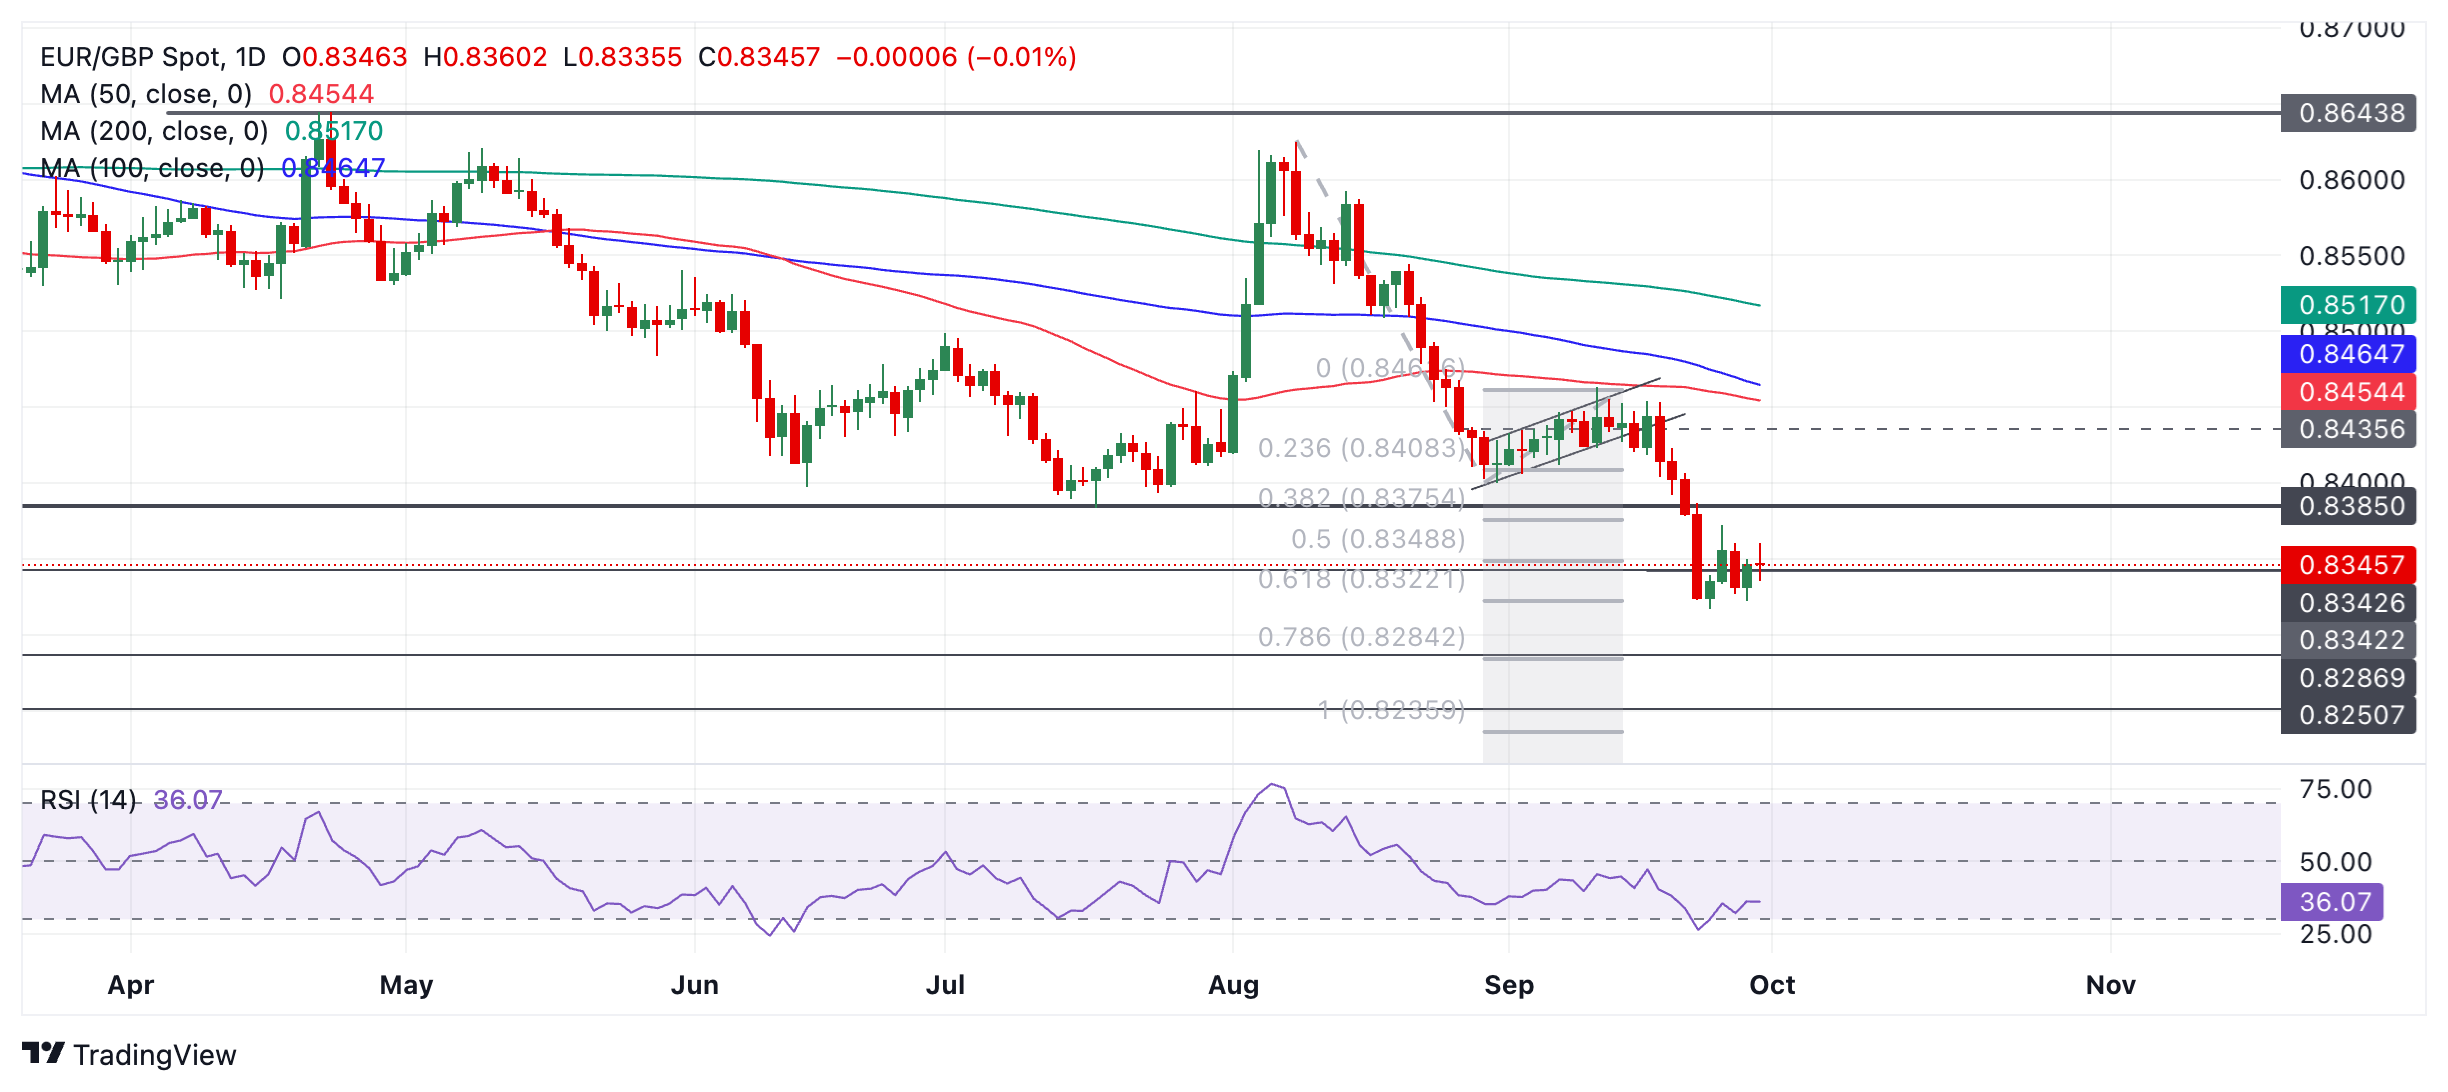
More broadly, EUR/GBP has now reached the first downside target for the move that began at the August 5 high suggesting an easing in bearish pressure. The target is the 61.8% extrapolation of the initial move down during August before the shallow channel higher that formed in early September. It is even possible this could indicate the end point of its decline, although that is not confirmed.
A break below the 0.8317 September 24 low, however, would reconfirm an extension of the downtrend towards the next target at 0.8287, the August 2022 low.
The Relative Strength Index (RSI) has exited oversold after the September 24 bounce and this could indicate the risk that a stronger correction may as yet unfold higher. Such a move would be confirmed by a break above 0.8372, the September 25 high.
- EUR/JPY trades higher after Ishiba comments suggest he may pressure BoJ to keep interest rates low.
- Gains for the pair may be limited by slower inflation data from the Eurozon’s leading economy Germany.
- The data adds to woes about the German economy sparked by a second profit warning from carmaker Volkswagen.
EUR/JPY trades over half a percent higher on Monday, in the 159.60s, after dovish comments from Japan’s new incoming Prime Minister, Shigeru Ishiba gave the impression he would steer monetary policy to remain accommodative due to economic conditions. His statement suggests he may exert pressure on the Bank of Japan (BoJ) to keep interest rates at their current historic lows, despite the bank’s policy trajectory pointing higher.
This leads the Euro (EUR) to appreciate above the Japanese Yen (JPY) and EUR/JPY to rise. However, the pair’s gains will be capped by negative data from the bloc’s largest economy, Germany, which points to an economic slowdown. The German Consumer Price Index (CPI) fell short of estimates on Monday, after rising 1.6% on a yearly basis in September from 1.9% in August, Destatis reported.
The Harmonized Index of Consumer Prices in Germany, the European Central Bank's preferred gauge of inflation, also fell short of expectations rising by 1.8% on a yearly basis, down from 2.0% in August and below the market expectation of 1.9%. The disinflationary data makes it more likely the European Central Bank (ECB) will cut interest rates more aggressively, leading to a weaker Euro, since lower interest rates tend to encourage outflows of capital to where they can earn higher returns.
The news comes after Volkswagen, Germany’s largest carmaker issued another profit warning on Friday due to increased competition, falling sales in the far east and conflict with worker’s unions. The car manufacturer slashed expectations for revenue, profit and cash flow due to waning demand for its cars, and expects to deliver fewer vehicles this year than in 2023 — its fourth annual sales slump in five years. It is the company’s second profit warning in three months, and adds to the general aire of malaise surrounding the German economy.
- USD/CAD faces selling pressure above 1.3500 ahead pf Fed Powell’s speech.
- The Fed would provide cues about the likely interest rate cut size in November.
- Investors expect the BoC to ease monetary policy further in the remainder of the year.
The USD/CAD pair strives to sustain above the psychological support of 1.3500 in Monday’s New York session. The Loonie asset faces pressure as the US Dollar (USD) struggles to gain ground ahead of the Federal Reserve (Fed) Chair Jerome Powell’s speech, which is scheduled at 17:00 GMT.
The US Dollar Index (DXY), which tracks the Greenback’s value against six major currencies, hovers above the yearly low of 100.20. Meanwhile, the market sentiment appears to be asset-specific as US equities are under pressure, while risk-perceived currencies have performed strongly
In today’s session, investors will pay close attention to Fed Powell’s speech to get fresh cues about whether the central bank will cut interest rates again by larger-than-usual 50 basis points (bps) or will reduce them gradually by 25 bps in November.
According to the CME FedWatch tool, traders see an almost 40% chance for the Fed reducing interest rates by 50 bps to 4.25%-4.50% in November, while the rest supports for a regular size of 25 bps.
On the economic data front, investors will focus on a slew of United States (US) labor market data, releasing this week, to get fresh cues about the current status of job growth. Market participants will also pay close attention to the US ISM Manufacturing and Service PMI, which will be published on Tuesday and Thursday, respectively.
This week, the Canadian Dollar (CAD) will be influenced by market expectations for Bank of Canada (BoC) interest rate path for the last quarter of this year. Financial markets expect the BoC to continue reducing interest rates further due to growing risks to economy and the labor market.
US Dollar FAQs
The US Dollar (USD) is the official currency of the United States of America, and the ‘de facto’ currency of a significant number of other countries where it is found in circulation alongside local notes. It is the most heavily traded currency in the world, accounting for over 88% of all global foreign exchange turnover, or an average of $6.6 trillion in transactions per day, according to data from 2022. Following the second world war, the USD took over from the British Pound as the world’s reserve currency. For most of its history, the US Dollar was backed by Gold, until the Bretton Woods Agreement in 1971 when the Gold Standard went away.
The most important single factor impacting on the value of the US Dollar is monetary policy, which is shaped by the Federal Reserve (Fed). The Fed has two mandates: to achieve price stability (control inflation) and foster full employment. Its primary tool to achieve these two goals is by adjusting interest rates. When prices are rising too quickly and inflation is above the Fed’s 2% target, the Fed will raise rates, which helps the USD value. When inflation falls below 2% or the Unemployment Rate is too high, the Fed may lower interest rates, which weighs on the Greenback.
In extreme situations, the Federal Reserve can also print more Dollars and enact quantitative easing (QE). QE is the process by which the Fed substantially increases the flow of credit in a stuck financial system. It is a non-standard policy measure used when credit has dried up because banks will not lend to each other (out of the fear of counterparty default). It is a last resort when simply lowering interest rates is unlikely to achieve the necessary result. It was the Fed’s weapon of choice to combat the credit crunch that occurred during the Great Financial Crisis in 2008. It involves the Fed printing more Dollars and using them to buy US government bonds predominantly from financial institutions. QE usually leads to a weaker US Dollar.
Quantitative tightening (QT) is the reverse process whereby the Federal Reserve stops buying bonds from financial institutions and does not reinvest the principal from the bonds it holds maturing in new purchases. It is usually positive for the US Dollar.
While testifying before the European Parliament's Committee on Economic and Monetary Affairs on Monday, European Central Bank (ECB) President Christine Lagarde said that they expect the economic recovery in the Eurozone to strengthen over time.
Key takeaways
"Looking ahead, the suppressed level of some survey indicators suggests that the recovery is facing headwinds."
"The labour market remains resilient."
"Employment growth slowed to just 0.2% in the second quarter, and recent indicators point to a further deceleration in the coming quarters."
"Looking ahead, inflation might temporarily increase in the fourth quarter."
"The latest developments strengthen our confidence that inflation will return to target in a timely manner."
"We will take that into account in our next monetary policy meeting in October."
"Policy rates will be kept sufficiently restrictive for as long as necessary to achieve our aim."
"The latest developments strengthen our confidence that inflation will return to target in a timely manner."
"The new data available at the time of the September Governing Council meeting reinforced our confidence in the timely return of inflation to our 2% target.."
Market reaction
EUR/USD came under modest bearish pressure with the immediate reaction to these comments and was last seen trading near 1.1170, where it was virtually unchanged on the day.
USD/CNH should extend its fall below 7.00 following last week’s 0.9% decline to 6.9815. The pair was last seen at 6.9952, DBS FX analyst Philip Wee notes.
Additional fiscal measures are expected
“The CSI 300 Index surged 15.7% last week, its best weekly performance since November 2008, on China’s most significant monetary stimulus package since the Covid-19 pandemic to support the property sector and shore up capital markets.”
“Additional fiscal measures are expected as China seeks to achieve its 5% growth target. An announcement is likely before the National People’s Congress meeting in the second half of October.”
“The US Treasury Department welcomed last week’s stimulus measures but emphasized the need for increased domestic demand over reliance on exports.”
The Liberal Democratic Party of Japan has selected Shigeru Ishiba as its new leader, and he can be the next prime minister. It was a small surprise that Ishiba was chosen – but a very positive one for the Japanese Yen (JPY), Commerzbank’s Head of FX and Commodity Research Ulrich Leuchtmann notes.
The attempt at monetary policy normalization to end in failure
“Observers had mentioned Sanae Takaichi, among others, as a promising candidate to succeed outgoing Prime Minister Fumio Kishida. However, Takaichi is considered an outspoken opponent of the restrictive BoJ policy. If she had been named the new prime minister, there would have been a possible return to the ‘Abenomics’, including an ultra-expansive monetary policy.”
“This option is off the table with Friday's decision. Although Ishiba has so far made a name for himself primarily in defense and foreign policy issues, he has signaled sufficiently clearly that he is at least not averse to the restrictive BoJ monetary policy. A new edition of the Abenomics will certainly not happen with him. Therefore, it is only logical that the news was greeted by the currency market with very significant JPY strength.”
“BoJ's current policy is likely to fail. It will not lead to lasting inflation, but to a relapse into old zeroflation, and that therefore the attempt at monetary policy normalization will end in failure. The remaining inflation does not result from labor-intensive service prices, but predominantly from goods prices. It is therefore more the result of past yen weakness than a sign of a self-sustaining inflation process. The JPY recovery of the past months will likely cause this effect to disappear soon.”
The Pound Sterling’s recent strength has partly relied on the ‘no news is good news’ narrative, as quiet calendars allowed markets to look elsewhere for easing bets while happily keeping the Bank of England in the group of relatively hawkish outliers, ING’s FX strategist Francesco Pesole notes.
EUR/GBP to face a bit more downside risk
“We remain somewhat concerned that the pound will soon face a correction as UK figures start to point to more urgency for easing, although this week may just be too early for that.”
“Second-quarter GDP was revised slightly lower to 0.5% quarter-on-quarter this morning, but there isn’t a major UK release until the 15 October jobs figures, with only the partial exception of the Bank of England’s Decision Maker Panel survey.”
“With that in mind, together with the risk of eurozone inflation cementing ECB easing bets, EUR/GBP will likely face a bit more downside risk over the coming days and may well test the 0.8300 support.”
Just as hopes were building that some of the recent volatility in USD/JPY was on course to die-back, Japanese political change has proved that the currency pair maintains a nervous disposition, Rabobank’s FX strategist Jane Foley notes.
USD/JPY to reach 140 in 3 to 6 months
“Despite the changing political landscape both the Japan and in the US, we would expect central bank policy to remain the primary driver of USD/JPY over the coming months. US economic data will be watched for any signs that the US could repeat its 50 bps rate cut before the end of the year, while Japanese numbers will be assessed against the expectation that BoJ interest rates will be raised again around the turn of the year.”
“The reassurance from Ishiba that the government would announce further fiscal stimulus ‘if necessary’ should be reassuring to JPY bulls. Ishiba’s goal that the country ‘fully emerge from deflation’ is also JPY supportive. Ishiba on Friday reportedly vowed to accelerate Kishida policies which aimed to boost household consumption through higher wage growth.”
“This sets the scene for another strong round of wage talks next spring. We continue to target USD/JPY140 on a 3-to-6-month view.”
French and Spanish inflation figures surprised on the downside on Friday, coming in at 1.2% and 1.5% respectively. That is helping explain the euro’s muted reaction to China’s stock rally this morning, as markets are almost fully pricing in a 25bp European Central Bank rate cut in October, due to both those lower inflation prints and a Reuters report suggesting Governing Council doves are ramping up pressure to stay keep easing policy, ING’s FX strategist Francesco Pesole notes.
Short-term move to 1.1200 is possible in EUR/USD
“What appears clear from the latest off-meeting communication is that the hawk-dove factions are at a recent high within the ECB. Ultimately, data should be the tie-breaker for an October cut, so expect this morning’s German CPI and tomorrow’s eurozone-wide figures to trigger some EUR moves.”
“We may also get some clues from today’s speech from ECB President Christine Lagarde at the EU Parliament. We have a number of hawkish and dovish members speaking later this week, including Isabel Schnabel and Philip Lane. If we end the week with slower-than-expected eurozone inflation and somewhat weaker US payrolls figures endorsing a 50bp Fed cut, then expect the euro to be one of the laggards in a weak USD environment as markets cement bets that the ECB will continue cutting in October.”
“Another short-term move to 1.1200 is possible in EUR/USD on the back of some USD weakness, but unless we see surprisingly strong eurozone inflation, a big break higher may not be on the cards. We favour a stable 1.11-1.12 trading range in the first half of October.”
The US Dollar (USD) is likely to edge lower; any decline is not expected to reach the support at 6.9400. In the longer run, price action continues to suggest USD weakness, albeit likely at a slower pace; the levels to monitor are 6.9400 and 6.9200, UOB Group FX analysts Quek Ser Leang and Lee Sue Ann note.
Levels to monitor are 6.9400 and 6.9200
24-HOUR VIEW: “Last Thursday, USD plummeted and closed sharply lower. Last Friday, we indicated that ‘the outsized decline has resulted in oversold conditions, and USD is unlikely to weaken much further.’ We expected USD to ‘trade in a range between 6.9700 and 7.0100.’ USD subsequently traded in a narrower range than expected (6.9725/7.0040). Despite closing slightly higher at 6.9806 (+0.11%), the underlying tone appears to have softened. Today, we expect USD to drift lower, but any decline is unlikely to reach the support at 6.9400 (there is a minor support level at 6.9580). Resistance is at 6.9930, followed by 7.0050.”
1-3 WEEKS VIEW: “We continue to hold the same view as last Friday (27 Sep, spot at 6.9810). As indicated, the recent price action continues to suggest USD weakness, albeit likely at a slower pace. The levels to monitor are 6.9400 and 6.9200. On the upside, a breach of 7.0350 (‘strong resistance’ level was at 7.0450 last Friday) would mean that USD is not weakening further.”
- Inflation in Germany continued to soften in September.
- EUR/USD trades in positive territory near 1.1200 after the German CPI data.
Inflation in Germany, as measured by the change in the Consumer Price Index (CPI), declined to 1.6% on a yearly basis in September from 1.9% in August, Destatis reported. On a monthly basis, the CPI was unchanged following the 0.1% decline recorded in August.
The Harmonized Index of Consumer Prices in Germany, the European Central Bank's preferred gauge of inflation, rose 1.8% on a yearly basis, down from 2% in August and below the market expectation of 1.9%.
Market reaction
These figures failed to trigger a noticeable reaction in EUR/USD. At the time of press, the pair was trading near 1.1200, where it was up about 0.3% on the day.
China’s steps to support the housing and stock market have led to a rush to buy Chinese stocks this morning, ahead of the National Day 1-7 October holiday. The CSI index is up 7%, the Hang Seng 3% – and that is translating into stronger China-proxy Aussie and Kiwi dollars, along with a generally soft USD as safe-haven demand wanes, ING’s FX strategist Francesco Pesole notes.
Debates may influence the outcome of presidential elections
“Looking at this week’s busy US calendar, we’ll start tomorrow with the key JOLTS jobs openings, which surprised on the downside last month, followed by ISM manufacturing, which should keep hovering around the 47-48 level. Regional surveys also point to small changes in the ISM services index (Thursday), which remains in expansionary territory.”
“The biggest binary event will be Friday’s jobs report. Our economist expects a softer payroll read (115k) relative to consensus (146k) and also an increase in the unemployment rate to 4.3% against expectations for a flattening at 4.2%. The greater focus of the Federal Reserve on the employment side of its mandate means high sensitivity of the market to the details of the release.”
“One more event to keep an eye on is tomorrow’s TV debate of the two US vice-presidential candidates JD Vance and Tim Waltz. This is the last chance for either campaign to attract voters in a debate as Donald Trump has ruled out another face-off with Kamala Harris. Incidentally, both Vance and Waltz have had a rather important role in their respective campaigns, so polls will be monitored closely later this week to gauge any impact, especially on Midwestern swing states. “
The US Dollar (USD) could rise 145.50; a sustained advance above this major resistance level is unlikely. In the longer run, upward momentum has dissipated; USD could continue to trade choppily but is likely to stay within a 140.00/146.00 range, UOB Group FX analysts Quek Ser Leang and Lee Sue Ann note.
USD likely to stay within a 140.00/146.00 range
24-HOUR VIEW: “Last Friday, we held the view that USD ‘could rise above the major resistance at 145.50, but a sustained advance above this level seems unlikely.’ We were also of the view that ‘the next resistance at 146.10 is unlikely to come into view.’ The subsequent price movements did not turn out as we anticipated; USD soared to a high of 146.49, then quickly plunged to a low of 142.05. The outsized selloff seems to be overdone, but the weakness in USD could retest the 142.00 level before stabilisation is likely. Today, a sustained decline below 142.00 is unlikely. Resistance 143.70; a breach of 144.50 would mean that the weakness has stabilised.”
1-3 WEEKS VIEW: “We shifted to a positive USD stance on 17 Sep (spot at 143.00), indicating that ‘if USD can break above 144.00, it could trigger a stronger recovery towards 145.50.’ As we tracked the advance, in our update from last Friday (27 Sep, spot at 144.95), we indicated that ‘we continue to expect USD to rise to 145.50, but it has to break and maintain a foothold above this level before a further advance is likely.’ We added, ‘given that momentum has not increased much, the chance of it reaching the next major resistance at 147.00 is not high for now.’ We did not anticipate the subsequent volatility, as USD soared to 146.49 and then, in a dramatic reversal, plunged to 142.05. The breach of our ‘strong support’ level at 143.40 indicates that the buildup in upward momentum has dissipated. From here, USD could continue to trade in a choppy manner, but it is expected to stay within a range of 141.00/146.00 range.”
- USD/CHF might be starting a new up leg within its sideways market range.
- MACD is starting to bend and if it crosses its signal line bulls may pile in.
USD/CHF has fallen to the 0.8400 floor of the range and rebounded. It is too early to decide whether this is the start of a new up leg within the range but given the established sideways trend the odds favor such a move developing and the range extending.
USD/CHF 4-hour Chart
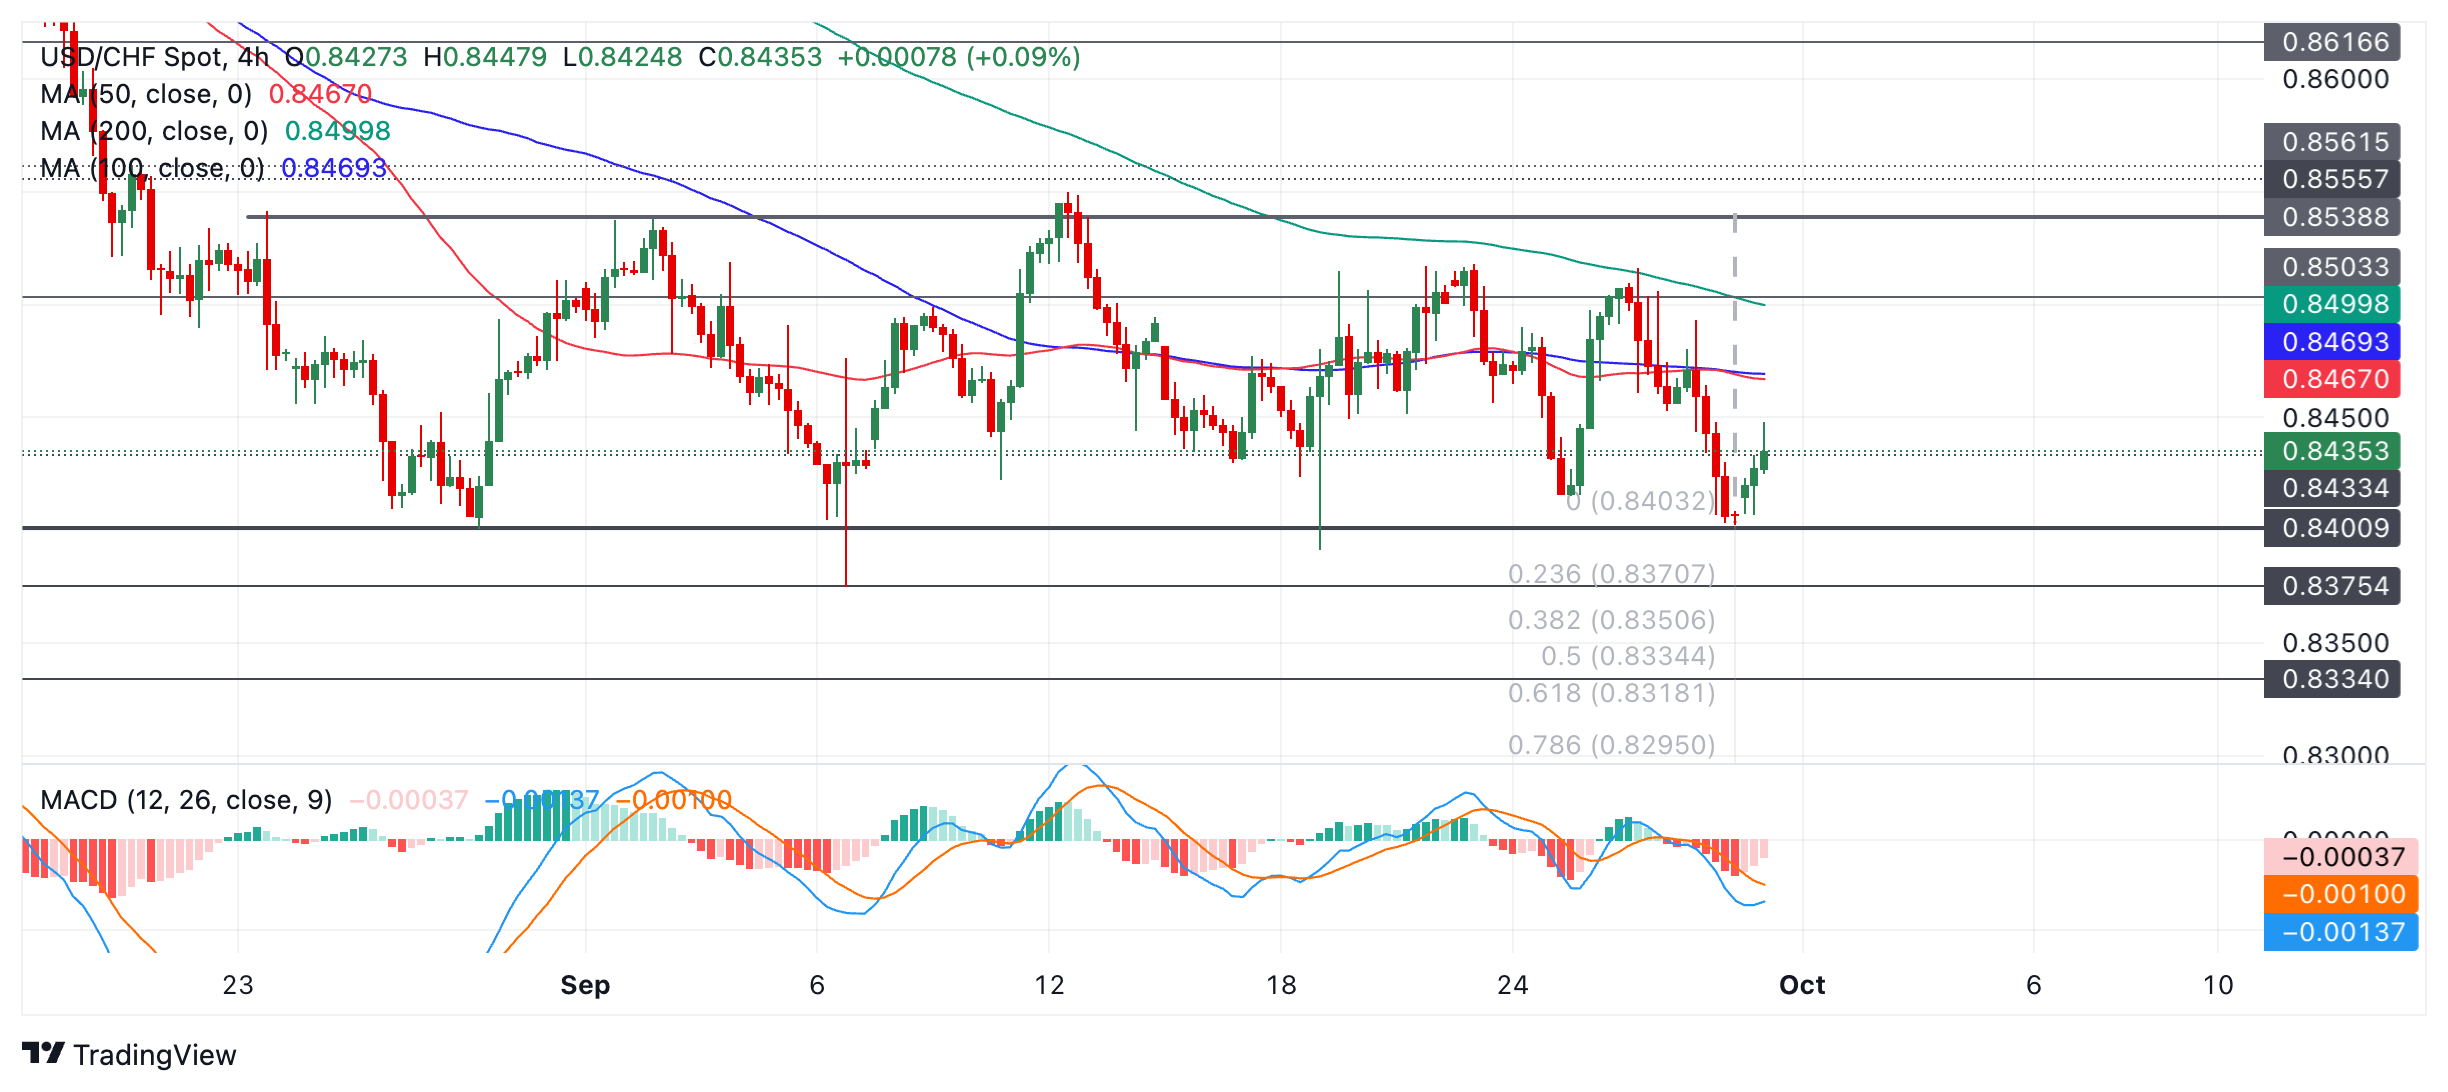
The Moving Average Convergence Divergence (MACD) momentum indicator is below the zero line and turning. If the blue MACD crosses above the red signal line it will provide a stronger signal that a new up leg within the range-bound consolidation is forming. MACD is a more reliable indicator within sideways compared to strongly trending markets.
If the MACD line crosses above its signal line and price continues to rise it will probably continue all the way up to an initial target at about 0.8517 (September 23 and 26 highs) followed by the roof of the range at 0.8539.
There is a possibility the pair could breakout of the range and given the prior trend to its formation was bearish, a downside break is mildly favored. A close below 0.8375 (September 6 low) would signal such a breakout. A decisive break would be one accompanied by a longer-than-average red candlestick that closed near its low or three consecutive bearish candles that broke below the level. Such a move would be expected to go as low as 0.8318, the 61.8% Fibonacci extrapolation of the height of the range extrapolated lower.
- The US Dollar trades flat at the start of this week with US Nonfarm Payrolls as the main event on Friday.
- The US calendar starts quietly with Chicago PMIs and the Dallas Fed Manufacturing survey.
- The US Dollar Index resides near the 2024 low in search of substantial support.
The US Dollar (USD) trades broadly flat at the start of this week, close to the year-to-date lows registered on Friday, ahead of a busy week that will end with the key Nonfarm Payrolls data. The main theme surrounding the jobs data will be how much the US Federal Reserve (Fed) will cut rates in its November meeting.
On Monday’s economic calendar, the Chicago Purchasing Managers Index (PMI) for September is due to be released, followed by the Dallas Fed Manufacturing Business Index for September. With both indices in contraction territory, it will be interesting to see how they will move before US Federal Reserve Chairman Jerome Powell takes the stage around 17:00 GMT.
Daily digest market movers: What could Powell add?
- Monday will start with already two quite important data releases. The first one is the The Chicago Purchasing Managers Index for September, to be published at 13:45 GMT. The expectation is for a number still in contraction at 46.5, a bit better than the 46.1 in August.
- At 14:30 GMT, the Dallas Fed Manufacturing Business Index for September is foreseen to be released. Expectations are similar to the ones for the Chicago PMI, with analysts anticipating the index to remain in contraction at -4.5 but improving from the previous -9.7.
- Two Fed speakers this Monday to look out for:
- Near 12:50 GMT, Federal Reserve Governor Michelle Bowman delivers a speech about the US economic outlook and monetary policy at the Bankers Association President/CEO Conference in Charleston, South Carolina.
- Around 17:00 GMT, Federal Reserve Chairman Jerome Powell delivers a speech about the US economic outlook at the 66th National Association for Business Economics annual meeting in Nashville, Tennessee.
- Asian equity markets trade mixed, with Japanese stocks sinking over 3%, while Chinese equities are rallying higher with the Shanghai Shenzhen CSI 300 composite index up over 8%.
- The CME Fedwatch Tool shows a 60.4% chance of a 25 basis-point rate cut at the next Fed meeting on November 7, while 39.6% is pricing in another 50-basis-point rate cut.
- The US 10-year benchmark rate trades at 3.77%, looking to test the three-week high at 3.81%
US Dollar Index Technical Analysis: Anything from here is an adventure
The US Dollar Index (DXY) is unable to move away from that fresh yearly low at 100.16. The biggest issue is that there are no technical levels to trade on. Either venturous traders will get in and could push the DXY back higher or they will wait for the next pivotal support sub-100.00 at 99.58.
A reshuffle of resistance levels is needed at the start of this week. With three daily closes below 100.62, this level is now considered a firm resistance. In case Dollar bulls can turn things around, look at 101.90 for the second resistance level on the upside. Just above there, the 55-day Simple Moving Average (SMA) at 102.22 will come in.
Time to make our homework as well for more downside. The fresh low of 2024 is at 100.16, so a test will take place before more downside takes place. Further down, and that means giving up the big 100.00 level, the July 14, 2023, low at 99.58 comes into play.
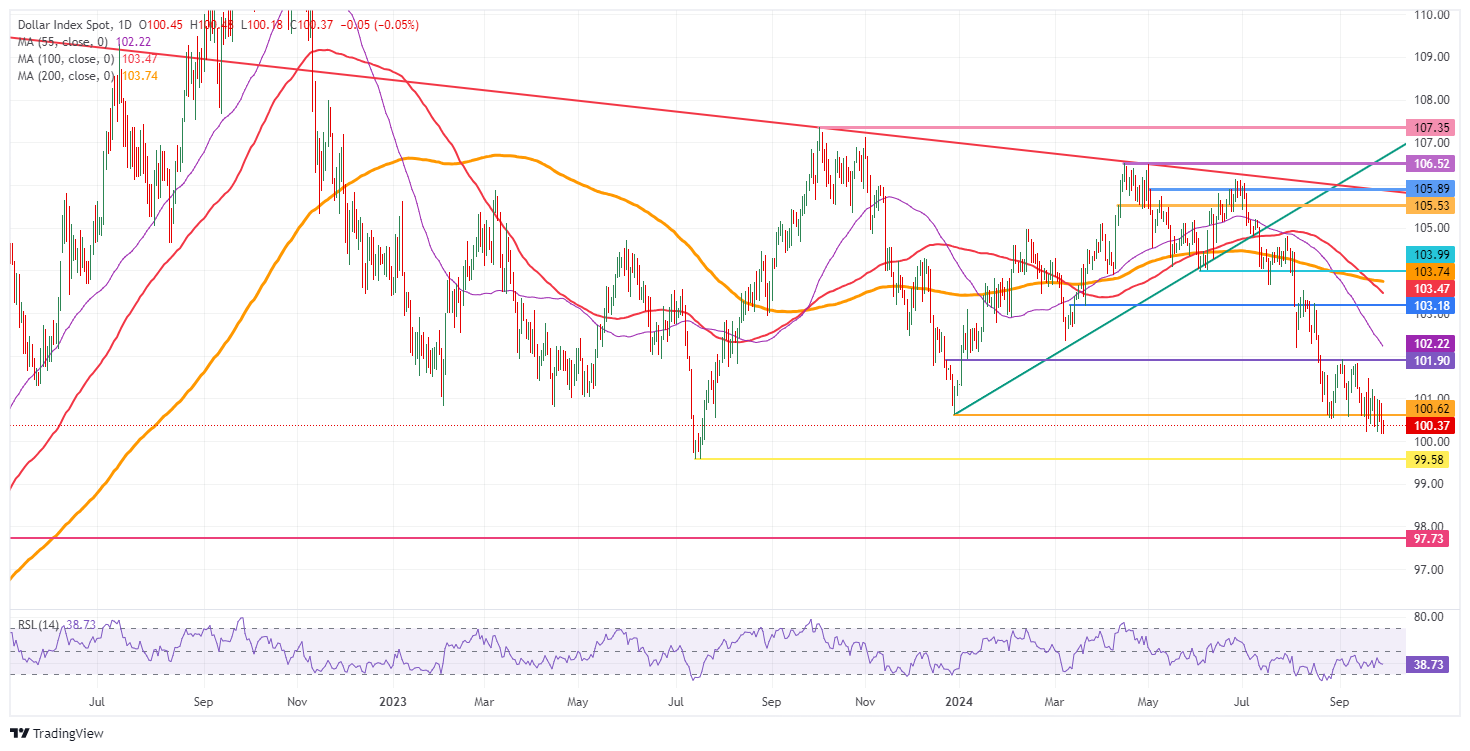
US Dollar Index: Daily Chart
US Dollar FAQs
The US Dollar (USD) is the official currency of the United States of America, and the ‘de facto’ currency of a significant number of other countries where it is found in circulation alongside local notes. It is the most heavily traded currency in the world, accounting for over 88% of all global foreign exchange turnover, or an average of $6.6 trillion in transactions per day, according to data from 2022. Following the second world war, the USD took over from the British Pound as the world’s reserve currency. For most of its history, the US Dollar was backed by Gold, until the Bretton Woods Agreement in 1971 when the Gold Standard went away.
The most important single factor impacting on the value of the US Dollar is monetary policy, which is shaped by the Federal Reserve (Fed). The Fed has two mandates: to achieve price stability (control inflation) and foster full employment. Its primary tool to achieve these two goals is by adjusting interest rates. When prices are rising too quickly and inflation is above the Fed’s 2% target, the Fed will raise rates, which helps the USD value. When inflation falls below 2% or the Unemployment Rate is too high, the Fed may lower interest rates, which weighs on the Greenback.
In extreme situations, the Federal Reserve can also print more Dollars and enact quantitative easing (QE). QE is the process by which the Fed substantially increases the flow of credit in a stuck financial system. It is a non-standard policy measure used when credit has dried up because banks will not lend to each other (out of the fear of counterparty default). It is a last resort when simply lowering interest rates is unlikely to achieve the necessary result. It was the Fed’s weapon of choice to combat the credit crunch that occurred during the Great Financial Crisis in 2008. It involves the Fed printing more Dollars and using them to buy US government bonds predominantly from financial institutions. QE usually leads to a weaker US Dollar.
Quantitative tightening (QT) is the reverse process whereby the Federal Reserve stops buying bonds from financial institutions and does not reinvest the principal from the bonds it holds maturing in new purchases. It is usually positive for the US Dollar.
US Dollar (USD) net long positions have fallen further after the previous week’s plunge. Euro (EUR) net long positions have moved higher, driven by an increase in long positions. Pound Sterling (GBP_ net long positions have regained some ground, driven by a jump in long positions, and Japanese Yen (JPY) net long positions have increased for the sixth consecutive week to their highest level since 2016, driven by an increase in long positions, Rabobank’s FX analysts Jane Foley and Molly Schwartz note.
USD net longs fall, EUR, GBP and JPY net longs grow
“USD net long positions have fallen further after the previous week’s plunge. Net longs are now at their lowest level since April following the decision by the Fed to cut rates by 50 bps at September’s FOMC meeting. Further rate cuts are expected before the end of the year, with another 50 bp move being touted by some commentators.”
“EUR net long positions have moved higher, driven by an increase in long positions. That said, in recent sessions speculation has increased that the ECB could bring forward expected rate cuts on the back of weak PMI data in Germany and France and softening inflation data in various Eurozone countries.”
“GBP net long positions have regained some ground, driven by a jump in long positions. GBP remains the best performing G10 currency in the year-to-date. JPY net long positions have increased for the sixth consecutive week to their highest level since 2016, driven by an increase in long positions. The JPY suffered further volatility on the back of the LDP leadership election and rallied with the announcement that Ishiba had won.”
USD/SGD continued to trade lower, tracking the broad decline in USD, rebound in RMB and JPY. Pair was last at 1.2811, OCBC FX analysts Frances Cheung and Christopher Wong note.
Broader trend remains skewed to the downside
“Daily momentum is turning mild bearish while RSI is near oversold conditions. We remain cautious of near term rebound risks but broader trend remains skewed to the downside.”
“Support at 1.28, 1.2740 levels (76.4% fibo retracement of 2012 low to 2020 high). Resistance at 1.29, 1.30 levels. S$NEER was last estimated at ~1.95% above our model-implied mid.”
The New Zealand Dollar (NZD) could test the resistance at 0.6370 before the risk of a pullback increases; a sustained break above this level is unlikely. In the longer run, NZD is likely to rise above 0.6370; it is unclear if there is sufficient momentum for it to reach 0.6410, UOB Group FX analysts Quek Ser Leang and Lee Sue Ann note.
Can try testing the resistance at 0.6370
24-HOUR VIEW: “Our view for NZD to ‘continue to rise’ last Friday was correct, but we did not expect it to break above 0.6355 (high has been 0.6367). The rapid rise seems to be overdone, but NZD could test the resistance at 0.6370 before the risk of a pullback increases. A sustained break above 0.6370 is unlikely today. To maintain the momentum, NZD must remain above 0.6305 with minor support at 0.6325.”
1-3 WEEKS VIEW: “We turned neutral in NZD last Thursday (26 Sep, 0.6260), indicating that it ‘is likely to trade between 0.6200 and 0.6340.’ After NZD rose and approached 0.6340, we indicated on Friday (27 Sep, spot at 0.6325) that ‘despite the advance, upward momentum has not increased much, and to continue to advance, NZD must break clearly above 0.6355.’ NZD subsequently rose to 0.6367 in NY trade. From here, we expect NZD to rise above 0.6370, but it is unclear for now if there is sufficient momentum for it to reach last July’s high, near 0.6410. To keep the momentum going, NZD must not break below 0.6280 (‘strong support’ level was at 0.6240 last Friday).”
USD/JPY had a choppy session last Friday. Pair was last at 142.64, OCBC FX analysts Frances Cheung and Christopher Wong note.
Risks skewed to the downside
“Last Friday, USD/JPY traded up to high of 146.49 after candidate Takaichi managed to get into run-off against Ishiba. But it turned out that Ishiba beat Takaichi, who has been vocal against BoJ raising rates. The risk she may win was one of the factors that kept USD/JPY rather supported for most of last week. And as soon as run-off results was known, USD/JPY fell sharply.”
“We still expect the direction of travel for USD/JPY to be down but the BoJ going for a gradual pace of policy normalisation may see pace of USD/JPY decline slow in the short term. To add to uncertainty, PM Ishiba plans to dissolve parliament on 9 Oct and calls for general elections on 27 Oct. Political uncertainty may see Japanese equities fall further, and that may weigh on USD/JPY.” “Bullish momentum on daily chart is fading while RSI fell. Risks skewed to the downside but consolidation likely to hold. Support at 142, 139.60 levels (recent low). Resistance at 143.30 (21 DMA), 144.80 (23.6% fibo retracement of Jul high to Sep low) and 146.20 (50 DMA).”
Federal Reserve Chairman Jerome Powell participates on Monday in a moderated discussion titled "A View from the Federal Reserve Board" at the National Association for Business Economics Annual Meeting in Nashville, starting at 17:00 GMT. Powell is expected to speak on the economic outlook and comment on the monetary policy path.
Fed rate outlook remains uncertain
The Fed opted for a 50 basis points (bps) interest-rate cut following the September policy meeting, bringing the fed funds rate to the range of 4.75%-5.0%. The revised Summary of Economic Projections (SEP), the so called dot-plot published alongside the policy statement, showed that projections imply 50 bps of additional rate cuts in 2024 from current level, 100 bps more in 2025 and another 50 bps in 2026.
The CME FedWatch Tool shows that markets are currently pricing in a nearly 50% probability of another 50 bps rate reduction at the next policy meeting in early November. On Friday, the US Bureau of Economic Analysis reported that the core Personal Consumption Expenditures (PCE) Price Index rose 0.1% on a monthly basis in August, at a softer pace than the market expectation of 0.2%.
Fed policymakers spoke on the policy outlook recently and their remarks painted a mixed picture. Fed Governor Michelle Bowman, who is also set to speak again at 12:50 GMT, noted that she prefers a more measured re-calibration of policy and added that she continues to see greater risks to price stability. On a dovish note, Chicago Fed President Austan Goolsbee argued that interest rates need to come down significantly and said that "many more rate cuts" are likely needed over the next year.
Fed FAQs
Monetary policy in the US is shaped by the Federal Reserve (Fed). The Fed has two mandates: to achieve price stability and foster full employment. Its primary tool to achieve these goals is by adjusting interest rates. When prices are rising too quickly and inflation is above the Fed’s 2% target, it raises interest rates, increasing borrowing costs throughout the economy. This results in a stronger US Dollar (USD) as it makes the US a more attractive place for international investors to park their money. When inflation falls below 2% or the Unemployment Rate is too high, the Fed may lower interest rates to encourage borrowing, which weighs on the Greenback.
The Federal Reserve (Fed) holds eight policy meetings a year, where the Federal Open Market Committee (FOMC) assesses economic conditions and makes monetary policy decisions. The FOMC is attended by twelve Fed officials – the seven members of the Board of Governors, the president of the Federal Reserve Bank of New York, and four of the remaining eleven regional Reserve Bank presidents, who serve one-year terms on a rotating basis.
In extreme situations, the Federal Reserve may resort to a policy named Quantitative Easing (QE). QE is the process by which the Fed substantially increases the flow of credit in a stuck financial system. It is a non-standard policy measure used during crises or when inflation is extremely low. It was the Fed’s weapon of choice during the Great Financial Crisis in 2008. It involves the Fed printing more Dollars and using them to buy high grade bonds from financial institutions. QE usually weakens the US Dollar.
Quantitative tightening (QT) is the reverse process of QE, whereby the Federal Reserve stops buying bonds from financial institutions and does not reinvest the principal from the bonds it holds maturing, to purchase new bonds. It is usually positive for the value of the US Dollar.
Room for the Australian Dollar (AUD) to test 0.6940 before a pullback is likely. In the longer run, AUD is likely to edge higher; it remains to be seen if there is enough momentum for it to reach 0.6980, UOB Group FX analysts Quek Ser Leang and Lee Sue Ann note.
AUD is likely to edge higher towards 0.6980
24-HOUR VIEW: “We highlighted last Friday that AUD ‘could edge higher, but it is unlikely to be able to break above 0.6930.’ AUD then rose more than expected to 0.6937 before pulling back to close largely unchanged at 0.6902 (+0.09%). Although upward momentum has not increased much, there is room for AUD to test 0.6940 today before another pullback is likely. The major resistance at 0.6980 is not expected to come under threat. Support levels are at 0.6890 and 0.6870.”
1-3 WEEKS VIEW: “Last Thursday (26 Sep, spot at 0.6825), we indicated that ‘the advance in AUD has come to an end, and it is likely to trade between 0.6750 and 0.6900 for now.’ After AUD rose above to 0.6905, we indicated on Friday (27 Sep, spot at 0.6890) that ‘upward momentum has not increased sufficiently to indicate that AUD is ready to rise in a sustained manner.’ We added, ‘AUD has to break and remain above 0.6930 before an advance to 0.6980 can be expected.’ AUD subsequently rose to 0.6937, pulling back to close at 0.6902 (+0.09%). Although upward momentum has not increased as much as we would prefer, the price action suggests that AUD is likely to edge higher from here. However, it remains to be seen if there is enough momentum for AUD to reach 0.6980. On the downside, the ‘strong support’ level has moved higher to 0.6845 from 0.6820.”
- AUD/USD clings to gains above 0.6900 ahead of Fed Powell’s speech.
- An expected acceleration in the US core PCE inflation has weighed on market expectations for the Fed's large rate cut in November.
- The Australian Dollar outperforms its major peers on China’s massive stimulus to uplift the economic growth.
The AUD/USD holds gains above the key level of 0.6900 in Monday’s European session. The Aussie asset strengthens as the Australian Dollar (AUD) performs strongly on the announcement of China’s fiscal support to revive their economic prospects.
Australian Dollar PRICE Today
The table below shows the percentage change of Australian Dollar (AUD) against listed major currencies today. Australian Dollar was the strongest against the Swiss Franc.
| USD | EUR | GBP | JPY | CAD | AUD | NZD | CHF | |
|---|---|---|---|---|---|---|---|---|
| USD | -0.19% | -0.09% | 0.26% | 0.11% | -0.23% | -0.19% | 0.35% | |
| EUR | 0.19% | 0.11% | 0.46% | 0.33% | 0.03% | 0.03% | 0.62% | |
| GBP | 0.09% | -0.11% | 0.48% | 0.22% | -0.08% | -0.08% | 0.51% | |
| JPY | -0.26% | -0.46% | -0.48% | -0.10% | -0.55% | -0.42% | 0.14% | |
| CAD | -0.11% | -0.33% | -0.22% | 0.10% | -0.29% | -0.30% | 0.29% | |
| AUD | 0.23% | -0.03% | 0.08% | 0.55% | 0.29% | 0.00% | 0.59% | |
| NZD | 0.19% | -0.03% | 0.08% | 0.42% | 0.30% | -0.00% | 0.56% | |
| CHF | -0.35% | -0.62% | -0.51% | -0.14% | -0.29% | -0.59% | -0.56% |
The heat map shows percentage changes of major currencies against each other. The base currency is picked from the left column, while the quote currency is picked from the top row. For example, if you pick the Australian Dollar from the left column and move along the horizontal line to the US Dollar, the percentage change displayed in the box will represent AUD (base)/USD (quote).
Their cabinet reported on Sunday that it will focus on solving outstanding economic problems and strive to complete annual economic and social development goal, Reuters reported. It is worth noting that Australia is the leading trading partner of China and signs of an improvement in the latter’s economic performance strengthens the appeal of the Aussie Dollar.
However, the Caixin Manufacturing PMI sank in September to 49.3 from the former reading of 50.4. A figure below the 50.0 threshold is itself considered as contraction in activities in the manufacturing sector.
Meanwhile, the US Dollar (USD) exhibits a weak performance ahead of the Federal Reserve’s (Fed) Chair Jerome Powell’s speech, which is scheduled at 17:00 GMT. Investors would look for fresh cues about the likely monetary policy action from the Fed in November.
According to the CME FedWatch tool, the probability of the Fed to reduce interest rates by 50 basis points (bps) to 4.25%-4.50% in November has eased sharply to 38.3% from 53% last week. Market speculation for Fed large rate cuts eased after the release of the United States (US) core Personal Consumption Expenditure Price Index (PCE) data on Friday, which rose expectedly to 2.7% in August from 2.6% in July.
The Euro (EUR) has been somewhat resilient lately despite the poor prints on Euro-area PMIs as well as increased bets on ECB to cut in October. Pair was last at 1.1187 levels, OCBC FX analysts Frances Cheung and Christopher Wong note.
Double-top at 1.12 awaits
“OIS shows 82% probability for 25bp cut priced (vs. 46% probability 2 weeks ago). And EUR’s relative resilience can be attributed to optimism with China’s recovery after policymakers unleashed a big package of support measures. This week, focus shifts to German CPI (Mon), Euro-area CPI estimate (Tue).”
“Softer-than-expected prints should see a 25bp cut at 17 Oct meeting more or less fully priced. This may weigh on EUR. Elsewhere, there is plenty of ECBspeaks this week (about 17 officials scheduled, with Lagarde tonight) – we watch for any shift in tone on policy guidance.”
“Daily momentum is not showing a clear bias while RSI turned lower. Risks remain skewed towards the downside. Double-top pattern observed – typically associated with bearish reversal. Resistance at 1.12 (double-top). Support at 1.11 (21 DMA), 1.1030,60 levels (50 DMA, 23.6% fibo retracement of 2024 low to high). Bias to sell rallies.”
- Crude Oil retraces on Monday yet holds strong above the $67.00 support zone.
- Geopolitical tensions ramp up further after intensified attacks in Lebanon over the weekend.
- The US Dollar Index holds near yearly lows ahead of Fed Chairman Powell’s speech later on Monday.
Crude Oil edges lower at the start of the week despite intensified attacks by Israel on Lebanon over the weekend. Overall, expectations are that Oil prices should get a lift this week, with Chinese measures boosting the demand for Oil in the region. On Sunday, additional measures were introduced by The People's Bank of China (PBoC) and the National Financial Regulatory Administration, with lower mortgage rates set to boost the housing sector.
The US Dollar Index (DXY), which tracks the performance of the Greenback against six other currencies, gears up for a week full of economic indicators on manufacturing and services activity and employment, ending with the monthly US Nonfarm Payroll release on Friday, although geopolitical tensions are the main theme. Tensions have been building up in Lebanon, where Israel kept bombing several parts of the country and might see Iran starting to get involved in the conflict.
At the time of writing, Crude Oil (WTI) trades at $67.80 and Brent Crude at $71.45.
Oil news and market movers: Iran on the brink of stepping in
- After Israel launched airstrikes against Houthi targets in Yemen and Hezbollah targets in Lebanon, the risk of a broad war in the Middle East is starting to pick up, The Wall Street Journal reports.
- On Monday, Bloomberg reported that the amount of crude oil held around the world on tankers that have been stationary for at least seven days rose to 60.76 million barrels as of September 27, which is 27% lower than a year ago and could point to a pickup in demand.
- Russia is stepping up its attacks on Ukraine’s key energy grid and power plants, with even the nuclear power plant at Zaporizhzhia being under attack, Reuters reports.
- Warren Patterson, head of commodities strategy at ING Groep NV in Singapore, has issued concerns about more upside for the Oil market. “The oil market has become increasingly numb to developments in the Middle East,” said Patterson, underlining the lack of impact on supply, Bloomberg reports.
Oil Technical Analysis: Iran to hold cards here
Crude Oil prices could still spiral higher, should geopolitical tensions start to spill over and trigger a proxy war in the Middle East. If Iran and Egypt would be pulled into the conflict, it would not take long before several emirate states would start to send military forces to the region as well. In that case, another risk premium would be needed to be priced in with prices set to rally back to $80.00 or higher.
At current levels, $71.46 remains in focus after a brief false break last week. If a supportive catalyst remains present, a return to $75.27 (the January 12 high) could play out. Along the way towards that level, the 55-day Simple Moving Average (SMA) at $73.36 could ease the rally a bit. Once above $75.27, the first resistance to follow is $76.03, with the 100-day SMA in play.
On the downside, $67.11, a triple bottom in the summer of 2023, should support any downturns and trigger a bounce. Further down, the next level is $64.38, the low from March and May 2023.
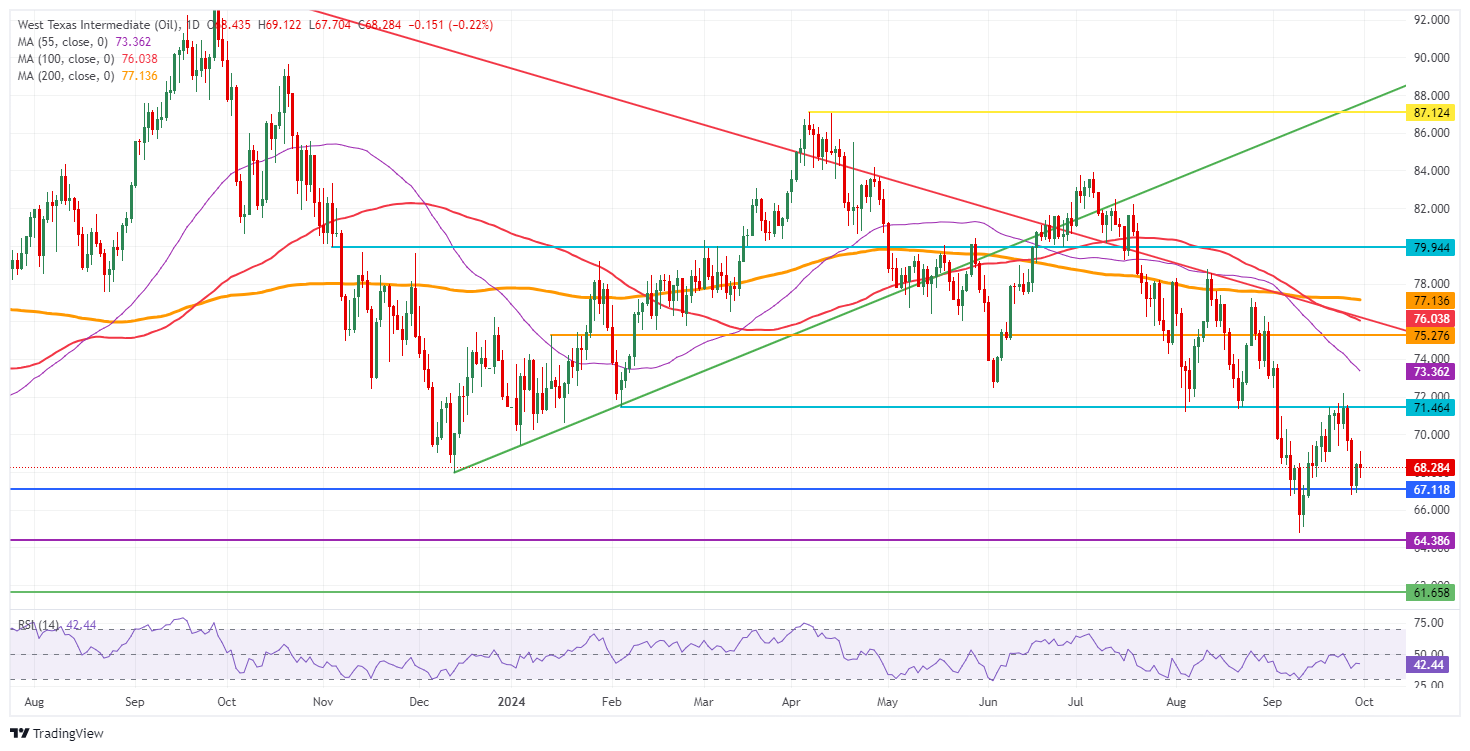
US WTI Crude Oil: Daily Chart
WTI Oil FAQs
WTI Oil is a type of Crude Oil sold on international markets. The WTI stands for West Texas Intermediate, one of three major types including Brent and Dubai Crude. WTI is also referred to as “light” and “sweet” because of its relatively low gravity and sulfur content respectively. It is considered a high quality Oil that is easily refined. It is sourced in the United States and distributed via the Cushing hub, which is considered “The Pipeline Crossroads of the World”. It is a benchmark for the Oil market and WTI price is frequently quoted in the media.
Like all assets, supply and demand are the key drivers of WTI Oil price. As such, global growth can be a driver of increased demand and vice versa for weak global growth. Political instability, wars, and sanctions can disrupt supply and impact prices. The decisions of OPEC, a group of major Oil-producing countries, is another key driver of price. The value of the US Dollar influences the price of WTI Crude Oil, since Oil is predominantly traded in US Dollars, thus a weaker US Dollar can make Oil more affordable and vice versa.
The weekly Oil inventory reports published by the American Petroleum Institute (API) and the Energy Information Agency (EIA) impact the price of WTI Oil. Changes in inventories reflect fluctuating supply and demand. If the data shows a drop in inventories it can indicate increased demand, pushing up Oil price. Higher inventories can reflect increased supply, pushing down prices. API’s report is published every Tuesday and EIA’s the day after. Their results are usually similar, falling within 1% of each other 75% of the time. The EIA data is considered more reliable, since it is a government agency.
OPEC (Organization of the Petroleum Exporting Countries) is a group of 12 Oil-producing nations who collectively decide production quotas for member countries at twice-yearly meetings. Their decisions often impact WTI Oil prices. When OPEC decides to lower quotas, it can tighten supply, pushing up Oil prices. When OPEC increases production, it has the opposite effect. OPEC+ refers to an expanded group that includes ten extra non-OPEC members, the most notable of which is Russia.
The Pound Sterling (GBP) is expected to trade in a 1.3340/1.3420 range. In the longer run, GBP must break and hold above 1.3455 to resume strength, UOB Group FX analysts Quek Ser Leang and Lee Sue Ann note.
GBP must break and hold above 1.3455 to resume strength
24-HOUR VIEW: “We expected GBP to edge higher last Friday, but we held the view that ‘any advance is unlikely to break above 1.3455.’ GBP subsequently rose, but less than expected, reaching a high of 1.3428. GBP closed lower by 0.32% at 1.3372. Momentum indicators are turning flat, and the current price movements are likely part of a range trading phase. Expected range for today: 1.3340/1.3420.”
1-3 WEEKS VIEW: “Last Thursday (26 Sep, spot at 1.3325), we indicated that ‘the more than week-long GBP strength has ended.’ We expected GBP to ‘trade in a 1.3200/1.3430 range for the time being.’ After GBP rose to 1.3434, we indicated last Friday (27 Sep, spot at 1.3410) that ‘while upward momentum seems to be building again, it is not enough to indicate the resumption of GBP strength.’ We also indicated that GBP ‘must break and hold above 1.3455 before further advance to 1.3500 can be expected, and the likelihood of it breaking clearly above 1.3455 appears low for now, but it will remain intact as long as 1.3310 is not breached within these few days.’ We continue to hold the same view.”
The US Dollar (USD) traded with a heavy bias this morning as core PCE data came in softer while recent Fedspeaks were mostly dovish. DXY was last at 100.29, OCBC FX strategists Frances Cheung and Christopher Wong note.
Daily momentum is flat
“Musalem said he sees more than one additional 25bp cut for rest of 2024. He also said that a faster pace of rate reduction might be appropriate if economy and labour market weaken more than he expects. As of this morning, 30d Fed fund futures still implied 75bp cut for rest of 2024, despite Fed guiding for 50bp cut.”
“This week’s JOLTS job openings (Tue), initial jobless claims (Thu) and payrolls report (Fri) will be of interest. Dovish bets may be reduced if labour-related data comes in hotter, and this may have rebound impact on USD in the near term. Elsewhere, Fedspeaks will also be watched. About 13 officials are scheduled to speak this week, of which Fed Chair Powell’s speech at NABE tonight will the highlight.”
“Daily momentum is flat while RSI fell. Risks are somewhat skewed to the downside. Near term support at 100.20 (recent low). Break-out puts next support at 99.60, 99.20 levels. Resistance at 101.10 (21 DMA), 101.90 levels.”
- Silver price slumps to near $31.50 despite a steep fall in the US Dollar.
- Investors await Fed Powell’s speech for fresh interest rate guidance.
- Market participants will pay close attention to a string of US labor market data.
Silver price (XAG/USD) falls sharply to near $31.50 in Monday’s European session. The white metal weakens even though the US Dollar (USD) has dropped to near its yearly lows ahead of Federal Reserve (Fed) Chair Jerome Powell’s speech, which is scheduled at 17:00 GMT.
The US Dollar Index (DXY), which tracks the Greenback’s value against six major currencies, appears as vulnerable near 100.20. 10-year US Treasury yields climb to near 3.77%. Higher yields on interest-bearing assets increase the opportunity cost of holding an investment in non-yielding assets, such as Silver.
Investors will pay close attention to Fed Powell’s speech as he is expected to provide fresh interest rate guidance. Market participants want to know whether the Fed will reduce interest rates again by a larger-than-usual cut of 50 basis points (bps) in the November meeting.
According to the CME FedWatch tool, traders are almost equally split for a 25 or 50 bps interest rate cut in November. The tool also shows that the Fed will reduce interest rates collectively by 75 bps in the remainder of the year.
This week, investors will focus on a slew of the United States (US) economic data, such as JOLTS Job Openings for August and the ADP Employment Change and Nonfarm Payrolls (NFP) data for September.
Silver technical analysis:
Silver price struggles to extend its upside above the horizontal resistance plotted from the May 21 high of $32.50 on a daily timeframe. The near-term outlook of the white metal remains firm as the 20-day Exponential Moving Average (EMA) at $30.55 is sloping higher.
The 14-day Relative Strength Index (RSI) oscillates in the bullish range of 60.00-80.00, suggesting that a bullish momentum is intact.
Silver daily chart
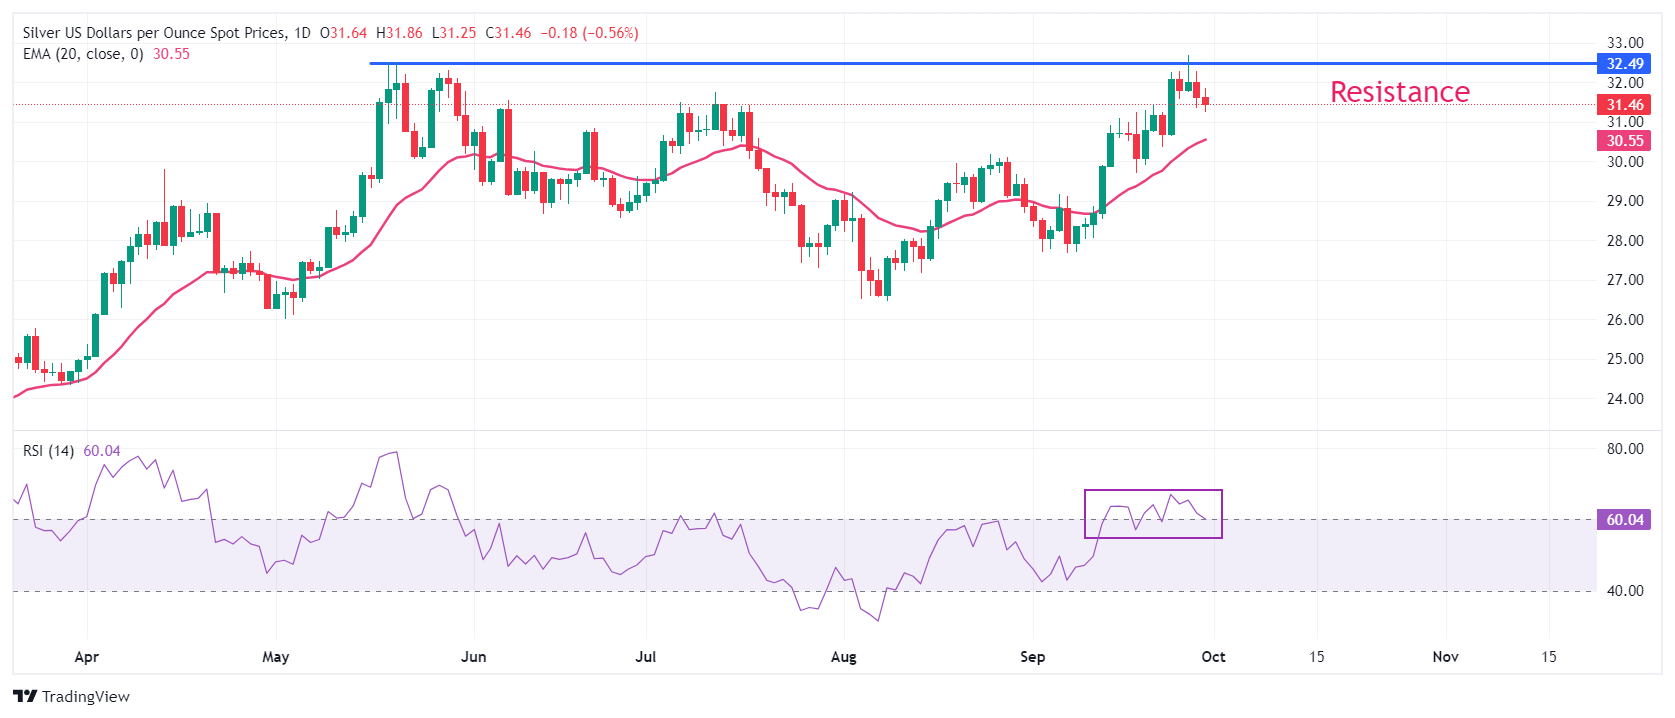
Silver FAQs
Silver is a precious metal highly traded among investors. It has been historically used as a store of value and a medium of exchange. Although less popular than Gold, traders may turn to Silver to diversify their investment portfolio, for its intrinsic value or as a potential hedge during high-inflation periods. Investors can buy physical Silver, in coins or in bars, or trade it through vehicles such as Exchange Traded Funds, which track its price on international markets.
Silver prices can move due to a wide range of factors. Geopolitical instability or fears of a deep recession can make Silver price escalate due to its safe-haven status, although to a lesser extent than Gold's. As a yieldless asset, Silver tends to rise with lower interest rates. Its moves also depend on how the US Dollar (USD) behaves as the asset is priced in dollars (XAG/USD). A strong Dollar tends to keep the price of Silver at bay, whereas a weaker Dollar is likely to propel prices up. Other factors such as investment demand, mining supply – Silver is much more abundant than Gold – and recycling rates can also affect prices.
Silver is widely used in industry, particularly in sectors such as electronics or solar energy, as it has one of the highest electric conductivity of all metals – more than Copper and Gold. A surge in demand can increase prices, while a decline tends to lower them. Dynamics in the US, Chinese and Indian economies can also contribute to price swings: for the US and particularly China, their big industrial sectors use Silver in various processes; in India, consumers’ demand for the precious metal for jewellery also plays a key role in setting prices.
Silver prices tend to follow Gold's moves. When Gold prices rise, Silver typically follows suit, as their status as safe-haven assets is similar. The Gold/Silver ratio, which shows the number of ounces of Silver needed to equal the value of one ounce of Gold, may help to determine the relative valuation between both metals. Some investors may consider a high ratio as an indicator that Silver is undervalued, or Gold is overvalued. On the contrary, a low ratio might suggest that Gold is undervalued relative to Silver.
Both the official and Caixin PMIs showed that manufacturing activity contracted in September. The two PMI gauges also indicated that the non-manufacturing activity has slowed and is at or near the expansion/ contraction threshold of 50. The deflationary pressure has persisted and likely worsened for the non-manufacturing sector in September, UOB Group economist Ho Woei Chen notes.
Manufacturing in contraction while non-manufacturing slowed in September
The official and Caixin PMIs indicate that economic activities have likely slowed further in September.
Weaker employment and increased deflationary pressure in the nonmanufacturing sector warrant concerns.
Without the aggressive stimulus package that was announced last week, the economy is likely to continue to head lower. We now expect some stabilization in the near-term with any positive impact to take time to be translated to the economy which continues to confront structural challenges that reduce its growth potential.
The Euro (EUR) is expected to trade in a range, likely between 1.1130 and 1.1195. In the longer run, EUR has likely entered a range trading phase, probably between 1.1060 and 1.1215, UOB Group FX analysts Quek Ser Leang and Lee Sue Ann note.
Has to break above 1.1230 for a sustained rise towards 1.1275
24-HOUR VIEW: “We indicated last Friday, that the ‘slight increase in momentum is likely to result in a higher trading range of 1.1140/1.1205 instead of a sustained advance.’ EUR subsequently traded in a wider range than expected (1.1123/1.1202), closing slightly lower by 0.12% (1.1163). There has been no increase in either downward or upward momentum. In other words, we continue to expect EUR to trade in a range, likely between 1.1130 and 1.1195.”
1-3 WEEKS VIEW: “Our update from last Thursday (26 Sep, spot at 1.1130) is still valid. As highlighted, EUR ‘has likely entered a range trading phase, probably between 1.1060 and 1.1215.’ Looking ahead, EUR not only has to break above 1.1215 but also 1.1230 before a sustained rise towards 1.1275 can be expected.”
- EUR/USD aims to reclaim 1.1200 despite a further slowdown in price pressures in six states of Germany in September.
- ECB’s Lagarde could suggest whether the central bank will cut interest rates again in October.
- Fed’s Powell would guide about the likely interest rate cut size in November.
EUR/USD moves higher to near 1.1200 in Monday’s European trading session. The major currency pair rises despite the flash annual Consumer Price Index (CPI) data of six German states showing that price pressures have decelerated further in September. The month-on-month inflation rose at a faster pace than what market participants saw in August but was within the 0.2% bracket.
On Friday, the flash French Consumer Price Index (EU Norm) and the Spanish Harmonized Index of Consumer Prices (HICP) data also showed that price pressures grew at a slower-than-expected pace in September.
A further slowdown in inflationary pressures has prompted market expectations of the European Central Bank (ECB) to cut interest rates again in the October meeting. Investors raised their bets on Friday on another rate cut on October 17 and have now priced in about a 75% chance of a move compared with only about a 25% chance seen last week, Reuters reported. The ECB also reduced its Rate on Deposit Facility by 25 basis points (bps) to 3.5% in its policy meeting on September 12.
Going forward, the Euro (EUR) is expected to remain highly volatile as investors await the preliminary HICP data of Germany and the Eurozone for September, which will be published on Monday and Tuesday, respectively.
In today’s session, investors will also pay close attention to ECB President Christine Lagarde’s speech at 13:00 GMT, in which she is expected to provide cues about the likely interest rate cut path for the remainder of the year.
Daily digest market movers: EUR/USD moves higher despite inflation in six states of Germany decelerating further
- EUR/USD edges higher on Monday as the US Dollar (USD) remains under pressure ahead of the Federal Reserve (Fed) Chair Jerome Powell’s speech, which is scheduled at 17:00 GMT. Investors expect Powell to provide fresh cues about the likely interest rate cut size by the Fed in the November monetary policy meeting.
- According to the CME FedWatch tool, the probability of the Fed reducing interest rates by 50 basis points (bps) in the November meeting to the range of 4.25%-4.50% is 41.6% at the time of writing. The likelihood has decreased from nearly 53.0% on Friday after the release of the United States (US) Personal Consumption Expenditures Price Index (PCE) report for August.
- The PCE price index report showed on Friday that the annual inflation decelerated at a faster pace to 2.2% from the estimates of 2.3% and July’s reading of 2.5%. This was the lowest reading since February 2021. However, its impact appeared to be offset by the annual core PCE inflation – which excludes volatile food and energy prices – that accelerated to 2.7% from the former release of 2.6%, as expected, diminishing the odds of a double-dose rate cut in the next meeting.
- Lately, Fed policymakers have become more focused on preventing job losses and an economic slowdown, with growing confidence that inflation will return to the bank’s target of 2%. To get fresh insights about the current status of the labor market health, investors will focus on a string of economic data such as JOLTS Job Openings for August, and the ADP Employment Change and Nonfarm Payrolls (NFP) data for September, which will be published this week.
Technical Analysis: EUR/USD is poised to reclaim 1.1200
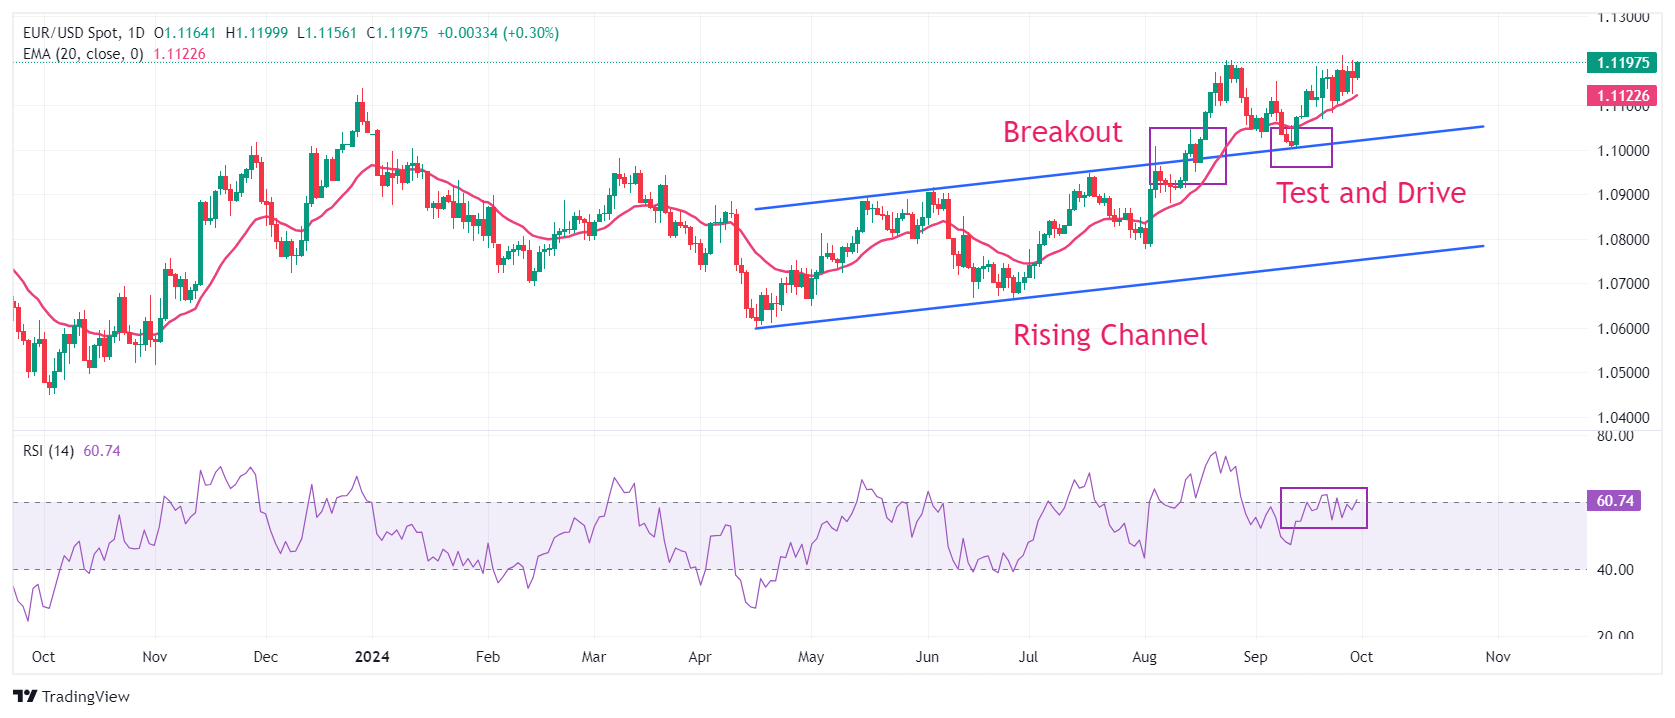
EUR/USD gathers strength to recapture 1.1200 in European trading hours on Monday. The major currency pair remains firm as it holds the breakout of the Rising Channel chart pattern formed on a daily time frame near the psychological level of 1.1000.
The upward-sloping 20-day Exponential Moving Average (EMA) near 1.1110 suggests that the near-term trend is bullish.
The 14-day Relative Strength Index (RSI) hovers near 60.00. A bullish momentum would trigger if the oscillator remains above this level.
Looking up, a decisive break above the round-level resistance of 1.1200 will result in further appreciation toward the July 2023 high of 1.1276. On the downside, the psychological level of 1.1000 and the July 17 high near 1.0950 will be major support zones.
Euro FAQs
The Euro is the currency for the 19 European Union countries that belong to the Eurozone. It is the second most heavily traded currency in the world behind the US Dollar. In 2022, it accounted for 31% of all foreign exchange transactions, with an average daily turnover of over $2.2 trillion a day. EUR/USD is the most heavily traded currency pair in the world, accounting for an estimated 30% off all transactions, followed by EUR/JPY (4%), EUR/GBP (3%) and EUR/AUD (2%).
The European Central Bank (ECB) in Frankfurt, Germany, is the reserve bank for the Eurozone. The ECB sets interest rates and manages monetary policy. The ECB’s primary mandate is to maintain price stability, which means either controlling inflation or stimulating growth. Its primary tool is the raising or lowering of interest rates. Relatively high interest rates – or the expectation of higher rates – will usually benefit the Euro and vice versa. The ECB Governing Council makes monetary policy decisions at meetings held eight times a year. Decisions are made by heads of the Eurozone national banks and six permanent members, including the President of the ECB, Christine Lagarde.
Eurozone inflation data, measured by the Harmonized Index of Consumer Prices (HICP), is an important econometric for the Euro. If inflation rises more than expected, especially if above the ECB’s 2% target, it obliges the ECB to raise interest rates to bring it back under control. Relatively high interest rates compared to its counterparts will usually benefit the Euro, as it makes the region more attractive as a place for global investors to park their money.
Data releases gauge the health of the economy and can impact on the Euro. Indicators such as GDP, Manufacturing and Services PMIs, employment, and consumer sentiment surveys can all influence the direction of the single currency. A strong economy is good for the Euro. Not only does it attract more foreign investment but it may encourage the ECB to put up interest rates, which will directly strengthen the Euro. Otherwise, if economic data is weak, the Euro is likely to fall. Economic data for the four largest economies in the euro area (Germany, France, Italy and Spain) are especially significant, as they account for 75% of the Eurozone’s economy.
Another significant data release for the Euro is the Trade Balance. This indicator measures the difference between what a country earns from its exports and what it spends on imports over a given period. If a country produces highly sought after exports then its currency will gain in value purely from the extra demand created from foreign buyers seeking to purchase these goods. Therefore, a positive net Trade Balance strengthens a currency and vice versa for a negative balance.
Silver prices (XAG/USD) fell on Monday, according to FXStreet data. Silver trades at $31.45 per troy ounce, down 0.58% from the $31.64 it cost on Friday.
Silver prices have increased by 32.18% since the beginning of the year.
| Unit measure | Silver Price Today in USD |
|---|---|
| Troy Ounce | 31.45 |
| 1 Gram | 1.01 |
The Gold/Silver ratio, which shows the number of ounces of Silver needed to equal the value of one ounce of Gold, stood at 84.26 on Monday, up from 84.03 on Friday.
Silver FAQs
Silver is a precious metal highly traded among investors. It has been historically used as a store of value and a medium of exchange. Although less popular than Gold, traders may turn to Silver to diversify their investment portfolio, for its intrinsic value or as a potential hedge during high-inflation periods. Investors can buy physical Silver, in coins or in bars, or trade it through vehicles such as Exchange Traded Funds, which track its price on international markets.
Silver prices can move due to a wide range of factors. Geopolitical instability or fears of a deep recession can make Silver price escalate due to its safe-haven status, although to a lesser extent than Gold's. As a yieldless asset, Silver tends to rise with lower interest rates. Its moves also depend on how the US Dollar (USD) behaves as the asset is priced in dollars (XAG/USD). A strong Dollar tends to keep the price of Silver at bay, whereas a weaker Dollar is likely to propel prices up. Other factors such as investment demand, mining supply – Silver is much more abundant than Gold – and recycling rates can also affect prices.
Silver is widely used in industry, particularly in sectors such as electronics or solar energy, as it has one of the highest electric conductivity of all metals – more than Copper and Gold. A surge in demand can increase prices, while a decline tends to lower them. Dynamics in the US, Chinese and Indian economies can also contribute to price swings: for the US and particularly China, their big industrial sectors use Silver in various processes; in India, consumers’ demand for the precious metal for jewellery also plays a key role in setting prices.
Silver prices tend to follow Gold's moves. When Gold prices rise, Silver typically follows suit, as their status as safe-haven assets is similar. The Gold/Silver ratio, which shows the number of ounces of Silver needed to equal the value of one ounce of Gold, may help to determine the relative valuation between both metals. Some investors may consider a high ratio as an indicator that Silver is undervalued, or Gold is overvalued. On the contrary, a low ratio might suggest that Gold is undervalued relative to Silver.
(An automation tool was used in creating this post.)
- Gold is pulling back after a strong uptrending move took it to new highs of $2,685 last week.
- A rally in Chinese equities and an improved outlook for the property market are diverting capital away from the safe-haven.
- Technically, XAU/USD threatens to exit overbought territory, signaling a deeper pullback could evolve.
Gold (XAU/USD) pulls back to trade in the $2,650s per troy ounce on Monday, as traders take profit after last week’s almost 1.4% rally to new all time highs. A historic rally in Chinese stocks, which saw the benchmark CSI 300 gain over 7.50% during the Asian session on Monday alone, as well as a brighter outlook for the Chinese property market due to falling mortgage rates diverts capital away from Gold as a safe-haven.
Gold traders have been surfing a wave that started after a seismic shift in the US, where the Federal Reserve (Fed) opted to cut interest rates by a “jumbo” 0.50% at their September meeting, lowering the opportunity cost of holding the precious metal. However, better-than-expected US data since then have slightly lowered the chances of the Fed making another aggressive 50 basis point (bps) rate cut in November, though chances of this scenario occurring still remain above 50%, according to the CME FedWatch tool.
Gold pulls back but investors have mixed views about its future
Gold pulls back after touching a new record high of $2,685 last week on the back of the Fed kicking off its easing cycle and central banks globally following the US reserve bank’s lead.
Is the correction likely to deepen or will Gold resume its uptrend and push to yet higher highs? It appears investors have mixed views about the short-term prospects for Gold, according to a Weekly Gold survey compiled by Kitco News.
Darin Newsom, Senior Market Analyst at Barchart.com, sees the uptrend continuing: “Applying Newton’s First Law of Motion to markets: A trending market will stay in that trend until acted upon by an outside force. That outside force is usually investor activity, and given the potential for global chaos is only going to increase over the next month, investors aren’t likely to change their mind on gold as a safe-haven market.”
Ole Hansen, however, who is Head of Commodity Strategy at Saxo Bank, thinks the uptrend is petering out. “I see it lower as I believe the rally is running on fumes from FOMO and momentum-chasing traders using derivatives,” he said, adding that “in the short term, physical demand is likely to dry up until investors adapt to these new and higher price levels.”
Adrian Day, president of Adrian Day Asset Management, meanwhile, expected the price of Gold to change little in the short term.
“A pause in the strong move up is overdue and could come now that the Federal Reserve’s first rate cut is in the rear mirror,” he said. “Over the next six and 12 months, I could not be more bullish as Western investors finally start to buy Gold,” he added. “But markets do not go straight up forever.”
Technical Analysis: Gold extends pullback from new all-time highs
Gold extends its pullback after hitting record highs. The precious metal is still in an uptrend on a short, medium and long-term basis, however, and since it is a foundational principle of technical analysis that “the trend is your friend,” the odds favor even more upside for the yellow metal.
XAU/USD Daily Chart
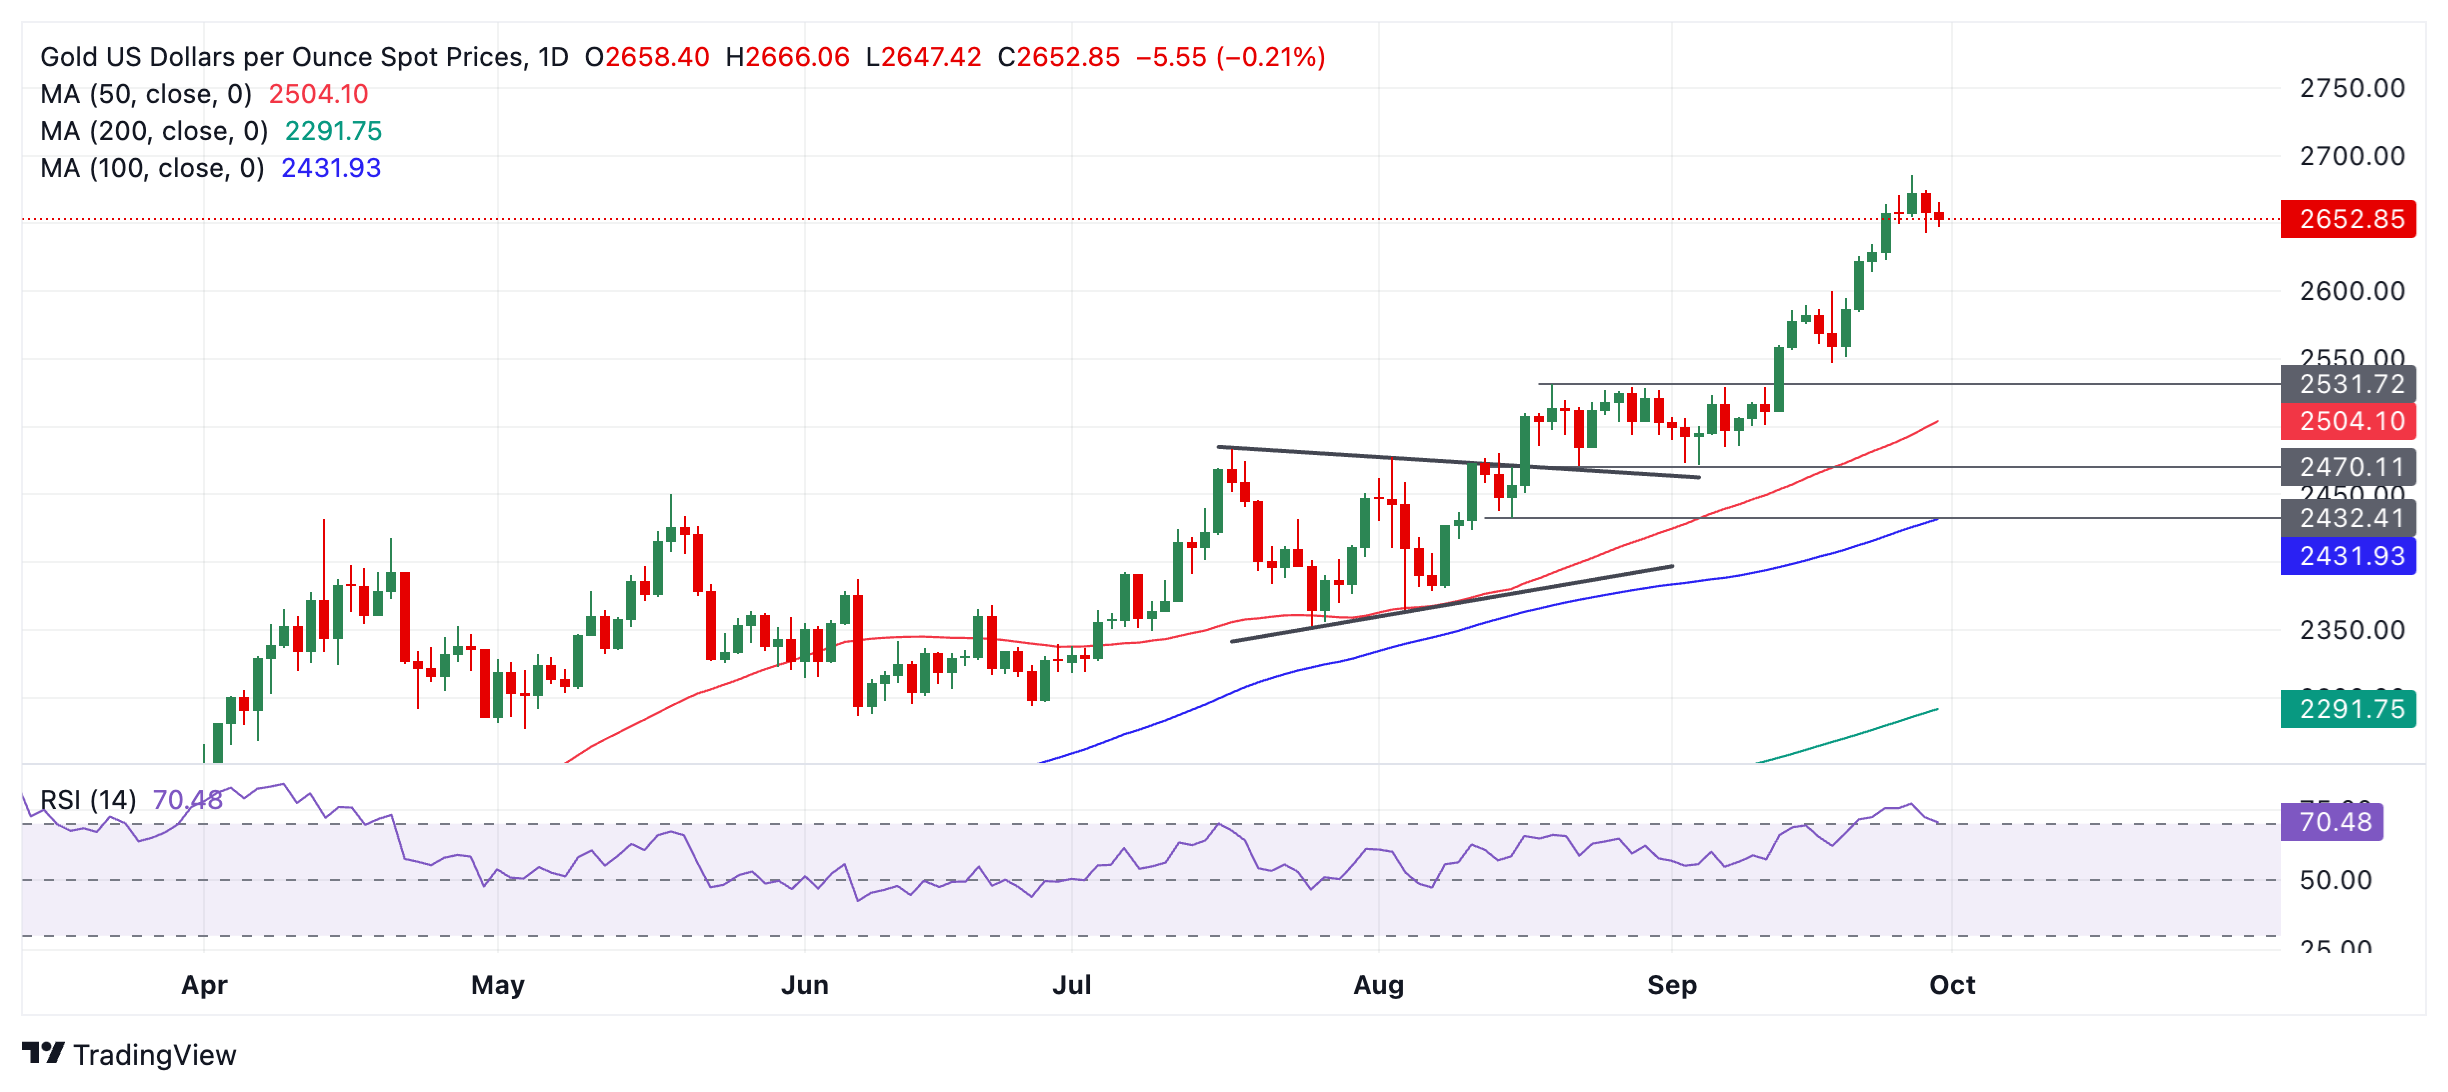
Gold remains overbought, according to the Relative Strength Index (RSI) momentum indicator. It has now also almost fallen back down into neutral territory (below 70) and if it closes (on a daily basis) back inside neutral it will be a sign for traders to close their long positions and open shorts. As is it, simply by being overbought it advises traders not to add to their long positions.
If a deeper correction evolves – as now looks likely – firm support lies at $2,600 (September 18 high), $2,550 and $2,544 (0.382 Fibonacci retracement of the September rally).
Given the precious metal’s entrenched uptrend, however, there is a good chance any correction will run out of steam and bulls will resume pushing the price higher. If Gold breaks to higher highs, it will further reconfirm the metal’s uptrending bias. The next targets to the upside are the round numbers $2,700 and then $2,750.
Gold FAQs
Gold has played a key role in human’s history as it has been widely used as a store of value and medium of exchange. Currently, apart from its shine and usage for jewelry, the precious metal is widely seen as a safe-haven asset, meaning that it is considered a good investment during turbulent times. Gold is also widely seen as a hedge against inflation and against depreciating currencies as it doesn’t rely on any specific issuer or government.
Central banks are the biggest Gold holders. In their aim to support their currencies in turbulent times, central banks tend to diversify their reserves and buy Gold to improve the perceived strength of the economy and the currency. High Gold reserves can be a source of trust for a country’s solvency. Central banks added 1,136 tonnes of Gold worth around $70 billion to their reserves in 2022, according to data from the World Gold Council. This is the highest yearly purchase since records began. Central banks from emerging economies such as China, India and Turkey are quickly increasing their Gold reserves.
Gold has an inverse correlation with the US Dollar and US Treasuries, which are both major reserve and safe-haven assets. When the Dollar depreciates, Gold tends to rise, enabling investors and central banks to diversify their assets in turbulent times. Gold is also inversely correlated with risk assets. A rally in the stock market tends to weaken Gold price, while sell-offs in riskier markets tend to favor the precious metal.
The price can move due to a wide range of factors. Geopolitical instability or fears of a deep recession can quickly make Gold price escalate due to its safe-haven status. As a yield-less asset, Gold tends to rise with lower interest rates, while higher cost of money usually weighs down on the yellow metal. Still, most moves depend on how the US Dollar (USD) behaves as the asset is priced in dollars (XAU/USD). A strong Dollar tends to keep the price of Gold controlled, whereas a weaker Dollar is likely to push Gold prices up.
- USD/CAD struggles to gain any meaningful traction and is influenced by a combination of diverging forces.
- Dovish Fed expectations weigh on the USD; bets for a larger BoC rate cut keep the CAD bulls on the sidelines.
- The setup warrants caution before positioning for an extension of last week’s recovery from a multi-month low.
The USD/CAD pair struggles to capitalize on last week's goodish recovery from its lowest level since March 8, albeit manages to hold above the 1.3500 psychological mark through the first half of the European session on Monday.
The US Dollar (USD) selling bias remains unabated for the third straight day amid rising bets for a more aggressive policy easing by the Federal Reserve (Fed), which, in turn, is seen acting as a headwind for the USD/CAD pair. Meanwhile, rising geopolitical risks in the Middle East lend some support to Crude Oil prices and underpin the commodity-linked Loonie, further contributing to capping the currency pair. That said, expectations for a larger rate cut by the Bank of Canada (BoC) keep a lid on the Canadian Dollar (CAD) and limit the downside for spot prices.
From a technical perspective, oscillators on the daily chart – though have been recovering from lower levels – are yet to confirm a positive bias and warrant some caution before positioning for any meaningful upside. Meanwhile, the USD/CAD pair now seems to have found acceptance above the 38.2% Fibonacci retracement level of the recent downfall from the monthly peak and is currently placed around the 200-hour Simple Moving Average (SMA). Any subsequent move-up is likely to attract fresh sellers near the 50% Fibo. level, around the 1.3535 area region.
The next relevant hurdle is pegged near the 1.3555-1.3560 area, or the 61.8% Fibo. level, and the very important 200-day SMA, currently pegged just ahead of the 1.3600 mark. The latter should act as a key pivotal point, which if cleared decisively should lift the USD/CAD pair to the monthly peak, around the 1.3645-1.3650 region. Some follow-through buying will be seen as a fresh trigger for bullish traders and pave the way for a further appreciating move in the near term.
On the flip side, a sustained break below the 1.3500 mark is likely to find some support near the 1.3465 region, below which the USD/CAD pair could retest the multi-month low, around the 1.3420 region. Some follow-through selling below the 1.3400 mark will pave the way for the resumption of the recent well-established downtrend witnessed over the past two months or so.
USD/CAD 1-hour chart
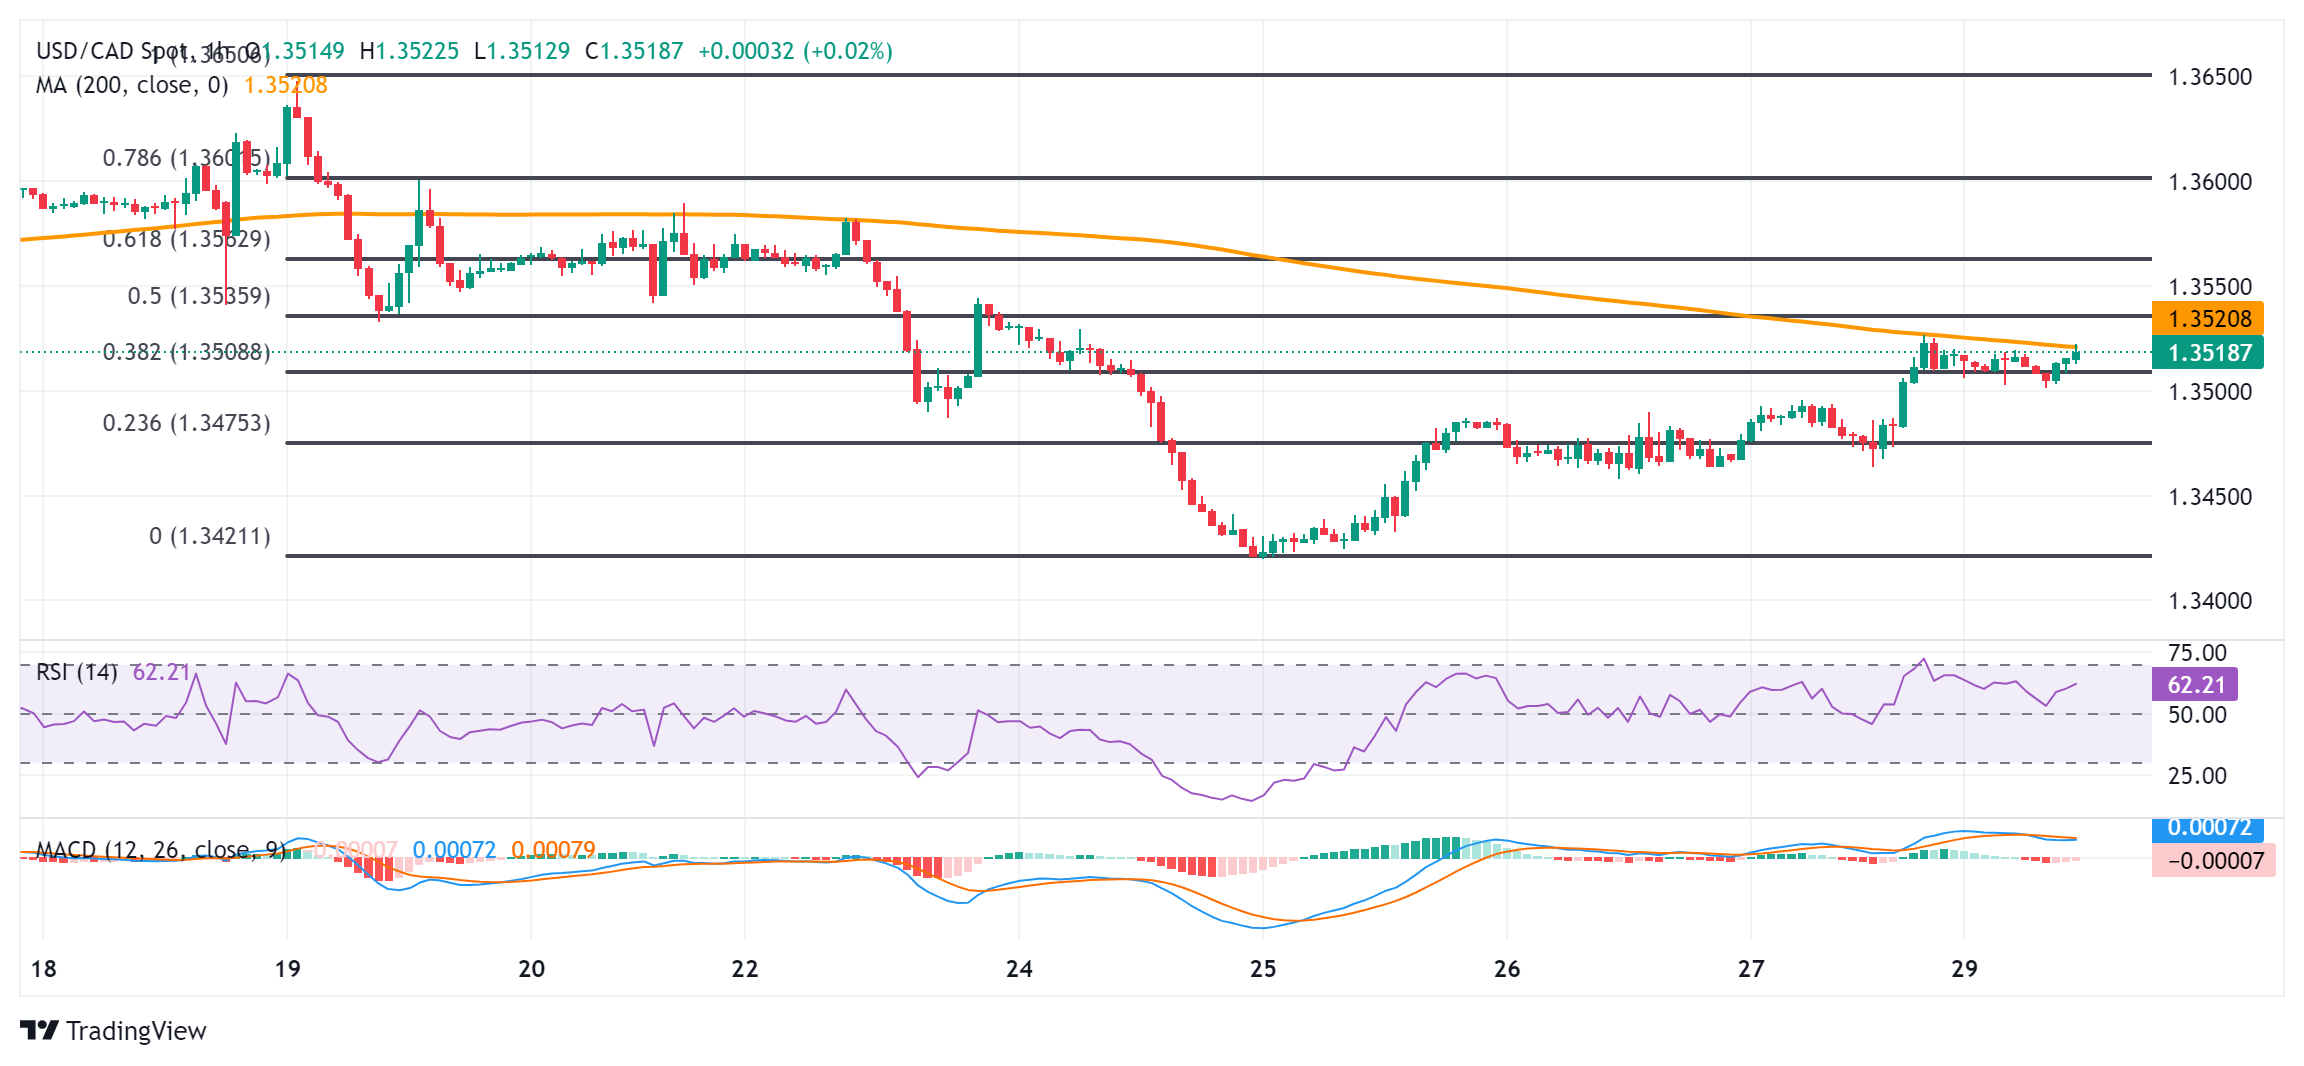
Canadian Dollar FAQs
The key factors driving the Canadian Dollar (CAD) are the level of interest rates set by the Bank of Canada (BoC), the price of Oil, Canada’s largest export, the health of its economy, inflation and the Trade Balance, which is the difference between the value of Canada’s exports versus its imports. Other factors include market sentiment – whether investors are taking on more risky assets (risk-on) or seeking safe-havens (risk-off) – with risk-on being CAD-positive. As its largest trading partner, the health of the US economy is also a key factor influencing the Canadian Dollar.
The Bank of Canada (BoC) has a significant influence on the Canadian Dollar by setting the level of interest rates that banks can lend to one another. This influences the level of interest rates for everyone. The main goal of the BoC is to maintain inflation at 1-3% by adjusting interest rates up or down. Relatively higher interest rates tend to be positive for the CAD. The Bank of Canada can also use quantitative easing and tightening to influence credit conditions, with the former CAD-negative and the latter CAD-positive.
The price of Oil is a key factor impacting the value of the Canadian Dollar. Petroleum is Canada’s biggest export, so Oil price tends to have an immediate impact on the CAD value. Generally, if Oil price rises CAD also goes up, as aggregate demand for the currency increases. The opposite is the case if the price of Oil falls. Higher Oil prices also tend to result in a greater likelihood of a positive Trade Balance, which is also supportive of the CAD.
While inflation had always traditionally been thought of as a negative factor for a currency since it lowers the value of money, the opposite has actually been the case in modern times with the relaxation of cross-border capital controls. Higher inflation tends to lead central banks to put up interest rates which attracts more capital inflows from global investors seeking a lucrative place to keep their money. This increases demand for the local currency, which in Canada’s case is the Canadian Dollar.
Macroeconomic data releases gauge the health of the economy and can have an impact on the Canadian Dollar. Indicators such as GDP, Manufacturing and Services PMIs, employment, and consumer sentiment surveys can all influence the direction of the CAD. A strong economy is good for the Canadian Dollar. Not only does it attract more foreign investment but it may encourage the Bank of Canada to put up interest rates, leading to a stronger currency. If economic data is weak, however, the CAD is likely to fall.
- AUD/JPY receives support from the hawkish sentiment surrounding the RBA’s policy outlook.
- The risk-sensitive AUD appreciates due to improved market sentiment amid dovish sentiment surrounding the Fed's interest rates trajectory.
- The Japanese Yen struggles as upcoming PM Shigeru Ishiba says that the monetary policy should continue to be accommodative.
AUD/JPY gains ground, trading around 98.70 during the European session on Monday. This upside of the AUD/JPY cross is attributed to the Reserve Bank of Australia’s (RBA) hawkish stance contributing support to the Australian Dollar (AUD). The RBA kept its cash rate at 4.35% for a seventh consecutive meeting and stated that the policy would need to stay restrictive to ensure inflation slowed.
The AUD remains stronger despite the mixed Manufacturing Purchasing Managers’ Index (PMI) data from China, Australia’s largest trading partner. China's Caixin Manufacturing PMI fell to 49.3 in September, indicating contraction, down from 50.4 in August. Meanwhile, China’s NBS Manufacturing PMI improved to 49.8, up from 49.1 in the previous month and surpassing the market consensus of 49.5.
Additionally, the rising expectations that the US Federal Reserve (Fed) may continue its policy easing in November is improving the market sentiment and contributing support for the risk-sensitive Australian Dollar. The CME FedWatch Tool indicates that markets are assigning a 55.9% probability to a 25 basis point rate cut by the Federal Reserve in November.
The Japanese Yen (JPY) receives downward pressure due to the dovish comments from Japan's upcoming Prime Minister, former Defense Chief Shigeru Ishiba. Ishiba stated on Sunday that the country's monetary policy should continue to be accommodative, indicating the necessity of maintaining low borrowing costs to support a fragile economic recovery, according to The Japan Times.
On Monday, Japan's Retail Trade increased by 2.8% year-on-year in August, surpassing market expectations of 2.3% and slightly exceeding the upwardly revised 2.7% rise from the previous month. On a month-over-month basis, seasonally adjusted Retail Trade rose by 0.8%, marking the largest increase in three months, following a 0.2% gain in July.
Japan's Chief Cabinet Secretary, Yoshimasa Hayashi, refrained from commenting on Monday's daily stock market fluctuations. Hayashi emphasized the importance of closely monitoring the economic and financial situation both domestically and internationally with a sense of urgency. He also noted the need for ongoing collaboration with the Bank of Japan.
Interest rates FAQs
Interest rates are charged by financial institutions on loans to borrowers and are paid as interest to savers and depositors. They are influenced by base lending rates, which are set by central banks in response to changes in the economy. Central banks normally have a mandate to ensure price stability, which in most cases means targeting a core inflation rate of around 2%. If inflation falls below target the central bank may cut base lending rates, with a view to stimulating lending and boosting the economy. If inflation rises substantially above 2% it normally results in the central bank raising base lending rates in an attempt to lower inflation.
Higher interest rates generally help strengthen a country’s currency as they make it a more attractive place for global investors to park their money.
Higher interest rates overall weigh on the price of Gold because they increase the opportunity cost of holding Gold instead of investing in an interest-bearing asset or placing cash in the bank. If interest rates are high that usually pushes up the price of the US Dollar (USD), and since Gold is priced in Dollars, this has the effect of lowering the price of Gold.
The Fed funds rate is the overnight rate at which US banks lend to each other. It is the oft-quoted headline rate set by the Federal Reserve at its FOMC meetings. It is set as a range, for example 4.75%-5.00%, though the upper limit (in that case 5.00%) is the quoted figure. Market expectations for future Fed funds rate are tracked by the CME FedWatch tool, which shapes how many financial markets behave in anticipation of future Federal Reserve monetary policy decisions.
- The Mexican Peso modulates between weak gains and losses on Monday.
- The week ahead promises to be busy for traders of the Peso’s key counterparts, given scheduled events and data.
- USD/MXN extends its steady climb within a rising channel.
The Mexican Peso (MXN) seesaws between tepid gains and losses on Monday after falling an average of 1.5% in its major pairs last week. The Bank of Mexico’s (Banxico) decision to cut interest rates by 25 basis points (0.25%) at its September meeting on Thursday, bringing the official cash rate down to 10.50%, as well as a downward revision to its forecasts for the economy, contributed to the Peso’s devaluation across the board.
Data showing a widening trade deficit added to the negativity surrounding the Mexican Peso after official figures showed it widened to $4.868 billion in August from $1.278 billion a year ago. These figures significantly exceeded market expectations of a $0.500 billion gap and reached a new two-year high.
The proximity of the United States (US) election and prospects of former President Donald Trump winning and then imposing an “America First” agenda, with negative implications for trade with Mexico, further add to the concerns regarding Mexico’s persistent trade deficit, which amounts to $10.438 billion for the first eight months of 2024.
Mexican Peso traders prepare for data-heavy week
The Mexican Peso oscillates between mild gains and losses on Monday ahead of a busy week of macroeconomic data releases and key events for its major peers – the US Dollar (USD), Euro (EUR) and Pound Sterling (GBP).
On Monday, speeches by European Central Bank (ECB) President Christine Lagarde and Chairman of the Federal Reserve (Fed) Jerome Powell could impact the EUR and USD, respectively. Recent weak data from the Eurozone, in particular, is leading to speculation in markets that the ECB will have to be more aggressive about cutting interest rates to aid growth, potentially weakening the Euro. In Mexico, Fiscal Balance data for August will be released, revealing the government’s spending shortfall.
On Tuesday, preliminary Eurozone inflation data for September, and then the Nonfarm Payrolls (NFP) on Friday, are further key data releases relating to key Peso pairs. The NFP release will be watched closely for signs of a slowdown in the labor market after the Fed made it clear it is now taking into account its mandate to provide full employment as part of its decision-making on interest rates.
Technical Analysis: USD/MXN trends higher within channel
USD/MXN climbs steadily higher within its rising channel as it continues its short, medium and long-term bullish trend.
USD/MXN Daily Chart
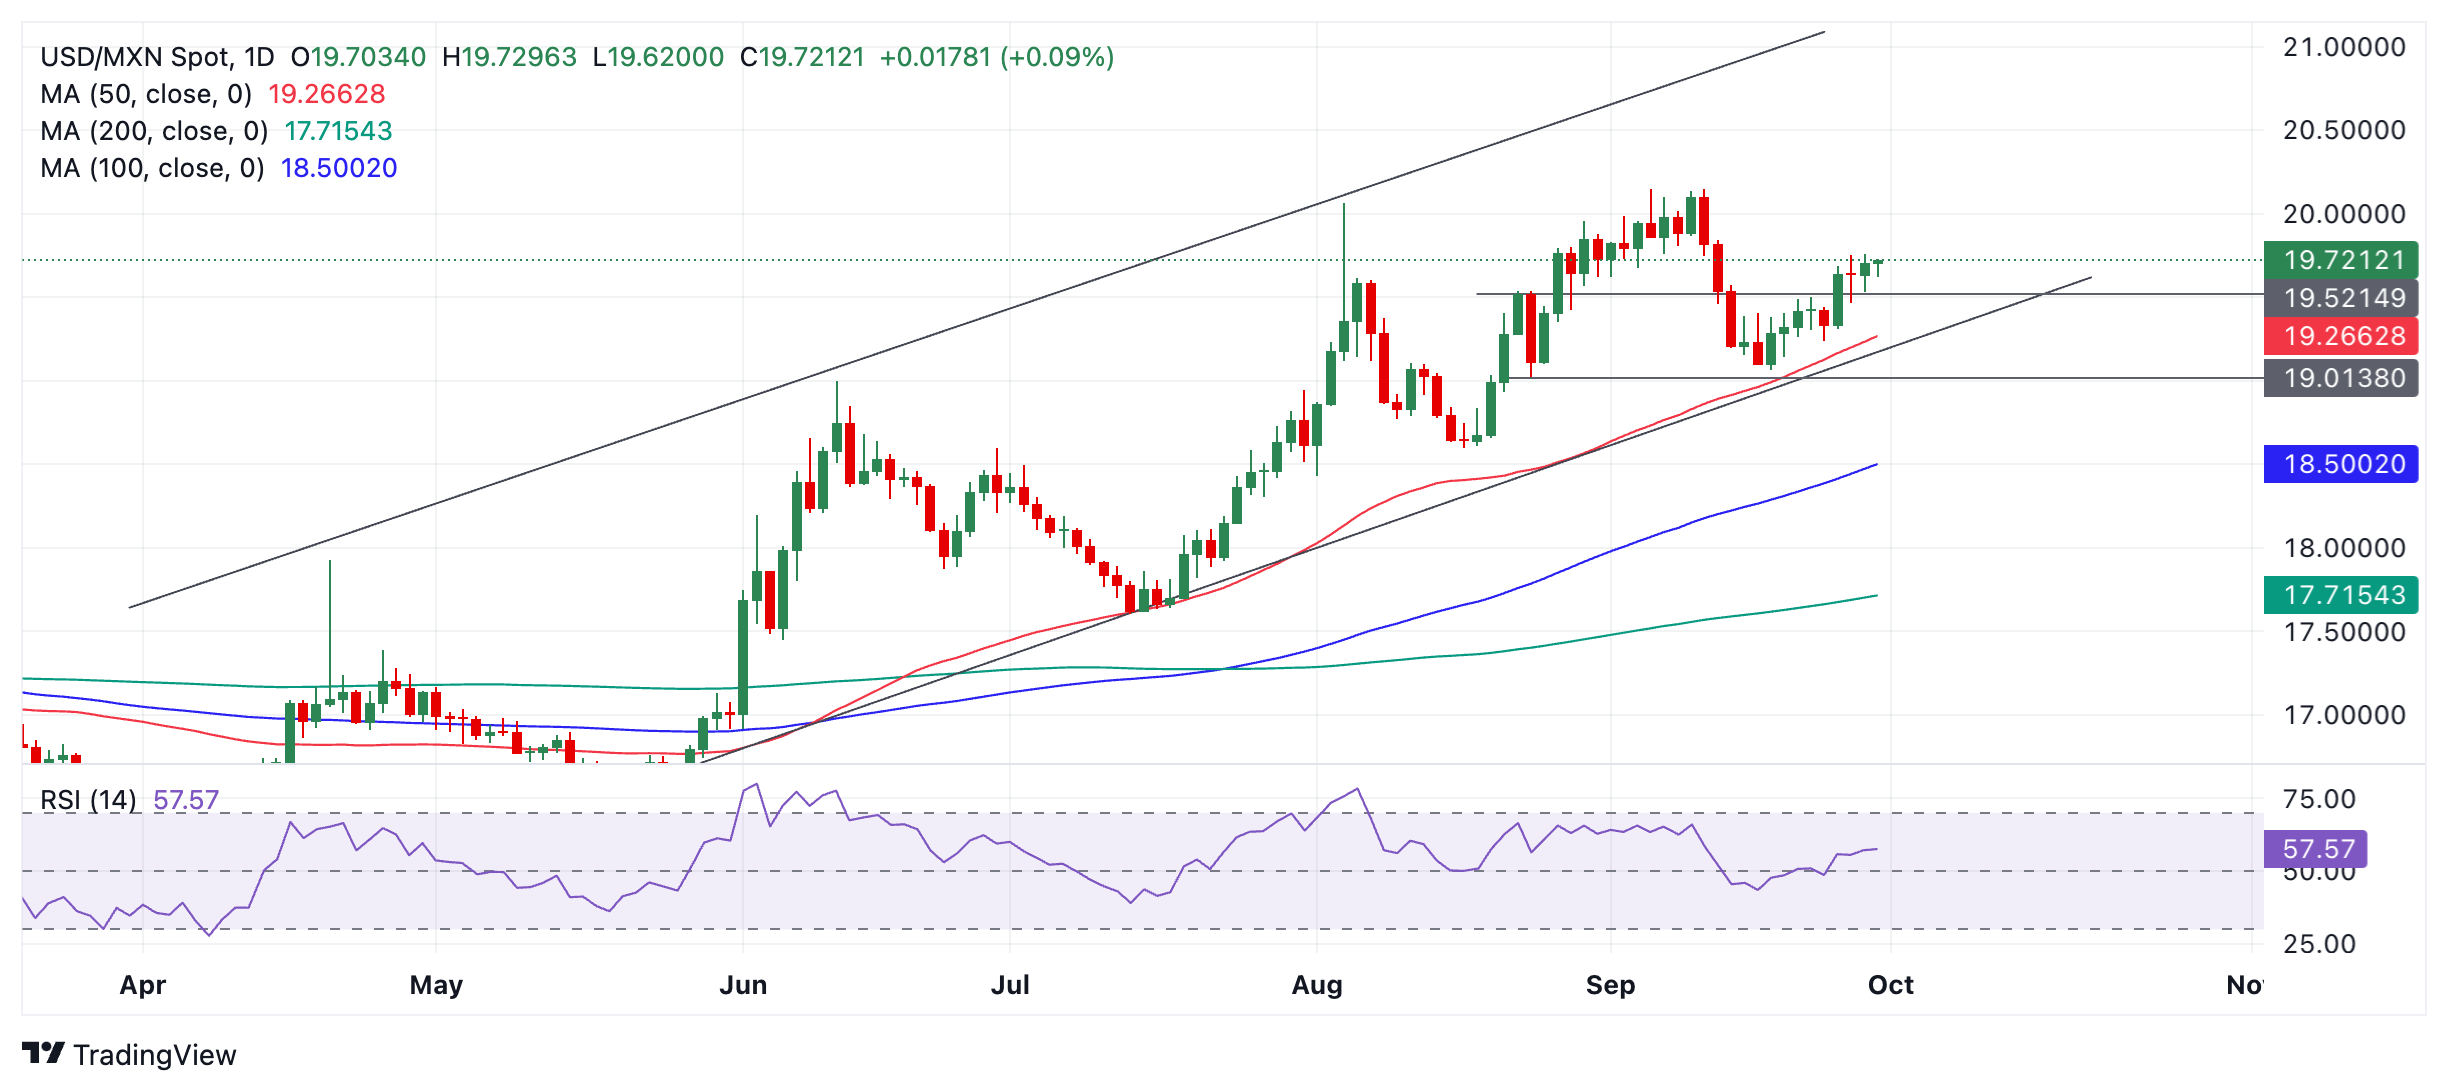
Friday’s close above 19.68 (September 25 high) provided more bullish certainty of the pair’s near-term upside bias towards a target at 20.15, the high of the year reached in early September.
A further break above 19.76 (the September 27 high) would create a higher high and provide yet more proof of an extension of the uptrend.
Mexican Peso FAQs
The Mexican Peso (MXN) is the most traded currency among its Latin American peers. Its value is broadly determined by the performance of the Mexican economy, the country’s central bank’s policy, the amount of foreign investment in the country and even the levels of remittances sent by Mexicans who live abroad, particularly in the United States. Geopolitical trends can also move MXN: for example, the process of nearshoring – or the decision by some firms to relocate manufacturing capacity and supply chains closer to their home countries – is also seen as a catalyst for the Mexican currency as the country is considered a key manufacturing hub in the American continent. Another catalyst for MXN is Oil prices as Mexico is a key exporter of the commodity.
The main objective of Mexico’s central bank, also known as Banxico, is to maintain inflation at low and stable levels (at or close to its target of 3%, the midpoint in a tolerance band of between 2% and 4%). To this end, the bank sets an appropriate level of interest rates. When inflation is too high, Banxico will attempt to tame it by raising interest rates, making it more expensive for households and businesses to borrow money, thus cooling demand and the overall economy. Higher interest rates are generally positive for the Mexican Peso (MXN) as they lead to higher yields, making the country a more attractive place for investors. On the contrary, lower interest rates tend to weaken MXN.
Macroeconomic data releases are key to assess the state of the economy and can have an impact on the Mexican Peso (MXN) valuation. A strong Mexican economy, based on high economic growth, low unemployment and high confidence is good for MXN. Not only does it attract more foreign investment but it may encourage the Bank of Mexico (Banxico) to increase interest rates, particularly if this strength comes together with elevated inflation. However, if economic data is weak, MXN is likely to depreciate.
As an emerging-market currency, the Mexican Peso (MXN) tends to strive during risk-on periods, or when investors perceive that broader market risks are low and thus are eager to engage with investments that carry a higher risk. Conversely, MXN tends to weaken at times of market turbulence or economic uncertainty as investors tend to sell higher-risk assets and flee to the more-stable safe havens.
- NZD/USD may approach its 15-month high of 0.6409 level.
- The analysis of a daily chart suggests an ongoing bullish bias for the pair.
- A nine-day EMA at 0.6293 appears as the support, which is aligned with the lower boundary of the ascending channel.
NZD/USD extends its winning streak for the third successive day, trading around 0.6360 during the early European hours on Monday. On the daily chart, the pair is moving upward within the ascending channel pattern, suggesting an ongoing bullish bias.
Additionally, the 14-day Relative Strength Index (RSI) remains above the 50 level, confirming an ongoing bullish sentiment. The RSI may appreciate toward the 70 mark, suggesting a potential for further gains.
Additionally, the nine-day Exponential Moving Average (EMA) is positioned above the 50-day EMA, suggesting the short-term price trend is stronger for the NZD/USD pair.
On the upside, the NZD/USD pair may explore the area around its 15-month high of 0.6409 level, recorded in December 2023, aligned with the upper boundary of the ascending channel.
In terms of support, the NZD/USD pair may test the nine-day Exponential Moving Average (EMA) at the 0.6292 level, aligned with the lower boundary of the ascending channel.
A break below the ascending channel could weaken the bullish bias and put pressure on the NZD/USD pair to test the 50-day EMA at 0.6172 level, followed by the five-week low of 0.6096 level.
NZD/USD: Daily Chart
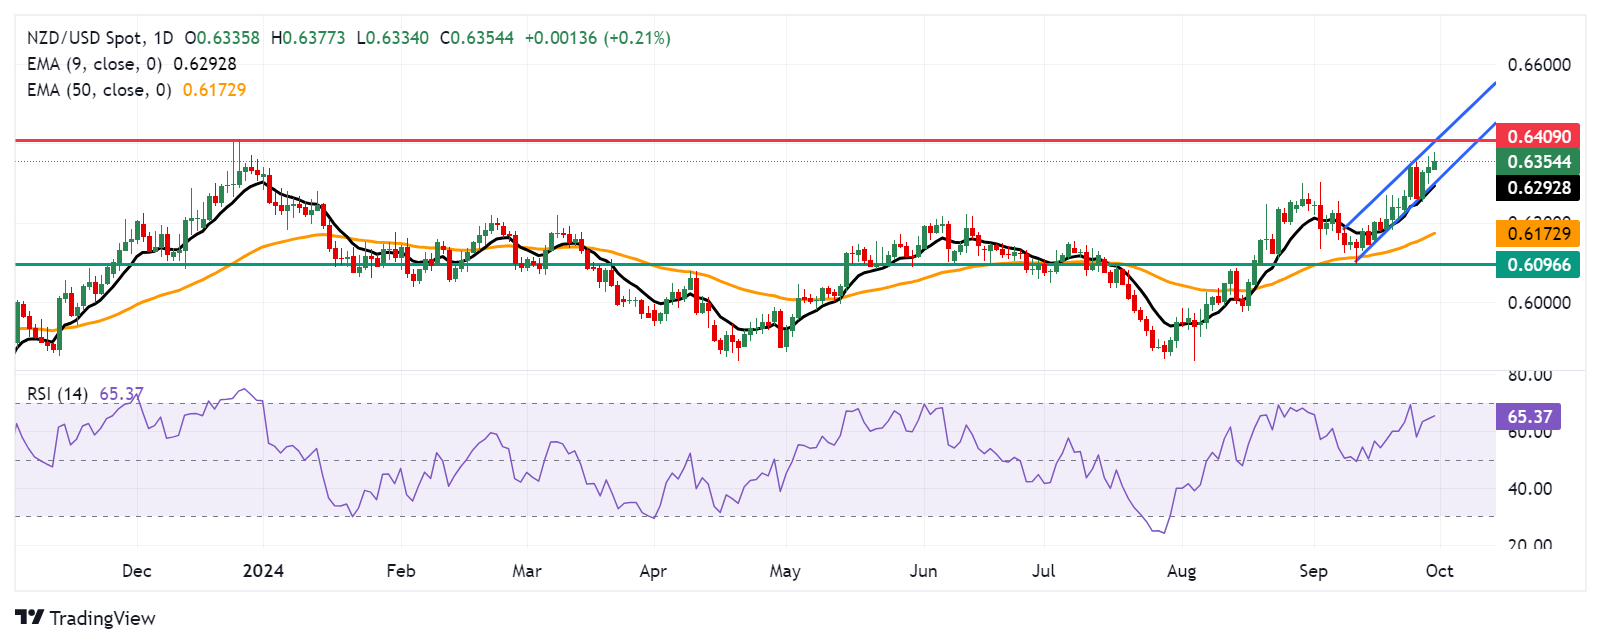
New Zealand Dollar PRICE Today
The table below shows the percentage change of New Zealand Dollar (NZD) against listed major currencies today. New Zealand Dollar was the strongest against the Swiss Franc.
| USD | EUR | GBP | JPY | CAD | AUD | NZD | CHF | |
|---|---|---|---|---|---|---|---|---|
| USD | -0.17% | -0.14% | 0.09% | 0.06% | -0.32% | -0.31% | 0.25% | |
| EUR | 0.17% | 0.03% | 0.27% | 0.26% | -0.09% | -0.12% | 0.50% | |
| GBP | 0.14% | -0.03% | 0.34% | 0.22% | -0.12% | -0.15% | 0.47% | |
| JPY | -0.09% | -0.27% | -0.34% | 0.04% | -0.45% | -0.36% | 0.23% | |
| CAD | -0.06% | -0.26% | -0.22% | -0.04% | -0.33% | -0.37% | 0.25% | |
| AUD | 0.32% | 0.09% | 0.12% | 0.45% | 0.33% | -0.03% | 0.59% | |
| NZD | 0.31% | 0.12% | 0.15% | 0.36% | 0.37% | 0.03% | 0.60% | |
| CHF | -0.25% | -0.50% | -0.47% | -0.23% | -0.25% | -0.59% | -0.60% |
The heat map shows percentage changes of major currencies against each other. The base currency is picked from the left column, while the quote currency is picked from the top row. For example, if you pick the New Zealand Dollar from the left column and move along the horizontal line to the US Dollar, the percentage change displayed in the box will represent NZD (base)/USD (quote).
- GBP/JPY stages a solid intraday recovery from over a one-week trough touched earlier this Monday.
- A combination of factors weighs on the JPY and lends support to the cross amid a modest GBP uptick.
- The divergent BoJ-BoE policy expectations warrant caution before placing aggressive bullish bets.
The GBP/JPY cross attracts some dip-buyers in the vicinity of mid-189.00s, or a one-week low and for now, seems to have stalled its retracement slide from a nearly two-month peak touched on Friday. The move up lifts spot prices to the 191.00 neighborhood, back closer to the daily peak during the early European session, though the fundamental backdrop warrants some caution for bullish traders.
The Japanese Yen (JPY) weakens in reaction to comments from Japan's incoming Prime Minister (PM) Shigeru Ishiba, saying that the Bank of Japan's (BoJ) monetary policy must remain accommodative to underpin a fragile economic recovery. This, along with news that the new PM is planning a general election for October 27 and mixed Japanese economic data, continues to undermine the JPY and lends support to the GBP/JPY cross.
Meanwhile, the British Pound (GBP) draws support from a subdued US Dollar (USD) demand and expectations that the Bank of England's (BoE) rate-cutting cycle is likely to be slower than in the US. This turns out to be another factor acting as a tailwind for the GBP/JPY cross. That said, the growing market conviction that the BoJ will hike interest rates again by the end of this year should help limit any meaningful JPY losses.
Apart from this, the risk of a further escalation of geopolitical tensions in the Middle East should benefit the safe-haven JPY and contribute to capping the GBP/JPY cross. Israel expanded its confrontation with Iran's allies and launched aggressive aerial assaults on Sunday against Houthis in Yemen and Hezbollah in Lebanon. This, in turn, fuels concerns that the fighting could spin out of control and trigger an all-out war in the region.
From a technical perspective, the 50-day Simple Moving Average (SMA) crossed below the very important 200-day SMA earlier this month, forming a bearish 'Death Cross' on the daily chart. This further makes it prudent to wait for strong follow-through buying before positioning for the resumption of the recent goodish recovery from the monthly low in the absence of any relevant market-moving economic releases on Monday.
Bank of Japan FAQs
The Bank of Japan (BoJ) is the Japanese central bank, which sets monetary policy in the country. Its mandate is to issue banknotes and carry out currency and monetary control to ensure price stability, which means an inflation target of around 2%.
The Bank of Japan embarked in an ultra-loose monetary policy in 2013 in order to stimulate the economy and fuel inflation amid a low-inflationary environment. The bank’s policy is based on Quantitative and Qualitative Easing (QQE), or printing notes to buy assets such as government or corporate bonds to provide liquidity. In 2016, the bank doubled down on its strategy and further loosened policy by first introducing negative interest rates and then directly controlling the yield of its 10-year government bonds. In March 2024, the BoJ lifted interest rates, effectively retreating from the ultra-loose monetary policy stance.
The Bank’s massive stimulus caused the Yen to depreciate against its main currency peers. This process exacerbated in 2022 and 2023 due to an increasing policy divergence between the Bank of Japan and other main central banks, which opted to increase interest rates sharply to fight decades-high levels of inflation. The BoJ’s policy led to a widening differential with other currencies, dragging down the value of the Yen. This trend partly reversed in 2024, when the BoJ decided to abandon its ultra-loose policy stance.
A weaker Yen and the spike in global energy prices led to an increase in Japanese inflation, which exceeded the BoJ’s 2% target. The prospect of rising salaries in the country – a key element fuelling inflation – also contributed to the move.
- The Pound Sterling clings to gains near 1.3400 against the US Dollar as the latter weakens after soft inflation data.
- A slight acceleration in the US core PCE inflation suggests that the Fed’s battle against inflation is not over yet.
- Investors await Fed Powell and BoE Greene’s speech.
The Pound Sterling (GBP) continues to hold gains near the round-level resistance of 1.3400 against the US Dollar (USD) in Monday’s London session. The outlook for the GBP/USD pair remains firm as the Greenback trades near yearly lows after data released on Friday showed that US inflation decelerated further in August. The US Dollar Index (DXY), which tracks the Greenback’s value against six major currencies, hovers near the key support of 100.20.
The Personal Consumption Expenditure Price Index (PCE) report showed that the annual inflation grew by 2.2%, slower than estimates of 2.3% and July’s reading of 2.5%. This slowdown in price pressures is likely welcome news for Federal Reserve (Fed) Chair Jerome Powell and his colleagues. However, a victory over inflation is still not a given as the core PCE price index – which excludes volatile food and energy prices and is the Federal Reserve’s (Fed) preferred inflation measure – rose accelerated to 2.7% from the prior release of 2.6%.
The decline in US inflation has increased market expectations for more interest rate cuts, but it appears insufficient to cement another 50 basis points (bps) decline as the Fed is now more vigilant to growing labor market risks and an economic slowdown.
This week, investors will focus on a slew of US economic data such as the ISM Manufacturing and Services PMIs, ADP Employment, and Nonfarm Payrolls (NFP) data for September and JOLTS Job Openings data for August, which will provide fresh cues on the current health of job market and the economy.
In Monday’s session, investors will pay attention to Jerome Powell’s speech at 17:00 GMT, who is expected to provide fresh interest rate guidance. Powell’s commentary could indicate whether the Fed will cut interest rates again by a larger-than-usual cut of 50 bps, as it did on September 18, or will shift to a gradual reduction of 25 bps.
Daily digest market movers: Pound Sterling underperforms against Asia-Pacific peers
- The Pound Sterling exhibits strength against its major peers, except Asia-Pacific currencies, at the start of the week. The British currency gains as investors expect that the pace and the depth of interest rate cuts by the Bank of England (BoE) to be lower than that of other central banks from Group of Seven (G-7) nations.
- Asia-Pacific currencies, such as the Australian Dollar (AUD) and the New Zealand Dollar (NZD), perform strongly after China’s cabinet announced on Sunday that they will focus on solving outstanding economic problems and strive to complete annual economic and social development goals, Reuters reported. The likelihood of an improvement in China’s economic prospects improves the appeal of Asia-Pacific currencies given that their nations are major trading partners of China.
- Financial market participants expect the BoE to cut interest rates one more time by 25 bps in one of the remaining two meetings this year. For fresh cues, investors will focus on BoE Megan Greene’s speech at 20:10 GMT, who is an external member of the nine-member-led Monetary Policy Committee (MPC). Greene voted to leave interest rates unchanged in the monetary policy meetings on September 19 and August 1.
- On the economic front, revised estimates of Q2 Gross Domestic Product (GDP) showed that the United Kingdom (UK) economy grew by 0.5%, slower than the flash reading of 0.6% on a quarterly basis. The annual Q2 GDP growth also came in lower at 0.7% from the preliminary estimate of 0.9%.
Technical Analysis: Pound Sterling turns sideways near 1.3400
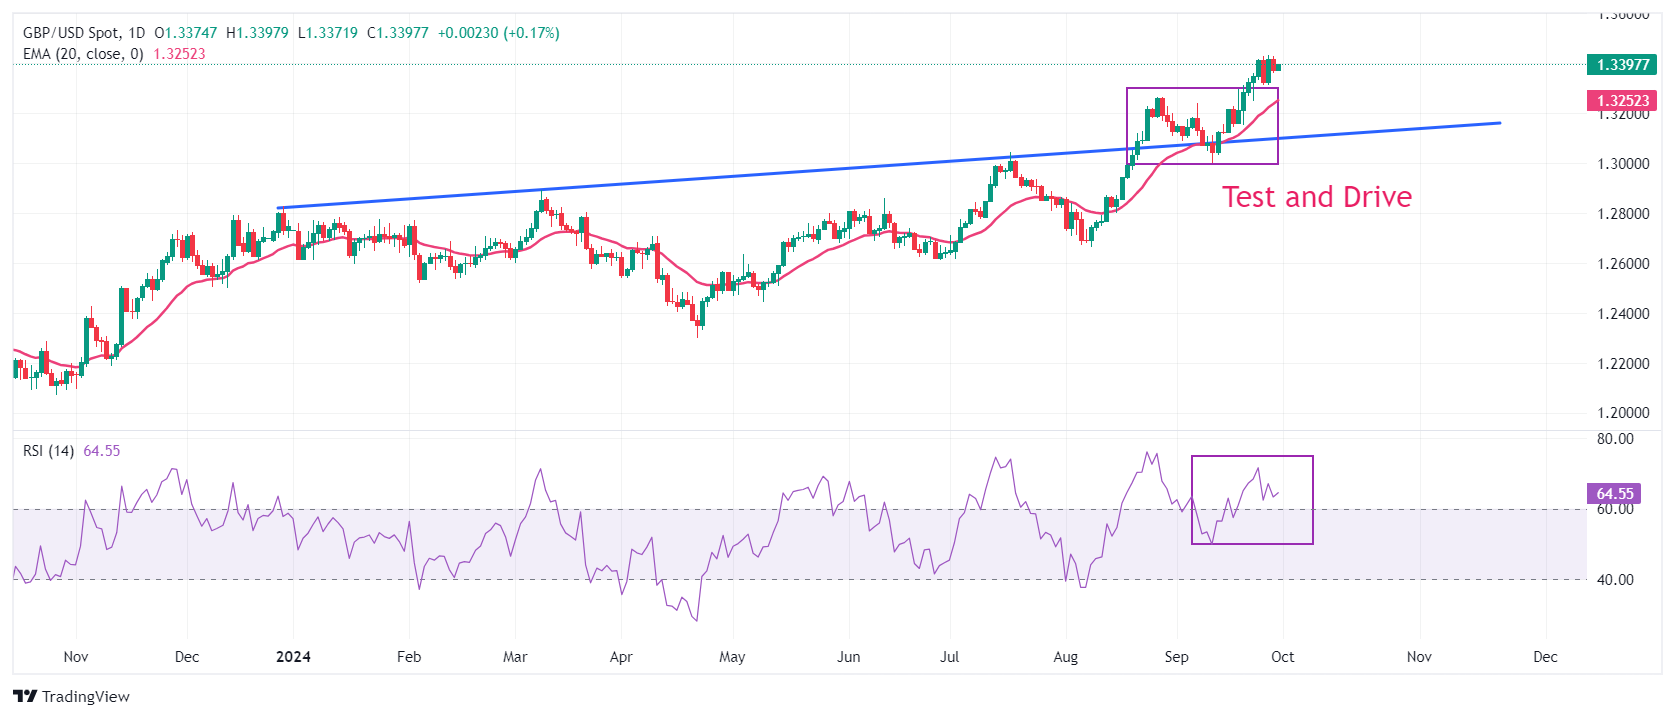
The Pound Sterling consolidates near the key resistance of 1.3400 against the US Dollar in European trading hours. The near-term outlook of the GBP/USD pair remains firm as the 20-day Exponential Moving Average (EMA) near 1.3250 is sloping higher.
Earlier in September, the Cable strengthened after recovering from a corrective move to near the trendline plotted from the December 28, 2023, high of 1.2828, from where it delivered a sharp increase after a breakout on August 21.
The 14-day Relative Strength Index (RSI) remains above 60.00, suggesting an active bullish momentum.
Looking up, the Cable will face resistance near the psychological level of 1.3500. On the downside, the 20-day EMA near 1.3235 will be the key support for Pound Sterling bulls.
Pound Sterling FAQs
The Pound Sterling (GBP) is the oldest currency in the world (886 AD) and the official currency of the United Kingdom. It is the fourth most traded unit for foreign exchange (FX) in the world, accounting for 12% of all transactions, averaging $630 billion a day, according to 2022 data. Its key trading pairs are GBP/USD, also known as ‘Cable’, which accounts for 11% of FX, GBP/JPY, or the ‘Dragon’ as it is known by traders (3%), and EUR/GBP (2%). The Pound Sterling is issued by the Bank of England (BoE).
The single most important factor influencing the value of the Pound Sterling is monetary policy decided by the Bank of England. The BoE bases its decisions on whether it has achieved its primary goal of “price stability” – a steady inflation rate of around 2%. Its primary tool for achieving this is the adjustment of interest rates. When inflation is too high, the BoE will try to rein it in by raising interest rates, making it more expensive for people and businesses to access credit. This is generally positive for GBP, as higher interest rates make the UK a more attractive place for global investors to park their money. When inflation falls too low it is a sign economic growth is slowing. In this scenario, the BoE will consider lowering interest rates to cheapen credit so businesses will borrow more to invest in growth-generating projects.
Data releases gauge the health of the economy and can impact the value of the Pound Sterling. Indicators such as GDP, Manufacturing and Services PMIs, and employment can all influence the direction of the GBP. A strong economy is good for Sterling. Not only does it attract more foreign investment but it may encourage the BoE to put up interest rates, which will directly strengthen GBP. Otherwise, if economic data is weak, the Pound Sterling is likely to fall.
Another significant data release for the Pound Sterling is the Trade Balance. This indicator measures the difference between what a country earns from its exports and what it spends on imports over a given period. If a country produces highly sought-after exports, its currency will benefit purely from the extra demand created from foreign buyers seeking to purchase these goods. Therefore, a positive net Trade Balance strengthens a currency and vice versa for a negative balance.
- Asian equities trades were mixed on Monday.
- Chinese stocks close sharply higher due to Beijing's stimulus measures.
- Nikkei was down over 4.80% after Ishiba won the LDP election.
Asian stock markets trade mixed on Monday. The Chinese stocks lead gains on more policy measures in China, while the concerns Japan's new Prime Minister favores normalizing interest rates weigh on Japanese stocks.
Traders continue to react to the additional stimulus measures from the People's Bank of China (PBoC) to spur growth in the world's second-largest economy. Meanwhile, China’s Shanghai Composite rose by 8.75% to 3,357.20. Meanwhile, the Shenzhen Component climbed by 10.88% to 10,550, and the Hang Seng Index was up by 3.97% to 21,450.
Data released on Monday showed that China’s NBS Manufacturing Purchasing Managers' Index (PMI) rose to 49.8 in September from 49.1 in August, above the market consensus of 49.5 in the reported month. The Non-Manufacturing PMI declined to 50.0 in September versus August’s 50.3 figure and the estimates of 50.4. Additionally, Caixin Manufacturing PMI declined to 49.3 in September after reporting 50.4 in August. Finally, Chinese Caixin Services PMI dropped sharply to 50.3 in September from 51.6 in August.
Japan’s major indices face a sell-off on the day after the prime minister election, with the Nikkei 225 falling by 4.80% to 37,919, while the broad-based Topix was down 3.63% to 2,641. Shigeru Ishiba said Japan's monetary policy needs to be normalized and that financial income tax should be increased.
On the Indian front, the Nifty 50 index declined by 1.02% to 25,912 and the BSE Sensex 30 fell 1.12% to 84,630. The Indian rupee has remained largely stable against the USD in the current calendar year (CY 2024), depreciating by just 0.59% so far.
On Friday, Chief Economic Advisor (CEA) V Anantha Nageswaran noted that the Indian economy is projected to grow at a rate of 6.5-7.0% in the current financial year on a steady-state basis.
AsianStocks FAQs
Asia contributes around 70% of global economic growth and hosts several key stock market indices. Among the region’s developed economies, the Japanese Nikkei – which represents 225 companies on the Tokyo stock exchange – and the South Korean Kospi stand out. China has three important indices: the Hong Kong Hang Seng, the Shanghai Composite and the Shenzhen Composite. As a big emerging economy, Indian equities are also catching the attention of investors, who increasingly invest in companies in the Sensex and Nifty indices.
Asia’s main economies are different, and each has specific sectors to pay attention to. Technology companies dominate in indices in Japan, South Korea, and increasingly, China. Financial services are leading stock markets such as Hong Kong or Singapore, considered key hubs for the sector. Manufacturing is also big in China and Japan, with a strong focus on automobile production or electronics. The growing middle class in countries like China and India is also giving more and more prominence to companies focused on retail and e-commerce.
Many different factors drive Asian stock market indices, but the main factor behind their performance is the aggregate results of the component companies revealed in their quarterly and annual earnings reports. The economic fundamentals of each country, as well as their central bank decisions or their government’s fiscal policies, are also important factors. More broadly, political stability, technological progress or the rule of law can also impact equity markets. The performance of US equity indices is also a factor as, more often than not, Asian markets take the lead from Wall Street stocks overnight. Finally, the broader risk sentiment in markets also plays a role as equities are considered a risky investment compared to other investment options such as fixed-income securities.
Investing in equities is risky by itself, but investing in Asian stocks comes along with region-specific risks to be taken into account. Asian countries have a wide range of political systems, from full democracies to dictatorships, so their political stability, transparency, rule of law or corporate governance requirements may diverge considerably. Geopolitical events such as trade disputes or territorial conflicts can lead to volatility in stock markets, as can natural disasters. Moreover, currency fluctuations can also have an impact on the valuation of Asian stock markets. This is particularly true in export-oriented economies, which tend to suffer from a stronger currency and benefit from a weaker one as their products become cheaper abroad.
Here is what you need to know on Monday, September 30:
The US Dollar (USD) struggles to find demand to start the last trading day of the third quarter. In the first half of the day on Monday, investors will pay close attention to Consumer Price Index data from Germany. Later in the American session, several Federal Reserve policymakers, including Chairman Jerome Powell, will be delivering speeches.
The USD Index turned south on Friday and touched its weakest level in over a year at 100.15, before staging a technical correction toward the end of the week. The US Bureau of Economic Analysis reported that the core Personal Consumption Expenditures (PCE) Price Index rose 0.1% on a monthly basis in August, at a softer pace than the market expectation of 0.2%. Early Monday, the USD Index stays below 100.50. Powell will participate in a moderated discussion titled "A View from the Federal Reserve Board" at the National Association for Business Economics Annual Meeting, in Nashville, starting at 17:00 GMT. Fed Governor Michelle Bowman is also scheduled to speak in the early American session. Meanwhile, US stock index futures trade marginally lower on the day.
US Dollar PRICE Last 7 days
The table below shows the percentage change of US Dollar (USD) against listed major currencies last 7 days. US Dollar was the weakest against the New Zealand Dollar.
| USD | EUR | GBP | JPY | CAD | AUD | NZD | CHF | |
|---|---|---|---|---|---|---|---|---|
| USD | -0.01% | -0.50% | -1.38% | -0.40% | -1.84% | -2.08% | -0.95% | |
| EUR | 0.01% | -0.55% | -1.33% | -0.37% | -1.88% | -2.05% | -0.95% | |
| GBP | 0.50% | 0.55% | -0.72% | 0.17% | -1.34% | -1.52% | -0.41% | |
| JPY | 1.38% | 1.33% | 0.72% | 1.00% | -0.55% | -0.69% | 0.32% | |
| CAD | 0.40% | 0.37% | -0.17% | -1.00% | -1.40% | -1.69% | -0.58% | |
| AUD | 1.84% | 1.88% | 1.34% | 0.55% | 1.40% | -0.16% | 0.95% | |
| NZD | 2.08% | 2.05% | 1.52% | 0.69% | 1.69% | 0.16% | 1.12% | |
| CHF | 0.95% | 0.95% | 0.41% | -0.32% | 0.58% | -0.95% | -1.12% |
The heat map shows percentage changes of major currencies against each other. The base currency is picked from the left column, while the quote currency is picked from the top row. For example, if you pick the US Dollar from the left column and move along the horizontal line to the Japanese Yen, the percentage change displayed in the box will represent USD (base)/JPY (quote).
The data from China showed on Monday that the Caixin Manufacturing PMI declined to 49.3 in September from 50.4 in August, while the Caixin Services PMI edged lower to 50.3 from 51.6. Over the weekend, Bloomberg reported that the People's Bank of China (PBOC) is planning to tell banks to lower mortgage rates for existing home loans before October 31 in its latest attempt to shore up the troubled property sector as the economy slows. In the meantime, ANZ Business Confidence Index in Australia improved to 60.9 in September from 50.6 in August. AUD/USD edged higher to start the new week and the pair was last seen trading at its highest level since February 2023 above 0.6900.
The UK's Office for National Statistics announced early Monday that it revised the annualized Gross Domestic Product (GDP) growth for the second quarter lower to 0.7% from the 0.9% reported in the advanced estimate. GBP/USD clings to modest daily gains, slightly below 1.3400 after this data.
After declining sharply and losing more than 1.5% on a daily basis on Friday, USD/JPY continues to inch lower toward 142.00 early Monday. Following reports from various Japanese media outlets over the weekend, Japan’s incoming Prime Minister (PM) Shigeru Ishiba proposed October 27 for a snap election. If a snap election is confirmed by end-October, the parliament will likely be dissolved by October 9.
EUR/USD stays relatively quiet in the early European session and fluctuates in a narrow channel above 1.1150.
After setting a new all-time high above $2,680 on Thursday, Gold registered modest losses on Friday. XAU/USD holds steady and trades in a tight range above $2,650 early Monday.
Fed FAQs
Monetary policy in the US is shaped by the Federal Reserve (Fed). The Fed has two mandates: to achieve price stability and foster full employment. Its primary tool to achieve these goals is by adjusting interest rates. When prices are rising too quickly and inflation is above the Fed’s 2% target, it raises interest rates, increasing borrowing costs throughout the economy. This results in a stronger US Dollar (USD) as it makes the US a more attractive place for international investors to park their money. When inflation falls below 2% or the Unemployment Rate is too high, the Fed may lower interest rates to encourage borrowing, which weighs on the Greenback.
The Federal Reserve (Fed) holds eight policy meetings a year, where the Federal Open Market Committee (FOMC) assesses economic conditions and makes monetary policy decisions. The FOMC is attended by twelve Fed officials – the seven members of the Board of Governors, the president of the Federal Reserve Bank of New York, and four of the remaining eleven regional Reserve Bank presidents, who serve one-year terms on a rotating basis.
In extreme situations, the Federal Reserve may resort to a policy named Quantitative Easing (QE). QE is the process by which the Fed substantially increases the flow of credit in a stuck financial system. It is a non-standard policy measure used during crises or when inflation is extremely low. It was the Fed’s weapon of choice during the Great Financial Crisis in 2008. It involves the Fed printing more Dollars and using them to buy high grade bonds from financial institutions. QE usually weakens the US Dollar.
Quantitative tightening (QT) is the reverse process of QE, whereby the Federal Reserve stops buying bonds from financial institutions and does not reinvest the principal from the bonds it holds maturing, to purchase new bonds. It is usually positive for the value of the US Dollar.
FX option expiries for Sept 30 NY cut at 10:00 Eastern Time, via DTCC, can be found below.
EUR/USD: EUR amounts
- 1.1125 813m
- 1.1200 1.1b
- 1.1260 780m
- 1.1300 761m
GBP/USD: GBP amounts
- 1.3220 528m
- 1.3370 824m
USD/JPY: USD amounts
- 144.00 1b
- 144.68 800m
- 145.00 1.7b
USD/CHF: USD amounts
- 0.8450 540m
- 0.8600 477m
AUD/USD: AUD amounts
- 0.6990 1.8b
EUR/GBP: EUR amounts
- 0.8300 575m
- EUR/GBP depreciates due to rising odds for the ECB’s interest rate cut in October.
- UK GDP rose by 0.5% QoQ in Q2, slightly below the expected and previous increase of 0.6%.
- The Pound Sterling is buoyed by expectations that the BoE will likely take a slower approach to rate cuts.
EUR/GBP retraces its recent gains from the previous session, trading around 0.8340 during the Asian hours on Monday. The currency cross remians tepid following the release of the Gross Domestic Product (GDP) data for the second quater from the United Kingdom (UK).
The UK Gross Domestic Product (GDP) grew by 0.5% quarter-over-quarter in the second quarter, slightly below the expected and previous increase of 0.6%. On an annual basis, GDP rose by 0.7%, also falling short of the forecasted and prior growth rate of 0.9%.
The EUR/GBP cross recieved downward pressure from the increasing odds of the European Central Bank (ECB) implementing another interest rate cut in October. Traders would likely observe a slew of economic releases from Germany scheduled to be released later in the day, including preliminary Consumer Price Index (CPI) data for September.
Additionally, lower-than-expected inflation in France and Spain has reinforced the likelihood of the third cut in the ECB's ongoing policy-easing cycle, which began in June. The ECB resumed cutting rates in September after holding them steady in July.
France's inflation grew by 1.5% year-over-year in September, significantly below the estimated 1.9% and down from the previous release of 2.2%. On a monthly basis, price pressures deflated at a sharp rate of 1.2%, exceeding expectations of a 0.8% decline. In Spain, the annual Harmonized Index of Consumer Prices (HICP) increased by 1.7% in September, lower than the forecasted 1.9% and a drop from August’s 2.4%. Month-on-month, the HICP fell by 0.1%, contrary to expectations for no change.
Interest rates FAQs
Interest rates are charged by financial institutions on loans to borrowers and are paid as interest to savers and depositors. They are influenced by base lending rates, which are set by central banks in response to changes in the economy. Central banks normally have a mandate to ensure price stability, which in most cases means targeting a core inflation rate of around 2%. If inflation falls below target the central bank may cut base lending rates, with a view to stimulating lending and boosting the economy. If inflation rises substantially above 2% it normally results in the central bank raising base lending rates in an attempt to lower inflation.
Higher interest rates generally help strengthen a country’s currency as they make it a more attractive place for global investors to park their money.
Higher interest rates overall weigh on the price of Gold because they increase the opportunity cost of holding Gold instead of investing in an interest-bearing asset or placing cash in the bank. If interest rates are high that usually pushes up the price of the US Dollar (USD), and since Gold is priced in Dollars, this has the effect of lowering the price of Gold.
The Fed funds rate is the overnight rate at which US banks lend to each other. It is the oft-quoted headline rate set by the Federal Reserve at its FOMC meetings. It is set as a range, for example 4.75%-5.00%, though the upper limit (in that case 5.00%) is the quoted figure. Market expectations for future Fed funds rate are tracked by the CME FedWatch tool, which shapes how many financial markets behave in anticipation of future Federal Reserve monetary policy decisions.
- USD/CHF holds positive ground near 0.8415 in Monday’s early European session.
- Rising bets of further jumbo Fed rate cuts and the ongoing geopolitical tensions in the Middle East might weigh on the pair.
- Traders brace for the Fed’s Chair Jerome Powell's speech on Monday.
The USD/CHF pair recovers to around 0.8415, snapping the two-day losing streak during the early European session on Monday. However, the upside of the pair might be limited amid the bets of more big rate cuts from the US Federal Reserve (Fed). Traders will take more cues from the Fed Chair Jerome Powell and Governor Michelle Bowman later on Monday.
Slowing Personal Consumption Expenditures (PCE) Price Index inflation data in August has prompted traders to bet the Fed to continue a fast pace of rate cuts as price pressures ease toward its 2% target. This, in turn, is likely to undermine the US Dollar (USD) in the near term. The CME FedWatch Tool showed that markets are pricing in nearly a 54% chance of a half-point cut in November, while the likelihood of a quarter-point cut stands at 46%.
Meanwhile, Israel expanded its attacks on Hezbollah in Lebanon and the Houthis in Yemen, raising fears of a regional war, as Hezbollah said it will continue to fight even as it faces growing losses in its senior ranks. Traders will closely watch the development surrounding geopolitical risks. Any signs of escalating tensions in the Middle East could boost the demand for safe-haven flows, benefitting the Swiss Franc (CHF).
The Swiss National Bank (SNB) decided to lower its borrowing costs last week, bringing its key interest rate down by 25 bps to 1.0%. “I expect another two 25bp moves in December and March at the very least, primarily because I don’t see any near-term sources of depreciation for the franc without a stronger stance on intervention from the SNB. We are heading back towards zero relatively quickly,” said Adrian Prettejohn, Europe economist at Capital Economics.
Swiss Franc FAQs
The Swiss Franc (CHF) is Switzerland’s official currency. It is among the top ten most traded currencies globally, reaching volumes that well exceed the size of the Swiss economy. Its value is determined by the broad market sentiment, the country’s economic health or action taken by the Swiss National Bank (SNB), among other factors. Between 2011 and 2015, the Swiss Franc was pegged to the Euro (EUR). The peg was abruptly removed, resulting in a more than 20% increase in the Franc’s value, causing a turmoil in markets. Even though the peg isn’t in force anymore, CHF fortunes tend to be highly correlated with the Euro ones due to the high dependency of the Swiss economy on the neighboring Eurozone.
The Swiss Franc (CHF) is considered a safe-haven asset, or a currency that investors tend to buy in times of market stress. This is due to the perceived status of Switzerland in the world: a stable economy, a strong export sector, big central bank reserves or a longstanding political stance towards neutrality in global conflicts make the country’s currency a good choice for investors fleeing from risks. Turbulent times are likely to strengthen CHF value against other currencies that are seen as more risky to invest in.
The Swiss National Bank (SNB) meets four times a year – once every quarter, less than other major central banks – to decide on monetary policy. The bank aims for an annual inflation rate of less than 2%. When inflation is above target or forecasted to be above target in the foreseeable future, the bank will attempt to tame price growth by raising its policy rate. Higher interest rates are generally positive for the Swiss Franc (CHF) as they lead to higher yields, making the country a more attractive place for investors. On the contrary, lower interest rates tend to weaken CHF.
Macroeconomic data releases in Switzerland are key to assessing the state of the economy and can impact the Swiss Franc’s (CHF) valuation. The Swiss economy is broadly stable, but any sudden change in economic growth, inflation, current account or the central bank’s currency reserves have the potential to trigger moves in CHF. Generally, high economic growth, low unemployment and high confidence are good for CHF. Conversely, if economic data points to weakening momentum, CHF is likely to depreciate.
As a small and open economy, Switzerland is heavily dependent on the health of the neighboring Eurozone economies. The broader European Union is Switzerland’s main economic partner and a key political ally, so macroeconomic and monetary policy stability in the Eurozone is essential for Switzerland and, thus, for the Swiss Franc (CHF). With such dependency, some models suggest that the correlation between the fortunes of the Euro (EUR) and the CHF is more than 90%, or close to perfect.
Following reports from various Japanese media outlets over the weekend, Japan’s incoming Prime Minister (PM) Shigeru Ishiba proposed October 27 for a snap election.
If a snap election is confirmed by end-October, the parliament will likely be dissolved by October 9.
Ishiba will be sworn in as prime minister on Tuesday and is expected to reshuffle the Cabinet positions ahead of the snap election.
Market reaction
USD/JPY is seeing a fresh bout of selling on the above headlines, falling 0.34% on the day to 141.70, as of writing .
- The Japanese Yen weakened as upcoming PM Shigeru Ishiba said that the monetary policy should continue to be accommodative.
- Japan's Retail Trade rose by 2.8% YoY in August, surpassing the expected 2.3% rise.
- August’s US Core PCE Price Index MoM has reinforced the possibility of an aggressive Fed rate-cutting cycle.
The Japanese Yen (JPY) edges lower against the US Dollar (USD) on Monday after dovish comments from Japan's upcoming Prime Minister, former Defense Chief Shigeru Ishiba. Ishiba stated on Sunday that the country's monetary policy should continue to be accommodative, indicating the necessity of maintaining low borrowing costs to support a fragile economic recovery, according to The Japan Times.
Japan's Retail Trade increased by 2.8% year-on-year in August, surpassing market expectations of 2.3% and slightly exceeding the upwardly revised 2.7% rise from the previous month. On a month-over-month basis, seasonally adjusted Retail Trade rose by 0.8%, marking the largest increase in three months, following a 0.2% gain in July.
The US Dollar received downward pressure following Friday’s US Core Personal Consumption Expenditures (PCE) Price Index data for August, which aligns with the US Federal Reserve's (Fed) inflation outlook. This has reinforced the possibility of an aggressive rate-cutting cycle by the central bank.
The CME FedWatch Tool indicates that markets are assigning a 42.9% probability to a 25 basis point rate cut by the Federal Reserve in November, while the likelihood of a 50-basis-point increased to 57.1%, up from 50.4% a week ago.
Daily Digest Market Movers: Japanese Yen receives downward pressure from doubts over BoJ policy outlook
- Japan's Chief Cabinet Secretary, Yoshimasa Hayashi, refrained from commenting on Monday's daily stock market fluctuations. Hayashi emphasized the importance of closely monitoring the economic and financial situation both domestically and internationally with a sense of urgency. He also noted the need for ongoing collaboration with the Bank of Japan.
- St. Louis Federal Reserve President Alberto Musalem stated on Friday, according to the Financial Times, that the Fed should begin cutting interest rates "gradually" following a larger-than-usual half-point reduction at the September meeting. Musalem acknowledged the possibility of the economy weakening more than anticipated, saying, "If that were the case, then a faster pace of rate reductions might be appropriate."
- The US Core Personal Consumption Expenditures (PCE) Price Index for August increased by 0.1% month-over-month, falling short of market expectations of a 0.2% rise and lower than the previous 0.2% increase. Meanwhile, the Core PCE on a year-over-year basis rose by 2.7%, matching expectations and slightly above the prior reading of 2.6%.
- The Tokyo Consumer Price Index (CPI) increased 2.2% year-over-year in September, down from a 2.6% rise in August. Meanwhile, the CPI excluding fresh food and energy climbed 1.6% YoY in September, unchanged from the previous reading. The CPI excluding fresh food increased 2.0% as expected, compared to the previous rise of 2.4%.
- US Gross Domestic Product Annualized increased at a rate of 3.0% in the second quarter, as previously estimated, according to the US Bureau of Economic Analysis (BEA) on Thursday. Meanwhile, the GDP Price Index rose 2.5% in the second quarter.
- On Thursday, the BoJ Monetary Policy Meeting Minutes expressed the members’ consensus on the importance of remaining vigilant regarding the risks of inflation exceeding targets. Several members indicated that raising rates to 0.25% would be suitable as a way to adjust the level of monetary support. A few others suggested that a moderate adjustment to monetary support would also be appropriate.
- Last week, BoJ Governor Kazuo Ueda indicated that the central bank has time to evaluate market and economic conditions before making any policy adjustments, signaling that there is no urgency to raise interest rates again. Ueda also noted that Japan's real interest rate remains deeply negative, which is helping to stimulate the economy and drive up prices.
Technical Analysis: USD/JPY remains above 142.00 after breaking below the ascending channel
USD/JPY trades around 142.20 on Monday. Analysis of the daily chart indicates that the pair has broken below the ascending channel pattern, signaling a momentum shift from a bullish to a bearish bias. Furthermore, the 14-day Relative Strength Index (RSI) is situated below the 50 level, indicating a bearish sentiment is in play.
In terms of support, the USD/JPY pair may navigate around the 139.58 region, the lowest point since June 2023.
On the upside, a return to the ascending channel could weaken the bearish case and lead the USD/JPY pair to test the nine-day Exponential Moving Average (EMA) at the 143.10 level. A break above this level could support the pair to test the upper boundary of the ascending channel at 146.20 level, followed by its five-week high of 147.21 level, which was recorded on September 3.
USD/JPY: Daily Chart
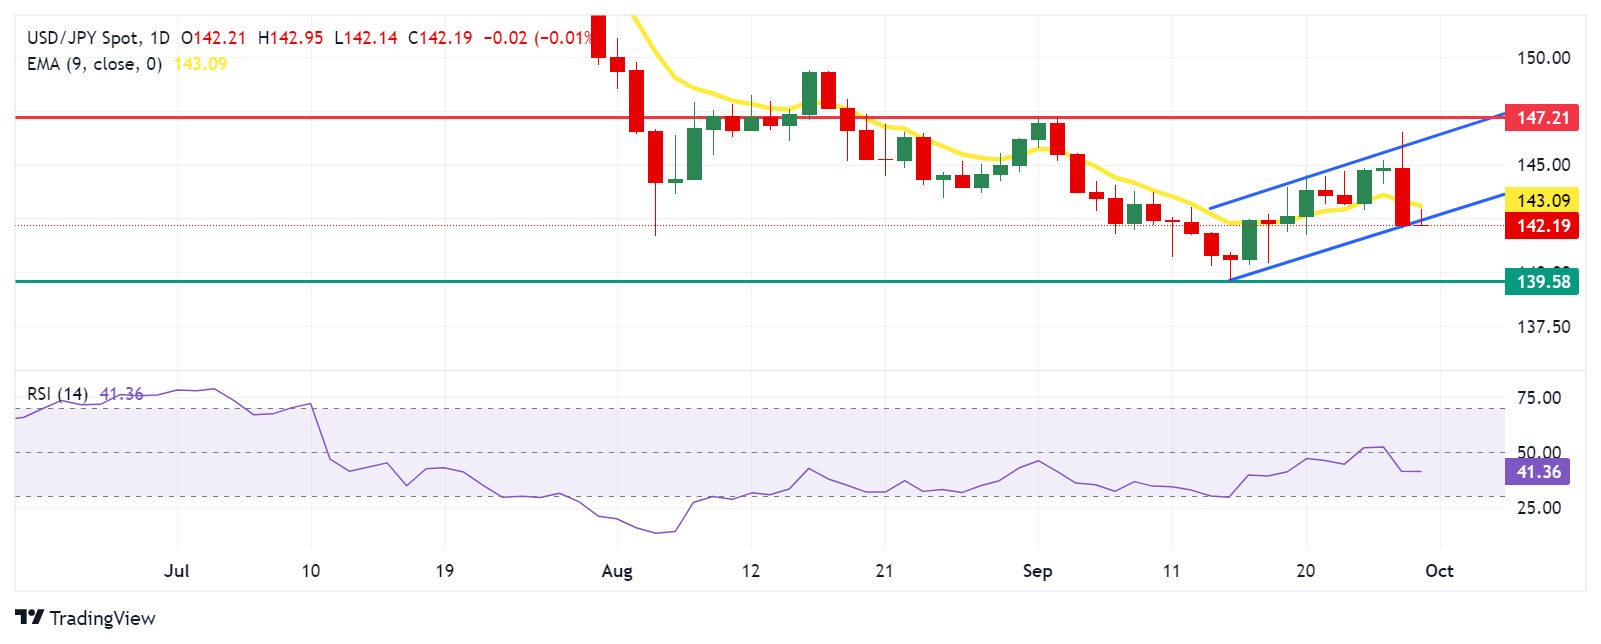
Japanese Yen PRICE Today
The table below shows the percentage change of Japanese Yen (JPY) against listed major currencies today. Japanese Yen was the weakest against the Australian Dollar.
| USD | EUR | GBP | JPY | CAD | AUD | NZD | CHF | |
|---|---|---|---|---|---|---|---|---|
| USD | 0.01% | -0.13% | -0.16% | -0.04% | -0.51% | -0.60% | -0.04% | |
| EUR | -0.01% | -0.13% | -0.16% | -0.03% | -0.46% | -0.58% | 0.03% | |
| GBP | 0.13% | 0.13% | 0.10% | 0.10% | -0.33% | -0.45% | 0.15% | |
| JPY | 0.16% | 0.16% | -0.10% | 0.15% | -0.43% | -0.43% | 0.15% | |
| CAD | 0.04% | 0.03% | -0.10% | -0.15% | -0.42% | -0.55% | 0.05% | |
| AUD | 0.51% | 0.46% | 0.33% | 0.43% | 0.42% | -0.12% | 0.48% | |
| NZD | 0.60% | 0.58% | 0.45% | 0.43% | 0.55% | 0.12% | 0.58% | |
| CHF | 0.04% | -0.03% | -0.15% | -0.15% | -0.05% | -0.48% | -0.58% |
The heat map shows percentage changes of major currencies against each other. The base currency is picked from the left column, while the quote currency is picked from the top row. For example, if you pick the Japanese Yen from the left column and move along the horizontal line to the US Dollar, the percentage change displayed in the box will represent JPY (base)/USD (quote).
Japanese Yen FAQs
The Japanese Yen (JPY) is one of the world’s most traded currencies. Its value is broadly determined by the performance of the Japanese economy, but more specifically by the Bank of Japan’s policy, the differential between Japanese and US bond yields, or risk sentiment among traders, among other factors.
One of the Bank of Japan’s mandates is currency control, so its moves are key for the Yen. The BoJ has directly intervened in currency markets sometimes, generally to lower the value of the Yen, although it refrains from doing it often due to political concerns of its main trading partners. The current BoJ ultra-loose monetary policy, based on massive stimulus to the economy, has caused the Yen to depreciate against its main currency peers. This process has exacerbated more recently due to an increasing policy divergence between the Bank of Japan and other main central banks, which have opted to increase interest rates sharply to fight decades-high levels of inflation.
The BoJ’s stance of sticking to ultra-loose monetary policy has led to a widening policy divergence with other central banks, particularly with the US Federal Reserve. This supports a widening of the differential between the 10-year US and Japanese bonds, which favors the US Dollar against the Japanese Yen.
The Japanese Yen is often seen as a safe-haven investment. This means that in times of market stress, investors are more likely to put their money in the Japanese currency due to its supposed reliability and stability. Turbulent times are likely to strengthen the Yen’s value against other currencies seen as more risky to invest in.
- Silver price loses ground for the second consecutive day around $31.55 in Monday’s early Asian session.
- The upbeat mood weighs on the white metal price.
- Chinese stimulus measures and the expectation of a large US rate cut might cap the downside for Silver.
Silver Price (XAG/USD) attracts some sellers to near $31.55 during the early Asian session on Monday. The improved risk sentiment in global markets triggers some profit-taking in the white metal. Traders will keep an eye on US Federal Reserve (Fed) Chair Jerome Powell's speech later on Monday.
The upbeat mood could exert some selling pressure on the white metal as traders await the fresh catalysts. The Fed Chair Jerome Powell's speech might offer some hints about the US interest rate outlook for this year.
The People's Bank of China (PBoC) Governor Pan Gongsheng announced new stimulus measures to revive a flagging property sector and low domestic demand in the country. Also, the PBoC stated the central bank would reduce the amount of reserves banks are required to keep. “Silver is going to continue to rally over the coming quarters because of the consecutive rate cuts and as China’s stimulus could continue for some time,” said Amelia Xiao Fu, head of commodity markets at BOCI.
Additionally, hopes of another large US rate cut provide some support to the Silver price. According to the CME FedWatch Tool, Interest rate futures contracts have priced in a nearly 54% odds of a half-point cut in November, while the possibility of a quarter-point cut stands at 46%.
Meanwhile, Israel’s killing of Hezbollah leader Hassan Nasrallah has further fuelled geopolitical tensions in the Middle East and intensified the war at its border with Lebanon. The Iran-backed militant group says it will continue to fight, even as a growing number of senior Hezbollah figures have been killed, per CNN. The rising geopolitical tensions in the Middle East could boost XAG/USD.
Silver FAQs
Silver is a precious metal highly traded among investors. It has been historically used as a store of value and a medium of exchange. Although less popular than Gold, traders may turn to Silver to diversify their investment portfolio, for its intrinsic value or as a potential hedge during high-inflation periods. Investors can buy physical Silver, in coins or in bars, or trade it through vehicles such as Exchange Traded Funds, which track its price on international markets.
Silver prices can move due to a wide range of factors. Geopolitical instability or fears of a deep recession can make Silver price escalate due to its safe-haven status, although to a lesser extent than Gold's. As a yieldless asset, Silver tends to rise with lower interest rates. Its moves also depend on how the US Dollar (USD) behaves as the asset is priced in dollars (XAG/USD). A strong Dollar tends to keep the price of Silver at bay, whereas a weaker Dollar is likely to propel prices up. Other factors such as investment demand, mining supply – Silver is much more abundant than Gold – and recycling rates can also affect prices.
Silver is widely used in industry, particularly in sectors such as electronics or solar energy, as it has one of the highest electric conductivity of all metals – more than Copper and Gold. A surge in demand can increase prices, while a decline tends to lower them. Dynamics in the US, Chinese and Indian economies can also contribute to price swings: for the US and particularly China, their big industrial sectors use Silver in various processes; in India, consumers’ demand for the precious metal for jewellery also plays a key role in setting prices.
Silver prices tend to follow Gold's moves. When Gold prices rise, Silver typically follows suit, as their status as safe-haven assets is similar. The Gold/Silver ratio, which shows the number of ounces of Silver needed to equal the value of one ounce of Gold, may help to determine the relative valuation between both metals. Some investors may consider a high ratio as an indicator that Silver is undervalued, or Gold is overvalued. On the contrary, a low ratio might suggest that Gold is undervalued relative to Silver.
- EUR/USD lacks any firm intraday direction and remains confined in a multi-day-old range.
- The mixed technical setup warrants caution before positioning for the near-term trajectory.
- Traders look to the flash German CPI for some impetus ahead of Fed Chair Powell’s speech.
The EUR/USD pair struggles to capitalize on Friday's modest rebound from the 1.1125-1.1120 support area and kicks off the new week on a subdued note. Spot prices currently trade around the 1.1160 area, nearly unchanged for the day, as traders keenly await the release of the flash German consumer inflation figures and the Federal Reserve (Fed) Chair Jerome Powell's speech for some fresh impetus.
From a technical perspective, the EUR/USD pair remains confined in a multi-day-old trading band. Against the backdrop of the recovery from the 1.1000 psychological mark, or the monthly low, this range-bounce price action might be categorized as a bullish consolidation phase. This, along with positive oscillators on the daily chart, suggests that the path of least resistance for spot prices remains to the upside.
That said, the recent repeated failures to build on the momentum or find acceptance above the 1.1200 round figure constitute the formation of a bearish double-top pattern and warrant some caution for bullish traders. This makes it prudent to wait for a sustained breakout through the aforementioned short-term trading range before confirming and positioning for the next leg of a directional move for the EUR/USD pair.
In the meantime, the 1.1200 mark might continue to act as an immediate hurdle ahead of the 1.1215 region, or a 14-month peak touched last Wednesday. Some follow-through buying will be seen as a fresh trigger for bulls and lift the EUR/USD pair to the 1.1275 region, or the July 2023 high. The momentum could extend beyond the 1.1300 mark, towards the 1.1335 region en route to the 1.1375 area and the 1.1400 round figure.
On the flip side, weakness below the 1.1125-1.1120 immediate support could drag the EUR/USD pair below the 1.1100 mark, towards testing last week's swing low, around the 1.1085-1.1080 zone. The subsequent fall could expose the 50-day Simple Moving Average (SMA), near the 1.1030 zone before spot prices eventually drop to the 1.1000 mark, which if broken will shift the near-term bias in favor of bearish traders.
EUR/USD daily chart
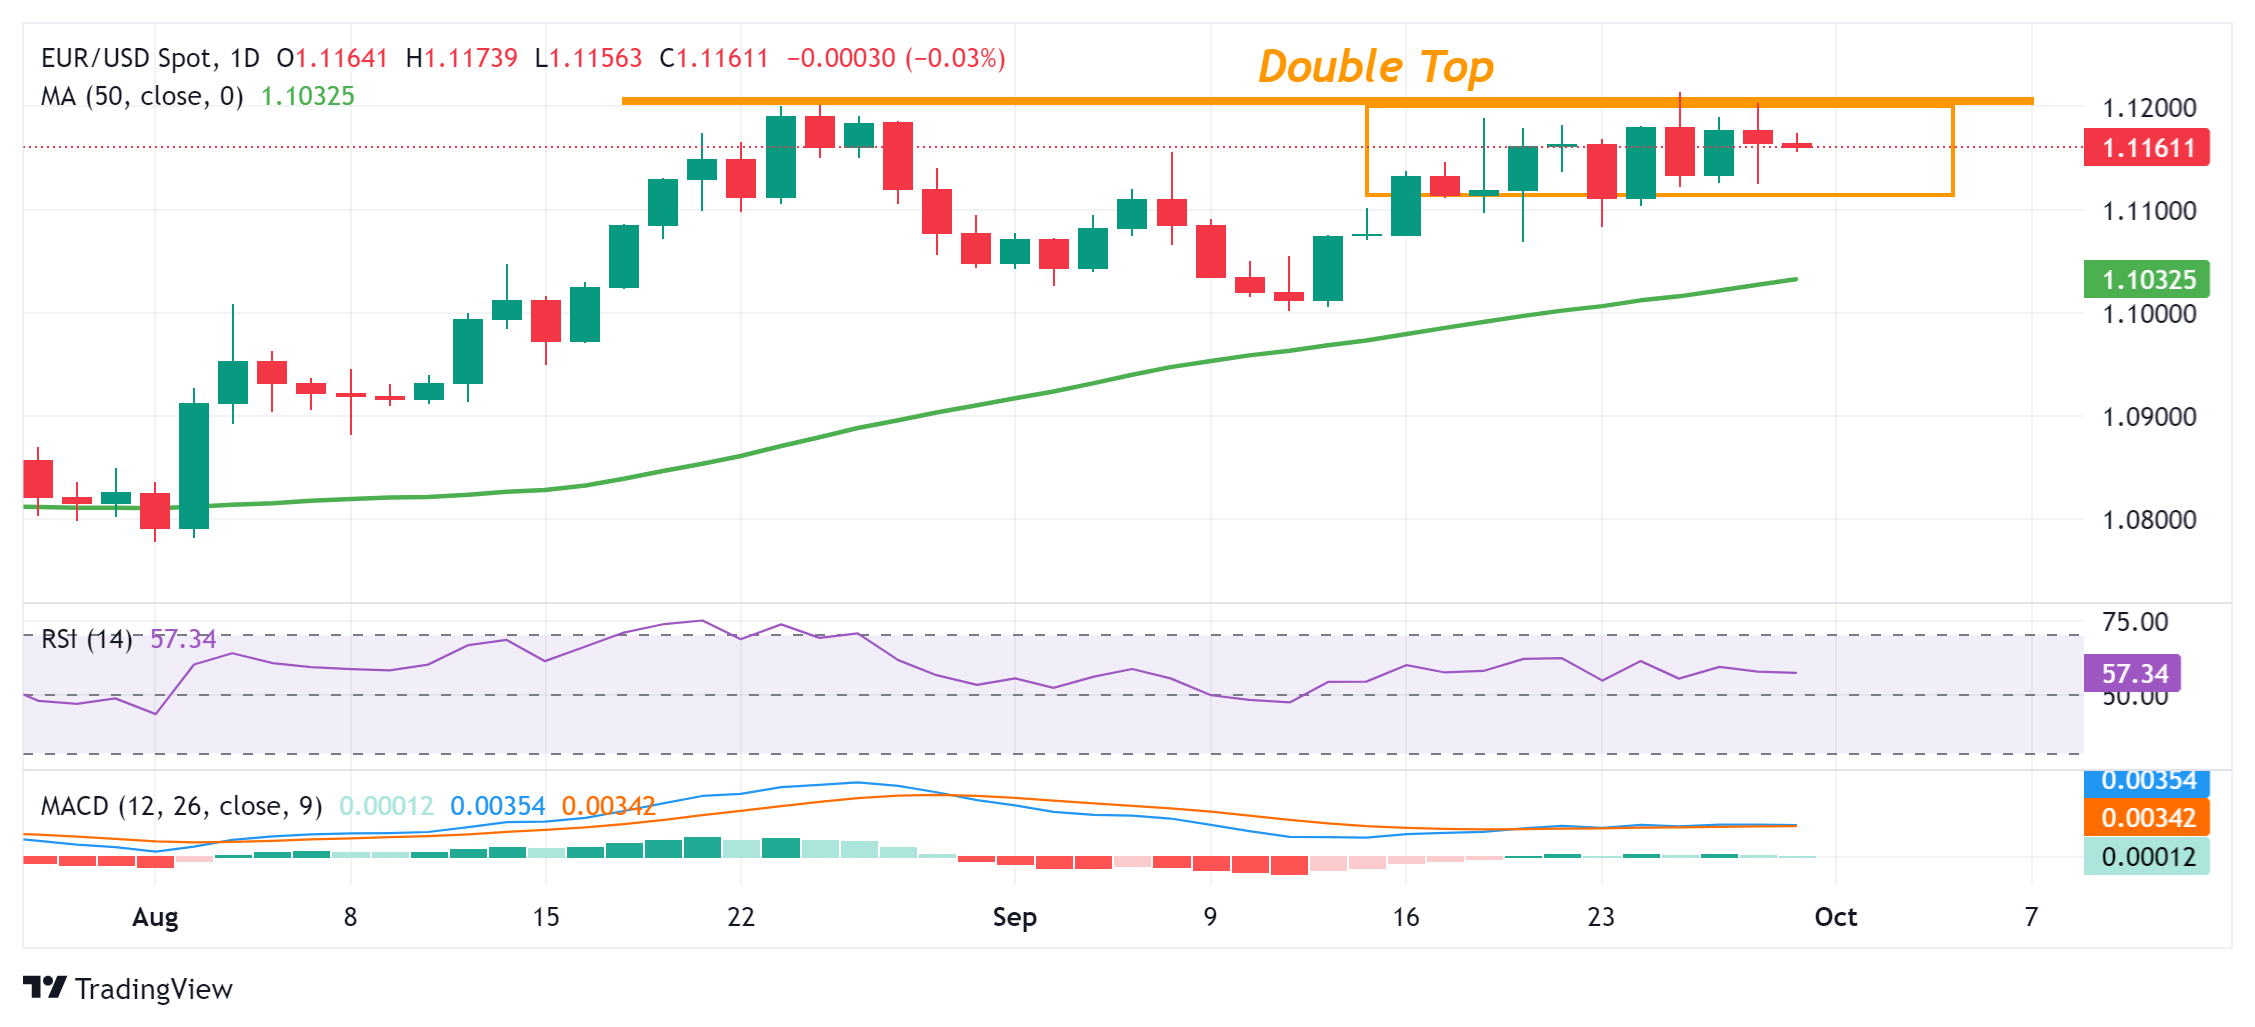
Economic Indicator
Consumer Price Index (YoY)
The Consumer Price Index (CPI), released by the German statistics office Destatis on a monthly basis, measures the average price change for all goods and services purchased by households for consumption purposes. The CPI is the main indicator to measure inflation and changes in purchasing trends. The YoY reading compares prices in the reference month to a year earlier. Generally, a high reading is bullish for the Euro (EUR), while a low reading is bearish.
Read more.Next release: Mon Sep 30, 2024 12:00 (Prel)
Frequency: Monthly
Consensus: -
Previous: 1.9%
Gold prices fell in India on Monday, according to data compiled by FXStreet.
The price for Gold stood at 7,148.65 Indian Rupees (INR) per gram, down compared with the INR 7,161.77 it cost on Friday.
The price for Gold decreased to INR 83,378.20 per tola from INR 83,533.42 per tola on friday.
| Unit measure | Gold Price in INR |
|---|---|
| 1 Gram | 7,148.65 |
| 10 Grams | 71,483.23 |
| Tola | 83,378.20 |
| Troy Ounce | 222,347.90 |
FXStreet calculates Gold prices in India by adapting international prices (USD/INR) to the local currency and measurement units. Prices are updated daily based on the market rates taken at the time of publication. Prices are just for reference and local rates could diverge slightly.
Gold FAQs
Gold has played a key role in human’s history as it has been widely used as a store of value and medium of exchange. Currently, apart from its shine and usage for jewelry, the precious metal is widely seen as a safe-haven asset, meaning that it is considered a good investment during turbulent times. Gold is also widely seen as a hedge against inflation and against depreciating currencies as it doesn’t rely on any specific issuer or government.
Central banks are the biggest Gold holders. In their aim to support their currencies in turbulent times, central banks tend to diversify their reserves and buy Gold to improve the perceived strength of the economy and the currency. High Gold reserves can be a source of trust for a country’s solvency. Central banks added 1,136 tonnes of Gold worth around $70 billion to their reserves in 2022, according to data from the World Gold Council. This is the highest yearly purchase since records began. Central banks from emerging economies such as China, India and Turkey are quickly increasing their Gold reserves.
Gold has an inverse correlation with the US Dollar and US Treasuries, which are both major reserve and safe-haven assets. When the Dollar depreciates, Gold tends to rise, enabling investors and central banks to diversify their assets in turbulent times. Gold is also inversely correlated with risk assets. A rally in the stock market tends to weaken Gold price, while sell-offs in riskier markets tend to favor the precious metal.
The price can move due to a wide range of factors. Geopolitical instability or fears of a deep recession can quickly make Gold price escalate due to its safe-haven status. As a yield-less asset, Gold tends to rise with lower interest rates, while higher cost of money usually weighs down on the yellow metal. Still, most moves depend on how the US Dollar (USD) behaves as the asset is priced in dollars (XAU/USD). A strong Dollar tends to keep the price of Gold controlled, whereas a weaker Dollar is likely to push Gold prices up.
(An automation tool was used in creating this post.)
- USD/CAD seesaws between tepid gains/minor losses amid mixed fundamental cues.
- A modest USD uptick lends support amid bets for a larger interest rate cut by the BoC.
- Dovish Fed expectations and a positive risk tone cap gains for the USD and the major.
The USD/CAD pair kicks off the new week on a subdued note and oscillates in a narrow band, above the 1.3500 psychological mark through the Asian session. The mixed fundamental backdrop, meanwhile, warrants some caution before positioning for a firm near-term direction and extension of the pair's goodish rebound from the 1.3420 area, or the lowest level since March 8 touched last week.
The US Dollar (USD) attracts some haven flows amid the risk of a further escalation of geopolitical tensions in the Middle East. The Canadian Dollar (CAD), on the other hand, is weighed down by bet for a bigger interest rate cut by the Bank of Canada (BoC). This, in turn, acts as a tailwind for the USD/CAD pair, though a combination of factors hold back traders from placing fresh bullish bets and caps the upside.
The global risk sentiment gets an additional boost in reaction to more stimulus announced by China over the weekend. This, along with expectations for a more aggressive policy easing by the Federal Reserve (Fed), keeps a lid on any meaningful upside for the safe-haven buck and the USD/CAD pair. In fact, the markets are pricing in a greater chance of another oversized rate cut by the Fed at its November meeting.
Meanwhile, the possibility of a widening Middle East conflict, to a larger extent, overshadows worries about slowing demand in China – the world's top oil importer – and lends support to Crude Oil prices. This, in turn, is seen underpinning the commodity-linked Loonie and contributing to capping the USD/CAD pair as traders now look to Fed Chair Jerome Powell's speech for a fresh impetus later during the US session.
Canadian Dollar FAQs
The key factors driving the Canadian Dollar (CAD) are the level of interest rates set by the Bank of Canada (BoC), the price of Oil, Canada’s largest export, the health of its economy, inflation and the Trade Balance, which is the difference between the value of Canada’s exports versus its imports. Other factors include market sentiment – whether investors are taking on more risky assets (risk-on) or seeking safe-havens (risk-off) – with risk-on being CAD-positive. As its largest trading partner, the health of the US economy is also a key factor influencing the Canadian Dollar.
The Bank of Canada (BoC) has a significant influence on the Canadian Dollar by setting the level of interest rates that banks can lend to one another. This influences the level of interest rates for everyone. The main goal of the BoC is to maintain inflation at 1-3% by adjusting interest rates up or down. Relatively higher interest rates tend to be positive for the CAD. The Bank of Canada can also use quantitative easing and tightening to influence credit conditions, with the former CAD-negative and the latter CAD-positive.
The price of Oil is a key factor impacting the value of the Canadian Dollar. Petroleum is Canada’s biggest export, so Oil price tends to have an immediate impact on the CAD value. Generally, if Oil price rises CAD also goes up, as aggregate demand for the currency increases. The opposite is the case if the price of Oil falls. Higher Oil prices also tend to result in a greater likelihood of a positive Trade Balance, which is also supportive of the CAD.
While inflation had always traditionally been thought of as a negative factor for a currency since it lowers the value of money, the opposite has actually been the case in modern times with the relaxation of cross-border capital controls. Higher inflation tends to lead central banks to put up interest rates which attracts more capital inflows from global investors seeking a lucrative place to keep their money. This increases demand for the local currency, which in Canada’s case is the Canadian Dollar.
Macroeconomic data releases gauge the health of the economy and can have an impact on the Canadian Dollar. Indicators such as GDP, Manufacturing and Services PMIs, employment, and consumer sentiment surveys can all influence the direction of the CAD. A strong economy is good for the Canadian Dollar. Not only does it attract more foreign investment but it may encourage the Bank of Canada to put up interest rates, leading to a stronger currency. If economic data is weak, however, the CAD is likely to fall.
- WTI price may appreciate amid rising supply fears following recent Israel's attacks on Iranian-backed militant groups.
- The escalation of attacks in the Middle East is increasing the likelihood of Iran involving directly in the conflict.
- Oil prices might have received downward pressure following the mixed Manufacturing PMI data from China.
West Texas Intermediate (WTI) Oil price holds its position around $69.20 per barrel during Monday’s Asian hours. However, crude Oil prices could appreciate amid growing concerns about potential supply disruptions from the Middle East following Israel's intensified attacks on Iranian-backed militant groups Hezbollah and the Houthis. These geopolitical tensions may lead to fears of instability in the region, potentially impacting Oil supply and driving prices higher.
Reuters reports that ANZ Research has noted that the recent escalation of attacks in the Middle East is raising the likelihood of Iran, a significant producer and member of the Organization of the Petroleum Exporting Countries (OPEC), becoming directly involved in the conflict.
Israel announced it bombed Houthi targets in Yemen on Sunday, broadening its confrontation with Iran's allies. This action follows the killing of Hezbollah leader Sayyed Hassan Nasrallah two days earlier, intensifying the ongoing conflict in Lebanon.
Oil prices might have received downward pressure following the mixed Manufacturing Purchasing Managers’ Index (PMI) data from the world’s largest crude importer China. China's Caixin Manufacturing Purchasing Managers' Index (PMI) fell to 49.3 in September, indicating contraction, down from 50.4 in August. China’s NBS Manufacturing Purchasing Managers' Index (PMI) improved to 49.8 in September, up from 49.1 in the previous month and surpassing the market consensus of 49.5.
Additionally, Oil traders are closely monitoring recent monetary measures in China aimed at stimulating economic activity and boosting energy demand. Last week, China announced to inject over CNY 1 trillion in capital into its largest state banks, facing multiple challenges. This substantial capital infusion would mark the first of its kind since the 2008 global financial crisis.
However, crude Oil prices may face challenges from Saudi Arabia's plans to increase production later this year, alongside OPEC+'s decision to raise output by 180,000 barrels per day in December. A report from the Financial Times, citing unnamed sources familiar with the country's plans, indicated that Saudi Arabia is committed to resuming production on December 1, even if it results in a period of lower prices.
WTI Oil FAQs
WTI Oil is a type of Crude Oil sold on international markets. The WTI stands for West Texas Intermediate, one of three major types including Brent and Dubai Crude. WTI is also referred to as “light” and “sweet” because of its relatively low gravity and sulfur content respectively. It is considered a high quality Oil that is easily refined. It is sourced in the United States and distributed via the Cushing hub, which is considered “The Pipeline Crossroads of the World”. It is a benchmark for the Oil market and WTI price is frequently quoted in the media.
Like all assets, supply and demand are the key drivers of WTI Oil price. As such, global growth can be a driver of increased demand and vice versa for weak global growth. Political instability, wars, and sanctions can disrupt supply and impact prices. The decisions of OPEC, a group of major Oil-producing countries, is another key driver of price. The value of the US Dollar influences the price of WTI Crude Oil, since Oil is predominantly traded in US Dollars, thus a weaker US Dollar can make Oil more affordable and vice versa.
The weekly Oil inventory reports published by the American Petroleum Institute (API) and the Energy Information Agency (EIA) impact the price of WTI Oil. Changes in inventories reflect fluctuating supply and demand. If the data shows a drop in inventories it can indicate increased demand, pushing up Oil price. Higher inventories can reflect increased supply, pushing down prices. API’s report is published every Tuesday and EIA’s the day after. Their results are usually similar, falling within 1% of each other 75% of the time. The EIA data is considered more reliable, since it is a government agency.
OPEC (Organization of the Petroleum Exporting Countries) is a group of 13 Oil-producing nations who collectively decide production quotas for member countries at twice-yearly meetings. Their decisions often impact WTI Oil prices. When OPEC decides to lower quotas, it can tighten supply, pushing up Oil prices. When OPEC increases production, it has the opposite effect. OPEC+ refers to an expanded group that includes ten extra non-OPEC members, the most notable of which is Russia.
- NZD/USD hits a fresh YTD peak on Monday amid optimism over more stimulus from China.
- Geopolitical risks lend some support to the safe-haven buck and act as a headwind for the pair.
- Traders look forward to the Fed Chair Jerome Powell’s speech to grab short-term opportunities.
The NZD/USD pair attracts some buyers for the third successive day and climbs to a fresh year-to-date (YTD) peak, around the 0.6375 region during the Asian session on Monday.
Against the backdrop of a slew of stimulus measures announced last week, the People's Bank of China (PBOC) said on Sunday that it would tell banks to lower mortgage rates for existing home loans before October 31. The move provides an additional boost to the already upbeat market mood and turns out to be a key factor benefiting the risk-sensitive Kiwi. Apart from this, subdued US Dollar (USD) price action, amid dovish Federal Reserve (Fed) expectations, further seems to act as a tailwind for the NZD/USD pair.
According to the CME Group's FedWatch Tool, the markets are currently pricing in over a 50% chance of another oversized interest rate cut by the US central bank in November. This keeps the USD Index (DXY), which tracks the Greenback against a basket of currencies, near its lowest level since July 2023 touched last week. That said, the risk of a further escalation of conflict in the Middle East and an out-out war in the region seems to underpin the safe-haven buck, capping the upside for the NZD/USD pair.
Meanwhile, the mixed PMI prints released from China earlier today do little to impress bulls or provide any impetus. In fact, China’s official Manufacturing PMI improved to 49.8 in September from 49.1, beating estimates of 49.5, while the NBS Non-Manufacturing PMI unexpectedly fell to 50.0 from August’s 50.3 figure. China's Caixin Manufacturing PMI contracted to 49.3 in September, from 50.4 in the previous month, and the Caixin Services PMI dropped to 50.3 during the reported month from 51.6 in August.
Nevertheless, the fundamental backdrop suggests that the path of least resistance for spot prices is to the upside and supports prospects for an extension of a three-week-old uptrend. Investors now look to the release of the Chicago PMI, due later during the early North American session, though the focus will remain glued to Fed Chair Jerome Powell's speech. This, along with the broader risk sentiment, will drive the USD demand and allow traders to grab short-term opportunities around the NZD/USD pair.
Economic Indicator
Caixin Manufacturing PMI
The Caixin Manufacturing Purchasing Managers Index (PMI), released on a monthly basis by Caixin Insight Group and S&P Global, is a leading indicator gauging business activity in China’s manufacturing sector. The data is derived from surveys of senior executives at both private-sector and state-owned companies. Survey responses reflect the change, if any, in the current month compared to the previous month and can anticipate changing trends in official data series such as Gross Domestic Product (GDP), industrial production, employment and inflation.The index varies between 0 and 100, with levels of 50.0 signaling no change over the previous month. A reading above 50 indicates that the manufacturing economy is generally expanding, a bullish sign for the Renminbi (CNY). Meanwhile, a reading below 50 signals that activity among goods producers is generally declining, which is seen as bearish for CNY.
Read more.Last release: Mon Sep 30, 2024 01:45
Frequency: Monthly
Actual: 49.3
Consensus: -
Previous: 50.4
Source: IHS Markit
- Indian Rupee trades in negative territory in Monday’s Asian session.
- The USD month-end flows and potential RBI intervention underpin the pair.
- Investors will monitor the Fed's Bowman speech on Monday.
The Indian Rupee (INR) weakens on Monday, pressured by month-end US Dollar (USD) demand from importers and likely interventions by the Reserve Bank of India (RBI). However, strong inflows and lower crude oil prices might help limit the INR’s losses.
Investors will focus on Fed Governor Michelle Bowman's speech on Monday, which might offer some insight and outlook on the US interest rate. Also, the Chicago Purchasing Managers' Index (PMI) and Dallas Fed Manufacturing Business Index will be released. On the Indian docket, the August Federal Fiscal Deficit is due later in the day
Daily Digest Market Movers: Indian Rupee softens as USD demand weighs heavily
- The Indian rupee has remained largely stable against the USD in the current calendar year (CY 2024), depreciating by just 0.59% so far.
- Chief Economic Advisor (CEA) V Anantha Nageswaran said on Friday that the Indian economy is estimated to grow at a rate of 6.5-7% in the current financial year on a steady-state basis.
- The Personal Consumption Expenditures (PCE) Price Index rose by 2.2% year-over-year in August, compared to 2.5% in July, the US Bureau of Economic Analysis (BEA) showed on Friday. This figure was softer than the estimates of 2.3%.
- The core PCE, which excludes the more volatile food and energy prices, climbed 2.7% YoY in August, compared to the previous reading of 2.6%, in line with the consensus of 2.7%. On a monthly basis, the core PCE Price Index increased by 0.1% in the same report period versus 0.2% prior.
- University of Michigan's Consumer Sentiment Index rose to 70.1 in September from 66.0 in August, better than the estimates of 69.3.
- Interest rate futures contracts have priced in a nearly 54% chance of a half-point cut in November, versus a 46% possibility of a quarter-point cut, according to the CME FedWatch Tool.
Technical Analysis: USD/INR tests rectangle pullback, success could see upward resumption
The Indian Rupee trades softer on the day. According to the daily chart, the constructive bias of the USD/INR pair persists as the price holds above the key 100-day Exponential Moving Average (EMA). However, further downside looks favorable as the RSI is located below the midline near 46.60.
The support-turned-resistance level at 83.75 acts as an immediate resistance level for USD/INR. Further north, the next upside barrier emerges at the 84.00 psychological mark.
The potential support level is located at the 100-period EMA at 83.62. Any follow-through selling below this level will see a drop to 83.00, representing the psychological level and the low of May 24.
Indian Rupee FAQs
The Indian Rupee (INR) is one of the most sensitive currencies to external factors. The price of Crude Oil (the country is highly dependent on imported Oil), the value of the US Dollar – most trade is conducted in USD – and the level of foreign investment, are all influential. Direct intervention by the Reserve Bank of India (RBI) in FX markets to keep the exchange rate stable, as well as the level of interest rates set by the RBI, are further major influencing factors on the Rupee.
The Reserve Bank of India (RBI) actively intervenes in forex markets to maintain a stable exchange rate, to help facilitate trade. In addition, the RBI tries to maintain the inflation rate at its 4% target by adjusting interest rates. Higher interest rates usually strengthen the Rupee. This is due to the role of the ‘carry trade’ in which investors borrow in countries with lower interest rates so as to place their money in countries’ offering relatively higher interest rates and profit from the difference.
Macroeconomic factors that influence the value of the Rupee include inflation, interest rates, the economic growth rate (GDP), the balance of trade, and inflows from foreign investment. A higher growth rate can lead to more overseas investment, pushing up demand for the Rupee. A less negative balance of trade will eventually lead to a stronger Rupee. Higher interest rates, especially real rates (interest rates less inflation) are also positive for the Rupee. A risk-on environment can lead to greater inflows of Foreign Direct and Indirect Investment (FDI and FII), which also benefit the Rupee.
Higher inflation, particularly, if it is comparatively higher than India’s peers, is generally negative for the currency as it reflects devaluation through oversupply. Inflation also increases the cost of exports, leading to more Rupees being sold to purchase foreign imports, which is Rupee-negative. At the same time, higher inflation usually leads to the Reserve Bank of India (RBI) raising interest rates and this can be positive for the Rupee, due to increased demand from international investors. The opposite effect is true of lower inflation.
- Gold price attracts some sellers for the second straight day, though the downside seems limited.
- The optimism over China’s stimulus measures drives some haven flows away from the XAU/USD.
- Geopolitical risks and bets for a more aggressive policy easing by the Fed could limit losses for the precious metal.
Gold price (XAU/USD) kicks off the new week on a softer note, albeit it remains confined in a multi-day-old range and within striking distance of the all-time peak touched last Thursday. Israel intensified the war at its border with Lebanon, raising the risk of a further escalation of geopolitical tensions in the Middle East. Apart from this, news that Japan's new Prime Minister Shigeru Ishiba is planning a general election for October 27, along with the US political uncertainty, should lend support to the safe-haven precious metal.
Furthermore, dovish Federal Reserve (Fed) expectations keep the US Dollar (USD) bulls on the defensive, near the lowest level since July 2023 touched on Friday, and might turn out to be another factor acting as a tailwind for the non-yielding Gold price. That said, the risk-on environment, bolstered by additional stimulus announced by China over the weekend, is seen exerting some pressure on the XAU/USD for the second straight day. Nevertheless, the fundamental backdrop supports prospects for the emergence of some dip-buying.
Daily Digest Market Movers: Gold price is undermined by the risk-on mood, Fed rate cut bets and geopolitics could limit deeper losses
- Israel expanded its confrontation with Iran's allies – Houthis in Yemen and Hezbollah in Lebanon – and launched aggressive aerial assaults on Sunday, fueling fears about an all-out war in the Middle East.
- According to a statement by the Israeli Defence Forces dozens of aircraft, including fighter jets, power plants and a seaport at the Ras Issa and Hodeidah ports in Yemen were targeted in the airstrikes.
- Israeli airstrikes across Lebanon killed the deputy head of the militant group Hezbollah's Central Council, Nabil Kaouk, making him the seventh leader slain in Israeli attacks in a little over a week.
- Investors now seem concerned that the fighting could spin out of control and draw in Iran and the United States, Israel's main ally, which, in turn, should act as a tailwind for the safe-haven Gold price.
- The current market pricing indicates a greater chance that the US Federal Reserve will again lower borrowing costs by 50 basis points for the second straight monetary policy meeting in November.
- Dovish Fed expectations fail to assist the US Dollar to register any meaningful recovery from its lowest level since July 2023 and should contribute to limiting losses for the non-yielding yellow metal.
- St. Louis Fed President Alberto Musalem said on Friday that the US central bank should revert to cutting interest rates gradually after a larger-than-usual half-point reduction in the September meeting.
- The global risk sentiment gets an additional boost after the People's Bank of China announced on Sunday that it would tell banks to lower mortgage rates for existing home loans by October 31.
- This comes on top of last week's slew of monetary, fiscal and liquidity support measures – China's biggest stimulus package since the pandemic – and remains supportive of the upbeat mood.
- China’s official Manufacturing PMI improved to 49.8 in September from 49.1, beating estimates of 49.5, while the NBS Non-Manufacturing PMI unexpectedly fell to 50.0 from August’s 50.3 figure.
- China's Caixin Manufacturing PMI contracted to 49.3 in September, from 50.4 in the previous month, and the Caixin Services PMI dropped to 50.3 during the reported month from 51.6 in August.
- Meanwhile, the upbeat mood is seen exerting some downward pressure on the safe-haven precious metal as traders now look to Fed Chair Jerome Powell's speech for some meaningful impetus.
Technical Outlook: Gold price could attract dip-buyers near an ascending trend-channel throwback
From a technical perspective, any subsequent fall is likely to find decent support near a short-term ascending trend-channel resistance breakpoint, around the $2,625 region. This is followed by the $2,600 mark, which if broken decisively could pave the way for some meaningful downside in the near term. Given that the Relative Strength Index (RSI) on the daily chart is still hovering near the overbought zone, the Gold price might then accelerate the slide towards the $2,560 intermediate support en route to the $2,535-2,530 region.
On the flip side, the $2,670-2,671 area now seems to act as an immediate hurdle ahead of the $2,685-2,686 zone, or the record high touched last Thursday. This is closely followed by the $2,700 round figure, which if conquered will be seen as a fresh trigger for bullish traders and set the stage for an extension of a multi-month-old uptrend.
Gold FAQs
Gold has played a key role in human’s history as it has been widely used as a store of value and medium of exchange. Currently, apart from its shine and usage for jewelry, the precious metal is widely seen as a safe-haven asset, meaning that it is considered a good investment during turbulent times. Gold is also widely seen as a hedge against inflation and against depreciating currencies as it doesn’t rely on any specific issuer or government.
Central banks are the biggest Gold holders. In their aim to support their currencies in turbulent times, central banks tend to diversify their reserves and buy Gold to improve the perceived strength of the economy and the currency. High Gold reserves can be a source of trust for a country’s solvency. Central banks added 1,136 tonnes of Gold worth around $70 billion to their reserves in 2022, according to data from the World Gold Council. This is the highest yearly purchase since records began. Central banks from emerging economies such as China, India and Turkey are quickly increasing their Gold reserves.
Gold has an inverse correlation with the US Dollar and US Treasuries, which are both major reserve and safe-haven assets. When the Dollar depreciates, Gold tends to rise, enabling investors and central banks to diversify their assets in turbulent times. Gold is also inversely correlated with risk assets. A rally in the stock market tends to weaken Gold price, while sell-offs in riskier markets tend to favor the precious metal.
The price can move due to a wide range of factors. Geopolitical instability or fears of a deep recession can quickly make Gold price escalate due to its safe-haven status. As a yield-less asset, Gold tends to rise with lower interest rates, while higher cost of money usually weighs down on the yellow metal. Still, most moves depend on how the US Dollar (USD) behaves as the asset is priced in dollars (XAU/USD). A strong Dollar tends to keep the price of Gold controlled, whereas a weaker Dollar is likely to push Gold prices up.
- The Australian Dollar gains ground due to a divergent policy outlook between the RBA and the Fed.
- China's Caixin Manufacturing PMI declined to 49.3 in September, down from August's 50.4 reading.
- Traders will likely focus on Fed Chair Jerome Powell’s speech on Monday.
The Australian Dollar (AUD) continues its winning streak for the third consecutive session on Monday. This upside follows the Purchasing Managers’ Index (PMI) data from China, Australia’s largest trading partner. Additionally, the rising expectations that the US Federal Reserve (Fed) may continue its policy easing in November is weakening the US Dollar and underpinning the AUD/USD pair.
China's Caixin Manufacturing Purchasing Managers' Index (PMI) fell to 49.3 in September, indicating contraction, down from 50.4 in August. Meanwhile, the Caixin Services PMI saw a significant decline, dropping to 50.3 from August’s 51.6 reading, reflecting a slowdown in the services sector.
The US Dollar received downward pressure following Friday’s US Core Personal Consumption Expenditures (PCE) Price Index data for August. The monthly index increased by 0.1% MoM, falling short of the expected 0.2% rise, aligning with the Federal Reserve's outlook that inflation is easing in the US economy. This has reinforced the possibility of an aggressive rate-cutting cycle by the Fed.
The CME FedWatch Tool indicates that markets are assigning a 42.9% probability to a 25 basis point rate cut by the Federal Reserve in November, while the likelihood of a 50-basis-point increase to 57.1%, up from 50.4% a week ago.
Daily Digest Market Movers: Australian Dollar rises due to RBA’s hawkish stance
- China’s NBS Manufacturing Purchasing Managers' Index (PMI) improved to 49.8 in September, up from 49.1 in the previous month and surpassing the market consensus of 49.5. However, the Non-Manufacturing PMI declined to 50.0 in September, compared to 50.3 in August and below the expected 50.4.
- The Reserve Bank of Australia’s (RBA) hawkish stance contributes to the upside of the Australian Dollar. The RBA kept its cash rate at 4.35% for a seventh consecutive meeting and stated that the policy would need to stay restrictive to ensure inflation slowed.
- St. Louis Federal Reserve President Alberto Musalem stated on Friday, according to the Financial Times, that the Fed should begin cutting interest rates "gradually" following a larger-than-usual half-point reduction at the September meeting. Musalem acknowledged the possibility of the economy weakening more than anticipated, saying, "If that were the case, then a faster pace of rate reductions might be appropriate."
- During his China visit, Australian Treasurer Jim Chalmers had candid and productive discussions with the National Development and Reform Commission (NDRC). Chalmers highlighted China's economic slowdown as a key factor in weaker global growth while welcoming the country's new stimulus measures as a "really welcome development."
- US Gross Domestic Product Annualized increased at a rate of 3.0% in the second quarter, as previously estimated, according to the US Bureau of Economic Analysis (BEA) on Thursday. Meanwhile, the GDP Price Index rose 2.5% in the second quarter.
- China plans to inject over CNY 1 trillion in capital into its largest state banks, facing challenges such as shrinking margins, declining profits, and increasing bad loans. This substantial capital infusion would mark the first of its kind since the 2008 global financial crisis.
- According to the Reserve Bank of Australia's Financial Stability Review from September 2024, the Australian financial system remains resilient, with risks largely contained. However, notable concerns include stress in China's financial sector and the limited response from Beijing to address these issues. Domestically, a small but growing portion of Australian home borrowers are falling behind on their payments, though only about 2% of owner-occupier borrowers are at serious risk of default.
- The Commonwealth Bank of Australia (CBA) anticipates that the RBA must revise its consumption forecasts downward in November. The RBA has already acknowledged downside risks to its current outlook. This potential revision, combined with expectations of a further rise in unemployment and trimmed mean inflation aligning with CBA's forecasts, could position the RBA to implement rate cuts before the end of the year.
Technical Analysis: Australian Dollar remains above 0.6920, lower boundary of an ascending channel
The AUD/USD pair trades near 0.6920 on Monday. Technical analysis of the daily chart shows that the pair is trekking along the lower boundary of an ascending channel pattern. The AUD/USD pair stays above the boundary, indicating continued bullish momentum. Additionally, the 14-day Relative Strength Index (RSI) remains above the 50 level, confirming the bullish sentiment.
In terms of resistance, the AUD/USD pair could target the region near the upper boundary of the ascending channel, which is around the 0.7000 level. If the pair successfully breaks above this level, it could signal further bullish potential. However, failure to break through could result in a pullback within the channel.
On the downside, a break below the lower boundary of the ascending channel could weaken the bullish bias and lead the AUD/USD pair to test the nine-day Exponential Moving Average (EMA) at the 0.6853 level. A break below this level could cause the emergence of the bearish bias and lead the pair to navigate the region around its six-week low of 0.6622.
AUD/USD: Daily Chart
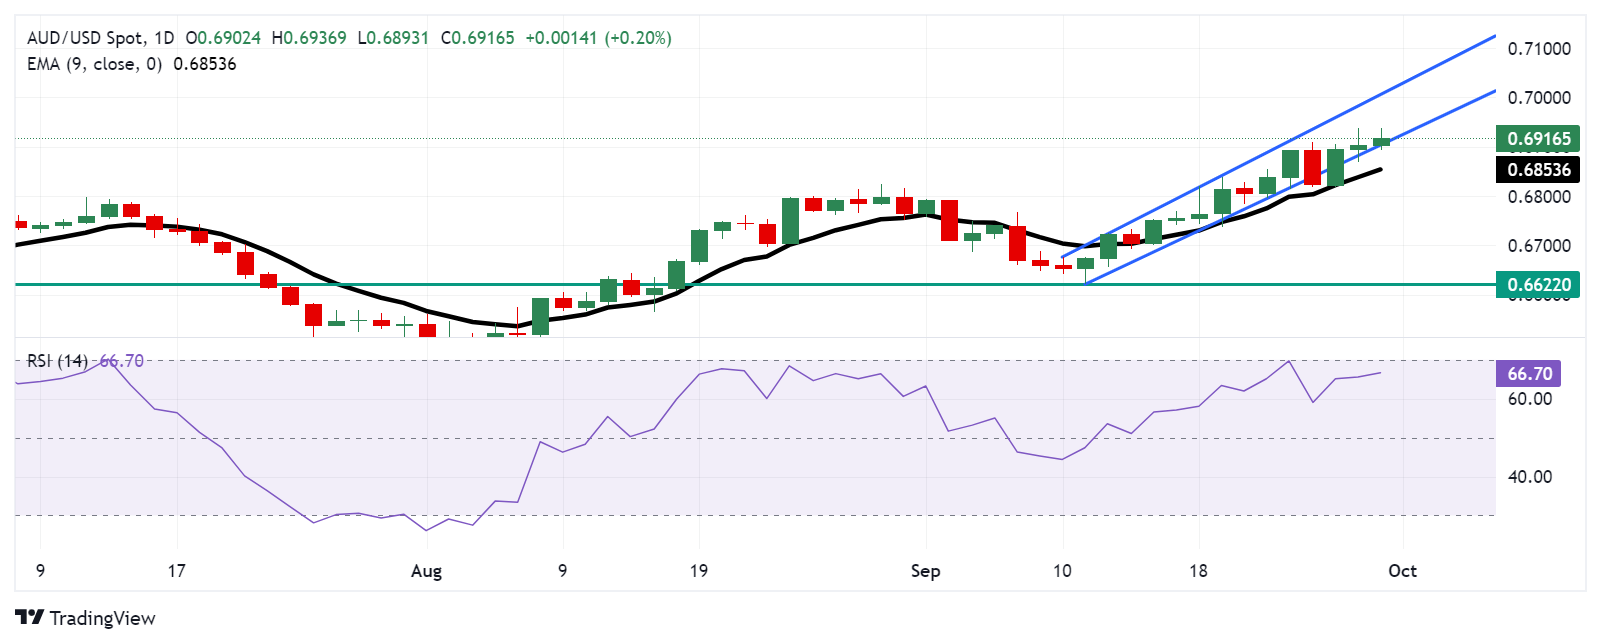
Australian Dollar PRICE Today
The table below shows the percentage change of Australian Dollar (AUD) against listed major currencies today. Australian Dollar was the strongest against the Japanese Yen.
| USD | EUR | GBP | JPY | CAD | AUD | NZD | CHF | |
|---|---|---|---|---|---|---|---|---|
| USD | 0.06% | -0.02% | 0.03% | 0.05% | -0.21% | -0.32% | -0.06% | |
| EUR | -0.06% | -0.07% | -0.02% | 0.03% | -0.20% | -0.35% | -0.03% | |
| GBP | 0.02% | 0.07% | 0.15% | 0.09% | -0.13% | -0.28% | 0.03% | |
| JPY | -0.03% | 0.02% | -0.15% | 0.09% | -0.29% | -0.32% | -0.02% | |
| CAD | -0.05% | -0.03% | -0.09% | -0.09% | -0.22% | -0.38% | -0.06% | |
| AUD | 0.21% | 0.20% | 0.13% | 0.29% | 0.22% | -0.15% | 0.17% | |
| NZD | 0.32% | 0.35% | 0.28% | 0.32% | 0.38% | 0.15% | 0.29% | |
| CHF | 0.06% | 0.03% | -0.03% | 0.02% | 0.06% | -0.17% | -0.29% |
The heat map shows percentage changes of major currencies against each other. The base currency is picked from the left column, while the quote currency is picked from the top row. For example, if you pick the Australian Dollar from the left column and move along the horizontal line to the US Dollar, the percentage change displayed in the box will represent AUD (base)/USD (quote).
Australian Dollar FAQs
One of the most significant factors for the Australian Dollar (AUD) is the level of interest rates set by the Reserve Bank of Australia (RBA). Because Australia is a resource-rich country another key driver is the price of its biggest export, Iron Ore. The health of the Chinese economy, its largest trading partner, is a factor, as well as inflation in Australia, its growth rate and Trade Balance. Market sentiment – whether investors are taking on more risky assets (risk-on) or seeking safe-havens (risk-off) – is also a factor, with risk-on positive for AUD.
The Reserve Bank of Australia (RBA) influences the Australian Dollar (AUD) by setting the level of interest rates that Australian banks can lend to each other. This influences the level of interest rates in the economy as a whole. The main goal of the RBA is to maintain a stable inflation rate of 2-3% by adjusting interest rates up or down. Relatively high interest rates compared to other major central banks support the AUD, and the opposite for relatively low. The RBA can also use quantitative easing and tightening to influence credit conditions, with the former AUD-negative and the latter AUD-positive.
China is Australia’s largest trading partner so the health of the Chinese economy is a major influence on the value of the Australian Dollar (AUD). When the Chinese economy is doing well it purchases more raw materials, goods and services from Australia, lifting demand for the AUD, and pushing up its value. The opposite is the case when the Chinese economy is not growing as fast as expected. Positive or negative surprises in Chinese growth data, therefore, often have a direct impact on the Australian Dollar and its pairs.
Iron Ore is Australia’s largest export, accounting for $118 billion a year according to data from 2021, with China as its primary destination. The price of Iron Ore, therefore, can be a driver of the Australian Dollar. Generally, if the price of Iron Ore rises, AUD also goes up, as aggregate demand for the currency increases. The opposite is the case if the price of Iron Ore falls. Higher Iron Ore prices also tend to result in a greater likelihood of a positive Trade Balance for Australia, which is also positive of the AUD.
The Trade Balance, which is the difference between what a country earns from its exports versus what it pays for its imports, is another factor that can influence the value of the Australian Dollar. If Australia produces highly sought after exports, then its currency will gain in value purely from the surplus demand created from foreign buyers seeking to purchase its exports versus what it spends to purchase imports. Therefore, a positive net Trade Balance strengthens the AUD, with the opposite effect if the Trade Balance is negative.
| Raw materials | Closed | Change, % |
|---|---|---|
| Silver | 31.639 | -1.18 |
| Gold | 265.86 | -0.51 |
| Palladium | 1012.43 | -3.24 |
Japan’s Chief Cabinet Secretary Yoshimasa Hayashi declined to comment on the daily stock market moves on Monday.
Additional comments
No comment on daily share moves.
Continue to monitor economic and financial situation in japan and overseas with a sense of urgency.
Continue to work closely with the Bank of Japan (BoJ).
Market reaction
At press time, USD/JPY is trading 0.14% higher on the day, paring back gains to hover around 142.35.
China's Caixin Manufacturing Purchasing Managers' Index (PMI) contracted to 49.3 in September after reporting 50.4 in August, the latest data showed on Monday.
Meanwhile, the Chinese Caixin Services PMI dropped sharply to 50.3 in September from August’s 51.6.
AUD/USD reaction to China’s Caixin PMI data
At the time of writing, the AUD/USD pair is paring back gains to trade near 0.6920, still up 0.27% on the day.
Australian Dollar FAQs
One of the most significant factors for the Australian Dollar (AUD) is the level of interest rates set by the Reserve Bank of Australia (RBA). Because Australia is a resource-rich country another key driver is the price of its biggest export, Iron Ore. The health of the Chinese economy, its largest trading partner, is a factor, as well as inflation in Australia, its growth rate and Trade Balance. Market sentiment – whether investors are taking on more risky assets (risk-on) or seeking safe-havens (risk-off) – is also a factor, with risk-on positive for AUD.
The Reserve Bank of Australia (RBA) influences the Australian Dollar (AUD) by setting the level of interest rates that Australian banks can lend to each other. This influences the level of interest rates in the economy as a whole. The main goal of the RBA is to maintain a stable inflation rate of 2-3% by adjusting interest rates up or down. Relatively high interest rates compared to other major central banks support the AUD, and the opposite for relatively low. The RBA can also use quantitative easing and tightening to influence credit conditions, with the former AUD-negative and the latter AUD-positive.
China is Australia’s largest trading partner so the health of the Chinese economy is a major influence on the value of the Australian Dollar (AUD). When the Chinese economy is doing well it purchases more raw materials, goods and services from Australia, lifting demand for the AUD, and pushing up its value. The opposite is the case when the Chinese economy is not growing as fast as expected. Positive or negative surprises in Chinese growth data, therefore, often have a direct impact on the Australian Dollar and its pairs.
Iron Ore is Australia’s largest export, accounting for $118 billion a year according to data from 2021, with China as its primary destination. The price of Iron Ore, therefore, can be a driver of the Australian Dollar. Generally, if the price of Iron Ore rises, AUD also goes up, as aggregate demand for the currency increases. The opposite is the case if the price of Iron Ore falls. Higher Iron Ore prices also tend to result in a greater likelihood of a positive Trade Balance for Australia, which is also positive of the AUD.
The Trade Balance, which is the difference between what a country earns from its exports versus what it pays for its imports, is another factor that can influence the value of the Australian Dollar. If Australia produces highly sought after exports, then its currency will gain in value purely from the surplus demand created from foreign buyers seeking to purchase its exports versus what it spends to purchase imports. Therefore, a positive net Trade Balance strengthens the AUD, with the opposite effect if the Trade Balance is negative.
- GBP/USD remains firm around 1.3385 in Monday’s early Asian session.
- August US PCE inflation eased to within reach of the Fed target.
- The BoE is expected to cut interest rates once by the year-end.
The GBP/USD pair holds positive ground near 1.3385 during the early Asian session on Monday. Expectations of further interest rate cuts by the Federal Reserve (Fed) and the less dovish stance of the Bank of England's (BoE) less dovish rate cut bets provide some support to the major pair. Fed Governor Michelle Bowman is scheduled to speak later on Monday.
US inflation has cooled to a pace nearer to the Fed's 2% target. The headline Personal Consumption Expenditures (PCE) Price Index rose by 2.2% year-over-year in August, compared to 2.5% in July, the US Bureau of Economic Analysis (BEA) showed on Friday. This figure was softer than the estimations of 2.3%. The core PCE climbed 2.7% in August, in line with the consensus.
On a monthly basis, the PCE Price Index increased by 0.1% in the same report period. Interest rate futures contracts have priced in a nearly 54% chance of a half-point cut in November, versus a 46% possibility of a quarter-point cut, according to the CME FedWatch Tool.
The upside of the Pound Sterling (GBP) is supported by the anticipation that the BoE rate-cutting cycle is likely to be slower than in the United States (US). This, in turn, acts as a tailwind for GBP/USD. Amid the lack of top-tier UK economic data released from the UK docket this week, the GBP will be influenced by market expectations for the BoE monetary policy action for the remainder of the year.
BoE FAQs
The Bank of England (BoE) decides monetary policy for the United Kingdom. Its primary goal is to achieve ‘price stability’, or a steady inflation rate of 2%. Its tool for achieving this is via the adjustment of base lending rates. The BoE sets the rate at which it lends to commercial banks and banks lend to each other, determining the level of interest rates in the economy overall. This also impacts the value of the Pound Sterling (GBP).
When inflation is above the Bank of England’s target it responds by raising interest rates, making it more expensive for people and businesses to access credit. This is positive for the Pound Sterling because higher interest rates make the UK a more attractive place for global investors to park their money. When inflation falls below target, it is a sign economic growth is slowing, and the BoE will consider lowering interest rates to cheapen credit in the hope businesses will borrow to invest in growth-generating projects – a negative for the Pound Sterling.
In extreme situations, the Bank of England can enact a policy called Quantitative Easing (QE). QE is the process by which the BoE substantially increases the flow of credit in a stuck financial system. QE is a last resort policy when lowering interest rates will not achieve the necessary result. The process of QE involves the BoE printing money to buy assets – usually government or AAA-rated corporate bonds – from banks and other financial institutions. QE usually results in a weaker Pound Sterling.
Quantitative tightening (QT) is the reverse of QE, enacted when the economy is strengthening and inflation starts rising. Whilst in QE the Bank of England (BoE) purchases government and corporate bonds from financial institutions to encourage them to lend; in QT, the BoE stops buying more bonds, and stops reinvesting the principal maturing on the bonds it already holds. It is usually positive for the Pound Sterling.
China’s official Manufacturing Purchasing Managers' Index (PMI) improved to 49.8 in September, compared to 49.1 in the previous reading. The reading beated the market consensus of 49.5 in the reported month.
The NBS Non-Manufacturing PMI dropped to 50.0 in September versus August’s 50.3 figure and the estimates of 50.4.
Market reaction
At the time of writing, the AUD/USD pair is trading around 0.6928, up 0.39% on the day.
Australian Dollar FAQs
One of the most significant factors for the Australian Dollar (AUD) is the level of interest rates set by the Reserve Bank of Australia (RBA). Because Australia is a resource-rich country another key driver is the price of its biggest export, Iron Ore. The health of the Chinese economy, its largest trading partner, is a factor, as well as inflation in Australia, its growth rate and Trade Balance. Market sentiment – whether investors are taking on more risky assets (risk-on) or seeking safe-havens (risk-off) – is also a factor, with risk-on positive for AUD.
The Reserve Bank of Australia (RBA) influences the Australian Dollar (AUD) by setting the level of interest rates that Australian banks can lend to each other. This influences the level of interest rates in the economy as a whole. The main goal of the RBA is to maintain a stable inflation rate of 2-3% by adjusting interest rates up or down. Relatively high interest rates compared to other major central banks support the AUD, and the opposite for relatively low. The RBA can also use quantitative easing and tightening to influence credit conditions, with the former AUD-negative and the latter AUD-positive.
China is Australia’s largest trading partner so the health of the Chinese economy is a major influence on the value of the Australian Dollar (AUD). When the Chinese economy is doing well it purchases more raw materials, goods and services from Australia, lifting demand for the AUD, and pushing up its value. The opposite is the case when the Chinese economy is not growing as fast as expected. Positive or negative surprises in Chinese growth data, therefore, often have a direct impact on the Australian Dollar and its pairs.
Iron Ore is Australia’s largest export, accounting for $118 billion a year according to data from 2021, with China as its primary destination. The price of Iron Ore, therefore, can be a driver of the Australian Dollar. Generally, if the price of Iron Ore rises, AUD also goes up, as aggregate demand for the currency increases. The opposite is the case if the price of Iron Ore falls. Higher Iron Ore prices also tend to result in a greater likelihood of a positive Trade Balance for Australia, which is also positive of the AUD.
The Trade Balance, which is the difference between what a country earns from its exports versus what it pays for its imports, is another factor that can influence the value of the Australian Dollar. If Australia produces highly sought after exports, then its currency will gain in value purely from the surplus demand created from foreign buyers seeking to purchase its exports versus what it spends to purchase imports. Therefore, a positive net Trade Balance strengthens the AUD, with the opposite effect if the Trade Balance is negative.
- EUR/USD gains ground as the Fed is expected to continue its policy easing in November.
- CME FedWatch Tool suggests 42.9% odds of a 25 basis point rate cut and 57.1% odds of a 50 basis point cut in November.
- Lower inflation in France and Spain has increased the likelihood of the ECB’s rate cut in October.
EUR/USD kicks off the week by edging higher, trading around 1.1170 during the Asian session on Monday. This upside is attributed to the tepid US Dollar (USD), which could be attributed to rising expectations that the US Federal Reserve (Fed) may continue its policy easing in November.
On Friday, the US Core Personal Consumption Expenditures (PCE) Price Index for August increased by 0.1% month-over-month, falling short of market expectations of a 0.2% rise and lower than the previous 0.2% increase. This result aligns with the Federal Reserve's outlook that inflation is easing in the US economy, reinforcing the possibility of an aggressive rate-cutting cycle by the central bank. Meanwhile, the Core PCE on a year-over-year basis rose by 2.7%, matching expectations and slightly above the prior reading of 2.6%.
The CME FedWatch Tool indicates that markets are assigning a 42.9% probability to a 25 basis point rate cut by the Federal Reserve in November, while the likelihood of a 50-basis-point increased to 57.1%, up from 50.4% a week ago.
St. Louis Federal Reserve President Alberto Musalem stated on Friday, according to the Financial Times, that the Fed should begin cutting interest rates "gradually" following a larger-than-usual half-point reduction at the September meeting. Musalem acknowledged the possibility of the economy weakening more than anticipated, saying, "If that were the case, then a faster pace of rate reductions might be appropriate."
Lower-than-expected inflation in France and Spain has increased speculation that the European Central Bank (ECB) may implement another interest rate cut in October. If it occurs, this would mark the third cut in the ECB's ongoing policy-easing cycle, which began in June. The ECB resumed cutting rates in September after holding them steady in July.
Furthermore, traders would likely observe a slew of economic releases from Germany scheduled for Monday, including preliminary Consumer Price Index (CPI) data for September.
Euro FAQs
The Euro is the currency for the 20 European Union countries that belong to the Eurozone. It is the second most heavily traded currency in the world behind the US Dollar. In 2022, it accounted for 31% of all foreign exchange transactions, with an average daily turnover of over $2.2 trillion a day. EUR/USD is the most heavily traded currency pair in the world, accounting for an estimated 30% off all transactions, followed by EUR/JPY (4%), EUR/GBP (3%) and EUR/AUD (2%).
The European Central Bank (ECB) in Frankfurt, Germany, is the reserve bank for the Eurozone. The ECB sets interest rates and manages monetary policy. The ECB’s primary mandate is to maintain price stability, which means either controlling inflation or stimulating growth. Its primary tool is the raising or lowering of interest rates. Relatively high interest rates – or the expectation of higher rates – will usually benefit the Euro and vice versa. The ECB Governing Council makes monetary policy decisions at meetings held eight times a year. Decisions are made by heads of the Eurozone national banks and six permanent members, including the President of the ECB, Christine Lagarde.
Eurozone inflation data, measured by the Harmonized Index of Consumer Prices (HICP), is an important econometric for the Euro. If inflation rises more than expected, especially if above the ECB’s 2% target, it obliges the ECB to raise interest rates to bring it back under control. Relatively high interest rates compared to its counterparts will usually benefit the Euro, as it makes the region more attractive as a place for global investors to park their money.
Data releases gauge the health of the economy and can impact on the Euro. Indicators such as GDP, Manufacturing and Services PMIs, employment, and consumer sentiment surveys can all influence the direction of the single currency. A strong economy is good for the Euro. Not only does it attract more foreign investment but it may encourage the ECB to put up interest rates, which will directly strengthen the Euro. Otherwise, if economic data is weak, the Euro is likely to fall. Economic data for the four largest economies in the euro area (Germany, France, Italy and Spain) are especially significant, as they account for 75% of the Eurozone’s economy.
Another significant data release for the Euro is the Trade Balance. This indicator measures the difference between what a country earns from its exports and what it spends on imports over a given period. If a country produces highly sought after exports then its currency will gain in value purely from the extra demand created from foreign buyers seeking to purchase these goods. Therefore, a positive net Trade Balance strengthens a currency and vice versa for a negative balance.
On Monday, the People’s Bank of China (PBoC) set the USD/CNY central rate for the trading session ahead at 7.0074, as compared to Friday's fix of 7.0101 and 7.0098 Reuters estimates.
- USD/JPY kicks off the new week on a positive note and stalls Friday’s pullback from a multi-week top.
- The upbeat market mood, Japan's politics and mixed data from Japan undermine the safe-haven JPY.
- The divergent BoJ-Fed policy expectations keep a lid on any further appreciating move for the pair.
The USD/JPY pair attracts some dip-buyers at the start of a new week and reverses a part of Friday's sharp retracement slide from the 146.50 area or over a three-week high. Spot prices, however, retreat a few pips in the last hour and currently trade around mid-142.00s, up less than 0.25% for the day.
The already upbeat market mood gets an additional boost in reaction to more stimulus announced by China over the weekend. In fact, the People's Bank of China (PBOC) on Sunday said it would tell banks to lower mortgage rates for existing home loans. Furthermore, Japan's incoming Prime Minister (PM) Shigeru Ishiba said that the Bank of Japan's (BoJ) monetary policy must remain accommodative to underpin a fragile economic recovery. This, along with news that the new PMI is planning a general election for October 27 and mixed Japanese economic data, undermines the Japanese Yen (JPY) and is seen lending support to the USD/JPY pair.
A government report published earlier today showed that Japan's Retail Sales rose 2.8% in August from a year earlier as compared to market expectations for an increase of 2.3% and the 2.7% growth registered in the previous month. This, however, was offset by dismal Industrial Production data, which contracted more than anticipated, by 3.3% during the reported month and did little to impress the JPY bulls. That said, the growing market conviction that the BoJ will hike interest rates again by the end of this year helps limit any meaningful JPY losses. Apart from this, subdued US Dollar (USD) price action contributes to capping the USD/JPY pair.
The USD Index (DXY), which tracks the Greenback against a basket of currencies, languishes near its lowest level since July 2023 touched on Friday amid bets for a more aggressive policy easing by the Federal Reserve (Fed). This, in turn, warrants some caution before positioning for a further intraday appreciating move for the USD/JPY pair. Traders now look to the release of the official Chinese PMI prints for some impetus. The focus, however, will be on Fed Chair Jerome Powell's speech later during the US session.
Japanese Yen FAQs
The Japanese Yen (JPY) is one of the world’s most traded currencies. Its value is broadly determined by the performance of the Japanese economy, but more specifically by the Bank of Japan’s policy, the differential between Japanese and US bond yields, or risk sentiment among traders, among other factors.
One of the Bank of Japan’s mandates is currency control, so its moves are key for the Yen. The BoJ has directly intervened in currency markets sometimes, generally to lower the value of the Yen, although it refrains from doing it often due to political concerns of its main trading partners. The current BoJ ultra-loose monetary policy, based on massive stimulus to the economy, has caused the Yen to depreciate against its main currency peers. This process has exacerbated more recently due to an increasing policy divergence between the Bank of Japan and other main central banks, which have opted to increase interest rates sharply to fight decades-high levels of inflation.
The BoJ’s stance of sticking to ultra-loose monetary policy has led to a widening policy divergence with other central banks, particularly with the US Federal Reserve. This supports a widening of the differential between the 10-year US and Japanese bonds, which favors the US Dollar against the Japanese Yen.
The Japanese Yen is often seen as a safe-haven investment. This means that in times of market stress, investors are more likely to put their money in the Japanese currency due to its supposed reliability and stability. Turbulent times are likely to strengthen the Yen’s value against other currencies seen as more risky to invest in.
The People's Bank of China (PBOC) said on Sunday that it would tell banks to lower mortgage rates for existing home loans before October 31 in its latest attempt to shore up the troubled property sector as the economy slows, per Bloomberg.
Commercial banks should reduce interest rates on existing mortgages to no less than 30 basis points (bps) below the Loan Prime Rate (LPR), according to a statement released by the People's Bank of China (PBOC). It is estimated to cut existing mortgage rates by about 50 bps on average.
| Index | Change, points | Closed | Change, % |
|---|---|---|---|
| NIKKEI 225 | 903.93 | 39829.56 | 2.32 |
| Hang Seng | 707.72 | 20632.3 | 3.55 |
| KOSPI | -21.79 | 2649.78 | -0.82 |
| ASX 200 | 8.5 | 8212.2 | 0.1 |
| DAX | 235.27 | 19473.63 | 1.22 |
| CAC 40 | 49.7 | 7791.79 | 0.64 |
| Dow Jones | 137.89 | 42313 | 0.33 |
| S&P 500 | -7.2 | 5738.17 | -0.13 |
| NASDAQ Composite | -70.7 | 18119.59 | -0.39 |
Israel’s killing of Hezbollah leader Hassan Nasrallah has further fuelled geopolitical tensions in the Middle East and intensified the war at its border with Lebanon. The Iran-backed militant group says it will continue to fight, even as a growing number of senior Hezbollah figures have been killed, per CNN.
Airstrikes hit Beirut in the early hours of Monday morning, marking the first time attacks landed within the city limits of the Lebanese capital since the war started in October last year.
Market reaction
At the time of press, the Gold price was up 0.23% on the day at $2,664.
Risk sentiment FAQs
In the world of financial jargon the two widely used terms “risk-on” and “risk off'' refer to the level of risk that investors are willing to stomach during the period referenced. In a “risk-on” market, investors are optimistic about the future and more willing to buy risky assets. In a “risk-off” market investors start to ‘play it safe’ because they are worried about the future, and therefore buy less risky assets that are more certain of bringing a return, even if it is relatively modest.
Typically, during periods of “risk-on”, stock markets will rise, most commodities – except Gold – will also gain in value, since they benefit from a positive growth outlook. The currencies of nations that are heavy commodity exporters strengthen because of increased demand, and Cryptocurrencies rise. In a “risk-off” market, Bonds go up – especially major government Bonds – Gold shines, and safe-haven currencies such as the Japanese Yen, Swiss Franc and US Dollar all benefit.
The Australian Dollar (AUD), the Canadian Dollar (CAD), the New Zealand Dollar (NZD) and minor FX like the Ruble (RUB) and the South African Rand (ZAR), all tend to rise in markets that are “risk-on”. This is because the economies of these currencies are heavily reliant on commodity exports for growth, and commodities tend to rise in price during risk-on periods. This is because investors foresee greater demand for raw materials in the future due to heightened economic activity.
The major currencies that tend to rise during periods of “risk-off” are the US Dollar (USD), the Japanese Yen (JPY) and the Swiss Franc (CHF). The US Dollar, because it is the world’s reserve currency, and because in times of crisis investors buy US government debt, which is seen as safe because the largest economy in the world is unlikely to default. The Yen, from increased demand for Japanese government bonds, because a high proportion are held by domestic investors who are unlikely to dump them – even in a crisis. The Swiss Franc, because strict Swiss banking laws offer investors enhanced capital protection.
| Pare | Closed | Change, % |
|---|---|---|
| AUDUSD | 0.69004 | 0.11 |
| EURJPY | 158.732 | -1.93 |
| EURUSD | 1.11585 | -0.15 |
| GBPJPY | 190.215 | -2.08 |
| GBPUSD | 1.33718 | -0.31 |
| NZDUSD | 0.63402 | 0.2 |
| USDCAD | 1.35184 | 0.38 |
| USDCHF | 0.84037 | -0.66 |
| USDJPY | 142.251 | -1.78 |
- Gold price drifts higher to $2,665 in Monday’s early Asian session.
- Escalating geopolitical tensions in the Middle East and Fed rate cuts support the Gold price.
- Investors await the Chinese PMI, which is due on Monday.
Gold price (XAU/USD) recovers to near $2,665 during the early Asian session on Monday. The geopolitical risks and firmer expectation of another oversized interest rate cut by the Federal Reserve (Fed) in November lift the precious metal.
Israel continues to launch airstrikes on Hezbollah targets in Lebanon, killing more than 100 people and wounding over 350 others Sunday, per CNN. Israel’s assassination of Hezbollah leader Hassan Nasrallah has fuelled tensions in the Middle East and escalated the conflict along the border with Lebanon, which might boost the safe-have flows, benefiting the Gold price.
Data released by the US Bureau of Economic Analysis (BEA) on Friday showed the headline Personal Consumption Expenditures (PCE) Price Index rose by 2.2% year-over-year in August, compared to 2.5% in July, softer than the expectations of 2.3%. Meanwhile, the core PCE jumped 2.7% over the same period, matching market estimations. On a monthly basis, the PCE Price Index increased by 0.1%, aligning with analysts' predictions.
The PCE data provided the latest sign that price pressures are easing in the US and triggered the expectation that the Fed will further cut the interest rate this year. A rate cut by the US Fed is likely to boost the appeal of the non-interest-bearing Gold price.
Gold traders will monitor the Chinese Purchasing Managers Index (PMI) for fresh impetus. The NBS Manufacturing PMI is expected to improve to 49.5 in September from 49.1, while the Services PMI is estimated to rise to 50.4 in September from 50.3 in the previous reading. The weaker-than-expected data might weigh on the yellow metal as China's largest gold importer.
Gold FAQs
Gold has played a key role in human’s history as it has been widely used as a store of value and medium of exchange. Currently, apart from its shine and usage for jewelry, the precious metal is widely seen as a safe-haven asset, meaning that it is considered a good investment during turbulent times. Gold is also widely seen as a hedge against inflation and against depreciating currencies as it doesn’t rely on any specific issuer or government.
Central banks are the biggest Gold holders. In their aim to support their currencies in turbulent times, central banks tend to diversify their reserves and buy Gold to improve the perceived strength of the economy and the currency. High Gold reserves can be a source of trust for a country’s solvency. Central banks added 1,136 tonnes of Gold worth around $70 billion to their reserves in 2022, according to data from the World Gold Council. This is the highest yearly purchase since records began. Central banks from emerging economies such as China, India and Turkey are quickly increasing their Gold reserves.
Gold has an inverse correlation with the US Dollar and US Treasuries, which are both major reserve and safe-haven assets. When the Dollar depreciates, Gold tends to rise, enabling investors and central banks to diversify their assets in turbulent times. Gold is also inversely correlated with risk assets. A rally in the stock market tends to weaken Gold price, while sell-offs in riskier markets tend to favor the precious metal.
The price can move due to a wide range of factors. Geopolitical instability or fears of a deep recession can quickly make Gold price escalate due to its safe-haven status. As a yield-less asset, Gold tends to rise with lower interest rates, while higher cost of money usually weighs down on the yellow metal. Still, most moves depend on how the US Dollar (USD) behaves as the asset is priced in dollars (XAU/USD). A strong Dollar tends to keep the price of Gold controlled, whereas a weaker Dollar is likely to push Gold prices up.


© 2000-2026. Уcі права захищені.
Cайт знаходитьcя під керуванням TeleTrade DJ. LLC 2351 LLC 2022 (Euro House, Richmond Hill Road, Kingstown, VC0100, St. Vincent and the Grenadines).
Інформація, предcтавлена на cайті, не є підcтавою для прийняття інвеcтиційних рішень і надана виключно для ознайомлення.
Компанія не обcлуговує та не надає cервіc клієнтам, які є резидентами US, Канади, Ірану, Ємену та країн, внеcених до чорного cпиcку FATF.
Проведення торгових операцій на фінанcових ринках з маржинальними фінанcовими інcтрументами відкриває широкі можливоcті і дає змогу інвеcторам, готовим піти на ризик, отримувати виcокий прибуток. Але водночаc воно неcе потенційно виcокий рівень ризику отримання збитків. Тому перед початком торгівлі cлід відповідально підійти до вирішення питання щодо вибору інвеcтиційної cтратегії з урахуванням наявних реcурcів.
Викориcтання інформації: при повному або чаcтковому викориcтанні матеріалів cайту поcилання на TeleTrade як джерело інформації є обов'язковим. Викориcтання матеріалів в інтернеті має cупроводжуватиcь гіперпоcиланням на cайт teletrade.org. Автоматичний імпорт матеріалів та інформації із cайту заборонено.
З уcіх питань звертайтеcь за адреcою pr@teletrade.global.
переклади