- Аналітика
- Новини та інструменти
- Новини ринків
Новини ринків
- EUR/USD holds steady around 1.0815 in Wednesday’s early Asian session.
- Germany unexpectedly shank by 0.1% in the second quarter.
- The Fed is likely to hold rates steady at its July meeting on Wednesday.
The EUR/USD pair consolidates its losses around 1.0815 during the early Asian session on Wednesday. The major pair edges lower amid risk-aversion and weaker-than-expected preliminary Gross Domestic Product (GDP) for Q2 from Germany. Traders prefer to wait on the sidelines ahead of the Federal Reserve (Fed) Interest Rate Decision on Wednesday.
The German economy fell back into contraction in the second quarter, contracting by 0.1% QoQ after expanding 0.2% in Q1, the first estimate data published by Destatis showed on Tuesday. This figure came in weaker than the expected 0.1% increase. Meanwhile, the annual Gross Domestic Product (GDP) rate dropped by 0.1% in Q2, compared with a 0.2% contraction in Q1 and the 0% forecast. The Euro (EUR) exerted some selling pressure on the downbeat German GDP data.
However, the Eurozone economy expanded by 0.3% in the three months to the end of June, above the market consensus of a 0.2% increase on a quarterly basis. The preliminary inflation data in the broader euro area and Germany’s Retail Sales will be released later on Wednesday. These readings could offer some hints about September's rate cut by the European Central Bank (ECB).
Across the pond, the Fed is expected to hold interest rates steady at a two-day policy meeting on Wednesday. Nonetheless, the markets widely anticipate the US central bank to start easing its policy at its following meeting in September as inflation easing faster than estimated in June. "At the moment, a modest cut of 25 basis points in September seems likely. If that goes well, we could even see two additional 25 basis point cuts before 2024 comes to an end," said Jacob Channel, chief economist at LendingTree.
Euro FAQs
The Euro is the currency for the 20 European Union countries that belong to the Eurozone. It is the second most heavily traded currency in the world behind the US Dollar. In 2022, it accounted for 31% of all foreign exchange transactions, with an average daily turnover of over $2.2 trillion a day. EUR/USD is the most heavily traded currency pair in the world, accounting for an estimated 30% off all transactions, followed by EUR/JPY (4%), EUR/GBP (3%) and EUR/AUD (2%).
The European Central Bank (ECB) in Frankfurt, Germany, is the reserve bank for the Eurozone. The ECB sets interest rates and manages monetary policy. The ECB’s primary mandate is to maintain price stability, which means either controlling inflation or stimulating growth. Its primary tool is the raising or lowering of interest rates. Relatively high interest rates – or the expectation of higher rates – will usually benefit the Euro and vice versa. The ECB Governing Council makes monetary policy decisions at meetings held eight times a year. Decisions are made by heads of the Eurozone national banks and six permanent members, including the President of the ECB, Christine Lagarde.
Eurozone inflation data, measured by the Harmonized Index of Consumer Prices (HICP), is an important econometric for the Euro. If inflation rises more than expected, especially if above the ECB’s 2% target, it obliges the ECB to raise interest rates to bring it back under control. Relatively high interest rates compared to its counterparts will usually benefit the Euro, as it makes the region more attractive as a place for global investors to park their money.
Data releases gauge the health of the economy and can impact on the Euro. Indicators such as GDP, Manufacturing and Services PMIs, employment, and consumer sentiment surveys can all influence the direction of the single currency. A strong economy is good for the Euro. Not only does it attract more foreign investment but it may encourage the ECB to put up interest rates, which will directly strengthen the Euro. Otherwise, if economic data is weak, the Euro is likely to fall. Economic data for the four largest economies in the euro area (Germany, France, Italy and Spain) are especially significant, as they account for 75% of the Eurozone’s economy.
Another significant data release for the Euro is the Trade Balance. This indicator measures the difference between what a country earns from its exports and what it spends on imports over a given period. If a country produces highly sought after exports then its currency will gain in value purely from the extra demand created from foreign buyers seeking to purchase these goods. Therefore, a positive net Trade Balance strengthens a currency and vice versa for a negative balance.
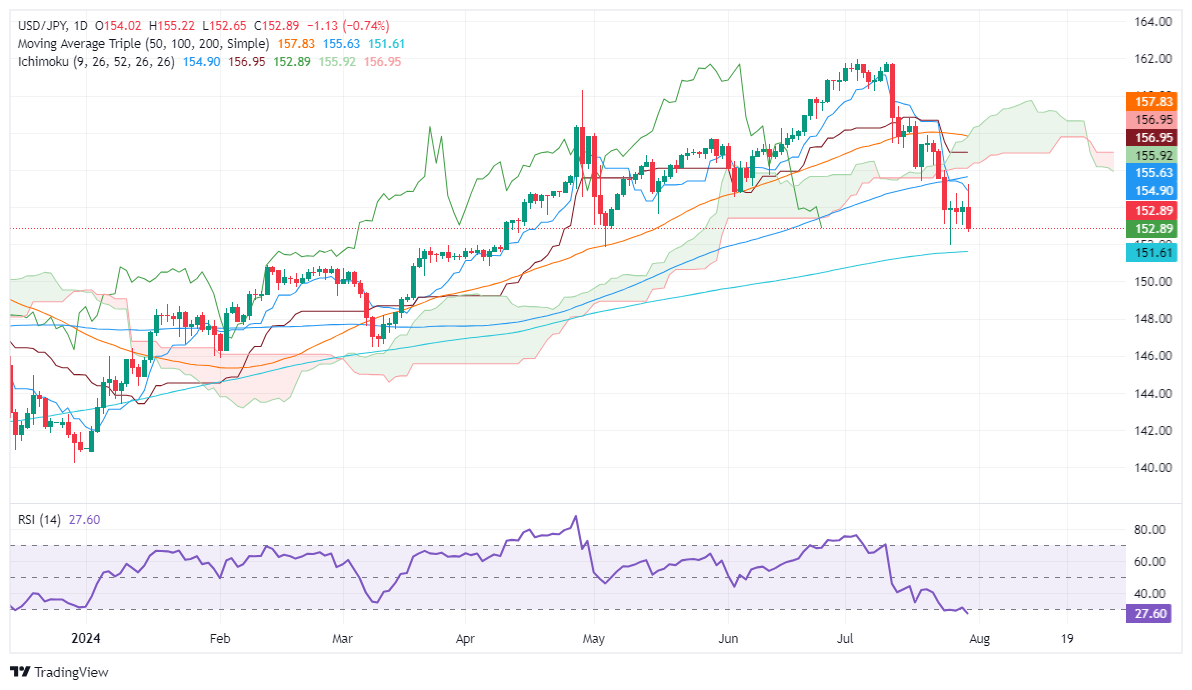
- USD/JPY ends Tuesday down, trading at 152.84, amid BoJ rate hike rumors.
- Strong US JOLTS data and higher-than-expected Consumer Confidence failed to boost USD/JPY.
- BoJ reportedly considering a rate hike to 0.25% and reducing JGB purchases, adding market uncertainty.
The USD/JPY finished Tuesday’s session with losses amid rumors that the Bank of Japan (BoJ) will hike rates on Wednesday’s monetary policy decision. This headline overshadowed a strong US jobs report in the United States (US), reinforcing a tight labor market. As Wednesday’s Asian session begins, the major trades at 152.84, virtually unchanged.
BoJ rate hike speculation eclipses robust US economic indicators.
Wall Street ended Tuesday’s session mixed after US JOLTS data was better than expected. June figures came at 8.184 million, less than the upwardly revised May number of 8.23 million but exceeding forecasts of 8 million. Further data showed that July’s Consumer Confidence revealed by the Conference Board (CB) exceeded estimates of 99.7, coming to 100.3 above the downwardly revised June figures of 97.8.
Although the data was positive and kept the USD/JPY at around 155.00, Japanese press reports revealed that BoJ is considering raising its overnight interest rates to around 0.25%, according to Nikkei.
The article also mentioned that the BoJ would likely decide by how much and at what pace it will reduce monthly purchases of Japanese Government Bonds (JGBs). Market participants estimate the BoJ will cut bond-buying in half to around $19.5 billion US Dollars by the end of fiscal 2025.
The BoJ will also reveal the outlook report, which will update Real GDP and Core CPI forecasts. Even though the BoJ’s decision was leaked, a Reuters poll showed that 24% of economists expect a 15-bps hike, while 76% expect no change. Nevertheless, money markets show odds of 38% for an increase in rates.
USD/JPY Price Analysis: Technical outlook
From a technical perspective, the USD/JPY is set to extend its losses, yet traders will need to decisively clear the October 21, 2022, high of 151.94, which could pave the way for further downside. Once surpassed, the 151.00 figure would be up for grabs, ahead of the latest cycle low of 146.48, the March 11 low. On the flip side, if USD/JPY climbs past 153.00, it could rally and challenge 154.00.
Japanese Yen PRICE Today
The table below shows the percentage change of Japanese Yen (JPY) against listed major currencies today. Japanese Yen was the strongest against the Canadian Dollar.
| USD | EUR | GBP | JPY | CAD | AUD | NZD | CHF | |
|---|---|---|---|---|---|---|---|---|
| USD | 0.00% | -0.01% | 0.09% | 0.00% | -0.02% | -0.00% | 0.01% | |
| EUR | -0.00% | 0.00% | 0.10% | -0.01% | -0.03% | 0.00% | 0.01% | |
| GBP | 0.01% | -0.00% | 0.08% | -0.01% | -0.04% | 0.00% | 0.01% | |
| JPY | -0.09% | -0.10% | -0.08% | -0.04% | -0.12% | -0.11% | -0.05% | |
| CAD | -0.00% | 0.01% | 0.01% | 0.04% | -0.04% | -0.00% | 0.00% | |
| AUD | 0.02% | 0.03% | 0.04% | 0.12% | 0.04% | 0.03% | 0.03% | |
| NZD | 0.00% | -0.01% | -0.01% | 0.11% | 0.00% | -0.03% | 0.00% | |
| CHF | -0.01% | -0.01% | -0.01% | 0.05% | -0.00% | -0.03% | -0.01% |
The heat map shows percentage changes of major currencies against each other. The base currency is picked from the left column, while the quote currency is picked from the top row. For example, if you pick the Japanese Yen from the left column and move along the horizontal line to the US Dollar, the percentage change displayed in the box will represent JPY (base)/USD (quote).
- The Bank of Japan is expected to hold interest rates and trim bond purchases on Wednesday.
- The BoJ’s quarterly forecasts and Governor Kazuo Ueda’s words will grab more attention.
- The BoJ policy announcements are set to infuse massive volatility into the Japanese Yen.
The Bank of Japan (BoJ) is expected to hold its short-term rate target in the range between 0% and 0.1% when the two-day July monetary policy review meeting concludes on Wednesday.
The BoJ decision will be announced at around 3:00 GMT, accompanied by the bank’s quarterly outlook report. Governor Kazuo Ueda’s press conference will follow at 06:30 GMT.
What to expect from the BoJ interest rate decision?
The BoJ is set to stand pat on interest rates for the third consecutive meeting after ending eight years of negative rates in March.
The Japanese central bank is likely to debate whether to raise interest rates at its meeting next week, Reuters reported on Friday, citing four sources familiar with the BoJ's thinking.
One of the sources said, "the decision will be a close call and a hard one to make," given the uncertainty over the consumption outlook. "It's really a judgment call, in terms of whether to act now or later this year," another source said.
Meanwhile, “the Bank of Japan must raise interest rates to prevent excessive declines in the Japanese Yen,” private-sector members of a key government council advocated at a meeting earlier this month where Governor Kazuo Ueda was present, Minutes of the meeting showed on July 24.
Some politicians have called on the BoJ to offer more clarity on its rate hike plan partly to stem the Yen’s fall to multi-decade lows against the US Dollar.
The swaps market is pricing in a 70% chance that the BoJ will hike rates by 10 basis points (bps), lifting the rate target to the 0.1% and 0.2% range.
The BoJ, however, is almost certain that it will scale back its massive JPY6 trillion ($38.14 billion) monthly Japanese government bonds (JGB) purchase programme, as indicated by them at its June policy meeting.
Back in June, the central bank did not make any changes to the monthly JGB buying programme but indicated that they “will decide on specific bond buying reduction plan for the next one-two years at next policy meeting.”
Some respondents urged the BoJ to reduce its monthly government bond purchases to around 2 trillion to 3 trillion Yen ($12.4-$18.7 billion), from the current 6 trillion Yen, a summary of the survey released by the central bank showed on July 9.
Analysts at BBH preview the BoJ policy announcements, noting that “if policymakers really want to prevent the Yen from weakening again, it should deliver a hawkish surprise on both accounts. Updated macro forecasts will be released at this meeting and should also be tweaked to support the case for further tightening. Unfortunately, recent weakness in the economy suggests the BoJ will disappoint this week.”
How could the Bank of Japan interest rate decision affect USD/JPY?
“Recent Yen strength has been driven by expectations of a hawkish BoJ decision this week. If the BoJ disappoints, then much of that rally will quickly reverse. And even if the BoJ delivers, there is potential for a “buy the rumor, sell the fact market reaction,” the BBH analysts added.
Should the BoJ surprise with a 10 bps rate hike or communicate a hawkish message in the policy statement, the Japanese Yen (JPY) could see an extension of the ongoing recovery from 38-year lows against the US Dollar (USD). However, the initial reaction to the policy announcements could quickly turn into a ‘sell the fact’ trading, as explained above.
On the other hand, if the central bank sticks to its previous language, that it would cautiously monitor the likelihood of achieving 2% trend inflation to gauge the next rate increase, it could be read as dovish. The downward revision to the growth and inflation forecasts could also lean in favor of doves. In such a case, the Japanese Yen is expected to come under intense selling pressure, lifting USD/JPY back toward the 160.00 figure.
From a technical perspective, Dhwani Mehta, Asian Session Lead Analyst at FXStreet, notes: “Amid extremely oversold Relative Strength Index (RSI) conditions on the daily chart, a USD/JPY rebound seems inevitable.”
A dovish BoJ policy outlook could revive the Japanese Yen downside, driving the pair toward the 157.85 supply zone, where the 21-day Simple Moving Average (SMA) and 50-day SMA converge. Ahead of that level, the 100-day SMA at 155.65 is set to test bearish commitments. If the upswing gains traction, USD/JPY could aim for a retest of the 160.00 round figure. On the flip side, a sustained move below the 200-day SMA at 151.60 could accelerate the bearish momentum toward the 150.00 psychological barrier,” Dhwani adds.
Economic Indicator
BoJ Interest Rate Decision
The Bank of Japan (BoJ) announces its interest rate decision after each of the Bank’s eight scheduled annual meetings. Generally, if the BoJ is hawkish about the inflationary outlook of the economy and raises interest rates it is bullish for the Japanese Yen (JPY). Likewise, if the BoJ has a dovish view on the Japanese economy and keeps interest rates unchanged, or cuts them, it is usually bearish for JPY.
Read more.Next release: Wed Jul 31, 2024 03:00
Frequency: Irregular
Consensus: 0%
Previous: 0%
Source: Bank of Japan
Bank of Japan FAQs
The Bank of Japan (BoJ) is the Japanese central bank, which sets monetary policy in the country. Its mandate is to issue banknotes and carry out currency and monetary control to ensure price stability, which means an inflation target of around 2%.
The Bank of Japan has embarked in an ultra-loose monetary policy since 2013 in order to stimulate the economy and fuel inflation amid a low-inflationary environment. The bank’s policy is based on Quantitative and Qualitative Easing (QQE), or printing notes to buy assets such as government or corporate bonds to provide liquidity. In 2016, the bank doubled down on its strategy and further loosened policy by first introducing negative interest rates and then directly controlling the yield of its 10-year government bonds.
The Bank’s massive stimulus has caused the Yen to depreciate against its main currency peers. This process has exacerbated more recently due to an increasing policy divergence between the Bank of Japan and other main central banks, which have opted to increase interest rates sharply to fight decades-high levels of inflation. The BoJ’s policy of holding down rates has led to a widening differential with other currencies, dragging down the value of the Yen.
A weaker Yen and the spike in global energy prices have led to an increase in Japanese inflation, which has exceeded the BoJ’s 2% target. With wage inflation becoming a cause of concern, the BoJ looks to move away from ultra loose policy, while trying to avoid slowing the activity too much.
- The Australian Monthly Consumer Price Index is foreseen at 3.8% YoY in June.
- Quarterly CPI inflation is expected to have risen at an annualized pace of 1% in Q2.
- The Reserve Bank of Australia will meet on August 6 to discuss monetary policy.
- The Australian Dollar retains its weak tone, trading against the USD at its lowest in two months.
Australia will publish fresh inflation-related figures on Wednesday, just before the Bank of Japan (BoJ) and the US Federal Reserve (Fed) monetary policy announcements. The Australian Bureau of Statistics (ABS) will release two different inflation gauges on Wednesday. Ahead of the announcement, the Australian Dollar (AUD) trades near a two-month low against the US Dollar, with AUD/USD changing hands just above 0.6500.
On the one hand, the ABS will unveil the quarterly Consumer Price Index (CPI) for the second quarter of 2024 and on the other, the June Monthly CPI, an annual figure that compares price pressures over the previous twelve months. It is worth remembering that the quarterly report includes the Trimmed Mean Consumer Price Index, the Reserve Bank of Australia's (RBA) favorite inflation gauge.
When it met in mid-June, the RBA kept the Cash Rate steady at 4.35%. Policymakers noted they discussed raising rates but ultimately opted to keep them on hold. The board refrained from ruling out a potential rate hike, and policymakers stated they would remain vigilant on inflation amid the unexpected uptick in price pressures in May.
What to expect from Australia’s inflation rate numbers?
The ABS is expected to report that the Monthly CPI rose by 3.8% in the year to June, easing from the 4% posted in May. The quarterly CPI is foreseen rising 1% QoQ and up 3.8% YoY in the second quarter of the year. Finally, the RBA Trimmed Mean CPI, the central bank’s preferred gauge, is expected to rise by 4% YoY in Q2, matching the reading from the previous quarter.
An unexpected increase in inflation figures through the first quarter of 2024 has not only pushed away the odds for an RBA interest rate cut but also revived speculation of a potential hike. Not only does inflation remain above the central bank’s goal, but it also unexpectedly rose in the first quarter of the year.
However, signs of sluggish growth have also become evident and the RBA is well aware of it. “Household consumption growth has been particularly weak,” according to RBA's May Monetary Policy Statement. Furthermore, the document shows that “Recent information indicates that inflation continues to moderate, but is declining more slowly than expected.” Finally, policymakers stated that “returning inflation to target within a reasonable timeframe remains the Board’s highest priority.”
In such a scenario, even with an unexpected uptick in price pressures, the case for a Cash Rate hike should be moderate. Still, speculative interest may opt to price it in, sending the Australian Dollar sharply up against most major rivals.
Softer-than-anticipated CPI figures, on the other hand, should lift the odds for an interest rate trim before year-end, and put the AUD under strong selling pressure.
How could the Consumer Price Index report affect AUD/USD?
The RBA will meet on Tuesday, August 6, and announce a fresh decision on monetary policy. This enhances the relevance of the CPI figures that will be the core of the Board’s decision.
At this point, it is worth remembering that multiple central banks have already trimmed interest rates or will soon do. If the RBA takes too long to cut rates or even chooses to hike them, the AUD may strengthen beyond reasonable to support local growth.
Ahead of the release of the CPI reports, the AUD/USD pair accumulated roughly 300 pips of straight losses from the peak set at 0.6797 by the end of June to the 0.6512 low posted on July 25.
Valeria Bednarik, FXStreet Chief Analyst, says: “The AUD/USD pair shows modest signs of bearish exhaustion after flirting with the 0.6500 figure, yet there are no technical signs of a directional change. The daily chart shows that the pair keeps developing below all its moving averages, with the 20 Simple Moving Average (SMA) heading firmly south above the longer ones. The immediate SMA is the 200, providing dynamic resistance at around 0.6585. Technical indicators, in the meantime, lack directional strength, consolidating at oversold levels.”
Bednarik adds, “The AUD/USD pair needs to extend gains beyond 0.6600 and remain above the level to kick-start a bullish correction. Whether it could continue upward will depend on a break above the 0.6690 level, the 61.8% retracement of the 0.6797/0.6512 slump. A break through the bottom of the range exposes the 0.6470 price zone, while below the latter, the pair could fall towards the 0.6400/30 area.
Inflation FAQs
Inflation measures the rise in the price of a representative basket of goods and services. Headline inflation is usually expressed as a percentage change on a month-on-month (MoM) and year-on-year (YoY) basis. Core inflation excludes more volatile elements such as food and fuel which can fluctuate because of geopolitical and seasonal factors. Core inflation is the figure economists focus on and is the level targeted by central banks, which are mandated to keep inflation at a manageable level, usually around 2%.
The Consumer Price Index (CPI) measures the change in prices of a basket of goods and services over a period of time. It is usually expressed as a percentage change on a month-on-month (MoM) and year-on-year (YoY) basis. Core CPI is the figure targeted by central banks as it excludes volatile food and fuel inputs. When Core CPI rises above 2% it usually results in higher interest rates and vice versa when it falls below 2%. Since higher interest rates are positive for a currency, higher inflation usually results in a stronger currency. The opposite is true when inflation falls.
Although it may seem counter-intuitive, high inflation in a country pushes up the value of its currency and vice versa for lower inflation. This is because the central bank will normally raise interest rates to combat the higher inflation, which attract more global capital inflows from investors looking for a lucrative place to park their money.
Formerly, Gold was the asset investors turned to in times of high inflation because it preserved its value, and whilst investors will often still buy Gold for its safe-haven properties in times of extreme market turmoil, this is not the case most of the time. This is because when inflation is high, central banks will put up interest rates to combat it. Higher interest rates are negative for Gold because they increase the opportunity-cost of holding Gold vis-a-vis an interest-bearing asset or placing the money in a cash deposit account. On the flipside, lower inflation tends to be positive for Gold as it brings interest rates down, making the bright metal a more viable investment alternative.
Economic Indicator
Monthly Consumer Price Index (YoY)
The Monthly Consumer Price Index (CPI), released by the Australian Bureau of Statistics on a monthly basis, measures the changes in the price of a fixed basket of goods and services acquired by household consumers. The indicator was developed to provide inflation data at a higher frequency than the quarterly CPI. The YoY reading compares prices in the reference month to the same month a year earlier. A high reading is seen as bullish for the Australian Dollar (AUD), while a low reading is seen as bearish.
Read more.Next release: Wed Jul 31, 2024 01:30
Frequency: Monthly
Consensus: 3.8%
Previous: 4%
Source: Australian Bureau of Statistics
- NZD/USD made gains in Tuesday's session, rising to the 0.5900 mark.
- The pair seems to be entering a consolidation period guiding between the 0.5850 - 0.6000 channel.
- The daily RSI escapes the oversold territory, suggesting some cooling off from bearish momentum.
In Tuesday's trading session, the NZD/USD pair advanced upwards to 0.5900, marking a modest recovery of a 0.40% gain. This follows a bearish July, which saw the pair losing over 4% of its value. Traders had to navigate through a barrage of selling signals especially with the bearish crossover of the 20-day Simple Moving Average (SMA) at 0.6050 with the 100-day SMA last week. However, signs now suggest that the pair may be entering a consolidation period.
The daily Relative Strength Index (RSI) has now moved from oversold territory, signaling a potential easing of the selling pressure. Meanwhile, the Moving Average Convergence Divergence (MACD) continues to print flat red bars, underlining the overall bearish outlook, though indicating a possible moderation of the traction.
NZD/USD daily chart
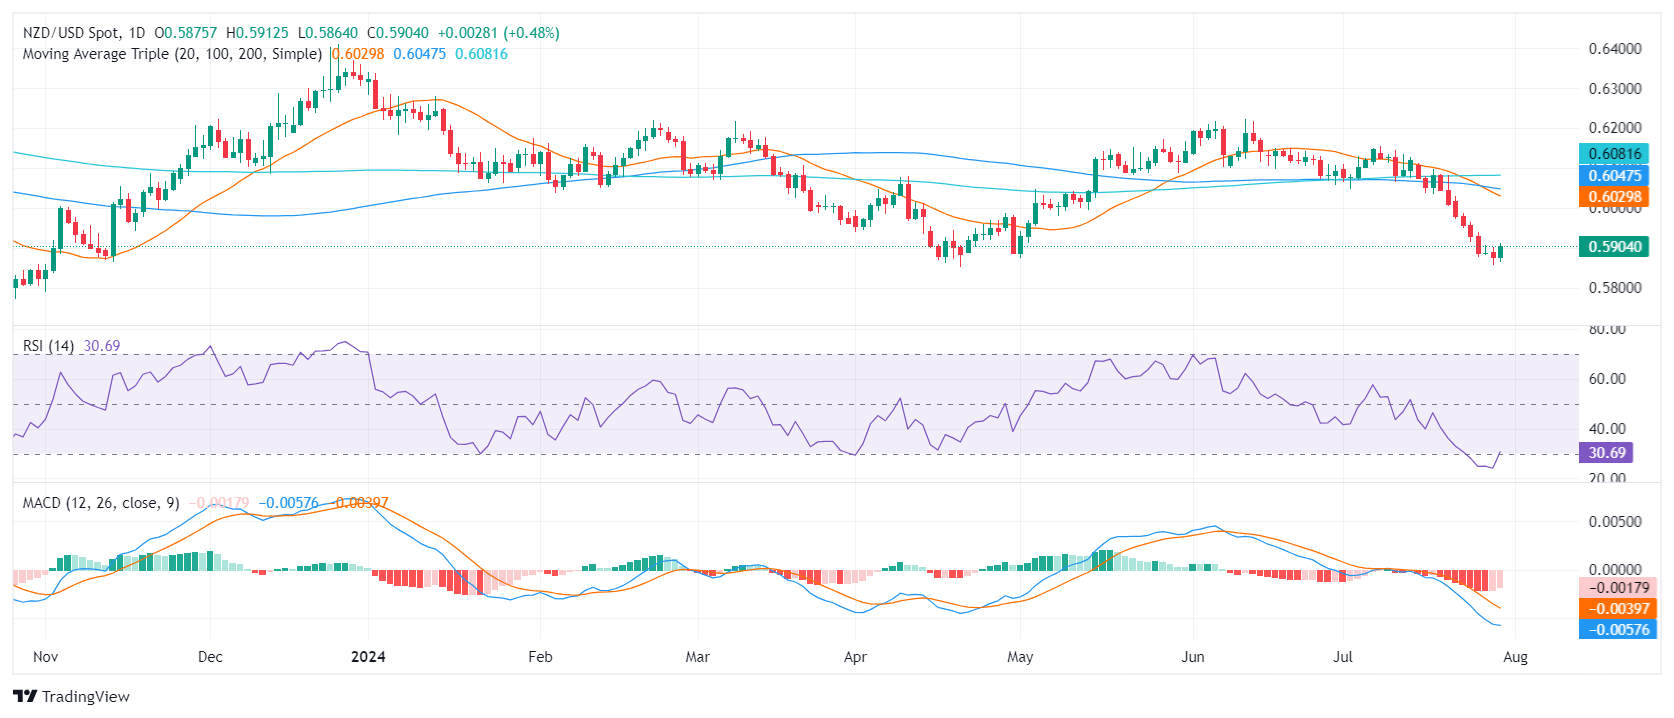
The recently defined support zone is found within the 0.5850 - 0.5900 range, which also serves as a consolidation channel. Resistance is now at the former supports of 0.5950, 0.6000, and 0.6050. For the next sessions, if the buyers can hold their ground above this support area, they could prepare for a possible upward journey. Conversely, a move below this level could see the pair revert back to the bearish trend.
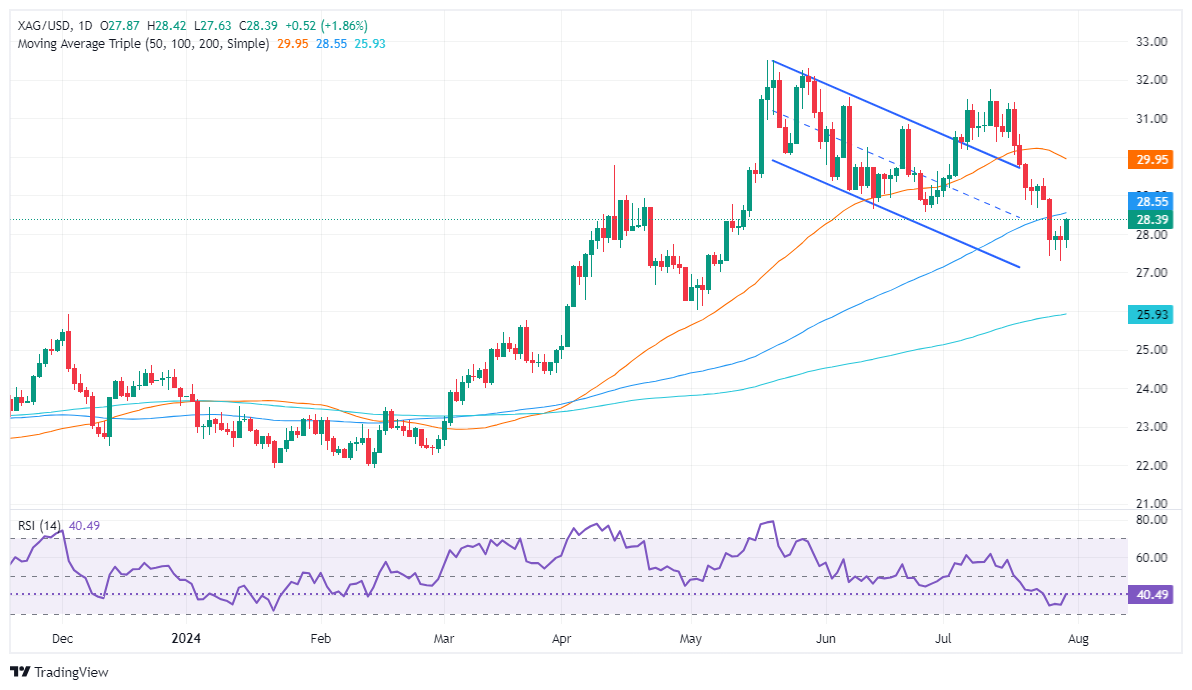
- Silver price rallies above $28.00, bouncing from daily low of $27.63 amid Israel-Hezbollah conflict.
- Technical outlook shows bearish RSI; support levels at $28.00 and July 29 low of $27.31.
- Resistance at 100-DMA ($28.54) and 50-DMA ($29.93) could be tested if gains continue.
Silver's price rallied sharply by more than 1.80% on Tuesday amid rising tensions in the Middle East after Israel retaliated against Hezbollah’s strike over the weekend. Although US data revealed solid results, the non-yielding metal advanced, as the XAG/USD traded at $28.17 after hitting a daily low of $27.63.
XAG/USD Price Analysis: Technical outlook
Silver seems to have consolidated at around $28.50 after diving into a two-month low of $27.31. The grey metal fall below the $29.00 figure and clearing support levels like the 50 and 100-day moving averages (DMAs) changed its bias from neutral upwards to downwards. This is confirmed by the Relative Strength Index (RSI) hovering at bearish territory, which could pave the way for further losses.
If XAG/USD drops below $28.00, this can exacerbate a drop to the July 29 low of $27.31. A breach of the latter will expose $27.00, followed by the 200-DMA at $25.92.
Conversely, if XAG/USD extends its recent gains above the 100-DMA at $28.54, the $29.00 figure will be exposed. On further strength, the next resistance would be the 50-DMA at $29.93, before testing the $30.00 mark.
XAG/USD Price Action – Daily Chart
Silver FAQs
Silver is a precious metal highly traded among investors. It has been historically used as a store of value and a medium of exchange. Although less popular than Gold, traders may turn to Silver to diversify their investment portfolio, for its intrinsic value or as a potential hedge during high-inflation periods. Investors can buy physical Silver, in coins or in bars, or trade it through vehicles such as Exchange Traded Funds, which track its price on international markets.
Silver prices can move due to a wide range of factors. Geopolitical instability or fears of a deep recession can make Silver price escalate due to its safe-haven status, although to a lesser extent than Gold's. As a yieldless asset, Silver tends to rise with lower interest rates. Its moves also depend on how the US Dollar (USD) behaves as the asset is priced in dollars (XAG/USD). A strong Dollar tends to keep the price of Silver at bay, whereas a weaker Dollar is likely to propel prices up. Other factors such as investment demand, mining supply – Silver is much more abundant than Gold – and recycling rates can also affect prices.
Silver is widely used in industry, particularly in sectors such as electronics or solar energy, as it has one of the highest electric conductivity of all metals – more than Copper and Gold. A surge in demand can increase prices, while a decline tends to lower them. Dynamics in the US, Chinese and Indian economies can also contribute to price swings: for the US and particularly China, their big industrial sectors use Silver in various processes; in India, consumers’ demand for the precious metal for jewellery also plays a key role in setting prices.
Silver prices tend to follow Gold's moves. When Gold prices rise, Silver typically follows suit, as their status as safe-haven assets is similar. The Gold/Silver ratio, which shows the number of ounces of Silver needed to equal the value of one ounce of Gold, may help to determine the relative valuation between both metals. Some investors may consider a high ratio as an indicator that Silver is undervalued, or Gold is overvalued. On the contrary, a low ratio might suggest that Gold is undervalued relative to Silver.
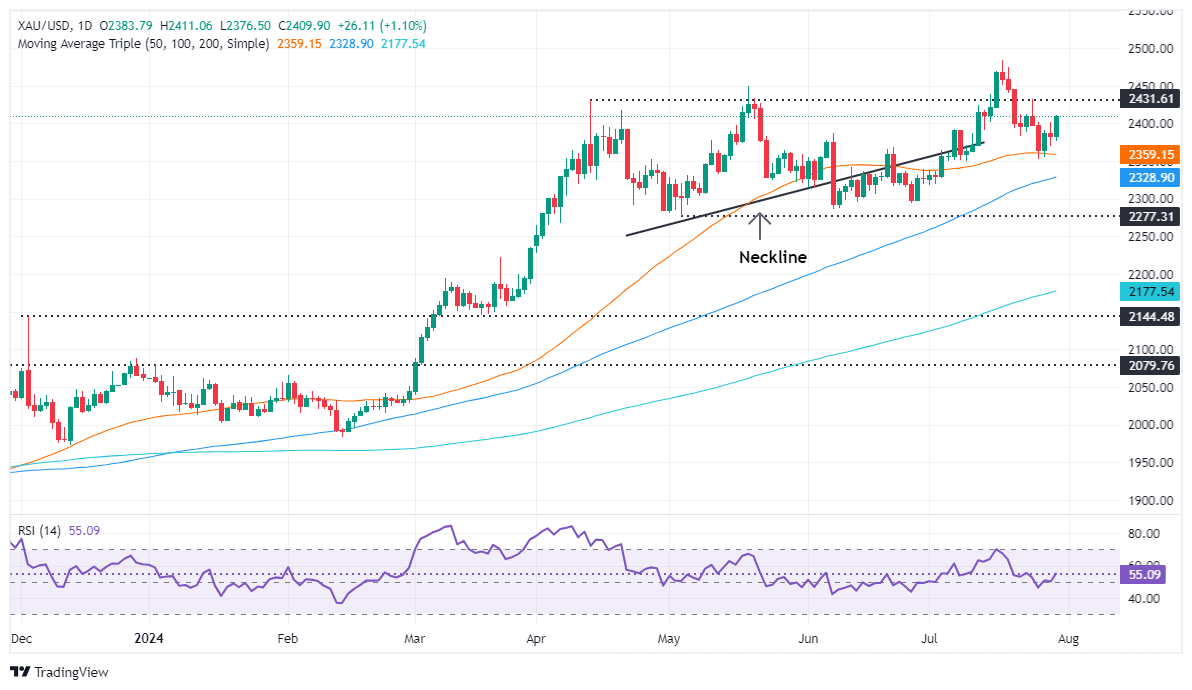
- Gold price surpasses $2,400 after Israel's attack on Lebanon.
- US Treasury yield dip and weak USD support Gold price despite strong US job market data.
- Europe’s largest economy, Germany, enters recession, fueling ECB rate cut expectations in September.
Gold prices jumped during Tuesday’s North American session on news of Israel’s attack on Lebanon, which sent the XAU/USD spot price soaring above the $2,400 figure. Earlier, the golden metal hovered around the latter, even though solid US data reinforced the tightness of the jobs market. The XAU/USD trades at $2,404, up by more than 0.80%.
Sentiment is mixed, though a dip in US Treasury bond yields and the Greenback sponsored bullion’s leg up as market participants brace for the Federal Reserve (Fed) monetary policy decision on Wednesday.
Economic data from Europe witnessed Germany, the largest economy in the block, entering recessionary territory following weaker-than-expected preliminary Gross Domestic Product (GDP) Q2 2024 readings. This could spur a reaction from the European Central Bank (ECB), which is expected to reduce interest rates in September.
Meanwhile, geopolitical risks spurred Gold’s jump above $2,400 after Israel launched an attack on Beirut’s southern suburbs, aimed at targeting a Hezbollah commander, according to sources cited by Reuters.
Across the pond, the Fed is expected to hold rates flat but to deliver a dovish message that could hint to market participants at the beginning of the easing cycle.
Nevertheless, US jobs data revealed on Tuesday could deter the Fed from reacting dovishly after job openings for June exceeded estimates despite trailing revised figures of May upward. In fact, market players expect Fed Chair Jerome Powell to push back against aggressive monetary policy pricing by the financial markets.
Besides that, investors are eyeing the release of the Institute for Supply Management (ISM) Manufacturing PMI and the Nonfarm Payrolls (NFP) report, both for July figures.
Daily digest market movers: Gold price shrugs off strong US jobs data
- US Job Openings and Labor Turnover Survey (JOLTS) reported 8.184 million job openings, exceeding estimates of 8 million but slightly lower than May’s revised figure of 8.23 million.
- Conference Board reveals that Consumer Confidence in July unexpectedly rose to 100.3, surpassing the consensus of 99.7 and June’s downwardly revised figure of 97.8 from 100.4.
- Last week’s US inflation data indicated continued progress toward the 2% target; however, inflation appears stickier than anticipated as June's Core PCE figures exceeded estimates for both monthly and yearly numbers.
- Data from the Chicago Board of Trade (CBOT) indicates that traders are pricing in 54 basis points (bps) of easing toward the end of the year, according to the December 2024 fed funds rate futures contract.
Technical analysis: Gold price climbs above $2,400
Gold price remains upwardly biased, and if it achieves a daily close above $2,400 that could pave the way for further upside. Momentum indicates the path of least resistance is skewed to the upside, yet the Fed’s decision or Powell press conference could drag prices lower.
If XAU/USD buyers reclaim the psychological $2,450 area, that could sponsor a leg up to challenge the all-time high at around $2,483, followed by the $2,500 mark.
On the flip side, if XAU/USD falls below $2,400, the next support would be the 50-day Simple Moving Average (SMA) at $2,358. Once cleared, further losses are on the cards.
The next support would be the July 25 daily low of $2,353. Once those levels are removed, the 100-DMA would be up next at $2,326, ahead of diving to the $2,300 mark.
Gold FAQs
Gold has played a key role in human’s history as it has been widely used as a store of value and medium of exchange. Currently, apart from its shine and usage for jewelry, the precious metal is widely seen as a safe-haven asset, meaning that it is considered a good investment during turbulent times. Gold is also widely seen as a hedge against inflation and against depreciating currencies as it doesn’t rely on any specific issuer or government.
Central banks are the biggest Gold holders. In their aim to support their currencies in turbulent times, central banks tend to diversify their reserves and buy Gold to improve the perceived strength of the economy and the currency. High Gold reserves can be a source of trust for a country’s solvency. Central banks added 1,136 tonnes of Gold worth around $70 billion to their reserves in 2022, according to data from the World Gold Council. This is the highest yearly purchase since records began. Central banks from emerging economies such as China, India and Turkey are quickly increasing their Gold reserves.
Gold has an inverse correlation with the US Dollar and US Treasuries, which are both major reserve and safe-haven assets. When the Dollar depreciates, Gold tends to rise, enabling investors and central banks to diversify their assets in turbulent times. Gold is also inversely correlated with risk assets. A rally in the stock market tends to weaken Gold price, while sell-offs in riskier markets tend to favor the precious metal.
The price can move due to a wide range of factors. Geopolitical instability or fears of a deep recession can quickly make Gold price escalate due to its safe-haven status. As a yield-less asset, Gold tends to rise with lower interest rates, while higher cost of money usually weighs down on the yellow metal. Still, most moves depend on how the US Dollar (USD) behaves as the asset is priced in dollars (XAU/USD). A strong Dollar tends to keep the price of Gold controlled, whereas a weaker Dollar is likely to push Gold prices up.
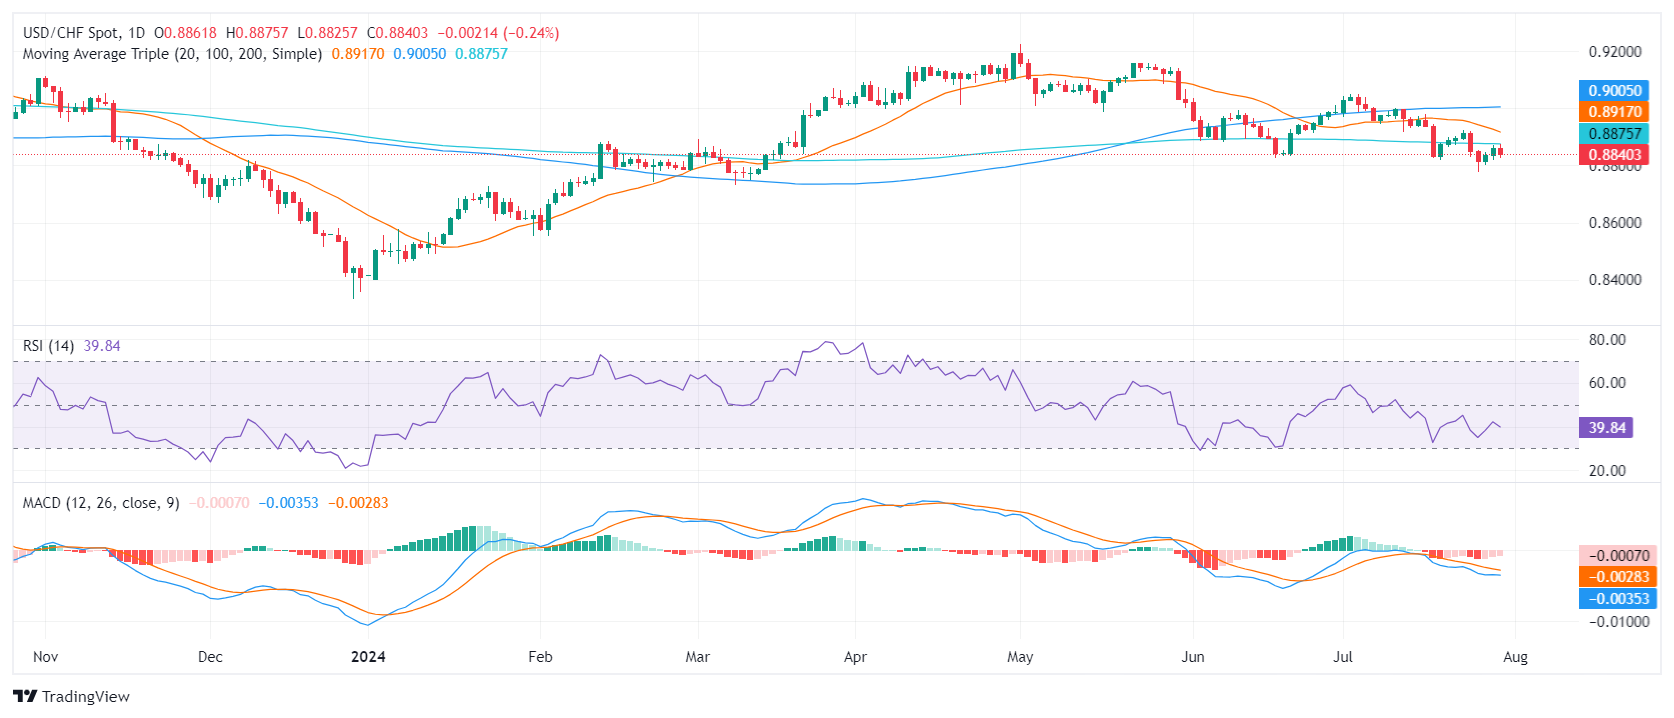
- USD/CHF inches lower to 0.8845 after gaining in the previous two sessions.
- US Consumer Confidence Index improved and labor opening showed encouraging figures.
- Market anticipations for a Fed rate cut in September remain high, challenging the USD.
In Tuesday's trading session, the USD/CHF pair declined by 0.20%, edging lower at around 0.8845. This decline came despite improving US consumer sentiment and strong job openings data, which led to a generally strong performance for the Greenback on Tuesday. Markets are now on high alert awaiting the outcome of the Federal Reserve (Fed) meeting scheduled for Wednesday.
The Conference Board's Consumer Confidence Index rose in July to 100.30, up from a downwardly revised 97.8 in June, showing a marginal improvement in US consumer sentiment. The US Bureau of Labor Statistics (BLS) also reported in its Job Openings and Labor Turnover Survey (JOLTS) that there were 8.184M job openings on the last business day of June slightly down from the revised 8.23 M in May, but still surpassing the market expectation of 8.03M.
Looking ahead, while a Fed rate hold is widely anticipated on Wednesday due to the robust US economic performance, investors expect that the bank will leave the door open for a September cut. In line with that markets bet on 80% odds of a rate cut but incoming labor market data this week, will guide those expectations.
USD/CHF technical analysis
The technical outlook for USD/CHF has turned from neutral to bearish after getting rejected by the 200-day Simple Moving Average (SMA) during Tuesday's session. The pair continues trading below the 20, 100, and 200-day SMAs, which suggest ongoing selling pressure. In addition, the Relative Strength Index (RSI) and the Moving Average Convergence Divergence (MACD) remain in the red, pointing to steady selling pressure.
The support levels remain at 0.8800, 0.8750, and 0.8730, while the resistance levels are at 0.8850, 0.8870, and 0.89000.
USD/CHF daily chart
- Aussie remains weak as markets await inflation data, Retail Sales from Australia.
- Soft China outlook generates concerns for Australian economy.
- RBA’s hawkish outlook might bail out the Aussie.
The Aussie continues the week on a soft trajectory with the AUD/USD declining by 0.20% to 0.6535 ahead of Retail Sales and inflation data that will guide market expectations further on the Reserve Bank of Australia’s (RBA) next moves. In the meantime, the economic concerns tied to the Chinese economy keep the Australian currency restrained.
With the Australian economy under pressure, inflation persistently above bounds continues to encourage the RBA to postpone rate cuts. According to forecasts, the RBA is expected to be among the tail-enders of the G10 nations who introduce a rate cut, which should limit the Aussie’s downside.
Daily digest market movers: Aussie expected to continue its weakness with anticipation of Inflation and Retail Sales data
- Perpetual 'risk-off' sentiment persists with Australia's economic bearing heavily influenced by worries over Chinese economic slowdowns. Attention will turn toward June's and Q2 CPI data on Wednesday.
- Similar to Q1, Australia’s Q2 headline Consumer Price Index (CPI) is projected to manifest a rise of 1.0% QoQ while anticipating an acceleration to 3.8% YoY from the previous 3.6%. Concurrently, the June headline CPI is predicted to drop to 3.8% YoY.
- With the inflation rate substantially outreaching the 2-3% target range, the RBA is projected not to hastily alter its policy. In that sense, the swaps market is seeing the first 25 bps cut next summer.
- Q2 will also watch the release of real Retail Sales data on Tuesday. Retail Sales volume for Q2 is predicted to show a less severe decline of 0.2% QoQ, comparatively lesser than Q1's 0.4%.
AUD/USD technical analysis: A sustained bearish outlook persists, fundamentals might help in short term
The AUD/USD's continuation below the 20, 100 and 200-day Simple Moving Average (SMA) poses concerns, hinting at a likely prolongment of the bearish trend.
While indicator signals are still deeply rooted in the negative, the oversold situation might lead to a correction. However, the bullish momentum remains weak, intimating at a potential period of sideways trade barring any fundamental catalysts. The mentioned inflation and Retail Sales figures might open the door for an upward move.
Key support levels have revamped to 0.6530 and 0.6500, while resistance levels remain at 0.6600 (200-day SMA), 0.6610 and 0.6630.
Australian Dollar FAQs
One of the most significant factors for the Australian Dollar (AUD) is the level of interest rates set by the Reserve Bank of Australia (RBA). Because Australia is a resource-rich country another key driver is the price of its biggest export, Iron Ore. The health of the Chinese economy, its largest trading partner, is a factor, as well as inflation in Australia, its growth rate and Trade Balance. Market sentiment – whether investors are taking on more risky assets (risk-on) or seeking safe-havens (risk-off) – is also a factor, with risk-on positive for AUD.
The Reserve Bank of Australia (RBA) influences the Australian Dollar (AUD) by setting the level of interest rates that Australian banks can lend to each other. This influences the level of interest rates in the economy as a whole. The main goal of the RBA is to maintain a stable inflation rate of 2-3% by adjusting interest rates up or down. Relatively high interest rates compared to other major central banks support the AUD, and the opposite for relatively low. The RBA can also use quantitative easing and tightening to influence credit conditions, with the former AUD-negative and the latter AUD-positive.
China is Australia’s largest trading partner so the health of the Chinese economy is a major influence on the value of the Australian Dollar (AUD). When the Chinese economy is doing well it purchases more raw materials, goods and services from Australia, lifting demand for the AUD, and pushing up its value. The opposite is the case when the Chinese economy is not growing as fast as expected. Positive or negative surprises in Chinese growth data, therefore, often have a direct impact on the Australian Dollar and its pairs.
Iron Ore is Australia’s largest export, accounting for $118 billion a year according to data from 2021, with China as its primary destination. The price of Iron Ore, therefore, can be a driver of the Australian Dollar. Generally, if the price of Iron Ore rises, AUD also goes up, as aggregate demand for the currency increases. The opposite is the case if the price of Iron Ore falls. Higher Iron Ore prices also tend to result in a greater likelihood of a positive Trade Balance for Australia, which is also positive of the AUD.
The Trade Balance, which is the difference between what a country earns from its exports versus what it pays for its imports, is another factor that can influence the value of the Australian Dollar. If Australia produces highly sought after exports, then its currency will gain in value purely from the surplus demand created from foreign buyers seeking to purchase its exports versus what it spends to purchase imports. Therefore, a positive net Trade Balance strengthens the AUD, with the opposite effect if the Trade Balance is negative.
The FX universe navigated an inconclusive session on Tuesday amidst rising prudence ahead of the BoJ and Fed policy meetings on July 31. While the Fed is expected to keep rates on hold, Chief Powell could shed further details regarding a potential rate cut in September. Consensus, in the meantime, appears pretty divided when it comes to the BoJ.
Here is what you need to know on Wednesday, July 31:
The USD Index (DXY) gave away initial gains and settled in the mid-104.00s against the backdrop of further decline in US yields across the curve. The Fed meets on July 31 and is seen keeping rates unchanged. Extra releases on the US docket include the weekly Mortgage Applications, the Employment Cost index, Pending Home Sales and the ADP Employment Change.
EUR/USD kept the bearish performance and briefly pierced the 1.0800 support to print four-week lows just to regain some balance afterwards. Germany’s Retail Sales and the labour market report are due on July 31 seconded by preliminary Inflation Rate in the broader euro area.
GBP/USD remained well on the defensive in the low-1.2800s as investors continued to price in a potential rate cut by the BoE on August 1. There are no data releases scheduled on the UK calendar on July 31.
Renewed buying interest in the Japanese yen prompted USD/JPY to fade the earlier uptick and refocus on the downside around the 153.30 zone. The BoJ will decide on rates on July 31. In addition, flash Industrial Production is due along with Retail Sales, Consumer Confidence and Housing Starts.
AUD/USD seems to have entered a consolidative theme near 0.6530, always on the back of Chinese concerns and persistent weakness in the commodity space. The Inflation Rate, Housing Credit, Retail Sales and the RBA’s Monthly CPI Indicator are all expected on July 31.
Another negative session dragged WTI prices to fresh lows in the sub-$75.00 region per barrel, as traders assessed incessant demand concerns from China.
Gold prices printed acceptable gains and approached the $2,400 mark per ounce troy amidst the irresolute price action in the US dollar and declining yields. Silver regained some composure and reversed Monday’s pessimism, reclaiming the area beyond the $28.00 barrier per ounce.
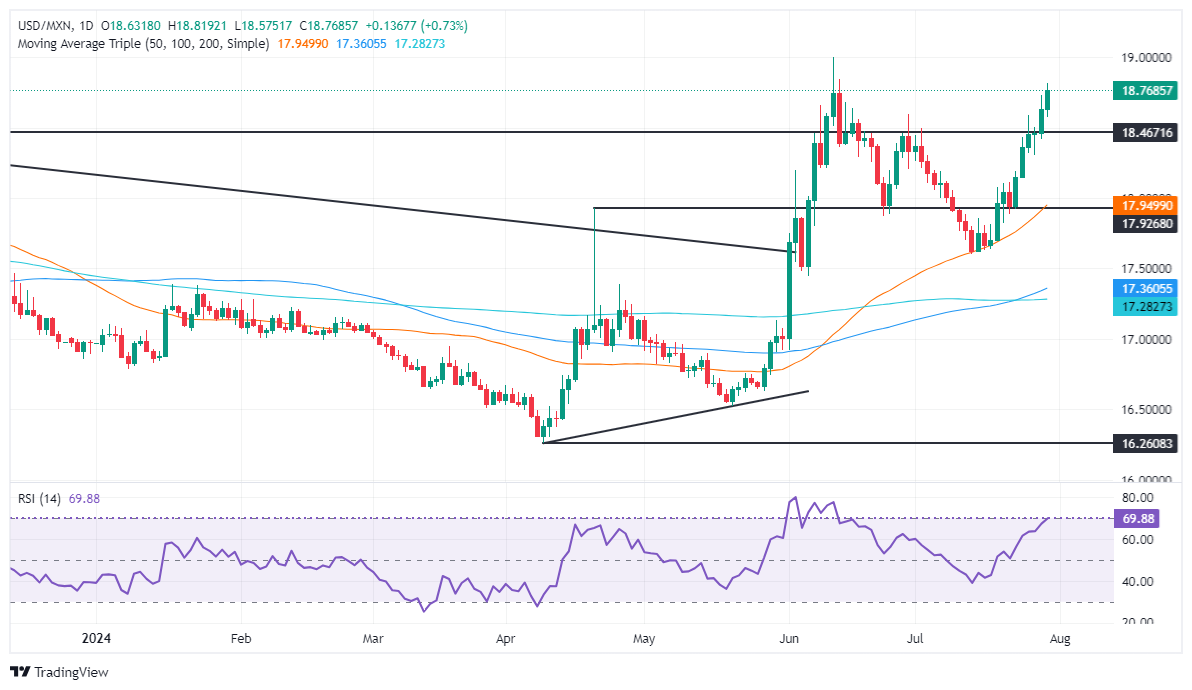
- Mexican Peso slumps to weekly low of 18.81 as disappointing GDP data sparks USD buying.
- Mexican Q2 GDP growth at 0.2% QoQ, below estimates of 0.4%, trails Q1's 0.3%.
- Economic slowdown increases odds of Bank of Mexico rate cut; next meeting on August 8.
The Mexican Peso extended its agony and printed losses of more than 0.80% against the Greenback after the preliminary release of the Gross Domestic Product (GDP) for Q2 2024. It was slightly below estimates and trailed the first quarter reading. Hence, traders bought the US Dollar as seen by the USD/MXN trading at 18.79, refreshing seven-week highs after bouncing off daily lows of 18.41.
Mexico’s Instituto Nacional de Estadística Geografia e Informatica, known as INEGI by its Spanish acronym, revealed that GDP rose 0.2% QoQ, below estimates of 0.4% and trailing Q1’s 0.3% increase. Although the economy achieved 11 quarters of expansion, growth has decelerated, raising the chances of an interest rate cut by the Bank of Mexico (Banxico).
Banxico lifted rates as high as 11.25% but cut them to 11.00% in March, laying the ground for additional adjustments. However, the latest inflation data refrained the central bank’s Governing Council from easing policy.
The Mexican central bank's next meeting is on August 8, and economists cited by Reuters noted that GDP data could influence policymakers to lower borrowing costs.
Andres Abadia of Pantheon Macroeconomics said, “Real GDP growth has slowed rapidly in recent quarters, which will add to the view that Banxico will have to cut interest rates gradually over upcoming policy meetings.”
A solid US JOLTS report also influenced the USD/MXN in the United States (US) as job openings dropped yet exceeded estimates, and an upward revision to May figures showed the labor market's resilience.
Daily digest market movers: Mexican Peso is heavy as the economy slows down
- Mexico’s GDP for Q2 2024 grew 2.2% YoY on its preliminary reading, above estimates of 2% and the previous quarter's 1.6% expansion.
- Last week, Mexico’s June Balance of Trade was $-1.073 billion, missing the consensus of $1 billion.
- US Job Openings and Labor Turnover Survey (JOLTs) came at 8.184 million, exceeding estimates of 8 million, but were lower than May’s revision up to 8.23 million.
- Conference Board revealed that Consumer Confidence in July surprisingly rose to 100.3, exceeding the 99.7 consensus and June’s downward revision from 100.4 to 97.8.
- Data by the Chicago Board of Trade (CBOT) shows that traders are pricing 54 basis points (bps) of easing toward the end of the year, as shown by the December 2024 fed funds rate futures contract.
Technical analysis: Mexican Peso dives as USD/MXN rises toward 18.80
The USD/MXN exotic pair is set to test the year-to-date (YTD) high of 18.99 after refreshing multi-week highs of 18.81. Momentum as depicted by the Relative Strength Index (RSI) supports buyers, with the RSI approaching overbought conditions.
If USD/MXN surpasses the YTD high at 18.99, that could open the door to test 19.00. Once surpassed, the next resistance would be March 20, 2023, peaking at 19.23 before challenging 19.50.
Conversely, if USD/MXN retreats below 18.00, it would pave the way to challenge the 50-day Simple Moving Average (SMA) at 17.93, the first support level. The next support would be the latest cycle low of 17.58, the July 12 high turned support. A breach of this level will expose the January 23 peak at 17.38.
Mexican Peso FAQs
The Mexican Peso (MXN) is the most traded currency among its Latin American peers. Its value is broadly determined by the performance of the Mexican economy, the country’s central bank’s policy, the amount of foreign investment in the country and even the levels of remittances sent by Mexicans who live abroad, particularly in the United States. Geopolitical trends can also move MXN: for example, the process of nearshoring – or the decision by some firms to relocate manufacturing capacity and supply chains closer to their home countries – is also seen as a catalyst for the Mexican currency as the country is considered a key manufacturing hub in the American continent. Another catalyst for MXN is Oil prices as Mexico is a key exporter of the commodity.
The main objective of Mexico’s central bank, also known as Banxico, is to maintain inflation at low and stable levels (at or close to its target of 3%, the midpoint in a tolerance band of between 2% and 4%). To this end, the bank sets an appropriate level of interest rates. When inflation is too high, Banxico will attempt to tame it by raising interest rates, making it more expensive for households and businesses to borrow money, thus cooling demand and the overall economy. Higher interest rates are generally positive for the Mexican Peso (MXN) as they lead to higher yields, making the country a more attractive place for investors. On the contrary, lower interest rates tend to weaken MXN.
Macroeconomic data releases are key to assess the state of the economy and can have an impact on the Mexican Peso (MXN) valuation. A strong Mexican economy, based on high economic growth, low unemployment and high confidence is good for MXN. Not only does it attract more foreign investment but it may encourage the Bank of Mexico (Banxico) to increase interest rates, particularly if this strength comes together with elevated inflation. However, if economic data is weak, MXN is likely to depreciate.
As an emerging-market currency, the Mexican Peso (MXN) tends to strive during risk-on periods, or when investors perceive that broader market risks are low and thus are eager to engage with investments that carry a higher risk. Conversely, MXN tends to weaken at times of market turbulence or economic uncertainty as investors tend to sell higher-risk assets and flee to the more-stable safe havens.
- US Dollar maintains momentum ahead of Fed decision and labor market update.
- US JOLTs and CB Consumer Confidence figures exceed expectations.
- Fed is expected to stay data-dependent and keep possibilities open for a September cut.
The US Dollar, measured by the DXY index, continues its upward trend. Despite uncertainties hanging in the air over the Federal Reserve’s (Fed) next steps, optimism about the robustness of the US economy is helping the Greenback to gain ground. The forthcoming decision from the Fed due on Wednesday alongside the labor market data expected this week will be pivotal indicators for the market.
The US is starting to show signs of disinflation that strengthen the market's confidence in a possible rate cut in September. However, the overall economy remains resilient as evidenced by the incoming data, which might delay the pivot to rate cuts.
Daily digest market movers: US Dollar firms up following upbeat labor and consumer confidence data.
- US consumer sentiment improved slightly in July with the Conference Board's Consumer Confidence Index rising to 100.3 from a downwardly revised 97.8 in June.
- Present Situation Index had a slight decline to 133.6 from 135.5, as the Expectations Index climbed to 78.2 from 72.8.
- US Bureau of Labor Statistics (BLS) reported in its Job Openings and Labor Turnover Survey (JOLTS) on Tuesday that on the last business day of June there were 8.184 million job openings.
- That figure exceeded the market expectation of 8.03 million and follows the 8.23 million openings (revised from 8.14 million) reported in May.
- Week’s highlight will be the Federal Open Market Committee (FOMC) meeting, which ends on Wednesday with a widely expected hold for interest rates.
- US economy’s strong performance negates the immediate need for Fed to lower interest rates, but investors expected the Fed to keep possibilities open for a rate cut at the September FOMC meeting.
DXY technical outlook: Improving signs are observed as the index rebounds toward 20-day SMA
The DXY index, after rebounding from the 200-day SMA, has now successfully climbed above the 20-day Simple Moving Average (SMA). The key signals such as the Relative Strength Index (RSI) and Moving Average Convergence Divergence (MACD), although still remaining on the negative side, are inching toward the positive side, brightening the outlook.
There is noticeable support at 104.50, one more than Monday's 104.30 level, and resistance is eyed at 104.70 and higher around 105.00.
US Dollar FAQs
The US Dollar (USD) is the official currency of the United States of America, and the ‘de facto’ currency of a significant number of other countries where it is found in circulation alongside local notes. It is the most heavily traded currency in the world, accounting for over 88% of all global foreign exchange turnover, or an average of $6.6 trillion in transactions per day, according to data from 2022. Following the second world war, the USD took over from the British Pound as the world’s reserve currency. For most of its history, the US Dollar was backed by Gold, until the Bretton Woods Agreement in 1971 when the Gold Standard went away.
The most important single factor impacting on the value of the US Dollar is monetary policy, which is shaped by the Federal Reserve (Fed). The Fed has two mandates: to achieve price stability (control inflation) and foster full employment. Its primary tool to achieve these two goals is by adjusting interest rates. When prices are rising too quickly and inflation is above the Fed’s 2% target, the Fed will raise rates, which helps the USD value. When inflation falls below 2% or the Unemployment Rate is too high, the Fed may lower interest rates, which weighs on the Greenback.
In extreme situations, the Federal Reserve can also print more Dollars and enact quantitative easing (QE). QE is the process by which the Fed substantially increases the flow of credit in a stuck financial system. It is a non-standard policy measure used when credit has dried up because banks will not lend to each other (out of the fear of counterparty default). It is a last resort when simply lowering interest rates is unlikely to achieve the necessary result. It was the Fed’s weapon of choice to combat the credit crunch that occurred during the Great Financial Crisis in 2008. It involves the Fed printing more Dollars and using them to buy US government bonds predominantly from financial institutions. QE usually leads to a weaker US Dollar.
Quantitative tightening (QT) is the reverse process whereby the Federal Reserve stops buying bonds from financial institutions and does not reinvest the principal from the bonds it holds maturing in new purchases. It is usually positive for the US Dollar.
USD/CNH has also stabilized around 7.26-7.27 ahead of FOMC, DBS FX & credit strategist Chang Wei Liang notes.
USD/CNH to break below 7.26-7.27
“PBOC has maintained its stable RMB policy with CNY fixings being kept near 7.13, even after it eased monetary policy in the last week. The 1Y MLF rate was cut by 20bps last Thursday to 2.30%, following a 10bps LPR cut.”
“China PMI releases tomorrow may give little respite for the RMB as activity looks to stay sluggish. A more durable downshift in USD/CNH will depend on a broad USD reversal, with Fed guidance this week being front and centre.”
A significant increase in demand for Gold in India can be observed right now, Commerzbank’s commodity analyst Carsten Fritsch notes.
India’s hunger for Gold becomes stronger
“The reduction in the Gold import tax and the resulting fall in local Gold prices to a 4-month low has led to a significant increase in demand for Gold in India. As a result, the price premiums demanded by dealers in India over official domestic prices, including the import and sales taxes payable, have risen to up to USD 20 per troy ounce.”
“According to Reuters, this is the highest level in ten years. Last week, before the tax cut, they were still offering discounts of up to $65, which were the highest for 28 months. By contrast, local Gold prices in other Asian countries are less volatile.”
“In China, the discounts offered by dealers compared to the global market level are still close to a 2-year low, with the range varying between a discount of $10 and a premium of $2. This indicates that demand remains subdued. In Japan, Gold was sold at discounts of $3, while in Singapore and Hong Kong Gold was offered at either slight premiums or discounts.”
Demand for Gold in China weakened in the first half of the year, Commerzbank’s commodity analyst Carsten Fritsch notes.
Two opposing trends in Gold demand
“According to the China Gold Association, demand for Gold in China amounted to 524 tons, 5.6% lower than in the same period of the previous year. There were two opposing trends. Demand for jewelry fell by just under 27% to 270 tons. According to the CGA, this was due to the sharp rise in prices, which also led to a significant decline in jewelry processing.”
“According to Bloomberg calculations based on CGA data, demand for jewelry even fell by more than 50% in the second quarter. This contrasted with a 46% increase in demand for bars and coins to 214 tons. This was due to stronger demand from Chinese households for Gold as a safe haven. The problems on the Chinese property market and falling interest rates are also likely to have played a role.”
“Accordingly, jewelry demand and demand for bars and coins have clearly converged in terms of volume. The share of jewelry demand in total demand fell to 51.6%, while bars and coins accounted for 40.8%. This development is consistent with the figures in the latest report of the World Gold Council.”
At the end of last week, the world's largest Copper mine producer based in Chile reported an 8.4% year-on-year decline in Copper output for the first half of the year, Commerzbank’s commodity analyst Barbara Lambrecht notes.
Demand concerns weigh on Copper despite low production
“Although the company was optimistic that production would recover in the second half of the year, the group is danger of missing the slight increase in production forecast for the year as a whole. According to Bloomberg Intelligence, it could thus lose its first place to the second-largest producer to date.”
“But new production losses are also looming here: The union has called on workers at the world's largest Copper mine, Escondida, that has a capacity of 1.35 million tons of Copper ore, to reject the employers' offer and go on strike. If the workers do reject the offer, there does not necessarily have to be an immediate strike, as both parties have the right to ask the government for mediation.”
“The fact that the Copper price came under renewed pressure despite disappointing production reports and the threat of production losses is likely due to ongoing demand concerns. The sentiment indicators from China's manufacturing sector due in the middle of the week are also unlikely to provide a tailwind.”
European gas price has risen in recent days, but the situation in the market is likely to remain relaxed in the short term, Commerzbank’s commodity analyst Carsten Fritsch notes.
Demand for natural gas in Europe remains weak
“Although the European gas price has risen in recent days due to rising temperatures and the associated higher demand for air conditioning, the situation is likely to remain relaxed in the short term. This is because gas storage facilities are already 84 percent full, which is a good 7.5 percentage points more than usual at this time of year.”
“At the same time, according to Reuters, the second-largest US liquefaction terminal Freeport, which had to be closed on 7 July due to Hurricane Beryl, has been operating at full capacity again since Sunday. In addition, according to the IEA's quarterly report on the gas market, the US, Europe's largest LNG supplier, will bring further export capacities into operation in the second half of the year.”
“Demand in Europe remains weak. However, even if storage levels are likely to be well filled by the start of the withdrawal phase against this backdrop, the risks should not be ignored: On the one hand, according to the think tank Bruegel, the EU still sourced around 11 percent of its gas imports from Russia in the first half of the year. On the other hand, China's demand for LNG has recently increased significantly.”
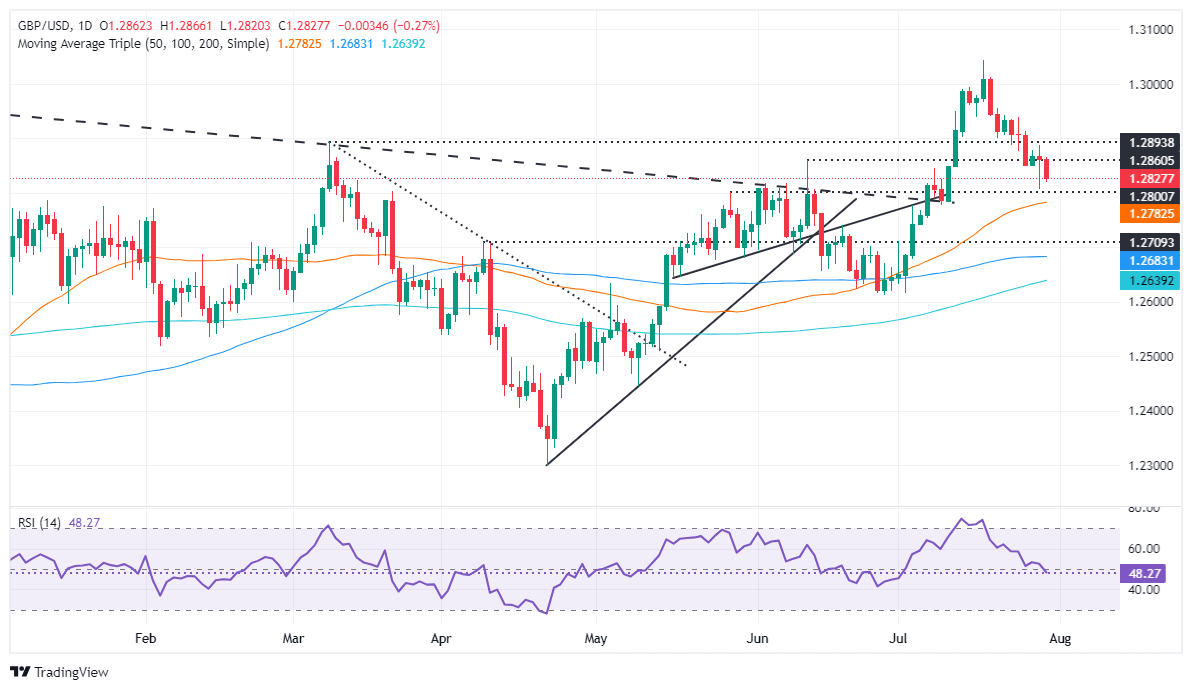
- GBP/USD declines from daily high of 1.2866 amid strong US labor market data.
- Technical outlook shows bearish momentum, with key support at 1.2781 (50-DMA).
- Potential further declines to 1.2682 (100-DMA) if 1.2800 and 1.2739 support levels are breached.
The Pound Sterling dropped early during the North American session after economic data from the United States (US) came stronger than expected, highlighting a modestly tight labor market. Therefore, the GBP/USD edges down some 0.20% and trades at 1.2827 after hitting a daily high of 1.2866.
GBP/USD Price Analysis: Technical outlook
The GPB/USD extends its losses after peaking at a year-to-date (YTD) high of 1.3043, with buyers unable to fight back and lift the exchange rate above the previous cycle high seen on March 8 at 1.2893. Once the pair cleared the latter, the losses continued to pile up, with market participants eyeing a test of the 50-day moving average (DMA) at 1.2781.
The Relative Strength Index (RSI) hints that momentum favors sellers. Hence, the GBP/USD path of least resistance is tilted to the downside.
If GBP/USD drops beneath 1.2800, the next stop would be the abovementioned 50-DMA, followed by the June 19 high at 1.2739. If those levels are surpassed, the next stop would be beneath 1.2700 at the 100-DMA at 1.2682, followed by the 200-DMA at 1.2633.
For a bullish correction, the GBP/USD must clear the July 29 high of 1.2888 and the July 24 peak of 1.2937 so that buyers can challenge the YTD high.
GBP/USD Price Action – Daily Chart
Pound Sterling FAQs
The Pound Sterling (GBP) is the oldest currency in the world (886 AD) and the official currency of the United Kingdom. It is the fourth most traded unit for foreign exchange (FX) in the world, accounting for 12% of all transactions, averaging $630 billion a day, according to 2022 data. Its key trading pairs are GBP/USD, aka ‘Cable’, which accounts for 11% of FX, GBP/JPY, or the ‘Dragon’ as it is known by traders (3%), and EUR/GBP (2%). The Pound Sterling is issued by the Bank of England (BoE).
The single most important factor influencing the value of the Pound Sterling is monetary policy decided by the Bank of England. The BoE bases its decisions on whether it has achieved its primary goal of “price stability” – a steady inflation rate of around 2%. Its primary tool for achieving this is the adjustment of interest rates. When inflation is too high, the BoE will try to rein it in by raising interest rates, making it more expensive for people and businesses to access credit. This is generally positive for GBP, as higher interest rates make the UK a more attractive place for global investors to park their money. When inflation falls too low it is a sign economic growth is slowing. In this scenario, the BoE will consider lowering interest rates to cheapen credit so businesses will borrow more to invest in growth-generating projects.
Data releases gauge the health of the economy and can impact the value of the Pound Sterling. Indicators such as GDP, Manufacturing and Services PMIs, and employment can all influence the direction of the GBP. A strong economy is good for Sterling. Not only does it attract more foreign investment but it may encourage the BoE to put up interest rates, which will directly strengthen GBP. Otherwise, if economic data is weak, the Pound Sterling is likely to fall.
Another significant data release for the Pound Sterling is the Trade Balance. This indicator measures the difference between what a country earns from its exports and what it spends on imports over a given period. If a country produces highly sought-after exports, its currency will benefit purely from the extra demand created from foreign buyers seeking to purchase these goods. Therefore, a positive net Trade Balance strengthens a currency and vice versa for a negative balance.
Hopes of a ceasefire in the Gaza war were seriously dampened at the weekend by a devastating rocket attack on the Israeli-occupied Golan Heights, allegedly carried out by the Shiite Hezbollah militia, Commerzbank’s commodity analyst Carsten Fritsch notes.
Middle East and Venezuela don’t impress the market
“According to insiders, Israel is keen to ensure that the expected military response to the Iranian-backed Hezbollah in southern Lebanon does not lead to an all-out war in the entire region. Apparently, market participants on the oil market do not consider such a risk to be very likely, as the subdued price reaction yesterday showed.”
“The controversial outcome of the presidential elections in Venezuela has not yet led to any significant price reaction on the oil market either. The US government had announced to calibrate its sanctions policy depending on Maduro's reaction to the election results.”
“Now, increasing international pressure and continued sanctions could lead to a renewed decline in production. It is therefore astonishing that the market is completely ignoring developments in the Middle East and Venezuela.”
- Consumer Confidence in the US improved slightly in July.
- US Dollar Index stays in positive territory above 104.50.
Consumer sentiment in the US improved slightly in July, with the Conference Board's Consumer Confidence Index rising to 100.3 from 97.8 (revised from 100.4) in June. The Present Situation Index declined to 133.6 from 135.5, while the Expectations Index rose to 78.2 from 72.8.
Commenting on the survey's findings, "confidence increased in July, but not enough to break free of the narrow range that has prevailed over the past two years,” said Dana M. Peterson, Chief Economist at The Conference Board. “Even though consumers remain relatively positive about the labor market, they still appear to be concerned about elevated prices and interest rates, and uncertainty about the future; things that may not improve until next year.”
Market reaction
The US Dollar (USD) stays resilient against its rivals in the American session on Tuesday. At the time of press, the USD Index was up 0.15% on the day at 104.73.
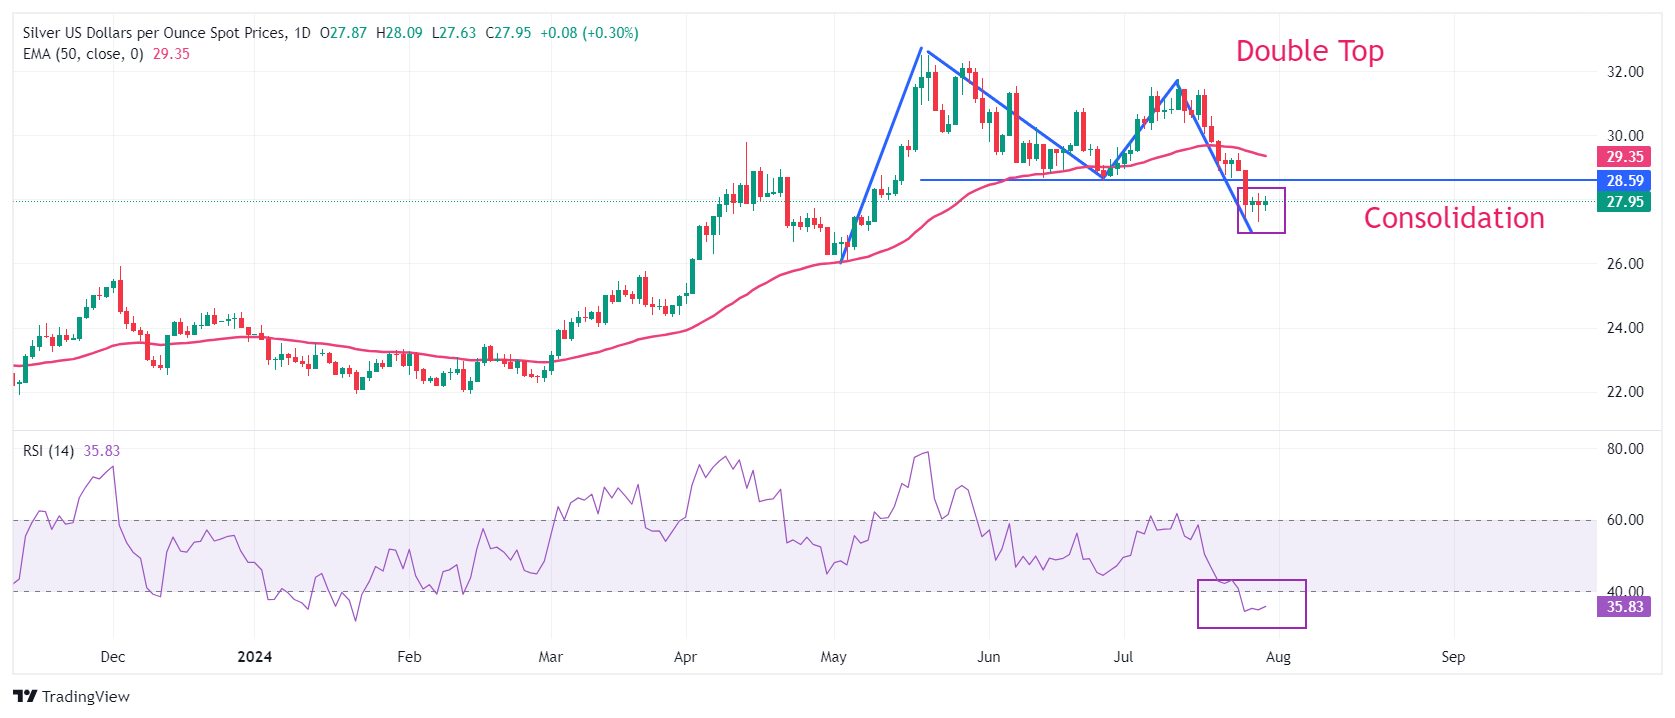
- Silver price becomes flat after the release of the better-than-expected US JOLTS Job Openings data for June.
- US employers posted fresh 8.18 million vacancies.
- The Fed is expected to leave interest rates steady for eighth straight time.
Silver price (XAG/USD) surrenders its intraday gains and falls slightly below $28.00 in Tuesday’s New York session. The white metal drops after the release of the better-than-expected United States (US) JOLTS Job Openings data for June. Fresh job vacancies came in higher at 8.18 million against expectations of 8.03 million but were lower than the prior release of 8.23 million, downwardly revised from 8.14 million.
Upbeat US JOLTS Job Openings data has pushed the US Dollar (USD) higher. The US Dollar Index (DXY), which tracks the Greenback’s value against six major currencies, jumps to near 104.80. 10-year US Treasury yields rebound to near 4.18%.
Meanwhile, the major trigger for the Silver price will be the interest rate decision by the Federal Reserve (Fed), which will be announced on Wednesday.
In the monetary policy meeting, investors expect that the Fed will decide to leave interest rates unchanged in the range of 5.25%-5.50%. The Fed is also expected to deliver a dovish guidance on interest rates.
According to the CME FedWatch tool, 30-day Federal Fund Futures pricing data shows that the central bank will reduce interest rates by 25 basis points (bps) from their current levels in the September meeting. The data also shows that there will be two rate cuts instead of one as projected by policymakers in the latest Fed dot plot.
Silver technical analysis
Silver price trades back and forth near $28.00. The near-term outlook of the Silver price turns bearish after a breakdown of the Double Top formation below June 26 low near $28.60 on a daily timeframe. A breakdown of the aforementioned chart pattern results in a bearish crossover. The overall trend of the Silver price is bearish as it establishes below the 50-day Exponential Moving Average (EMA), which trades around $29.35.
The 14-day Relative Strength Index (RSI) shifts into the bearish range of 20.00-40.00, suggesting that a bearish momentum is intact.
Silver daily chart
Silver FAQs
Silver is a precious metal highly traded among investors. It has been historically used as a store of value and a medium of exchange. Although less popular than Gold, traders may turn to Silver to diversify their investment portfolio, for its intrinsic value or as a potential hedge during high-inflation periods. Investors can buy physical Silver, in coins or in bars, or trade it through vehicles such as Exchange Traded Funds, which track its price on international markets.
Silver prices can move due to a wide range of factors. Geopolitical instability or fears of a deep recession can make Silver price escalate due to its safe-haven status, although to a lesser extent than Gold's. As a yieldless asset, Silver tends to rise with lower interest rates. Its moves also depend on how the US Dollar (USD) behaves as the asset is priced in dollars (XAG/USD). A strong Dollar tends to keep the price of Silver at bay, whereas a weaker Dollar is likely to propel prices up. Other factors such as investment demand, mining supply – Silver is much more abundant than Gold – and recycling rates can also affect prices.
Silver is widely used in industry, particularly in sectors such as electronics or solar energy, as it has one of the highest electric conductivity of all metals – more than Copper and Gold. A surge in demand can increase prices, while a decline tends to lower them. Dynamics in the US, Chinese and Indian economies can also contribute to price swings: for the US and particularly China, their big industrial sectors use Silver in various processes; in India, consumers’ demand for the precious metal for jewellery also plays a key role in setting prices.
Silver prices tend to follow Gold's moves. When Gold prices rise, Silver typically follows suit, as their status as safe-haven assets is similar. The Gold/Silver ratio, which shows the number of ounces of Silver needed to equal the value of one ounce of Gold, may help to determine the relative valuation between both metals. Some investors may consider a high ratio as an indicator that Silver is undervalued, or Gold is overvalued. On the contrary, a low ratio might suggest that Gold is undervalued relative to Silver.
Since July 12, the Australian Dollar (AUD) has lost almost 3.5% against the US Dollar (USD), making it one of the weaker G-10 currencies over that period. Two things have probably contributed to this. Both are related and both have a direct impact on Australia. But their origins lie elsewhere, Commerzbank’s FX analyst Volkmar Baur notes.
AUD is facing headwinds from China
“In fact, the only significant new information on the Australian economy over the past two weeks has been the labor market data – and that should have supported the Aussie dollar. After all, the Australian economy is still creating significantly more jobs per month than before the pandemic, so the labor market remains tight and wage growth should remain high.”
“On the other hand, the AUD is facing headwinds from China. Weak economic data, plus a relatively disappointing Third Plenum and so far no further stimulus announcements after the expected July Politburo meeting. The Chinese economy is now expected to be weaker than it was a few weeks ago, and the impact is being felt in the industrial metals market in particular.”
“This may be the deciding factor for the AUD in the coming days. Not only will Australian inflation data be released early on Wednesday, which will likely be crucial for the Reserve Bank of Australia's next move. But also new purchasing manager indices from China. Inflation is likely to support the Aussie again. On the other hand, the PMI's from China are due. A sideways movement or a renewed weakening could overshadow the impact of Australian inflation.”
Swedish krona has depreciated by almost 5% against the euro since the beginning of June, and there are several reasons for this, Commerzbank’s FX analyst Antje Praefcke notes.
Riksbank to continue maintaining its dovish stance
“Although it had kept the key interest rate unchanged at 3.75%, the Riksbank's interest rate decision in June has left a dovish aftertaste. Instead of two rate cuts, it now sees the possibility of three rate cuts by the end of the year. The market has since gone even further and its expectations for this year are even lower than those of the Riksbank.”
“The Riksbank's dovish stance laid the foundation for the krona's weakness from June onwards. inflation data for June surprised to the downside. On this fact followed a significant increase in risk aversion on the market, which regularly leads to heavy losses in the Scandies. And the bad news continues: the GDP indicator for the second quarter shows a fall of 0.8% in activity compared to the first.”
“It is therefore no wonder that the market is currently keeping its hands off the krona and that it has little chance of a significant recovery. After all, the Riskbank lowered its forecast for the key interest rate in June precisely because of the favorable inflation trend and the weaker economic activity. The Riksbank will probably not abandon its dovish stance in August either. This will also make it difficult for the krona to significantly correct its summer losses.”
A few hours before the US Fed, the Bank of Japan will hold its monetary policy meeting tomorrow morning. Expectations have risen recently and the market is pricing a 10bp hike with a higher probability than no hike – even though the majority of economists surveyed by Bloomberg do not expect a hike, Commerzbank’s FX analyst Volkmar Baur notes.
No hike on the horizon
“I am of the latter camp, but I would like to briefly explain my reasons. First, inflation has not moved as the BoJ had expected in recent months. The annual rate has fallen further recently, and there are still few signs of domestic inflationary pressure. Second, the economy has also been rather disappointing of late. According to Bloomberg, economic surprises have been negative for months.”
“This means that the Japanese economy is falling short of expectations. Third, the (temporarily) successful interventions have caused the JPY to appreciate over the past two weeks. Therefore, the exchange rate is less of a reason for a hike. And fourth, the BoJ is expected to unveil its plan to reduce its gross bond purchases. So monetary policy will be tightened anyway.”
“The market may be caught off-guard on Wednesday morning, but if the BoJ does not sound too dovish and continues to keep rate hikes on the table, the JPY's setback should be manageable.”
The whole world is just waiting to see what the Federal Reserve decides and what Fed Chairman Jerome Powell says (or doesn't say) in the press conference, Commerzbank’s FX strategist Antje Praefcke notes.
Calm ahead of the Fed meeting
“Hardly much will happen in the US Dollar (USD) until the FOMC meeting happens, now that calm has returned after the great excitement last week. In addition, the US labor market report for July, one of the big data heavyweights that tends to cause a lot of movement in the dollar, will be published on Friday.”
“In this respect, I will keep it brief and can only advise you to think again about the side in EUR/USD that would hurt you the most. We have emphasized several times since last week that the market may have gone a little too far with its Fed Funds rate expectations. First doubts already seem to be arising.”
“If market expectations are disappointed tomorrow evening (and possibly also on Friday with the labor market report), the USD could flex its muscles even more and appreciate more noticeably.”
- USD/CHF consolidates near 0.8850 with a focus on the Fed policy.
- The Fed is expected continue maintaining the status quo.
- Investors will also focus on the Swiss CPI for July.
The USD/CHF pair trades in a limited range near 0.8850 in Tuesday’s American session. The Swiss Franc asset consolidates as investors have sidelined with focus on the outcome of Federal Reserve’s (Fed) monetary policy meeting on Wednesday.
The Fed is expected to leave interest rates unchanged in the range of 5.25%-5.50% for the eighth time in a row. Therefore, investors will focus on the Fed’s guidance on interest rates. In the monetary policy statement and the press conference, Fed Chair Jerome Powell is expected to acknowledge progress in inflation and cooling labor market strength, which would boost expectations that the central bank will start reducing interest rates from the September meeting.
Fed policymakers have admitted that recent inflation readings have suggested that price pressures have returned to their path of 2% but refrained from committing a timeframe for it.
The US Dollar (USD) exhibits a sideways performance in countdown to Fed’s interest rate meeting. In today’s session, investors will focus on the United States (US) JOLTS Job Openings data for June, which will be published at 14:00 GMT.
Meanwhile, the next move in the Swiss Franc (CHF) will be influenced by July’s Consumer Price Index (CPI) data, which will be published on Friday.
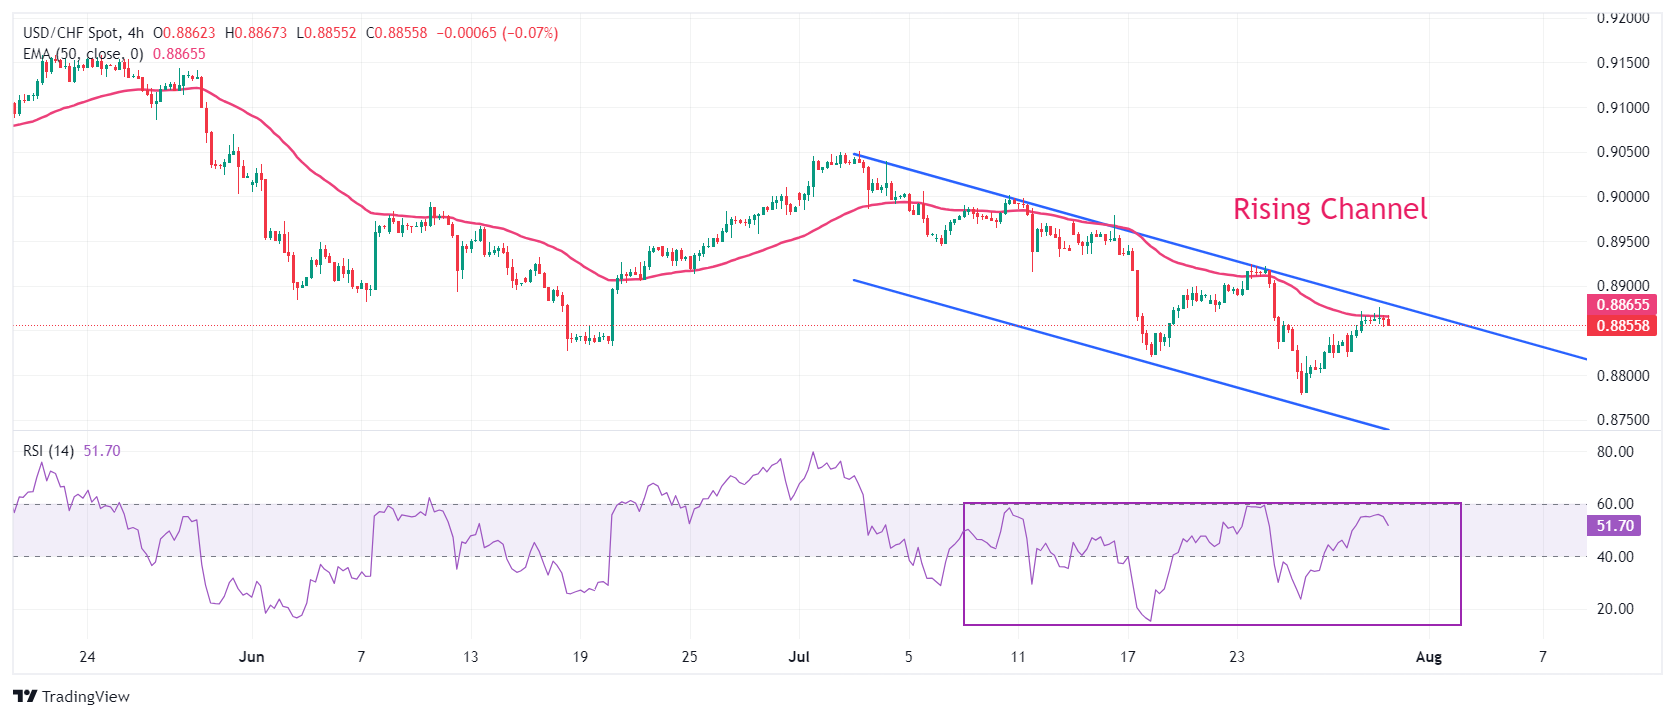
USD/CHF trades in a Falling Channel formation, on a four-hour timeframe, in which each pullback move is considered as selling opportunity by market participants. The 50-period Exponential Moving Average (EMA) near 0.8870 continues to act as a major barricade for the US Dollar bulls.
The 14-period Relative Strength Index (RSI) trades in a 20.00-60.00 range near 50.00, suggesting that the overall trend is bearish. While the bearish momentum is inactive.
Going forward, a decisive break above the round-level resistance of 0.8900 will unlock the upside towards July 17 high at 0.8945, followed by the psychological resistance of 0.9000.
In an alternate scenario, a downside move below July 25 low at 0.8777 would expose the asset to March 8 low near 0.8730 and the round-level support of 0.8700.
USD/CHF four-hour chart
Swiss Franc FAQs
The Swiss Franc (CHF) is Switzerland’s official currency. It is among the top ten most traded currencies globally, reaching volumes that well exceed the size of the Swiss economy. Its value is determined by the broad market sentiment, the country’s economic health or action taken by the Swiss National Bank (SNB), among other factors. Between 2011 and 2015, the Swiss Franc was pegged to the Euro (EUR). The peg was abruptly removed, resulting in a more than 20% increase in the Franc’s value, causing a turmoil in markets. Even though the peg isn’t in force anymore, CHF fortunes tend to be highly correlated with the Euro ones due to the high dependency of the Swiss economy on the neighboring Eurozone.
The Swiss Franc (CHF) is considered a safe-haven asset, or a currency that investors tend to buy in times of market stress. This is due to the perceived status of Switzerland in the world: a stable economy, a strong export sector, big central bank reserves or a longstanding political stance towards neutrality in global conflicts make the country’s currency a good choice for investors fleeing from risks. Turbulent times are likely to strengthen CHF value against other currencies that are seen as more risky to invest in.
The Swiss National Bank (SNB) meets four times a year – once every quarter, less than other major central banks – to decide on monetary policy. The bank aims for an annual inflation rate of less than 2%. When inflation is above target or forecasted to be above target in the foreseeable future, the bank will attempt to tame price growth by raising its policy rate. Higher interest rates are generally positive for the Swiss Franc (CHF) as they lead to higher yields, making the country a more attractive place for investors. On the contrary, lower interest rates tend to weaken CHF.
Macroeconomic data releases in Switzerland are key to assessing the state of the economy and can impact the Swiss Franc’s (CHF) valuation. The Swiss economy is broadly stable, but any sudden change in economic growth, inflation, current account or the central bank’s currency reserves have the potential to trigger moves in CHF. Generally, high economic growth, low unemployment and high confidence are good for CHF. Conversely, if economic data points to weakening momentum, CHF is likely to depreciate.
As a small and open economy, Switzerland is heavily dependent on the health of the neighboring Eurozone economies. The broader European Union is Switzerland’s main economic partner and a key political ally, so macroeconomic and monetary policy stability in the Eurozone is essential for Switzerland and, thus, for the Swiss Franc (CHF). With such dependency, some models suggest that the correlation between the fortunes of the Euro (EUR) and the CHF is more than 90%, or close to perfect.
- The Dollar appreciates against the Yen unfazed by the diverging Fed/BoJ policy outlook.
- The BoJ is expected to launch an aggressive quantitative tightening program on Wednesday.
- USD/JPY has breached 154.80 and might extend beyond 155.35 to the 155.75 area.
The USD/JPY seems to ignore the diverging policy outlook of its respective central banks and is gaining bullish traction, ahead of BoJ and Fed’s monetary policy decisions, on Wednesday.
Fed and BoJ are about to advance on diverging paths
The Federal Reserve is widely expected to leave its benchmark interest rate unchanged, although recent data has boosted hopes that they might anticipate their easing cycle. The market is fully pricing a rate cut in September, and Chair Powell’s comments will be analyzed with interest for hints on that direction.
Later today, the US JOLTS job opening and the Conference Board’s Consumer Sentiment Index are expected to add to the evidence of softer US economic growth in the second quarter.
The BoJ, on the other hand, is in an antithetical situation. The Bank will disclose a significant reduction of its massive bond purchasing program and probably accompany it with a 10 bp rate hike.
USD/JPY has gained bullish momentum above 154.70
Technically speaking, the pair is gaining momentum after breaching Friday’s high, at 154.70 with bulls aiming for the resistance area between the 4H 50 SMA, now at 155.35, and the 38.6% Fibonacci retracement of July’s reversal, at 155.75. Supports are 153.00 and 151.90.
Interest rates FAQs
Interest rates are charged by financial institutions on loans to borrowers and are paid as interest to savers and depositors. They are influenced by base lending rates, which are set by central banks in response to changes in the economy. Central banks normally have a mandate to ensure price stability, which in most cases means targeting a core inflation rate of around 2%. If inflation falls below target the central bank may cut base lending rates, with a view to stimulating lending and boosting the economy. If inflation rises substantially above 2% it normally results in the central bank raising base lending rates in an attempt to lower inflation.
Higher interest rates generally help strengthen a country’s currency as they make it a more attractive place for global investors to park their money.
Higher interest rates overall weigh on the price of Gold because they increase the opportunity cost of holding Gold instead of investing in an interest-bearing asset or placing cash in the bank. If interest rates are high that usually pushes up the price of the US Dollar (USD), and since Gold is priced in Dollars, this has the effect of lowering the price of Gold.
The Fed funds rate is the overnight rate at which US banks lend to each other. It is the oft-quoted headline rate set by the Federal Reserve at its FOMC meetings. It is set as a range, for example 4.75%-5.00%, though the upper limit (in that case 5.00%) is the quoted figure. Market expectations for future Fed funds rate are tracked by the CME FedWatch tool, which shapes how many financial markets behave in anticipation of future Federal Reserve monetary policy decisions.
- CPI in Germany rose 2.3% on a yearly basis in July.
- EUR/USD continues to fluctuate in a tight range above 1.0800.
Inflation in Germany, as measured by the change in the Consumer Price Index (CPI), rose to 2.3% on a yearly basis in July from 2.2% in June. This reading came in above the market expectation of 2.2%. On a monthly basis, the CPI rose 0.3% following the 0.1% rise recorded in June.
The Harmonized Index of Consumer Prices, the European Central Bank's preferred gauge of inflation, rose 2.6% on a yearly basis, up from 2.5% in June and above analysts' estimate of 2.4%.
Market reaction
EUR/USD showed no reaction to these figures and was last seen trading little changed on the day at 1.0825.
Gross domestic product in the euro area rose again by 0.3% in the second quarter. While Spain's economy grew significantly, Germany's economy actually fell slightly. Once again, strong foreign trade apparently supported growth in the euro area, Commerzbank’s economist Dr. Vincent Stamer notes.
Euro area economy is likely to develop weakly in the coming quarters
“According to preliminary data from Eurostat, seasonally adjusted real gross domestic product grew by 0.3% in the second quarter of 2024 compared to the first quarter. The majority of economists surveyed in advance had expected a slight increase of 0.2%. Economic growth in the euro area had already surprised with a positive figure in the previous quarter (also 0.3%).”
“However, growth is unevenly distributed: While France (0.3%) and Italy (0.2%) grew moderately and Spain again recorded a particularly high growth rate (0.8%), Germany's gross domestic product actually fell slightly by 0.1%. Also, the economy in the euro area grew faster than expected in the first quarter.”
“Economic indicators such as the composite Purchasing Managers' Index also signal a weak start to the third quarter. Without strong foreign trade, the euro area economy is therefore likely to develop only weakly in the coming quarters.”
The Pound Sterling (GBP) is unchanged on the session, Scotiabank’s Chief FX Strategist Shaun Osborne notes.
GBP needs to extend above 1.2890 to gain momentum
“There were no UK data reports today and the pound has been left idling in a range in the mid-1.28s against the USD in very quiet trade.”
“Cable’s steady drift from the July 17th peak at 1.3044 is showing signs of reversing. A bullish daily close for the GBP yesterday supports the idea that the GBP has run its course for now.”
“Spot is testing trend resistance off the mid-July high at 1.2860 this morning but the GBP may need to extend above 1.2890 to really gain momentum intraday. Support should be firm now on dips to the low 1.28s.”
German Q2 GDP fell a disappointing 0.1% Q/Q (against calls for a 0.1% rise) but better growth in Spain and France helped lift the preliminary Eurozone growth data to 0.3%, a little above forecasts (0.2%), Scotiabank’s Chief FX Strategist Shaun Osborne notes.
To turn bullish above 1.0855 for 1.0875/1.0925
“German regional CPI suggest a slight upside risk to the preliminary July national CPI data (0.3% M/M and 2.2% Y/Y consensus) at 8ET, meanwhile. EUR/USD got a small lift from the growth data and might extend gains through the mid-1.08s if German inflation comes in a little hotter than forecast.”
“EUR/USD is showing some signs of steadying in the low 1.08 area. EUR losses to the figure zone were easily rejected yesterday, with the figure area reinforced by the collection of moving averages between 1.0795/1.0820 (200-day MA at 1.0822). Resistance is 1.0855. Bullish above here for 1.0875/1.0925.”
The Canadian Dollar (CAD) has steadied after making another run at yesterday’s high near 1.3865 overnight. The CAD is fighting against a tidal wave of negative sentiment, Scotiabank’s Chief FX Strategist Shaun Osborne notes.
Losses below 1.3795 to trigger a deeper USD correction
“The latest CFTC data showed a huge accumulation of bearish CAD positioning. Positioning looks excessive but profoundly weak sentiment reflects the BoC’s easing bias, lagging growth (versus the US) and perhaps investors fearing another Trump presidency and tariffs on Canadian exports.”
“Weak commodities are not helping but strong commodities failed to lift the CAD earlier this year and the correlation between spot and commodities remains very weak. The one saving grace for the CAD is that it has closed lower against the USD for nine consecutive sessions now. My informal rule of thumb for major FX pairs is that one direction moves very rarely extend for more than ten sessions on the trot.”
“The trend appreciation in the USD from the middle of the month has run on to the point that gains look very stretched. The CAD is marginally positive on the session so far and may hold inside yesterday’s range against the USD. Minor support sits at 1.3835 while losses below 1.3795 may trigger a deeper USD correction. Resistance is 1.3865 and 1.39.”
Silver prices (XAG/USD) broadly unchanged on Tuesday, according to FXStreet data. Silver trades at $27.88 per troy ounce, broadly unchanged 0.04% from the $27.87 it cost on Monday.
Silver prices have increased by 17.16% since the beginning of the year.
| Unit measure | Silver Price Today in USD |
|---|---|
| Troy Ounce | 27.88 |
| 1 Gram | 0.90 |
The Gold/Silver ratio, which shows the number of ounces of Silver needed to equal the value of one ounce of Gold, stood at 85.74 on Tuesday, up from 85.54 on Monday.
Silver FAQs
Silver is a precious metal highly traded among investors. It has been historically used as a store of value and a medium of exchange. Although less popular than Gold, traders may turn to Silver to diversify their investment portfolio, for its intrinsic value or as a potential hedge during high-inflation periods. Investors can buy physical Silver, in coins or in bars, or trade it through vehicles such as Exchange Traded Funds, which track its price on international markets.
Silver prices can move due to a wide range of factors. Geopolitical instability or fears of a deep recession can make Silver price escalate due to its safe-haven status, although to a lesser extent than Gold's. As a yieldless asset, Silver tends to rise with lower interest rates. Its moves also depend on how the US Dollar (USD) behaves as the asset is priced in dollars (XAG/USD). A strong Dollar tends to keep the price of Silver at bay, whereas a weaker Dollar is likely to propel prices up. Other factors such as investment demand, mining supply – Silver is much more abundant than Gold – and recycling rates can also affect prices.
Silver is widely used in industry, particularly in sectors such as electronics or solar energy, as it has one of the highest electric conductivity of all metals – more than Copper and Gold. A surge in demand can increase prices, while a decline tends to lower them. Dynamics in the US, Chinese and Indian economies can also contribute to price swings: for the US and particularly China, their big industrial sectors use Silver in various processes; in India, consumers’ demand for the precious metal for jewellery also plays a key role in setting prices.
Silver prices tend to follow Gold's moves. When Gold prices rise, Silver typically follows suit, as their status as safe-haven assets is similar. The Gold/Silver ratio, which shows the number of ounces of Silver needed to equal the value of one ounce of Gold, may help to determine the relative valuation between both metals. Some investors may consider a high ratio as an indicator that Silver is undervalued, or Gold is overvalued. On the contrary, a low ratio might suggest that Gold is undervalued relative to Silver.
(An automation tool was used in creating this post.)
- The USD rally loses steam as risk aversion ebbs.
- Hopes of a dovish turn by the Federal Reserve are adding negative pressure to the Dollar
- USD/MXN bullish trend remains intact, with downside attempts held above 18.60.
The US Dollar is practically flat on the daily chart, consolidating gains following a five-day rally. Bulls met resistance at the 18.75 area on Monday and the pair has remained trading sideways on Tuesday, with downside attempts limited above 18.60 so far.
A somewhat brighter market sentiment is weighing on the safe-haven US Dollar and hopes of some dovish hint after the Fed meeting are adding pressure on the USD.
Recent US Data has fuelled hopes of a September cut
The US labour market is showing signs of exhaustion, unemployment increased in June, and inflation is finally drawing close to the 2% level. Data released last week revealed that the PCE Prices Index remained at unchanged at a 2.5% yearly rate in June.
These figures have boosted expectations that the Bank might start cutting rates in September, instead of December as previous Fed projections suggested.
In this context, Wednesday’s Fed monetary policy decision will be closely watched. The bank will highly likely leave rates unchanged, but any signal towards earlier rate cuts is likely to weigh on the USD.
USD/MXN consolidates with the bullish trend intact
From a technical perspective, the pair is consolidating gains ahead of the meeting. The broader bias remains bullish, with resistances at 18.80 and 19.00. Supports are 18.60 and 18.30.
Mexican Peso FAQs
The Mexican Peso (MXN) is the most traded currency among its Latin American peers. Its value is broadly determined by the performance of the Mexican economy, the country’s central bank’s policy, the amount of foreign investment in the country and even the levels of remittances sent by Mexicans who live abroad, particularly in the United States. Geopolitical trends can also move MXN: for example, the process of nearshoring – or the decision by some firms to relocate manufacturing capacity and supply chains closer to their home countries – is also seen as a catalyst for the Mexican currency as the country is considered a key manufacturing hub in the American continent. Another catalyst for MXN is Oil prices as Mexico is a key exporter of the commodity.
The main objective of Mexico’s central bank, also known as Banxico, is to maintain inflation at low and stable levels (at or close to its target of 3%, the midpoint in a tolerance band of between 2% and 4%). To this end, the bank sets an appropriate level of interest rates. When inflation is too high, Banxico will attempt to tame it by raising interest rates, making it more expensive for households and businesses to borrow money, thus cooling demand and the overall economy. Higher interest rates are generally positive for the Mexican Peso (MXN) as they lead to higher yields, making the country a more attractive place for investors. On the contrary, lower interest rates tend to weaken MXN.
Macroeconomic data releases are key to assess the state of the economy and can have an impact on the Mexican Peso (MXN) valuation. A strong Mexican economy, based on high economic growth, low unemployment and high confidence is good for MXN. Not only does it attract more foreign investment but it may encourage the Bank of Mexico (Banxico) to increase interest rates, particularly if this strength comes together with elevated inflation. However, if economic data is weak, MXN is likely to depreciate.
As an emerging-market currency, the Mexican Peso (MXN) tends to strive during risk-on periods, or when investors perceive that broader market risks are low and thus are eager to engage with investments that carry a higher risk. Conversely, MXN tends to weaken at times of market turbulence or economic uncertainty as investors tend to sell higher-risk assets and flee to the more-stable safe havens.
USD/JPY is consolidating after a sharp 6% drop from 11 July, when soft US CPI data and strategic Japanese FX intervention took its toll, ING’s FX strategist Chris Turner notes.
USD/JPY may have a decent bounce to 157
“Speculative Yen shorts in Chicago futures markets, in the week to 23 July, had scaled back their positions by 40% over the prior two weeks. This community probably cut positions a little further later last week when USD/JPY traded on a 152 handle. It seems fair to assess that the speculative market is a lot better balanced than it was at the start of July.”
“Tomorrow's BoJ/Fed combination will of course have a big say on whether this USD/JPY correction goes much further. ING's house view of a 15bp BoJ hike and a dovish Fed argues that the correction extends, potentially close to 150.”
“However, the low volatility environment and already a large correction across risk assets this month warns that if the BoJ surprises us (not locals) with unchanged policy, USD/JPY could have a decent bounce to 157 and that a cross rate, like AUD/JPY, could have a sizable rally. We'll know a lot more this time tomorrow.”
- The USD lost momentum on Tuesday although it remains above previous resistance levels.
- An improved risk environment and hopes of a dovish turn by the Fed have capped the US Dollar’s recovery.
- DXY: Below 104.55, the next targets are 1.0405 and 1.0365.
The US Dollar (USD) has turned lower during the early European trading session, with market sentiment improving somewhat. Israel has refrained from retaliating against Hizbullah in Lebanon after a deadly attack from the Iran-backed militias this week, which has eased concerns about further destabilization in a highly volatile area.
The US Dollar Index (DXY), however, remains above the previous week’s trading range, with investors wary of taking excessive risks ahead of Wednesday’s Federal Reserve (Fed) interest rate decision. The bank will highly likely leave rates unchanged, but the recent inflation and labor data might prompt Fed Chair Jerome Powell to deliver a more dovish message.
The bank’s latest dot plot suggested only a 25 bps cut in December, but the market is betting on two rate cuts, starting in September, and recent data supports that view. Any hint in that direction would increase negative pressure on the US Dollar.
Before that, the JOLTS Job Openings for June and the Conference Board’s Consumer Sentiment Index for July, due on Tuesday, are expected to show moderate contractions, which will provide the right framework for a dovish message from the central bank.
Daily digest market movers: US Dollar loses steam amid a slightly brighter market mood
- Risk appetite has returned on Tuesday, favoured by easing concerns about an escalation of the Middle East conflict. This is pushing risk assets higher and weighing on the safe-haven USD.
- Israeli authorities have affirmed that they are willing to avoid an all-out war in the Middle East. This has calmed markets, which are wary that the reaction would attract a direct involvement of Iran in the conflict.
- In the economic calendar on Tuesday, the US JOLTS Job Openings are expected to have dropped slightly, to 8.03 million in June from 8.14 million in May.
- Also today the Conference Board’s Consumer Sentiment Index is seen contracting to 99.5 in July from the 100.4 posted in the previous month.
- The main focus, however, is the Fed’s monetary policy meeting. Data from the CME Group Fed Watch Tool shows that markets are pricing only a 4.1% chance of an interest rate cut on Wednesday, while a 25 bps rate cut is fully priced for September.
- Data released last week showed that the US Personal Consumption Expenditures (PCE) Prices Index ticked down in June, although the core PCE remained at 2.6% year-over-year. This reading is close to the bank’s 2% inflation target and maintains hopes of a September rate cut alive.
DXY Technical Outlook: Testing 1.0450 after failure at 104.80 area
The US Dollar Index (DXY) recovery has lost momentum on Tuesday, with risk assets bouncing up amid a more favorable environment. Bulls have been capped at 104.80 and they are now testing previous resistance, turned support, at 104.55.
A further pullback below that level would put 104.05 back into play ahead of 103.65. On the upside, resistances are the mentioned 104.80 and 105.22.
US Dollar PRICE Today
The table below shows the percentage change of US Dollar (USD) against listed major currencies today. US Dollar was the strongest against the Japanese Yen.
| USD | EUR | GBP | JPY | CAD | AUD | NZD | CHF | |
|---|---|---|---|---|---|---|---|---|
| USD | -0.13% | 0.02% | 0.51% | -0.06% | 0.08% | -0.30% | -0.03% | |
| EUR | 0.13% | 0.15% | 0.65% | 0.09% | 0.20% | -0.17% | 0.09% | |
| GBP | -0.02% | -0.15% | 0.52% | -0.06% | 0.08% | -0.30% | -0.06% | |
| JPY | -0.51% | -0.65% | -0.52% | -0.58% | -0.43% | -0.81% | -0.54% | |
| CAD | 0.06% | -0.09% | 0.06% | 0.58% | 0.14% | -0.24% | -0.00% | |
| AUD | -0.08% | -0.20% | -0.08% | 0.43% | -0.14% | -0.39% | -0.12% | |
| NZD | 0.30% | 0.17% | 0.30% | 0.81% | 0.24% | 0.39% | 0.25% | |
| CHF | 0.03% | -0.09% | 0.06% | 0.54% | 0.00% | 0.12% | -0.25% |
The heat map shows percentage changes of major currencies against each other. The base currency is picked from the left column, while the quote currency is picked from the top row. For example, if you pick the US Dollar from the left column and move along the horizontal line to the Japanese Yen, the percentage change displayed in the box will represent USD (base)/JPY (quote).
Economic Indicator
Fed Interest Rate Decision
The Federal Reserve (Fed) deliberates on monetary policy and makes a decision on interest rates at eight pre-scheduled meetings per year. It has two mandates: to keep inflation at 2%, and to maintain full employment. Its main tool for achieving this is by setting interest rates – both at which it lends to banks and banks lend to each other. If it decides to hike rates, the US Dollar (USD) tends to strengthen as it attracts more foreign capital inflows. If it cuts rates, it tends to weaken the USD as capital drains out to countries offering higher returns. If rates are left unchanged, attention turns to the tone of the Federal Open Market Committee (FOMC) statement, and whether it is hawkish (expectant of higher future interest rates), or dovish (expectant of lower future rates).
Read more.Next release: Wed Jul 31, 2024 18:00
Frequency: Irregular
Consensus: 5.5%
Previous: 5.5%
Source: Federal Reserve
The US Dollar (USD) had a modest rally across the board on Monday but it was unclear why. It may have had something to do with month-end flows. However, the bigger story for FX markets is whether this broad, cross-market correction seen around 10/12 July has run its course, ING’s FX strategist Chris Turner notes.
Data driven movement under way
“Tomorrow's event risks will have a big say in that. Here, our team looks for a 15bp Bank of Japan rate hike, which could trigger more independent yen strength and extend the corrective environment. The second event risk tomorrow is the FOMC meeting, which we think will be risk-bullish and USD-negative as the FerFed prepares the market for a September rate hike.”
“Today, the focus is on two US releases – both at 16CET. The job opening JOLTS data are expected to correct back to the eight million level after the unexpected spike to 8.14 million last month. Also in focus is July consumer confidence data, which is expected to dip lower. A softer confidence figure today will add to the view that the Fed will want to ‘sustain the expansion’ with a September rate cut.”
“DXY did well yesterday but could hand back those gains today were US data to emerge on the soft side or if the rest of Europe emulates France's seemingly strong second-quarter GDP data.”
- AUD/USD trades back and forth around 0.6550 amid a focus on multiple Australian/US macroeconomic events.
- Inflation in Australia is expected to have risen steadily by 1%.
- The Fed is seen leaving interest rates unchanged, with a dovish guidance.
The AUD/USD pair continues to trade sideways around 0.6550 in Tuesday’s European session. The Aussie asset consolidates as investors have sidelined ahead of the Aussie Q2, the monthly Consumer Price Index (CPI) for June, and the interest rate decision by the Federal Reserve (Fed), which are scheduled for Wednesday.
Market sentiment favors risky assets on expectations that the Fed will deliver dovish guidance on interest rates, leaving them unchanged in the range of 5.25%-5.50%. S&P 500 futures have posted decent gains in London trading hours. The US Dollar Index (DXY), which tracks the Greenback’s value against six major currencies, trades flat near 104.60. 10-year US Treasury yields edge lower to near 4.17%.
Investors see Fed Chair Jerome Powell acknowledging progress in inflation and its return towards the path of 2% on behalf of policymakers in the monetary policy statement. Fed Powell is also expected to highlight concerns over the United States (US) labor market strength.
In today’s session, the US JOLTS Job Openings data for June will be in the spotlight, a key measure of labor demand that will indicate a change in the number of job vacancies posted by employers. The economic data is expected to show Job Openings were lower at 8.03 million from the former release of 8.14 million.
Meanwhile, the Australian Dollar (AUD) will be guided by the inflation data. Price pressures in the second quarter are estimated to have grown steadily by 1.0%, with the annualized figure accelerating to 3.8% from the prior release of 3.6%. Investors will also focus on the monthly Retail Sales data for June, which is estimated to have grown at a slower pace of 0.1% from May’s reading of 0.6%. The economic data will indicate whether market speculation that the Reserve Bank of Australia (RBA) will hold interest rates at their current level for the entire year is appropriate.
Australian Dollar FAQs
One of the most significant factors for the Australian Dollar (AUD) is the level of interest rates set by the Reserve Bank of Australia (RBA). Because Australia is a resource-rich country another key driver is the price of its biggest export, Iron Ore. The health of the Chinese economy, its largest trading partner, is a factor, as well as inflation in Australia, its growth rate and Trade Balance. Market sentiment – whether investors are taking on more risky assets (risk-on) or seeking safe-havens (risk-off) – is also a factor, with risk-on positive for AUD.
The Reserve Bank of Australia (RBA) influences the Australian Dollar (AUD) by setting the level of interest rates that Australian banks can lend to each other. This influences the level of interest rates in the economy as a whole. The main goal of the RBA is to maintain a stable inflation rate of 2-3% by adjusting interest rates up or down. Relatively high interest rates compared to other major central banks support the AUD, and the opposite for relatively low. The RBA can also use quantitative easing and tightening to influence credit conditions, with the former AUD-negative and the latter AUD-positive.
China is Australia’s largest trading partner so the health of the Chinese economy is a major influence on the value of the Australian Dollar (AUD). When the Chinese economy is doing well it purchases more raw materials, goods and services from Australia, lifting demand for the AUD, and pushing up its value. The opposite is the case when the Chinese economy is not growing as fast as expected. Positive or negative surprises in Chinese growth data, therefore, often have a direct impact on the Australian Dollar and its pairs.
Iron Ore is Australia’s largest export, accounting for $118 billion a year according to data from 2021, with China as its primary destination. The price of Iron Ore, therefore, can be a driver of the Australian Dollar. Generally, if the price of Iron Ore rises, AUD also goes up, as aggregate demand for the currency increases. The opposite is the case if the price of Iron Ore falls. Higher Iron Ore prices also tend to result in a greater likelihood of a positive Trade Balance for Australia, which is also positive of the AUD.
The Trade Balance, which is the difference between what a country earns from its exports versus what it pays for its imports, is another factor that can influence the value of the Australian Dollar. If Australia produces highly sought after exports, then its currency will gain in value purely from the surplus demand created from foreign buyers seeking to purchase its exports versus what it spends to purchase imports. Therefore, a positive net Trade Balance strengthens the AUD, with the opposite effect if the Trade Balance is negative.
- Gold advances with risk appetite returning as geopolitical fears ease.
- Hopes that the Fed might hint towards monetary easing on Wednesday keep US Treasury yields near mid-term lows.
- XAU/USD needs to break the $2,400 resistance to cancel the broader bearish structure.
Gold price (XAU/USD) found buyers after a moderate pullback on Monday. The precious metal has been going through a mild recovery during Tuesday’s Asian session that has continued in the European morning.
News reporting that Israel is willing to avoid an all-out war in the Middle East has eased geopolitical concerns, allowing the safe-haven US Dollar (USD) to trim some gains.
Investors’ focus is now on the Federal Reserve’s (Fed) monetary policy decision, due on Wednesday. The bank will highly likely leave interest rates unchanged, but the attention will be on the ensuing press release by Fed Chair Jerome Powell. With price pressures on a disinflationary trend and the labour market finally showing signs of exhaustion, Powell suggesting that the easing cycle might start before December. That would harm the US Dollar and support precious metals.
Daily digest market movers: Gold picks up within recent range with all eyes on the Fed
- Gold is regaining some of the ground lost on Monday, favoured by a somewhat brighter market mood as concerns of a full-blown war in the Middle East have eased.
- Israeli authorities assured that they want to retaliate Hizbullah, for the rocket attack that killed 12 people on the weekend, but that they want to avoid a regional war in the Middle East. This has calmed market fears.
- Later today, the Conference Board is expected to show that the Consumer Sentiment Index deteriorated marginally in July, to a reading of 99.5 from the 100.4 posted in the previous month.
- In the same line, US JOLTS Job Openings are seen to have declined to 8.03 million in June from the 8.14 million openings reported in May.
- The Fed is releasing its monetary policy decision on Wednesday, and the recent inflation readings have boosted market expectations that the bank might signal the exit of the restrictive cycle.
- US 10-year yields are marginally above four-month highs, while the 2-year yield, the most closely related to interest rate expectations, remains depressed at their lowest levels since February.
- The CME Group’s Fed Watch tool is pricing a 95% chance that the Fed will keep rates on hold on Wednesday and a 100% chance that rate cuts will start in September.
Technical analysis: XAU/USD remains capped below the $2,400 resistance level
XAU/USD is on a corrective decline after having been capped nearly $2,500 in mid-July. The pair has found significant support at the 61.8% Fibonacci retracement of the June-July bullish run, near $2,360, and the higher low printed last week suggests that the correction might have been completed.
The 4-hour Relative Strength Index (RSI) indicator is pulling higher and about to cross the key 50 level. The precious metal, however, might need an extra boost to breach the 2,400 resistance area. Soft data today and a dovish Fed would probably do it. The next target, in this case, would be $2,430.
On the downside, supports are at the mentioned 61.8% Fibonacci retracement, at $2,350, ahead of $2,320.
XAU/USD 4-hour chart
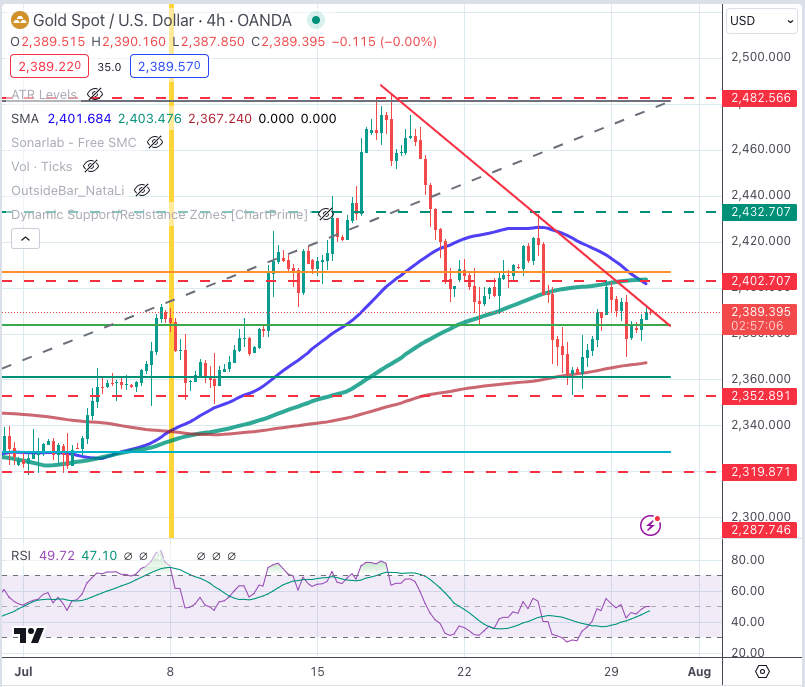
Gold FAQs
Gold has played a key role in human’s history as it has been widely used as a store of value and medium of exchange. Currently, apart from its shine and usage for jewelry, the precious metal is widely seen as a safe-haven asset, meaning that it is considered a good investment during turbulent times. Gold is also widely seen as a hedge against inflation and against depreciating currencies as it doesn’t rely on any specific issuer or government.
Central banks are the biggest Gold holders. In their aim to support their currencies in turbulent times, central banks tend to diversify their reserves and buy Gold to improve the perceived strength of the economy and the currency. High Gold reserves can be a source of trust for a country’s solvency. Central banks added 1,136 tonnes of Gold worth around $70 billion to their reserves in 2022, according to data from the World Gold Council. This is the highest yearly purchase since records began. Central banks from emerging economies such as China, India and Turkey are quickly increasing their Gold reserves.
Gold has an inverse correlation with the US Dollar and US Treasuries, which are both major reserve and safe-haven assets. When the Dollar depreciates, Gold tends to rise, enabling investors and central banks to diversify their assets in turbulent times. Gold is also inversely correlated with risk assets. A rally in the stock market tends to weaken Gold price, while sell-offs in riskier markets tend to favor the precious metal.
The price can move due to a wide range of factors. Geopolitical instability or fears of a deep recession can quickly make Gold price escalate due to its safe-haven status. As a yield-less asset, Gold tends to rise with lower interest rates, while higher cost of money usually weighs down on the yellow metal. Still, most moves depend on how the US Dollar (USD) behaves as the asset is priced in dollars (XAU/USD). A strong Dollar tends to keep the price of Gold controlled, whereas a weaker Dollar is likely to push Gold prices up.
The US Dollar (USD) is expected to trade in a range, probably between 7.2550 and 7.2750. USD must break and remain below the 7.2037 low before further weakness can be expected, UOB Group FX strategists Quek Ser Leang and Peter Chia note.
The nearest support is at 7.2680
24-HOUR VIEW: “USD traded between 7.2588 and 7.2736 yesterday, narrower than our expected range of 7.2500/7.2750. The price action provides no fresh clues, and we continue to expect USD to trade in a range, probably between 7.2550 and 7.2750.”
1-3 WEEKS VIEW: “Last Thursday, USD plunged to a low of 7.2037 before rebounding. On Friday (26 Jul, spot at 7.2470), we highlighted that ‘while further USD weakness is not ruled out, it must break and remain below the 7.2037 low before further decline can be expected.’ We added, ‘the likelihood of USD breaking clearly below the low will be intact provided that 7.2800 is not breached.’ We continue to hold the same view.”
Weakness in The US Dollar (USD) appears to be stabilising; a breach of 155.00 would indicate that USD is not declining further, UOB Group FX strategists Quek Ser Leang and Peter Chia note.
USD/JPY reaches out to test 155.00
24-HOUR VIEW: “Yesterday, we expected USD to trade in a range between 153.20 and 154.70. USD subsequently traded in a 153.00/154.35 range, closing at 154.01 (+0.19%). The price action provides no fresh clues, and we continue to expect USD to trade in a range, likely between 153.30 and 154.70.”
1-3 WEEKS VIEW: “Our update from last Friday (26 Jul, spot at 153.50) still stands. As highlighted, the weakness in USD that started in the middle of the month appears to be stabilising. However, only a breach of 155.00 (no change in ‘strong resistance’) would indicate USD is not declining further.”
- The Oil price hovers near a seven-week low of around $75.00 as the global economic outlook appears to be dismal.
- German economy surprisingly contracted by 0.1% in the second quarter of this year.
- Investors await the Fed’s policy meeting and Caixin Manufacturing PMI for July.
West Texas Intermediate (WTI), futures on NYMEX, trade close to seven-week low near $75.00 in Tuesday’s European session. The Oil price continues to remain in the bearish trajectory amid growing worries over global demand outlook.
Investors remain concerned over China’s economic outlook due to vulnerable demand in domestic and overseas markets. China’s economic woes were prompted by slower-than-expected Q2 Gross Domestic Product (GDP) growth and an unexpected rate-cut decision by the People’s Bank of China (PBoC). Also, the absence of a booster dose in China’s Third Plenum deepened uncertainty over its economic revival. China is the world’s largest Oil importer and its economic vulnerability is unfavorable for the Oil price.
To address the dismal outlook, China’s Politburo, the country’s top leadership, has laid out economic priorities for the second half of this year.
Apart from China, investors lack confidence of upbeat OIL demand from the Eurozone and the United States (US) economy. World’s oldest continent is going through a rough phase amid weakness in the German economy. Flash Q2 GDP report showed that the Eurozone economy grew steadily by 0.3%. However, the German economy surprisingly contracted by 0.1%. This would leave the economic outlook as uncertain.
Also, investors worry that the US growth rate could be slower in the second-half of this year amid presidential elections.
In the near-term, the major triggers for the Oil price will be the Federal Reserve’s (Fed) monetary policy announcement on Wednesday and the Caixin Manufacturing PMI for July, which will be published on Thursday. The Fed is expected to keep interest rates unchanged in the range of 5.25%-5.50% but will likely deliver a dovish guidance on interest rates.
Brent Crude Oil FAQs
Brent Crude Oil is a type of Crude Oil found in the North Sea that is used as a benchmark for international Oil prices. It is considered ‘light’ and ‘sweet’ because of its high gravity and low sulfur content, making it easier to refine into gasoline and other high-value products. Brent Crude Oil serves as a reference price for approximately two-thirds of the world's internationally traded Oil supplies. Its popularity rests on its availability and stability: the North Sea region has well-established infrastructure for Oil production and transportation, ensuring a reliable and consistent supply.
Like all assets supply and demand are the key drivers of Brent Crude Oil price. As such, global growth can be a driver of increased demand and vice versa for weak global growth. Political instability, wars, and sanctions can disrupt supply and impact prices. The decisions of OPEC, a group of major Oil-producing countries, is another key driver of price. The value of the US Dollar influences the price of Brent Crude Oil, since Oil is predominantly traded in US Dollars, thus a weaker US Dollar can make Oil more affordable and vice versa.
The weekly Oil inventory reports published by the American Petroleum Institute (API) and the Energy Information Agency (EIA) impact the price of Brent Crude Oil. Changes in inventories reflect fluctuating supply and demand. If the data shows a drop in inventories it can indicate increased demand, pushing up Oil price. Higher inventories can reflect increased supply, pushing down prices. API’s report is published every Tuesday and EIA’s the day after. Their results are usually similar, falling within 1% of each other 75% of the time. The EIA data is considered more reliable, since it is a government agency.
OPEC (Organization of the Petroleum Exporting Countries) is a group of 13 Oil producing nations who collectively decide production quotas for member countries at twice-yearly meetings. Their decisions often impact Brent Crude Oil prices. When OPEC decides to lower quotas, it can tighten supply, pushing up Oil prices. When OPEC increases production, it has the opposite effect. OPEC+ refers to an expanded group that includes ten extra non-OPEC members, the most notable of which is Russia.
The New Zealand Dollar (NZD) is likely to trade sideways between 0.5860 and 0.5900. Further NZD weakness is not ruled out; severely oversold conditions suggest limited downside potential. The level to monitor is 0.5850, UOB Group FX strategists Quek Ser Leang and Peter Chia note.
NZD is set to test the 0.5900 resistance
24-HOUR VIEW: “Our view of NZD trading in a 0.5875/0.5920 range was incorrect. NZD dipped to a low of 0.5859 and then rebounded to close at 0.5876 (-0.23%). Despite the decline, downward momentum has not increased much, and NZD is unlikely to weaken much further. Today, NZD is more likely to trade sideways between 0.5860 and 0.5900.”
1-3 WEEKS VIEW: “Last Friday (26 Jul, spot at 0.5890), we indicated that ‘while further NZD weakness is not ruled out, severely oversold conditions suggest limited downside potential.’ We indicated that ‘the next level to monitor is 0.5850.’ Yesterday, NZD dropped to a low of 0.5859 before rebounding. The price action did not result in a further increase in downward momentum. For the time being, we will continue to hold the same view. Only a breach of 0.5930 (‘strong resistance’ previously at 0.5955) would suggest that NZD weakness that started about two weeks ago has come to an end.”
- The Pound Sterling ranges against the US Dollar near 1.2850 with a focus on Fed/BoE policy meetings.
- Traders raise BoE rate-cut bets despite stubborn UK service inflation.
- Investors see the Fed delivering a dovish interest rate guidance.
The Pound Sterling (GBP) trades in a tight range near 1.2850 against the US Dollar (USD) in Tuesday’s London session. The GBP/USD pair consolidates inside Monday’s trading range with a focus on interest-rate decisions by the Federal Reserve (Fed) and the Bank of England (BoE) on Wednesday and Thursday, respectively.
The Fed is widely anticipated to maintain the status quo for the eighth consecutive meeting. Therefore, investors will keenly focus on the monetary policy statement and Fed Chair Jerome Powell’s press conference to get fresh cues about rate cut prospects.
Market experts see the Fed sending a clear message that rate cuts are highly likely in the September meeting amid significant progress in inflation declining towards the bank’s target of 2% and increasing risks to labor market strength. The scenario would be unfavorable for the US Dollar and bond yields. At the time of writing, the US Dollar Index (DXY), which tracks the Greenback’s value against six major peers, edges higher to 104.70. 10-year US Treasury yields rise to near 4.18%.
In Tuesday’s session, investors will look to United States (US) JOLTS Job Openings data for June, which will be published at 14:00 GMT. The report is expected to show that fresh job vacancies were lower at 8.03 million from the former release of 8.14 million.
This week, many economic data are lined up for release, which will impact the next move in the US Dollar, such as ADP Employment Change, ISM Manufacturing PMI, and Nonfarm Payrolls (NFP) for July.
Daily digest market movers: Pound Sterling underperforms against its major peers
- The Pound Sterling exhibits a weak performance against its major peers, except the Japanese Yen, on Tuesday. The British currency weakens as market speculation for the BoE to begin reducing interest rates from the August meeting, which will be announced on Thursday, has improved further. Trades see a little over 58% chance that the BoE will cut its key borrowing rates by 25 basis points (bps) to 5%, Reuters reported.
- Investors expect that the BoE’ rate-cut decision will be a tough call, with 5-4 vote split as inflation in the service sector is significantly higher than where it needs to be to boost policymakers’ confidence for rate cuts. United Kingdom’s (UK) annual service inflation remained higher at 5.7% in June than bank’s forecast of 5.1%.
- In the last monetary policy meeting, BoE Governor Andrew Bailey said policymakers saw the decision to keep interest rates steady as ‘finely balanced’, which boosted expectations that the central bank will cut interest rates in August.
- Meanwhile, fears of price pressures remaining persistent have deepened as UK Finance Minister Rachel Reeves vowed to deliver above-inflation pay rises worth 9.4 billion pounds for workers in the public sector such as doctors and teachers. Reeves told Parliament, "I have today set out our decision to meet the recommendation of the pay review bodies because the previous government failed to prepare for these recommendations in their departmental budgets," Reuters reported. Reeves announced that she will hold her first fiscal budget on October 30.
Technical Analysis: Pound Sterling juggles near 1.2850
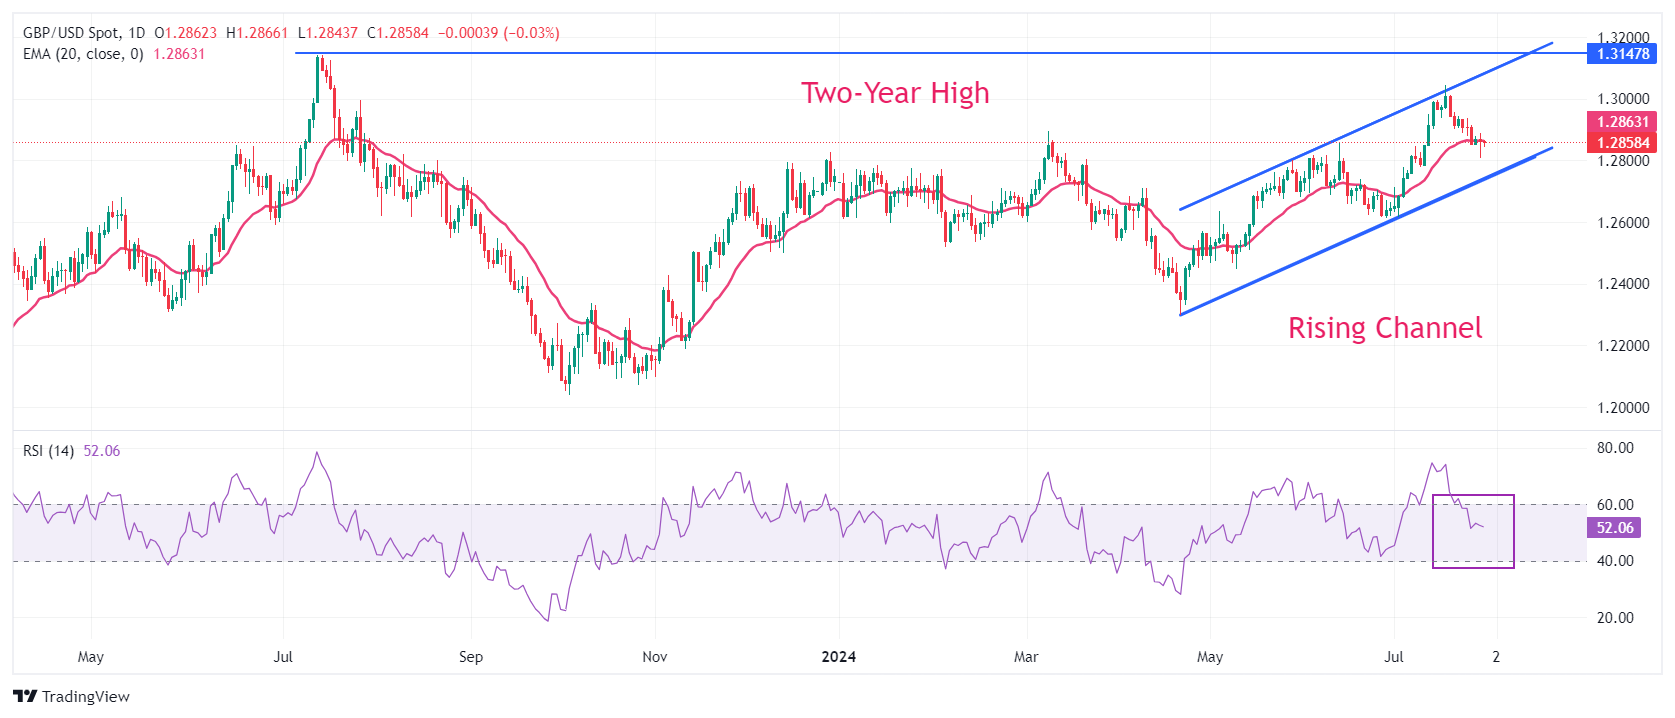
The Pound Sterling is going through a mean-reversion move toward the lower boundary of the Rising Channel chart pattern on a daily timeframe. The GBP/USD pair fell on the back foot after breaking below the crucial support of 1.2900. The Cable drops below the 20-day Exponential Moving Average (EMA) near 1.2860, suggesting uncertainty in the near-term trend.
The 14-day Relative Strength Index (RSI) declines toward 40.00, which would a be cushion for the momentum oscillator.
On the downside, the round-level of 1.2800 will be a crucial support zone for the Pound Sterling bulls. Meanwhile, the two-year high near 1.3140 will be a key resistance zone for the Cable.
Pound Sterling FAQs
The Pound Sterling (GBP) is the oldest currency in the world (886 AD) and the official currency of the United Kingdom. It is the fourth most traded unit for foreign exchange (FX) in the world, accounting for 12% of all transactions, averaging $630 billion a day, according to 2022 data. Its key trading pairs are GBP/USD, aka ‘Cable’, which accounts for 11% of FX, GBP/JPY, or the ‘Dragon’ as it is known by traders (3%), and EUR/GBP (2%). The Pound Sterling is issued by the Bank of England (BoE).
The single most important factor influencing the value of the Pound Sterling is monetary policy decided by the Bank of England. The BoE bases its decisions on whether it has achieved its primary goal of “price stability” – a steady inflation rate of around 2%. Its primary tool for achieving this is the adjustment of interest rates. When inflation is too high, the BoE will try to rein it in by raising interest rates, making it more expensive for people and businesses to access credit. This is generally positive for GBP, as higher interest rates make the UK a more attractive place for global investors to park their money. When inflation falls too low it is a sign economic growth is slowing. In this scenario, the BoE will consider lowering interest rates to cheapen credit so businesses will borrow more to invest in growth-generating projects.
Data releases gauge the health of the economy and can impact the value of the Pound Sterling. Indicators such as GDP, Manufacturing and Services PMIs, and employment can all influence the direction of the GBP. A strong economy is good for Sterling. Not only does it attract more foreign investment but it may encourage the BoE to put up interest rates, which will directly strengthen GBP. Otherwise, if economic data is weak, the Pound Sterling is likely to fall.
Another significant data release for the Pound Sterling is the Trade Balance. This indicator measures the difference between what a country earns from its exports and what it spends on imports over a given period. If a country produces highly sought-after exports, its currency will benefit purely from the extra demand created from foreign buyers seeking to purchase these goods. Therefore, a positive net Trade Balance strengthens a currency and vice versa for a negative balance.
The Australian Dollar (AUD) is expected to trade in a sideways range of 0.6530/0.6575. AUD weakness seems to be overextended, both time- and price-wise, but stabilisation is only upon a breach of 0.6615, UOB Group FX strategists Quek Ser Leang and Peter Chia note.
AUD is set to drift towards 0.6615
24-HOUR VIEW: “We indicated yesterday that ‘there is a chance of AUD rebounding, but the 0.6580 level is expected to offer strong resistance.’ We pointed out that ‘support levels are at 0.6535 and 0.6520.’ Our view did not materialise as AUD traded between 0.6524 and 0.6568, closing largely unchanged at 0.6549 (+0.03%). There has been no increase in either downward or upward momentum. Today, we expect AUD to trade in a sideways range of 0.6530/0.6575.”
1-3 WEEKS VIEW: “Our update from last Friday (26 Jul, spot at 0.6545) is still valid. As highlighted, the weakness in AUD that started about two weeks ago seems to be overextended, both time- and price-wise. However, only a breach of 0.6615 will indicate that the weakness has stabilised. As long as the ‘strong resistance’ level at 0.6615 is not breached, there is still a chance, albeit a low one, for AUD to decline further to 0.6480.”
- Silver price may approach the lower boundary of the descending channel at $26.40.
- Silver price consolidates within the descending channel pattern, suggesting a bearish bias.
- A breakthrough above the upper boundary of the descending channel could weaken the bearish bias.
Silver price holds position around the $28.00 level per troy ounce during the European session on Tuesday. The analysis of the daily chart indicates a bearish bias as the XAG/USD pair consolidates within the descending channel pattern.
Additionally, the 14-day Relative Strength Index (RSI) is consolidating above 30 level, suggesting confirmation of a downward trend. A break below the 30 level would indicate an oversold situation of the asset currency and is due for a correction in the short term.
Additionally, the momentum indicator Moving Average Convergence Divergence (MACD) suggests a bearish trend for Silver price. This configuration indicates that the overall trend is negative as the MACD line is above the centreline and the signal line.
In terms of support, the Silver price could navigate the area around the lower boundary of the descending channel at $26.40, followed by May’s low at $26.02 level.
On the upside, the Silver price could find immediate resistance around the upper boundary of the descending channel at the level of $28.30, followed by the “throwback support turned resistance” at the $28.60 level and nine-day Exponential Moving Average (EMA) at the $28.63 level.
A breakthrough above the latter could lead the XAG/USD pair to explore the region around the two-month high at the $31.75 level.
XAG/USD: Daily Chart
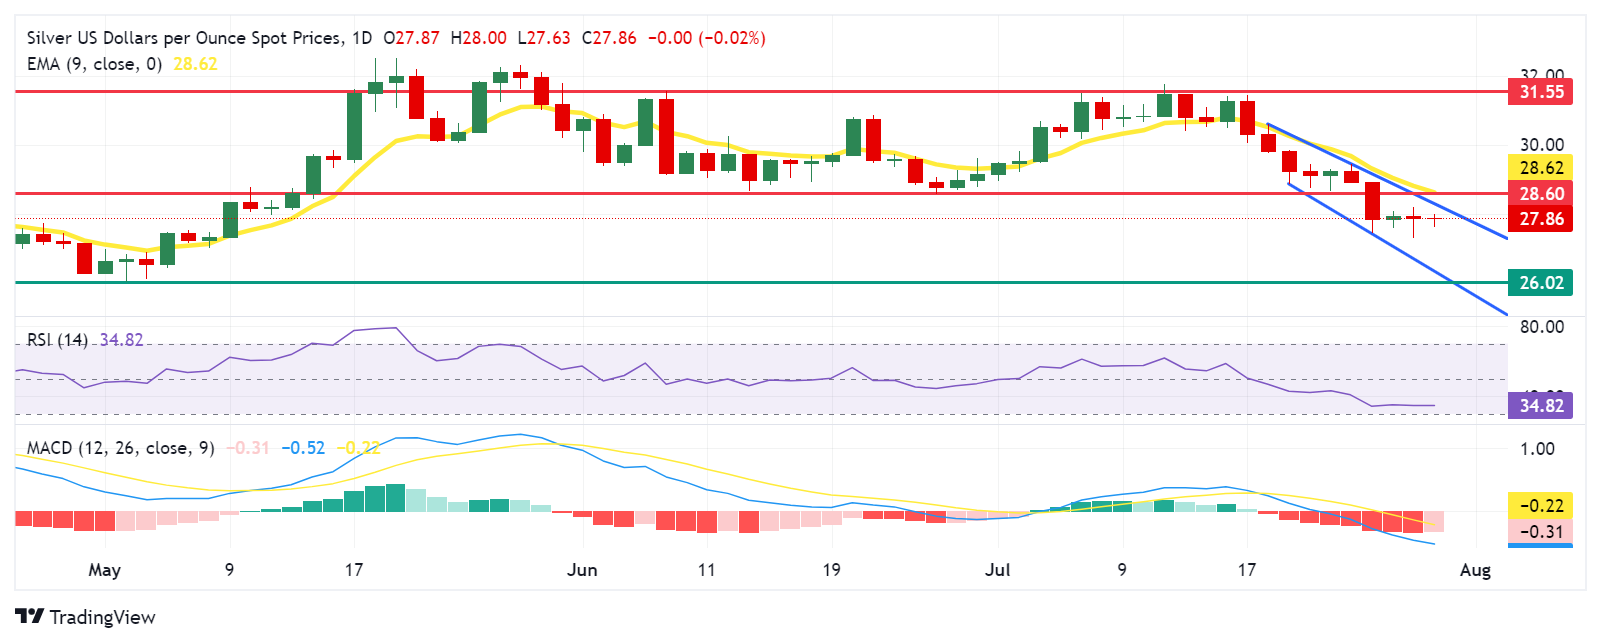
Silver FAQs
Silver is a precious metal highly traded among investors. It has been historically used as a store of value and a medium of exchange. Although less popular than Gold, traders may turn to Silver to diversify their investment portfolio, for its intrinsic value or as a potential hedge during high-inflation periods. Investors can buy physical Silver, in coins or in bars, or trade it through vehicles such as Exchange Traded Funds, which track its price on international markets.
Silver prices can move due to a wide range of factors. Geopolitical instability or fears of a deep recession can make Silver price escalate due to its safe-haven status, although to a lesser extent than Gold's. As a yieldless asset, Silver tends to rise with lower interest rates. Its moves also depend on how the US Dollar (USD) behaves as the asset is priced in dollars (XAG/USD). A strong Dollar tends to keep the price of Silver at bay, whereas a weaker Dollar is likely to propel prices up. Other factors such as investment demand, mining supply – Silver is much more abundant than Gold – and recycling rates can also affect prices.
Silver is widely used in industry, particularly in sectors such as electronics or solar energy, as it has one of the highest electric conductivity of all metals – more than Copper and Gold. A surge in demand can increase prices, while a decline tends to lower them. Dynamics in the US, Chinese and Indian economies can also contribute to price swings: for the US and particularly China, their big industrial sectors use Silver in various processes; in India, consumers’ demand for the precious metal for jewellery also plays a key role in setting prices.
Silver prices tend to follow Gold's moves. When Gold prices rise, Silver typically follows suit, as their status as safe-haven assets is similar. The Gold/Silver ratio, which shows the number of ounces of Silver needed to equal the value of one ounce of Gold, may help to determine the relative valuation between both metals. Some investors may consider a high ratio as an indicator that Silver is undervalued, or Gold is overvalued. On the contrary, a low ratio might suggest that Gold is undervalued relative to Silver.
The Eurozone economy expanded by 0.3% in the three months to June of 2024, at the same pace as seen in the first quarter, according to the preliminary estimate released by Eurostat on Tuesday.
The GDP data beat the market forecast for a 0.2% growth.
The bloc’s GDP expanded at an annual pace of 0.6% in Q2 vs. 0.4%% in Q1 while aligning with the estimated 0.6% print.
EUR/USD reaction to the Eurozone GDP report
EUR/USD is holding higher ground on the upbeat Eurozone growth data and was last seen trading at 1.0828, up 0.08% on the day.
Euro FAQs
The Euro is the currency for the 20 European Union countries that belong to the Eurozone. It is the second most heavily traded currency in the world behind the US Dollar. In 2022, it accounted for 31% of all foreign exchange transactions, with an average daily turnover of over $2.2 trillion a day. EUR/USD is the most heavily traded currency pair in the world, accounting for an estimated 30% off all transactions, followed by EUR/JPY (4%), EUR/GBP (3%) and EUR/AUD (2%).
The European Central Bank (ECB) in Frankfurt, Germany, is the reserve bank for the Eurozone. The ECB sets interest rates and manages monetary policy. The ECB’s primary mandate is to maintain price stability, which means either controlling inflation or stimulating growth. Its primary tool is the raising or lowering of interest rates. Relatively high interest rates – or the expectation of higher rates – will usually benefit the Euro and vice versa. The ECB Governing Council makes monetary policy decisions at meetings held eight times a year. Decisions are made by heads of the Eurozone national banks and six permanent members, including the President of the ECB, Christine Lagarde.
Eurozone inflation data, measured by the Harmonized Index of Consumer Prices (HICP), is an important econometric for the Euro. If inflation rises more than expected, especially if above the ECB’s 2% target, it obliges the ECB to raise interest rates to bring it back under control. Relatively high interest rates compared to its counterparts will usually benefit the Euro, as it makes the region more attractive as a place for global investors to park their money.
Data releases gauge the health of the economy and can impact on the Euro. Indicators such as GDP, Manufacturing and Services PMIs, employment, and consumer sentiment surveys can all influence the direction of the single currency. A strong economy is good for the Euro. Not only does it attract more foreign investment but it may encourage the ECB to put up interest rates, which will directly strengthen the Euro. Otherwise, if economic data is weak, the Euro is likely to fall. Economic data for the four largest economies in the euro area (Germany, France, Italy and Spain) are especially significant, as they account for 75% of the Eurozone’s economy.
Another significant data release for the Euro is the Trade Balance. This indicator measures the difference between what a country earns from its exports and what it spends on imports over a given period. If a country produces highly sought after exports then its currency will gain in value purely from the extra demand created from foreign buyers seeking to purchase these goods. Therefore, a positive net Trade Balance strengthens a currency and vice versa for a negative balance.
The Pound Sterling (GBP) is likely to trade in a range, probably between 1.2810 and 1.2890. Downward momentum is building, and GBP may also trade with a downward bias towards 1.2780, UOB Group FX strategists Quek Ser Leang and Peter Chia note.
The closest resistance is at 1.2890
24-HOUR VIEW: “Yesterday, we expected GBP to consolidate in a range of 1.2850/1.2895. However, GBP fell below the support at 1.2850, reaching a low of 1.2807. GBP then rebounded from the low, closing largely unchanged (1.2860, -0.05%). The price movements did not result in a significant increase in downward momentum. Today, GBP is likely to trade in a range, probably between 1.2810 and 1.2890.”
1-3 WEEKS VIEW: “We indicated last Friday (26 Jul, spot at 1.2855) that ‘downward momentum is building, but at this time, it is premature to expect a significant decline.’ We added, ‘Overall, provided that the ‘strong resistance’ (level currently at 1.2920) is not breached, GBP is expected to trade with a downward bias towards 1.2780.’ Yesterday, GBP fell to a low of 1.2807 before rebounding. While downward momentum has not improved much further, we continue to hold the same view for now. That said, the ‘strong resistance’ level has edged lower to 1.2910.”
Provided that Euro (EUR) remains below 1.0845, it could drop below 1.0800. The support at 1.0760 is unlikely to come under threat, UOB Group FX strategists Quek Ser Leang and Peter Chia note.
EUR is closing in on 1.0845
24-HOUR VIEW: “Our view of EUR trading sideways was incorrect, as it fell to a low of 1.0801. EUR closed at 1.0819 (-0.35%). Downward momentum has increased, albeit not much. Today, provided that EUR remains below 1.0845 (minor resistance is at 1.0835), it could drop below 1.0800. The major support at 1.0760 is unlikely to come under threat.”
1-3 WEEKS VIEW: “Our most recent narrative was from last Wednesday (24 Jul, spot at 1.0850), wherein EUR ‘is likely to trade with a downward bias, but the 1.0815 level is expected to provide solid support.’ We added, ‘if EUR breaks clearly below 1.0815, the next level to watch is 1.0760.’ After trading sideways for a few days, EUR fell sharply yesterday, breaking below 1.0815 (low of 1.0801). The focus is now at 1.0760. We will continue to hold a negative EUR view as long as 1.0870 (‘strong resistance’ level previously at 1.0890) is not breached.”
- USD/CAD declines due to a dovish sentiment surrounding the Fed’s policy trajectory in 2024.
- The US Dollar struggled as cooling inflation sparked discussions of the Fed implementing three rate cuts in this year.
- The upside of the commodity-linked CAD would be limited due to lower crude Oil prices.
USD/CAD pulls back after hitting an eight-month high at 1.3865 on Monday, trading around 1.3850 during the European hours on Tuesday. This downside is attributed to the dovish sentiment surrounding the US Federal Reserve’s (Fed) policy outlook in 2024
The US Federal Reserve (Fed) is expected to keep interest rates unchanged in Wednesday’s meeting. However, traders anticipate a Fed rate cut in September, with the CME FedWatch Tool indicating a 100% probability of at least a quarter percentage point cut. Additionally, signs of cooling inflation and easing labor market conditions in the United States have fueled expectations of three rate cuts by the Fed this year.
The downside of the USD/CAD pair could be limited as the US Dollar extends its gains due to risk aversion mood. However, the decline in US Treasury yields could put pressure on the Greenback and Loonie pair. 2-year and 10-year yields on US Treasury bonds stand at 4.39% and 4.18%, respectively, at the time of writing.
Meanwhile, the lower crude Oil prices exert downward pressure on the commodity-linked Canadian Dollar, limiting the downside of the USD/CAD pair. Given the fact that Canada is the biggest crude exporter to the United States (US). West Texas Intermediate (WTI) crude Oil price trades around $75.40 per barrel by the press time. WTI price extends its losses for the third session, attributed to a sluggish economic outlook in China and diminished supply concerns due to de-escalated Middle East tensions.
Canadian Dollar FAQs
The key factors driving the Canadian Dollar (CAD) are the level of interest rates set by the Bank of Canada (BoC), the price of Oil, Canada’s largest export, the health of its economy, inflation and the Trade Balance, which is the difference between the value of Canada’s exports versus its imports. Other factors include market sentiment – whether investors are taking on more risky assets (risk-on) or seeking safe-havens (risk-off) – with risk-on being CAD-positive. As its largest trading partner, the health of the US economy is also a key factor influencing the Canadian Dollar.
The Bank of Canada (BoC) has a significant influence on the Canadian Dollar by setting the level of interest rates that banks can lend to one another. This influences the level of interest rates for everyone. The main goal of the BoC is to maintain inflation at 1-3% by adjusting interest rates up or down. Relatively higher interest rates tend to be positive for the CAD. The Bank of Canada can also use quantitative easing and tightening to influence credit conditions, with the former CAD-negative and the latter CAD-positive.
The price of Oil is a key factor impacting the value of the Canadian Dollar. Petroleum is Canada’s biggest export, so Oil price tends to have an immediate impact on the CAD value. Generally, if Oil price rises CAD also goes up, as aggregate demand for the currency increases. The opposite is the case if the price of Oil falls. Higher Oil prices also tend to result in a greater likelihood of a positive Trade Balance, which is also supportive of the CAD.
While inflation had always traditionally been thought of as a negative factor for a currency since it lowers the value of money, the opposite has actually been the case in modern times with the relaxation of cross-border capital controls. Higher inflation tends to lead central banks to put up interest rates which attracts more capital inflows from global investors seeking a lucrative place to keep their money. This increases demand for the local currency, which in Canada’s case is the Canadian Dollar.
Macroeconomic data releases gauge the health of the economy and can have an impact on the Canadian Dollar. Indicators such as GDP, Manufacturing and Services PMIs, employment, and consumer sentiment surveys can all influence the direction of the CAD. A strong economy is good for the Canadian Dollar. Not only does it attract more foreign investment but it may encourage the Bank of Canada to put up interest rates, leading to a stronger currency. If economic data is weak, however, the CAD is likely to fall.
- German GDP falls 0.1% QoQ in Q2 vs. +0.1% forecast.
- Annual German GDP contracts 0.1% in Q2 vs. 0% estimates.
- EUR/USD shrugs off the downbeat German Q2 GDP report.
The German economy contracted by 0.1% over the quarter in the second quarter of 2024 after growing 0.2% in the first quarter, the preliminary data published by Destatis showed on Tuesday. The data missed the expected 0.1% increase.
Meanwhile, the annual GDP rate declined by 0.1% in Q2, compared with a 0.2% contraction in Q1 and the 0% forecast.
EUR/USD reaction to the German GDP data
EUR/USD ignores the German GDP contraction, adding 0.04% on the day to trade at 1.0825, at the time of writing. The pair awaits the Eurozone Preliminary GDP and Germany’s inflation data for a fresh directional impetus.
Euro PRICE Today
The table below shows the percentage change of Euro (EUR) against listed major currencies today. Euro was the strongest against the Japanese Yen.
| USD | EUR | GBP | JPY | CAD | AUD | NZD | CHF | |
|---|---|---|---|---|---|---|---|---|
| USD | -0.01% | 0.07% | 0.46% | -0.05% | -0.07% | -0.32% | 0.06% | |
| EUR | 0.01% | 0.08% | 0.50% | -0.02% | -0.07% | -0.30% | 0.08% | |
| GBP | -0.07% | -0.08% | 0.44% | -0.11% | -0.13% | -0.37% | -0.00% | |
| JPY | -0.46% | -0.50% | -0.44% | -0.55% | -0.56% | -0.81% | -0.42% | |
| CAD | 0.05% | 0.02% | 0.11% | 0.55% | -0.02% | -0.27% | 0.10% | |
| AUD | 0.07% | 0.07% | 0.13% | 0.56% | 0.02% | -0.25% | 0.11% | |
| NZD | 0.32% | 0.30% | 0.37% | 0.81% | 0.27% | 0.25% | 0.38% | |
| CHF | -0.06% | -0.08% | 0.00% | 0.42% | -0.10% | -0.11% | -0.38% |
The heat map shows percentage changes of major currencies against each other. The base currency is picked from the left column, while the quote currency is picked from the top row. For example, if you pick the Euro from the left column and move along the horizontal line to the US Dollar, the percentage change displayed in the box will represent EUR (base)/USD (quote).
- The US JOLTS data will be watched closely by investors ahead of the July jobs report.
- Job openings are forecast to edge lower to 8.03 million on the last business day of June.
- Markets fully price in a 25 basis points Fed rate cut in September.
The Job Openings and Labor Turnover Survey (JOLTS) will be released on Tuesday by the US Bureau of Labor Statistics (BLS). The publication will provide data about the change in the number of job openings in June, alongside the number of layoffs and quits.
JOLTS data is scrutinized by market participants and Federal Reserve (Fed) policymakers because it can provide valuable insights regarding the supply-demand dynamics in the labor market, a key factor impacting salaries and inflation. Job openings have been declining steadily since coming in above 12 million in March 2022, pointing to cooling conditions in the labor market. In May, the number of job openings rose to 8.14 million from the multi-year low set at 7.92 million in April.
What to expect in the next JOLTS report?
"Over the month, both the number of hires and total separations were little changed at 5.8 million and 5.4 million, respectively," the BLS noted in its May JOLTS report. "Within separations, quits (3.5 million) and layoffs and discharges (1.7 million) changed little," the BLS added.
Following the 9.3 million openings announced in September, job openings remained below 9 million for eight consecutive months. Investors expect job openings to edge slightly lower to 8.03 million in June from 8.14 million in May. Meanwhile, Nonfarm Payrolls rose by 206,000 in June following the 218,000 (revised from 272,000) increase recorded in May.
The US Dollar (USD) Index, which measures the USD’s valuation against a basket of six major currencies, is down more than 1% in July, with investors expecting a Fed rate cut in September. Soft inflation data in the second quarter and growing signs of a cooldown in labor market conditions fed into expectations for the Fed to start an easing cycle in September. According to the CME FedWatch Tool, investors see a nearly 70% probability that the Fed will reduce the policy rate by a total of 75 bps in 2024.
When will the JOLTS report be released and how could it affect EUR/USD?
Job openings numbers will be published on Tuesday, July 30, at 14:00 GMT. Eren Sengezer, European Session Lead Analyst at FXStreet, shares his view on the potential impact of JOLTS data on EUR/USD:
“Unless there is a significant divergence between the market expectation and the actual print, the market reaction to JOLTS data is likely to remain subdued, with investors refraining from taking large positions ahead of the Fed policy announcements on Wednesday and July jobs report on Friday.”
“Nevertheless, a reading above 8.5 million could help the USD find demand with the immediate reaction, while a print at or below 7.5 million could have the opposite impact on the USD’s valuation. The 100-day and the 200-day Simple Moving Averages (SMA) form key support level near 1.0800 for EUR/USD. If the pair falls below that level and starts using it as resistance, technical sellers could take action. In this scenario, additional losses toward 1.0700 (psychological level, static level) could be seen. On the upside, 1.0900 (psychological level, static level) and 1.0950 (July 17 high) align as technical resistance levels.”
Fed FAQs
Monetary policy in the US is shaped by the Federal Reserve (Fed). The Fed has two mandates: to achieve price stability and foster full employment. Its primary tool to achieve these goals is by adjusting interest rates. When prices are rising too quickly and inflation is above the Fed’s 2% target, it raises interest rates, increasing borrowing costs throughout the economy. This results in a stronger US Dollar (USD) as it makes the US a more attractive place for international investors to park their money. When inflation falls below 2% or the Unemployment Rate is too high, the Fed may lower interest rates to encourage borrowing, which weighs on the Greenback.
The Federal Reserve (Fed) holds eight policy meetings a year, where the Federal Open Market Committee (FOMC) assesses economic conditions and makes monetary policy decisions. The FOMC is attended by twelve Fed officials – the seven members of the Board of Governors, the president of the Federal Reserve Bank of New York, and four of the remaining eleven regional Reserve Bank presidents, who serve one-year terms on a rotating basis.
In extreme situations, the Federal Reserve may resort to a policy named Quantitative Easing (QE). QE is the process by which the Fed substantially increases the flow of credit in a stuck financial system. It is a non-standard policy measure used during crises or when inflation is extremely low. It was the Fed’s weapon of choice during the Great Financial Crisis in 2008. It involves the Fed printing more Dollars and using them to buy high grade bonds from financial institutions. QE usually weakens the US Dollar.
Quantitative tightening (QT) is the reverse process of QE, whereby the Federal Reserve stops buying bonds from financial institutions and does not reinvest the principal from the bonds it holds maturing, to purchase new bonds. It is usually positive for the value of the US Dollar.
- NZD/USD rebounds from a three-month low at 0.5857 recorded on Monday.
- The US Dollar may struggle due to dovish sentiment surrounding the Fed’s policy decision.
- The New Zealand Dollar faced challenges due to the disappointing economic outlook in China.
NZD/USD trades higher around 0.5900 during the early European hours on Tuesday. The New Zealand Dollar (NZD) rebounded against the US Dollar (USD) after hitting a three-month low at 0.5857 on Monday.
The NZD/USD pair might appreciate further as the US Federal Reserve (Fed) is expected to keep rates unchanged on Wednesday. However, traders anticipate a Fed rate cut in September, with the CME FedWatch Tool indicating a 100% probability of at least a quarter percentage point cut.
Additionally, signs of cooling inflation and easing labor market conditions in the United States have fueled expectations of three rate cuts by the Fed this year. However, last week, Bank of America indicated that strong economic growth in the United States allows the Federal Open Market Committee (FOMC) to "afford to wait" before making any changes. The bank states that the economy "remains on robust footing" and continues to expect the Fed to start cutting rates in December.
Traders are also anticipating key US data this week. Nonfarm Payrolls are expected to increase by 175,000 jobs in July, down from 206,000 in June. The Unemployment Rate is projected to remain steady at 4.1%, matching 2021 highs. Additionally, Average Hourly Earnings are forecasted to rise by 0.3% month-over-month.
On the Kiwi front, disappointing GDP figures in China and an unexpected rate cut by the People's Bank of China (PBOC) last week have added further selling pressure on the antipodean New Zealand Dollar (NZD), as New Zealand and China are close trade partners. Any changes in the Chinese economy could impact the Kiwi market.
However, rising bets for an early interest rate cut by the Reserve Bank of New Zealand (RBNZ) next week continue to weigh on the Kiwi Dollar. Markets are pricing in a 44% chance of a rate cut at the central bank’s August meeting.
New Zealand Dollar FAQs
The New Zealand Dollar (NZD), also known as the Kiwi, is a well-known traded currency among investors. Its value is broadly determined by the health of the New Zealand economy and the country’s central bank policy. Still, there are some unique particularities that also can make NZD move. The performance of the Chinese economy tends to move the Kiwi because China is New Zealand’s biggest trading partner. Bad news for the Chinese economy likely means less New Zealand exports to the country, hitting the economy and thus its currency. Another factor moving NZD is dairy prices as the dairy industry is New Zealand’s main export. High dairy prices boost export income, contributing positively to the economy and thus to the NZD.
The Reserve Bank of New Zealand (RBNZ) aims to achieve and maintain an inflation rate between 1% and 3% over the medium term, with a focus to keep it near the 2% mid-point. To this end, the bank sets an appropriate level of interest rates. When inflation is too high, the RBNZ will increase interest rates to cool the economy, but the move will also make bond yields higher, increasing investors’ appeal to invest in the country and thus boosting NZD. On the contrary, lower interest rates tend to weaken NZD. The so-called rate differential, or how rates in New Zealand are or are expected to be compared to the ones set by the US Federal Reserve, can also play a key role in moving the NZD/USD pair.
Macroeconomic data releases in New Zealand are key to assess the state of the economy and can impact the New Zealand Dollar’s (NZD) valuation. A strong economy, based on high economic growth, low unemployment and high confidence is good for NZD. High economic growth attracts foreign investment and may encourage the Reserve Bank of New Zealand to increase interest rates, if this economic strength comes together with elevated inflation. Conversely, if economic data is weak, NZD is likely to depreciate.
The New Zealand Dollar (NZD) tends to strengthen during risk-on periods, or when investors perceive that broader market risks are low and are optimistic about growth. This tends to lead to a more favorable outlook for commodities and so-called ‘commodity currencies’ such as the Kiwi. Conversely, NZD tends to weaken at times of market turbulence or economic uncertainty as investors tend to sell higher-risk assets and flee to the more-stable safe havens.
- EUR/USD trades sideways above 1.0800 ahead of crucial Eurozone/US macroeconomic events.
- The ECB may cut interest rates two more times this year.
- The Fed is expected to openly endorse rate cuts in September.
EUR/USD exhibits a sideways performance in Tuesday’s European session while the US Dollar (USD) edges higher amid uncertainty among market participants ahead of the Federal Reserve’s (Fed) monetary policy announcement on Wednesday. The US Dollar Index (DXY), which tracks the Greenback’s value against six major currencies, moves higher to near 104.70.
The Fed is expected to leave interest rates unchanged in the range of 5.25%-5.50% for the eighth consecutive meeting. It is anticipated to be the last steady interest rate decision, and the Fed will pivot to policy normalization starting from the September meeting.
According to the CME FedWatch tool, 30-day Federal Fund futures pricing data shows that the central bank will reduce interest rates by 25 basis points (bps) from their current levels in the September meeting. The data also shows that there will be two more rate cuts before year end instead of one as projected by Fed’s policymakers in the latest Fed dot plot.
Market experts see the Fed acknowledging the return of inflation on the path towards the bank’s target of 2% and some progress, too, along with upside risks to labor market strength. This would indicate the Fed’s readiness to unwind the more than two-year-long policy-tightening framework.
This week, investors will also focus on a slew of economic data. In Tuesday’s session, investors will focus on JOLTS Job Openings data for June, which will be published at 14:00 GMT. The number of job vacancies posted by employers is estimated to have declined to 8.03 million from the former release of 8.14 million.
Daily digest market movers: EUR/USD trades back and forth ahead of German GDP and inflation
- EUR/USD trades in a tight range, slightly above the immediate support of 1.0800 in Tuesday’s European session. The major currency pair struggles for direction as investors have sidelined ahead of the preliminary German and Eurozone Q2 Gross Domestic Product (GDP) and the German Harmonized Index of Consumer Prices (HICP) for July.
- The economic data will indicate whether current market speculation that the European Central Bank (ECB) will cut its key borrowing rates two more times this year are appropriate. Eurozone and German economies are estimated to have grown at a slower pace of 0.2% and 0.1%, respectively. German annual HICP is expected to have decelerated to 2.4% from June’s reading of 2.5%, with monthly figures growing steadily by 0.2%.
- The scenario of slower GDP growth and soft inflation would be unfavorable for the Euro as it will boost expectations of two more rate cuts by the ECB this year. The ECB initiated its policy-easing cycle in June but didn’t cut interest rates sequentially in July as policymakers worry that an aggressive expansionary stance could lift price pressures again.
- This week, the major trigger for the Euro will be the Eurozone preliminary Harmonized Index of Consumer Prices (HICP) for July, which will be published on Wednesday. Annually, headline and core HICP, which excludes volatile items like food, energy, alcohol, and tobacco, are estimated to have decelerated to 2.4% and 2.8%, respectively.
Technical Analysis: EUR/USD consolidates above 1.0800
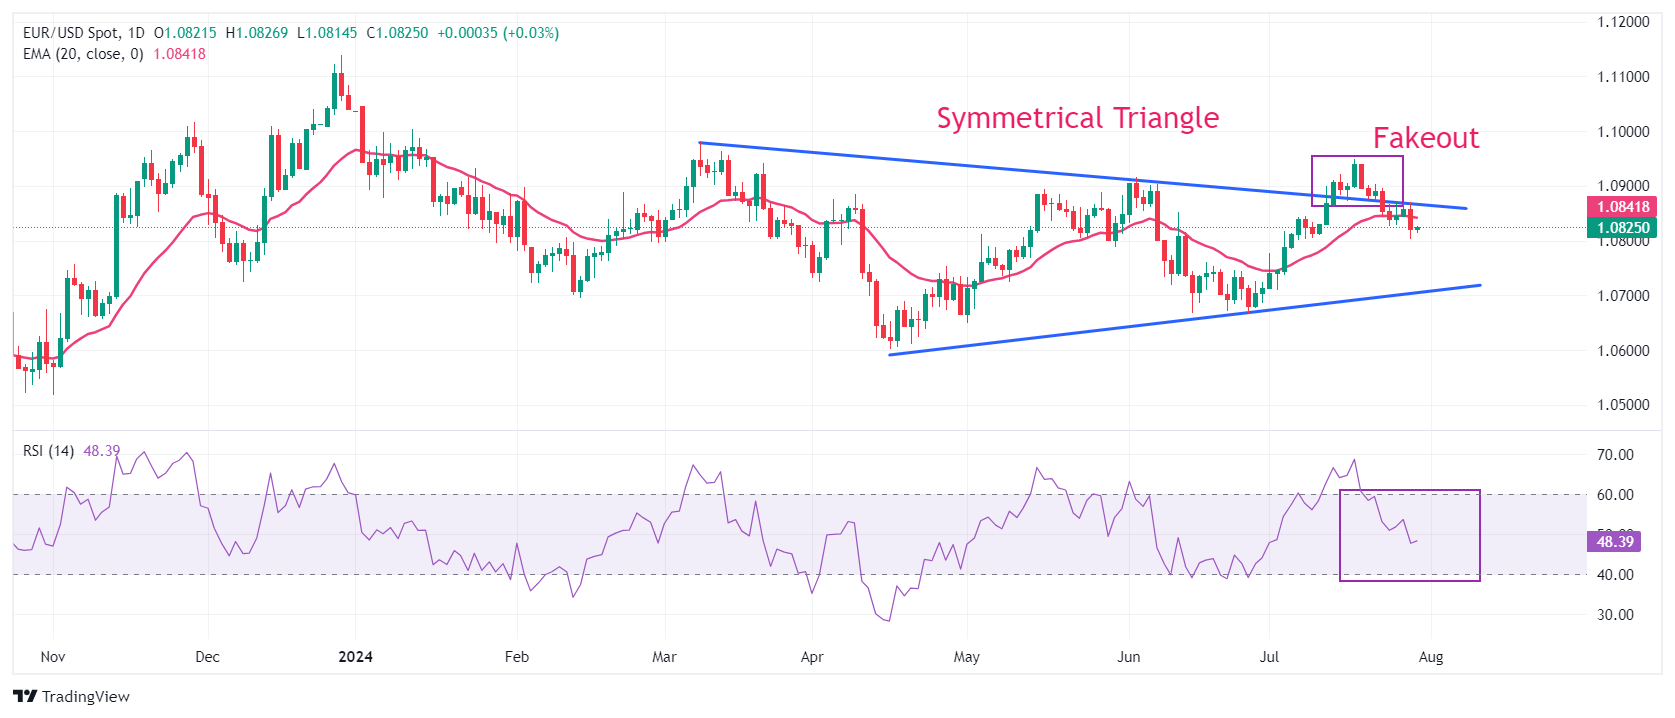
EUR/USD trades inside Monday’s trading range and holds key support of 1.0800. The shared currency pair remains inside a Symmetrical Triangle pattern on a daily timeframe after failing to hold the breakout. The major currency pair settles below the 20-day Exponential Moving Average (EMA), which trades around 1.0840.
The major could slide further towards round-level supports near 1.0800 and 1.0700. On the upside, the round-level resistance of 1.0900 will be a key barrier for the Euro bulls.
The 14-day Relative Strength Index (RSI) returns within the 40.00-60.00 range, suggesting the bullish momentum has faded.
Euro FAQs
The Euro is the currency for the 20 European Union countries that belong to the Eurozone. It is the second most heavily traded currency in the world behind the US Dollar. In 2022, it accounted for 31% of all foreign exchange transactions, with an average daily turnover of over $2.2 trillion a day. EUR/USD is the most heavily traded currency pair in the world, accounting for an estimated 30% off all transactions, followed by EUR/JPY (4%), EUR/GBP (3%) and EUR/AUD (2%).
The European Central Bank (ECB) in Frankfurt, Germany, is the reserve bank for the Eurozone. The ECB sets interest rates and manages monetary policy. The ECB’s primary mandate is to maintain price stability, which means either controlling inflation or stimulating growth. Its primary tool is the raising or lowering of interest rates. Relatively high interest rates – or the expectation of higher rates – will usually benefit the Euro and vice versa. The ECB Governing Council makes monetary policy decisions at meetings held eight times a year. Decisions are made by heads of the Eurozone national banks and six permanent members, including the President of the ECB, Christine Lagarde.
Eurozone inflation data, measured by the Harmonized Index of Consumer Prices (HICP), is an important econometric for the Euro. If inflation rises more than expected, especially if above the ECB’s 2% target, it obliges the ECB to raise interest rates to bring it back under control. Relatively high interest rates compared to its counterparts will usually benefit the Euro, as it makes the region more attractive as a place for global investors to park their money.
Data releases gauge the health of the economy and can impact on the Euro. Indicators such as GDP, Manufacturing and Services PMIs, employment, and consumer sentiment surveys can all influence the direction of the single currency. A strong economy is good for the Euro. Not only does it attract more foreign investment but it may encourage the ECB to put up interest rates, which will directly strengthen the Euro. Otherwise, if economic data is weak, the Euro is likely to fall. Economic data for the four largest economies in the euro area (Germany, France, Italy and Spain) are especially significant, as they account for 75% of the Eurozone’s economy.
Another significant data release for the Euro is the Trade Balance. This indicator measures the difference between what a country earns from its exports and what it spends on imports over a given period. If a country produces highly sought after exports then its currency will gain in value purely from the extra demand created from foreign buyers seeking to purchase these goods. Therefore, a positive net Trade Balance strengthens a currency and vice versa for a negative balance.
Here is what you need to know on Tuesday, July 30:
Investors remain cautious following Monday's choppy action in financial markets. Second-quarter Gross Domestic Product (GDP) from the Euro area and Germany will be watched closely ahead of July Consumer Price Index (CPI) data from Germany on Tuesday. In the second half of the day, Conference Board Consumer Confidence Index for July and JOLTS Job Openings data for June will be featured in the US economic docket.
US Dollar PRICE This week
The table below shows the percentage change of US Dollar (USD) against listed major currencies this week. US Dollar was the strongest against the Japanese Yen.
| USD | EUR | GBP | JPY | CAD | AUD | NZD | CHF | |
|---|---|---|---|---|---|---|---|---|
| USD | 0.30% | 0.08% | 0.79% | 0.08% | -0.18% | -0.16% | 0.32% | |
| EUR | -0.30% | -0.25% | 0.47% | -0.19% | -0.43% | -0.47% | 0.04% | |
| GBP | -0.08% | 0.25% | 0.72% | 0.03% | -0.17% | -0.20% | 0.28% | |
| JPY | -0.79% | -0.47% | -0.72% | -0.73% | -0.94% | -0.94% | -0.43% | |
| CAD | -0.08% | 0.19% | -0.03% | 0.73% | -0.23% | -0.27% | 0.24% | |
| AUD | 0.18% | 0.43% | 0.17% | 0.94% | 0.23% | -0.00% | 0.46% | |
| NZD | 0.16% | 0.47% | 0.20% | 0.94% | 0.27% | 0.00% | 0.49% | |
| CHF | -0.32% | -0.04% | -0.28% | 0.43% | -0.24% | -0.46% | -0.49% |
The heat map shows percentage changes of major currencies against each other. The base currency is picked from the left column, while the quote currency is picked from the top row. For example, if you pick the US Dollar from the left column and move along the horizontal line to the Japanese Yen, the percentage change displayed in the box will represent USD (base)/JPY (quote).
The US Dollar (USD) gathered strength at the beginning of the week as market mood soured on escalating geopolitical tensions. In the meantime, investors might have adjusted their positions ahead of the Federal Reserve's (Fed) monetary policy announcements on Wednesday. As Wall Street's main indexes closed mixed on Monday, the USD Index climbed to its highest level in nearly 20 days and closed in positive territory. In the European morning on Tuesday, US stock index futures trade marginally lower and the USD Index clings to modest daily gains above 104.50. Meanwhile, the benchmark 10-year US Treasury bond yield stays slightly below 4.2% after posting small losses on Monday.
During the Asian trading hours, the data from Australia showed that Building Permits declined by 6.5% on a monthly basis in June. This reading followed the 5.7% increase recorded in May and came in worse than the market expectation for a decrease of 3%. AUD/USD showed no reaction to this data and was last seen trading marginally higher on the day above 0.6550.
EUR/USD came in within a few pips of 1.0800 on Monday but managed to find a foothold. The pair fluctuates in a tight range at around 1.0800 early Tuesday.
After falling toward 1.2800 and touching its weakest level in nearly three weeks, GBP/USD staged a late rebound to close flat on Monday. The pair stays in a consolidation phase slightly above 1.2850 in the European morning.
Following Monday's indecisive action, USD/JPY gathered bullish momentum in the Asian session on Monday. At the time of press, the pair was up more than 0.6% on the day at 155.00. Early Wednesday, the Bank of Japan will announce monetary policy decisions.
Gold failed to make a decisive move in either direction on Monday amid a lack of activity in US Treasury bond yields. Early Tuesday, XAU/USD clings to small daily gains at around $2,390.
GDP FAQs
A country’s Gross Domestic Product (GDP) measures the rate of growth of its economy over a given period of time, usually a quarter. The most reliable figures are those that compare GDP to the previous quarter e.g Q2 of 2023 vs Q1 of 2023, or to the same period in the previous year, e.g Q2 of 2023 vs Q2 of 2022. Annualized quarterly GDP figures extrapolate the growth rate of the quarter as if it were constant for the rest of the year. These can be misleading, however, if temporary shocks impact growth in one quarter but are unlikely to last all year – such as happened in the first quarter of 2020 at the outbreak of the covid pandemic, when growth plummeted.
A higher GDP result is generally positive for a nation’s currency as it reflects a growing economy, which is more likely to produce goods and services that can be exported, as well as attracting higher foreign investment. By the same token, when GDP falls it is usually negative for the currency. When an economy grows people tend to spend more, which leads to inflation. The country’s central bank then has to put up interest rates to combat the inflation with the side effect of attracting more capital inflows from global investors, thus helping the local currency appreciate.
When an economy grows and GDP is rising, people tend to spend more which leads to inflation. The country’s central bank then has to put up interest rates to combat the inflation. Higher interest rates are negative for Gold because they increase the opportunity-cost of holding Gold versus placing the money in a cash deposit account. Therefore, a higher GDP growth rate is usually a bearish factor for Gold price.
- USD/CHF holds positive ground around 0.8870 in Tuesday’s early European session.
- The Fed is expected to hold the rate at the current level of 5.25% to 5.50% on Wednesday.
- Uncertainty and the ongoing Middle East geopolitical tensions are likely to cap the Swiss Franc’s downside.
The USD/CHF pair extends the rally near 0.8870 during the early European session on Tuesday. The stronger US Dollar (USD) broadly provides some support to the pair. The market might turn cautious ahead of the US Federal Reserve (Fed) Interest Rate Decision on Wednesday.
The Federal Reserve will hold monetary policy meetings this week, with no change in rate expected. However, the markets widely anticipate the Fed will start easing its policy at its following meeting in September. With inflation easing faster than estimated in June, the markets have priced in nearly 64% odds that the Fed will cut rates three times this year — in September, November and December, according to the CME FedWatch.
"At the moment, a modest cut of 25 basis points in September seems likely. If that goes well, we could even see two additional 25 basis point cuts before 2024 comes to an end," said Jacob Channel, chief economist at LendingTree. Traders will take more cues from Fed Chair Jerome Powell during the press conference for the interest rate outlook. If the Fed officials deliver dovish comments, this might drag the Greenback lower and cap the upside for the pair.
On the Swiss front, uncertainty over the trajectory of the U.S. presidential race, the fear of a Chinese economic slowdown, and the ongoing geopolitical tensions in the Middle East might boost safe-haven flows, benefiting the Swiss Franc (CHF). Looking ahead, the Swiss KOF Leading indicator for July is due on Tuesday. On Friday, Switzerland’s Consumer Price Index (CPI) will be released, which is projected to show an increase of 1.3% YoY in June.
Traders would be cautious about betting on an even stronger CHF as long as the Swiss National Bank (SNB) does not initiate a change of rate direction. A further rate cut in September is now priced in nearly 90%, compared with just around 37% two weeks ago.
Swiss Franc FAQs
The Swiss Franc (CHF) is Switzerland’s official currency. It is among the top ten most traded currencies globally, reaching volumes that well exceed the size of the Swiss economy. Its value is determined by the broad market sentiment, the country’s economic health or action taken by the Swiss National Bank (SNB), among other factors. Between 2011 and 2015, the Swiss Franc was pegged to the Euro (EUR). The peg was abruptly removed, resulting in a more than 20% increase in the Franc’s value, causing a turmoil in markets. Even though the peg isn’t in force anymore, CHF fortunes tend to be highly correlated with the Euro ones due to the high dependency of the Swiss economy on the neighboring Eurozone.
The Swiss Franc (CHF) is considered a safe-haven asset, or a currency that investors tend to buy in times of market stress. This is due to the perceived status of Switzerland in the world: a stable economy, a strong export sector, big central bank reserves or a longstanding political stance towards neutrality in global conflicts make the country’s currency a good choice for investors fleeing from risks. Turbulent times are likely to strengthen CHF value against other currencies that are seen as more risky to invest in.
The Swiss National Bank (SNB) meets four times a year – once every quarter, less than other major central banks – to decide on monetary policy. The bank aims for an annual inflation rate of less than 2%. When inflation is above target or forecasted to be above target in the foreseeable future, the bank will attempt to tame price growth by raising its policy rate. Higher interest rates are generally positive for the Swiss Franc (CHF) as they lead to higher yields, making the country a more attractive place for investors. On the contrary, lower interest rates tend to weaken CHF.
Macroeconomic data releases in Switzerland are key to assessing the state of the economy and can impact the Swiss Franc’s (CHF) valuation. The Swiss economy is broadly stable, but any sudden change in economic growth, inflation, current account or the central bank’s currency reserves have the potential to trigger moves in CHF. Generally, high economic growth, low unemployment and high confidence are good for CHF. Conversely, if economic data points to weakening momentum, CHF is likely to depreciate.
As a small and open economy, Switzerland is heavily dependent on the health of the neighboring Eurozone economies. The broader European Union is Switzerland’s main economic partner and a key political ally, so macroeconomic and monetary policy stability in the Eurozone is essential for Switzerland and, thus, for the Swiss Franc (CHF). With such dependency, some models suggest that the correlation between the fortunes of the Euro (EUR) and the CHF is more than 90%, or close to perfect.
China’s Politburo, the country’s top leadership, held a meeting on Tuesday to study the current economic situation, laying out economic priorities for the second half of 2024, the country’s state media reported.
Key takeaways
Unfavorable impacts from changes in external environment are increasing.
Domestic effective demand remains insufficient.
There are still many risks and hidden dangers in key areas.
These are issues in development and transformation.
Macroeconomic policies should continue to be more vigorous and more forceful.
It is necessary to strengthen counter-cyclical adjustments, implement a proactive ficscal policy and prudent monetary policy.
Should speed up the implementation of the identified policy measures.
Should reserve and launch a number of incremental policy measures as soon as possible.
It is necessary to focus on boosting consumption to expand domestic demand.
It is necessary to speed up the issuance and use of special funds, make good use of ultra long-term special treasury bonds.
Should increase residents' income through multiple channels, enhance the consumption ability and willingness of low- and middle-income groups.
It is necessary to cultivate and expand emerging industries and future industries.
It is necessary to comprehensively use a variety of monetary policy tools.
It is necessary to increase financial support for the real economy, and promote a steady decline in the cost of comprehensive social financing.
It is necessary to maintain the basic stability of the Renminbi exchange rate at a reasonable and balanced level.
Will launch a new round of pilot measures to expand the opening up of the service industry, so as to promote the use of foreign capital for stability.
It is necessary to actively cultivate new momentum for the development of foreign trade.
Will create conditions to accelerate the resolution of debt risks of local financing platforms.
It is necessary to strengthen the employment priority policy and do a good job in the employment of key groups such as college graduates.
Market reaction
The Australian Dollar is holding the latest upside following these Chinese headlines, with AUD/USD adding 0.11% on the day to trade near 0.6555, as of writing.
Australian Dollar FAQs
One of the most significant factors for the Australian Dollar (AUD) is the level of interest rates set by the Reserve Bank of Australia (RBA). Because Australia is a resource-rich country another key driver is the price of its biggest export, Iron Ore. The health of the Chinese economy, its largest trading partner, is a factor, as well as inflation in Australia, its growth rate and Trade Balance. Market sentiment – whether investors are taking on more risky assets (risk-on) or seeking safe-havens (risk-off) – is also a factor, with risk-on positive for AUD.
The Reserve Bank of Australia (RBA) influences the Australian Dollar (AUD) by setting the level of interest rates that Australian banks can lend to each other. This influences the level of interest rates in the economy as a whole. The main goal of the RBA is to maintain a stable inflation rate of 2-3% by adjusting interest rates up or down. Relatively high interest rates compared to other major central banks support the AUD, and the opposite for relatively low. The RBA can also use quantitative easing and tightening to influence credit conditions, with the former AUD-negative and the latter AUD-positive.
China is Australia’s largest trading partner so the health of the Chinese economy is a major influence on the value of the Australian Dollar (AUD). When the Chinese economy is doing well it purchases more raw materials, goods and services from Australia, lifting demand for the AUD, and pushing up its value. The opposite is the case when the Chinese economy is not growing as fast as expected. Positive or negative surprises in Chinese growth data, therefore, often have a direct impact on the Australian Dollar and its pairs.
Iron Ore is Australia’s largest export, accounting for $118 billion a year according to data from 2021, with China as its primary destination. The price of Iron Ore, therefore, can be a driver of the Australian Dollar. Generally, if the price of Iron Ore rises, AUD also goes up, as aggregate demand for the currency increases. The opposite is the case if the price of Iron Ore falls. Higher Iron Ore prices also tend to result in a greater likelihood of a positive Trade Balance for Australia, which is also positive of the AUD.
The Trade Balance, which is the difference between what a country earns from its exports versus what it pays for its imports, is another factor that can influence the value of the Australian Dollar. If Australia produces highly sought after exports, then its currency will gain in value purely from the surplus demand created from foreign buyers seeking to purchase its exports versus what it spends to purchase imports. Therefore, a positive net Trade Balance strengthens the AUD, with the opposite effect if the Trade Balance is negative.
- EUR/GBP gains ground ahead of the release of GDP data from the Eurozone and Germany.
- Germany’s CPI is forecasted to rise by 0.2% MoM in July, compared to June’s 0.1% reading.
- UK Chancellor Rachel Reeves delivered a series of spending cuts in her first Parliament statement.
EUR/GBP halts two days of losses, trading around 0.8420 during the Asian session on Tuesday. The Euro appreciates ahead of Gross Domestic Product (GDP) data from the Eurozone and Germany for the second quarter on Tuesday. Germany will also release the Consumer Price Index (CPI) for July.
German GDP growth for Q2 is expected to ease to 0.1% quarter-over-quarter, down from 0.2% in the previous period. Annualized Eurozone GDP growth is forecasted to increase to 0.6%, up from 0.4%, though the quarter-over-quarter figure for the second quarter is anticipated to dip to 0.2% from 0.3%. Additionally, the German Consumer Price Index (CPI) is projected to rise by 0.2% month-over-month in July, compared to 0.1% previously.
In the United Kingdom, Chancellor Rachel Reeves delivered her first statement in Parliament on Monday, presenting a series of spending cuts and project delays following an audit of public finances. Reeves also announced that the Budget would be presented on October 30 and would involve “difficult decisions” regarding tax, spending, and welfare, according to the BBC.
The monthly Retail Sales Balance from the Confederation of British Industry (CBI) dropped to -43 in July, down from -24 in June and significantly worse than the forecast of -20. This marks the second consecutive month of declining annual sales. The reduced likelihood of an interest rate cut by the Bank of England (BoE) in August may continue to support the British Pound (GBP) and limit the downside for the EUR/GBP cross.
Euro FAQs
The Euro is the currency for the 20 European Union countries that belong to the Eurozone. It is the second most heavily traded currency in the world behind the US Dollar. In 2022, it accounted for 31% of all foreign exchange transactions, with an average daily turnover of over $2.2 trillion a day. EUR/USD is the most heavily traded currency pair in the world, accounting for an estimated 30% off all transactions, followed by EUR/JPY (4%), EUR/GBP (3%) and EUR/AUD (2%).
The European Central Bank (ECB) in Frankfurt, Germany, is the reserve bank for the Eurozone. The ECB sets interest rates and manages monetary policy. The ECB’s primary mandate is to maintain price stability, which means either controlling inflation or stimulating growth. Its primary tool is the raising or lowering of interest rates. Relatively high interest rates – or the expectation of higher rates – will usually benefit the Euro and vice versa. The ECB Governing Council makes monetary policy decisions at meetings held eight times a year. Decisions are made by heads of the Eurozone national banks and six permanent members, including the President of the ECB, Christine Lagarde.
Eurozone inflation data, measured by the Harmonized Index of Consumer Prices (HICP), is an important econometric for the Euro. If inflation rises more than expected, especially if above the ECB’s 2% target, it obliges the ECB to raise interest rates to bring it back under control. Relatively high interest rates compared to its counterparts will usually benefit the Euro, as it makes the region more attractive as a place for global investors to park their money.
Data releases gauge the health of the economy and can impact on the Euro. Indicators such as GDP, Manufacturing and Services PMIs, employment, and consumer sentiment surveys can all influence the direction of the single currency. A strong economy is good for the Euro. Not only does it attract more foreign investment but it may encourage the ECB to put up interest rates, which will directly strengthen the Euro. Otherwise, if economic data is weak, the Euro is likely to fall. Economic data for the four largest economies in the euro area (Germany, France, Italy and Spain) are especially significant, as they account for 75% of the Eurozone’s economy.
Another significant data release for the Euro is the Trade Balance. This indicator measures the difference between what a country earns from its exports and what it spends on imports over a given period. If a country produces highly sought after exports then its currency will gain in value purely from the extra demand created from foreign buyers seeking to purchase these goods. Therefore, a positive net Trade Balance strengthens a currency and vice versa for a negative balance.
Gold prices rose in India on Tuesday, according to data compiled by FXStreet.
The price for Gold stood at 6,425.81 Indian Rupees (INR) per gram, up compared with the INR 6,417.60 it cost on Monday.
The price for Gold increased to INR 74,949.42 per tola from INR 74,853.65 per tola a day earlier.
| Unit measure | Gold Price in INR |
|---|---|
| 1 Gram | 6,425.81 |
| 10 Grams | 64,258.13 |
| Tola | 74,949.42 |
| Troy Ounce | 199,865.30 |
FXStreet calculates Gold prices in India by adapting international prices (USD/INR) to the local currency and measurement units. Prices are updated daily based on the market rates taken at the time of publication. Prices are just for reference and local rates could diverge slightly.
Gold FAQs
Gold has played a key role in human’s history as it has been widely used as a store of value and medium of exchange. Currently, apart from its shine and usage for jewelry, the precious metal is widely seen as a safe-haven asset, meaning that it is considered a good investment during turbulent times. Gold is also widely seen as a hedge against inflation and against depreciating currencies as it doesn’t rely on any specific issuer or government.
Central banks are the biggest Gold holders. In their aim to support their currencies in turbulent times, central banks tend to diversify their reserves and buy Gold to improve the perceived strength of the economy and the currency. High Gold reserves can be a source of trust for a country’s solvency. Central banks added 1,136 tonnes of Gold worth around $70 billion to their reserves in 2022, according to data from the World Gold Council. This is the highest yearly purchase since records began. Central banks from emerging economies such as China, India and Turkey are quickly increasing their Gold reserves.
Gold has an inverse correlation with the US Dollar and US Treasuries, which are both major reserve and safe-haven assets. When the Dollar depreciates, Gold tends to rise, enabling investors and central banks to diversify their assets in turbulent times. Gold is also inversely correlated with risk assets. A rally in the stock market tends to weaken Gold price, while sell-offs in riskier markets tend to favor the precious metal.
The price can move due to a wide range of factors. Geopolitical instability or fears of a deep recession can quickly make Gold price escalate due to its safe-haven status. As a yield-less asset, Gold tends to rise with lower interest rates, while higher cost of money usually weighs down on the yellow metal. Still, most moves depend on how the US Dollar (USD) behaves as the asset is priced in dollars (XAU/USD). A strong Dollar tends to keep the price of Gold controlled, whereas a weaker Dollar is likely to push Gold prices up.
(An automation tool was used in creating this post.)
- EUR/JPY gains traction around 167.20 in Tuesday’s early European session.
- The advanced Gross Domestic Product (GDP) from Eurozone/Germany will be closely watched later on Tuesday.
- The BoJ is anticipated to raise the interest rate by 10 bps at its upcoming meeting on Wednesday.
The EUR/JPY cross recovers some lost ground near 167.20 during the early European session on Tuesday. The Japanese Yen (JPY) extends its decline for the second consecutive day, which provides some support to the cross. Traders will monitor the release of Gross Domestic Product (GDP) for the second quarter (Q2) from the Eurozone and Germany on Tuesday. On Wednesday, all eyes will be on the Bank of Japan’s (BoJ) policy meeting.
The weaker German IFO survey results and softer economic data from the Eurozone last week fuelled speculation of another rate cut by the European Central Bank (ECB). ECB President Christine Lagarde highlighted during its latest press conference that the central bank will maintain a data-dependent approach, with September's rate cut still undecided.
Traders will take more cues from the GDP growth numbers later in the day, which might deliver crucial information for the ECB as officials look for signals on whether to resume interest-rate cuts in September. The German economy is estimated to grow 0.1% QoQ in Q2, while the Eurozone economy is projected to expand 0.2% QoQ in the same reporting period. In the case of the stronger-than-expected readings, this could lift the shared currency against the JPY.
On the other hand, the growing speculation that the BoJ would hike the rate on Wednesday might boost the JPY and cap the upside for the cross. A Reuters poll of economists expects the Japanese central bank to raise rates by 10 basis points (bps) to 0.1% at its upcoming July meeting.
Elsewhere, data released by the Statistics Bureau of Japan showed that the country's Unemployment Rate fell to 2.5% in June from 2.6% in May. This figure registered the first improvement in five months and came in above the market consensus of 2.6%.
Euro FAQs
The Euro is the currency for the 20 European Union countries that belong to the Eurozone. It is the second most heavily traded currency in the world behind the US Dollar. In 2022, it accounted for 31% of all foreign exchange transactions, with an average daily turnover of over $2.2 trillion a day. EUR/USD is the most heavily traded currency pair in the world, accounting for an estimated 30% off all transactions, followed by EUR/JPY (4%), EUR/GBP (3%) and EUR/AUD (2%).
The European Central Bank (ECB) in Frankfurt, Germany, is the reserve bank for the Eurozone. The ECB sets interest rates and manages monetary policy. The ECB’s primary mandate is to maintain price stability, which means either controlling inflation or stimulating growth. Its primary tool is the raising or lowering of interest rates. Relatively high interest rates – or the expectation of higher rates – will usually benefit the Euro and vice versa. The ECB Governing Council makes monetary policy decisions at meetings held eight times a year. Decisions are made by heads of the Eurozone national banks and six permanent members, including the President of the ECB, Christine Lagarde.
Eurozone inflation data, measured by the Harmonized Index of Consumer Prices (HICP), is an important econometric for the Euro. If inflation rises more than expected, especially if above the ECB’s 2% target, it obliges the ECB to raise interest rates to bring it back under control. Relatively high interest rates compared to its counterparts will usually benefit the Euro, as it makes the region more attractive as a place for global investors to park their money.
Data releases gauge the health of the economy and can impact on the Euro. Indicators such as GDP, Manufacturing and Services PMIs, employment, and consumer sentiment surveys can all influence the direction of the single currency. A strong economy is good for the Euro. Not only does it attract more foreign investment but it may encourage the ECB to put up interest rates, which will directly strengthen the Euro. Otherwise, if economic data is weak, the Euro is likely to fall. Economic data for the four largest economies in the euro area (Germany, France, Italy and Spain) are especially significant, as they account for 75% of the Eurozone’s economy.
Another significant data release for the Euro is the Trade Balance. This indicator measures the difference between what a country earns from its exports and what it spends on imports over a given period. If a country produces highly sought after exports then its currency will gain in value purely from the extra demand created from foreign buyers seeking to purchase these goods. Therefore, a positive net Trade Balance strengthens a currency and vice versa for a negative balance.
FX option expiries for July 30 NY cut at 10:00 Eastern Time, via DTCC, can be found below.
EUR/USD: EUR amounts
- 1.0700 534m
- 1.0875 969m
- 1.0895 739m
- 1.0950 720m
- 1.0960 499m
USD/JPY: USD amounts
- 153.00 875m
- 153.50 672m
- 153.55 687m
- 153.75 699m
- 154.45 587m
- 154.50 530m
- 155.00 3.6b
AUD/USD: AUD amounts
- 0.6575 774m
- 0.6650 461m
USD/CAD: USD amounts
- 1.3680 413m
- 1.3690 514m
- 1.3700 533m
- 1.3825 568m
EUR/GBP: EUR amounts
- 0.8450 2.3b
- USD/CAD pulls back from the vicinity of the YTD peak touched on Monday.
- Dovish Fed expectations cap the USD upside and prompt some profit-taking.
- Bearish Oil prices could undermine the Loonie and help limit further losses.
The USD/CAD pair turns lower following an Asian session uptick to the 1.3865 region on Tuesday and for now, seems to have snapped a nine-day winning streak to its highest level since November 2023. The intraday downtick drags spot prices back below mid-1.3800s in the last hour, though any meaningful corrective decline still seems elusive.
Crude Oil prices remain under some selling pressure for the third straight day amid receding fears about a wider conflict in the Middle East. Apart from this, concerns about a weak demand in China – the world's largest crude importer – dragged the black liquid to its lowest level since June 10. This, along with the Bank of Canada's (BoC) dovish outlook, might continue to undermine the commodity-linked Loonie and act as a tailwind for the USD/CAD pair.
Meanwhile, growing acceptance that the Federal Reserve (Fed) will begin its rate-cutting cycle in September keeps the US Dollar (USD) bulls on the defensive below a two-and-half-week high touched on Monday. Moreover, the Relative Strength Index (RSI) on the daily chart is flashing slightly overbought conditions. This, in turn, prompts some profits around the USD/CAD pair, especially after the recent rally of nearly 300 pips from the monthly swing low.
Market participants now look forward to the US economic docket, featuring the release of the Conference Board's Consumer Confidence Index and JOLTS Job Openings. The focus, however, will remain glued to the outcome of a two-day FOMC policy meeting on Wednesday. Apart from this, the closely-watched US Nonfarm Payrolls (NFP) report on Friday will drive the USD in the near term and provide a fresh directional impetus to the USD/CAD pair.
Canadian Dollar FAQs
The key factors driving the Canadian Dollar (CAD) are the level of interest rates set by the Bank of Canada (BoC), the price of Oil, Canada’s largest export, the health of its economy, inflation and the Trade Balance, which is the difference between the value of Canada’s exports versus its imports. Other factors include market sentiment – whether investors are taking on more risky assets (risk-on) or seeking safe-havens (risk-off) – with risk-on being CAD-positive. As its largest trading partner, the health of the US economy is also a key factor influencing the Canadian Dollar.
The Bank of Canada (BoC) has a significant influence on the Canadian Dollar by setting the level of interest rates that banks can lend to one another. This influences the level of interest rates for everyone. The main goal of the BoC is to maintain inflation at 1-3% by adjusting interest rates up or down. Relatively higher interest rates tend to be positive for the CAD. The Bank of Canada can also use quantitative easing and tightening to influence credit conditions, with the former CAD-negative and the latter CAD-positive.
The price of Oil is a key factor impacting the value of the Canadian Dollar. Petroleum is Canada’s biggest export, so Oil price tends to have an immediate impact on the CAD value. Generally, if Oil price rises CAD also goes up, as aggregate demand for the currency increases. The opposite is the case if the price of Oil falls. Higher Oil prices also tend to result in a greater likelihood of a positive Trade Balance, which is also supportive of the CAD.
While inflation had always traditionally been thought of as a negative factor for a currency since it lowers the value of money, the opposite has actually been the case in modern times with the relaxation of cross-border capital controls. Higher inflation tends to lead central banks to put up interest rates which attracts more capital inflows from global investors seeking a lucrative place to keep their money. This increases demand for the local currency, which in Canada’s case is the Canadian Dollar.
Macroeconomic data releases gauge the health of the economy and can have an impact on the Canadian Dollar. Indicators such as GDP, Manufacturing and Services PMIs, employment, and consumer sentiment surveys can all influence the direction of the CAD. A strong economy is good for the Canadian Dollar. Not only does it attract more foreign investment but it may encourage the Bank of Canada to put up interest rates, leading to a stronger currency. If economic data is weak, however, the CAD is likely to fall.
- EUR/USD consolidates in a range above a two-and-half-week low touched on Monday.
- September Fed rate cut bets keep the USD bulls on the defensive and act as a tailwind.
- A sustained break below 100-day SMA is needed to support prospects for further losses.
The EUR/USD pair struggles to build on the overnight bounce from the 1.0800 neighborhood, or a two-and-half-week low and oscillates in a narrow range during the Asian session on Tuesday. Spot prices currently trade around the 1.0820-1.0825 region, nearly unchanged for the day as traders opted to wait for important macro releases from the Eurozone before positioning for a firm intraday direction.
Tuesday's economic docket features the flash German consumer inflation figures, along with the prelim German and Eurozone GDP. The focus will then shift to the flash Eurozone CPI report on Wednesday, which will be followed by the outcome of a two-day FOMC policy meeting. Apart from this, key US macro data scheduled at the start of a new month, including the Nonfarm Payrolls (NFP) report on Friday, will be looked for cues about the Federal Reserve's (Fed) rate-cut path, which, in turn, will influence the USD and the EUR/USD pair.
From a technical perspective, spot prices showed resilience below the 50% Fibonacci retracement level of the June-July rally on Monday, though the lack of any meaningful buying warrants caution for bulls. Moreover, oscillators on the daily chart have started gaining negative traction, suggesting that the path of least resistance for the EUR/USD pair is to the downside. That said, acceptance below the 100-day SMA is needed to support prospects for an extension of the recent pullback from a four-month peak, around mid-1.0900s touched on July 17.
Spot prices might then weaken further below the 61.8% Fibo. level near the 1.0775 region and test the next relevant support near the 1.0745 horizontal zone. This is closely followed by the 78.6% Fibo. level near the 1.0730 area, below which the EUR/USD pair is likely to challenge the June monthly swing low, around the 1.0660 region, with some intermediate support near the 1.0700 round-figure mark.
On the flip side, any subsequent move up is likely to confront resistance near the 1.0840-1.0845 region or the 38.2% Fibo. level. A sustained strength beyond the latter could lift the EUR/USD pair above the 1.0865 horizontal barrier, towards the 1.0885-1.0890 region. Some follow-through buying beyond the 1.0900 mark should allow bulls to aim back towards resting the multi-month peak, around mid-1.0900s.
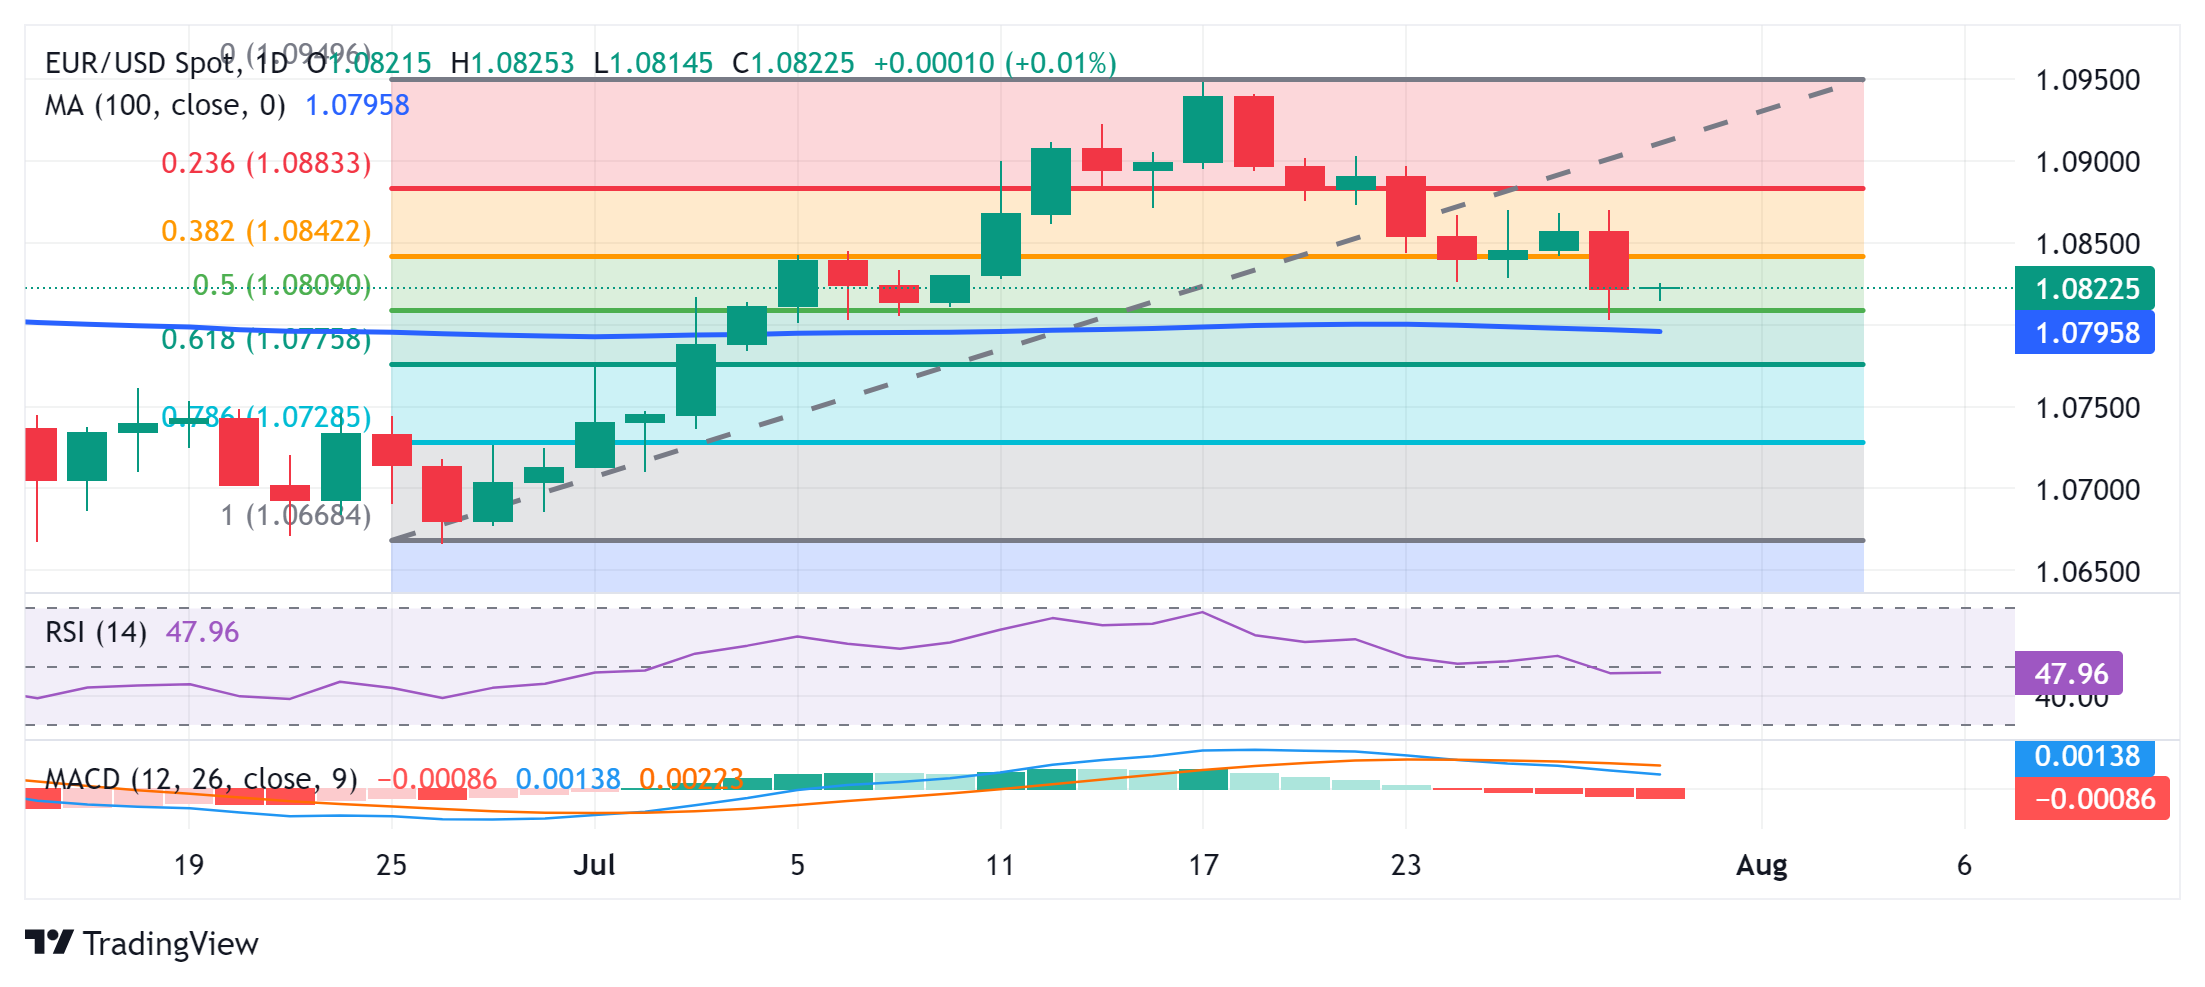
Economic Indicator
Consumer Price Index (YoY)
The Consumer Price Index (CPI), released by the German statistics office Destatis on a monthly basis, measures the average price change for all goods and services purchased by households for consumption purposes. The CPI is the main indicator to measure inflation and changes in purchasing trends. The YoY reading compares prices in the reference month to a year earlier. Generally, a high reading is bullish for the Euro (EUR), while a low reading is bearish.
Read more.Next release: Tue Jul 30, 2024 12:00 (Prel)
Frequency: Monthly
Consensus: 2.2%
Previous: 2.2%
- Silver price consolidates as trades adopt caution ahead of interest rates decisions by central banks.
- Fed is expected to make no changes on Wednesday while BoJ may raise rates by ten basis points.
- A disappointing economic outlook in China weakens the Silver demand.
Silver price (XAG/USD) remains tepid on the second successive session, trading around $27.80 per troy ounce during the Asian hours on Tuesday. Traders await US Federal Reserve’s (Fed) policy decision scheduled for Wednesday.
However, the downside of non-yielding assets like Silver could be limited as the the Federal Reserve (Fed) is expected will begin cutting interest rates in September. Additionally, signs of cooling inflation and easing labor market conditions in the United States (US) have heightened expectations of three rate cuts by the Fed in 2024. Meanwhile, the Bank of Japan (BoJ) is anticipated to raise rates by ten basis points. Opinions are divided on whether the Bank of England (BoE) will start reducing borrowing costs.
Traders are anticipating key US data this week. Nonfarm Payrolls are expected to increase by 175,000 jobs in July, down from 206,000 in June. The Unemployment Rate is projected to remain steady at 4.1%, matching 2021 highs. Additionally, Average Hourly Earnings are forecasted to rise by 0.3% month-over-month.
Disappointing GDP figures and an unexpected rate cut by the People's Bank of China (PBOC) last week have added further selling pressure on Silver. Given that Silver is essential for numerous industrial applications, especially in China, the world's largest manufacturing hub, these developments have intensified concerns about demand.
Additionally, the prices of safe-haven Silver face pressure as concerns over Middle East tensions have waned. Israel has indicated that its response to a Hezbollah rocket strike in the Israeli-occupied Golan Heights on Saturday will be measured to avoid escalating into a full-scale war, according to Reuters. This stance has been further supported by a US diplomatic effort to limit Israel's response, aiming to prevent strikes on Beirut or major civilian infrastructure in Lebanon.
Silver FAQs
Silver is a precious metal highly traded among investors. It has been historically used as a store of value and a medium of exchange. Although less popular than Gold, traders may turn to Silver to diversify their investment portfolio, for its intrinsic value or as a potential hedge during high-inflation periods. Investors can buy physical Silver, in coins or in bars, or trade it through vehicles such as Exchange Traded Funds, which track its price on international markets.
Silver prices can move due to a wide range of factors. Geopolitical instability or fears of a deep recession can make Silver price escalate due to its safe-haven status, although to a lesser extent than Gold's. As a yieldless asset, Silver tends to rise with lower interest rates. Its moves also depend on how the US Dollar (USD) behaves as the asset is priced in dollars (XAG/USD). A strong Dollar tends to keep the price of Silver at bay, whereas a weaker Dollar is likely to propel prices up. Other factors such as investment demand, mining supply – Silver is much more abundant than Gold – and recycling rates can also affect prices.
Silver is widely used in industry, particularly in sectors such as electronics or solar energy, as it has one of the highest electric conductivity of all metals – more than Copper and Gold. A surge in demand can increase prices, while a decline tends to lower them. Dynamics in the US, Chinese and Indian economies can also contribute to price swings: for the US and particularly China, their big industrial sectors use Silver in various processes; in India, consumers’ demand for the precious metal for jewellery also plays a key role in setting prices.
Silver prices tend to follow Gold's moves. When Gold prices rise, Silver typically follows suit, as their status as safe-haven assets is similar. The Gold/Silver ratio, which shows the number of ounces of Silver needed to equal the value of one ounce of Gold, may help to determine the relative valuation between both metals. Some investors may consider a high ratio as an indicator that Silver is undervalued, or Gold is overvalued. On the contrary, a low ratio might suggest that Gold is undervalued relative to Silver.
- GBP/USD edges lower on Tuesday, though the downside remains cushioned.
- A softer risk tone benefits the safe-haven USD and exerts pressure on the pair.
- Traders now look to the key central bank event risk before placing fresh bets.
The GBP/USD pair struggles to capitalize on the overnight goodish recovery from the vicinity of the 1.2800 round figure or a nearly three-week low and attracts some selling during the Asian session on Tuesday. Spot prices currently trade with a negative bias around mid-1.2800s amid a modest US Dollar (USD) strength, though the fundamental backdrop warrants caution for bearish traders.
A softer risk tone assists the safe-haven US Dollar (USD) to trade with a mild positive bias just below a two-and-half-week high touched on Monday and turns out to be a key factor exerting some pressure on the GBP/USD pair. That said, expectations that the Federal Reserve (Fed) will start lowering borrowing costs in September might act as a headwind for the buck. Furthermore, traders might prefer to wait for more cues about the Fed's rate-cut path before committing to a firm near-term direction. Hence, the focus will remain glued to the outcome of the highly-anticipated two-day FOMC monetary policy meeting on Wednesday.
Investors this week will further take cues from the Bank of England (BoE) policy update on Thursday and important US macro releases scheduled at the start of a new month, including the US Nonfarm Payrolls (NFP) report on Friday. In the meantime, diminishing odds of an interest rate cut by the BoE in August might continue to act as a tailwind for the British Pound (GBP) and contribute to limiting the downside for the GBP/USD pair. This makes it prudent to wait for some follow-through selling and a sustained breakdown through the 1.2800 mark before positioning for an extension of the recent pullback from a one-year peak.
Pound Sterling FAQs
The Pound Sterling (GBP) is the oldest currency in the world (886 AD) and the official currency of the United Kingdom. It is the fourth most traded unit for foreign exchange (FX) in the world, accounting for 12% of all transactions, averaging $630 billion a day, according to 2022 data. Its key trading pairs are GBP/USD, aka ‘Cable’, which accounts for 11% of FX, GBP/JPY, or the ‘Dragon’ as it is known by traders (3%), and EUR/GBP (2%). The Pound Sterling is issued by the Bank of England (BoE).
The single most important factor influencing the value of the Pound Sterling is monetary policy decided by the Bank of England. The BoE bases its decisions on whether it has achieved its primary goal of “price stability” – a steady inflation rate of around 2%. Its primary tool for achieving this is the adjustment of interest rates. When inflation is too high, the BoE will try to rein it in by raising interest rates, making it more expensive for people and businesses to access credit. This is generally positive for GBP, as higher interest rates make the UK a more attractive place for global investors to park their money. When inflation falls too low it is a sign economic growth is slowing. In this scenario, the BoE will consider lowering interest rates to cheapen credit so businesses will borrow more to invest in growth-generating projects.
Data releases gauge the health of the economy and can impact the value of the Pound Sterling. Indicators such as GDP, Manufacturing and Services PMIs, and employment can all influence the direction of the GBP. A strong economy is good for Sterling. Not only does it attract more foreign investment but it may encourage the BoE to put up interest rates, which will directly strengthen GBP. Otherwise, if economic data is weak, the Pound Sterling is likely to fall.
Another significant data release for the Pound Sterling is the Trade Balance. This indicator measures the difference between what a country earns from its exports and what it spends on imports over a given period. If a country produces highly sought-after exports, its currency will benefit purely from the extra demand created from foreign buyers seeking to purchase these goods. Therefore, a positive net Trade Balance strengthens a currency and vice versa for a negative balance.
- The Japanese Yen edges lower despite the hawkish sentiment surrounding the BoJ policy decision due on Wednesday.
- The Bank of Japan is widely expected to raise interest rates by ten basis points.
- CME FedWatch Tool suggests a 100% probability of at least a 25 basis points Fed rate cut in September.
The Japanese Yen (JPY) extends its losses against the US Dollar (USD) for the second successive day on Tuesday. Traders remain cautious ahead of the Bank of Japan’s (BoJ) policy meeting on Wednesday, which could potentially result in a rate hike. Markets are speculating that the BoJ may increase rates by ten basis points to 0.1% and is widely expected to announce its bond purchase tapering plans.
Japan’s Chief Cabinet Secretary Yoshimasa Hayashi stated on Tuesday that the Bank of Japan and the government will closely coordinate, but the specifics of monetary policy remain the BoJ's prerogative. Hayashi emphasized that the BoJ will work closely with the government to implement appropriate monetary policies aimed at achieving the inflation target.
The US Dollar may face challenges as the US Federal Reserve (Fed) is expected to keep rates unchanged on Wednesday. However, traders anticipate a Fed rate cut in September, with the CME FedWatch Tool indicating a 100% probability of at least a quarter percentage point cut. Additionally, signs of cooling inflation and easing labor market conditions in the United States have fueled expectations of three rate cuts by the Fed this year.
Daily Digest Market Movers: Japanese Yen declines despite hawkish sentiment surrounding BoJ
- Japan's Unemployment Rate was 2.5% in June, slightly lower than market forecasts of 2.6% and the rate observed over the previous four months. This marks the lowest jobless rate since January.
- Japan's top council has urged the government and the Bank of Japan to be mindful of the weak JPY when formulating policy. The council emphasized that the impact of a weak Yen and rising prices on consumption cannot be simply overlooked.
- Reuters has published an extensive article on the Bank of Japan (BoJ) review of past policy, highlighting a significant shift in the central bank's approach to inflation. The key message from the review is that Japan is "ready for higher rates." However, the review will not result in changes to the price goal or policy framework.
- On Friday, the US Personal Consumption Expenditures (PCE) Price Index rose by 2.5% year-over-year in June, down slightly from 2.6% in May, meeting market expectations. On a monthly basis, the PCE Price Index increased by 0.1% after being unchanged in May.
- Japan's top currency diplomat, Masato Kanda, informed the G20 on Friday that foreign exchange (FX) volatility negatively impacts the Japanese economy. Kanda noted an increasing likelihood of a soft landing and emphasized the need to monitor the economy and implement necessary measures closely, according to Reuters.
- Bank of America indicates that strong economic growth in the United States allows the Federal Open Market Committee (FOMC) to "afford to wait" before making any changes. The bank states that the economy "remains on robust footing" and continues to expect the Fed to start cutting rates in December.
- The BlackRock Investment Institute noted in its mid-year outlook that Japan’s that the Bank of Japan will not raise interest rates at next week's meeting. Additionally, JP Morgan has also anticipated no rate hike from the Bank of Japan (BoJ) in July or at any point in 2024.
Technical Analysis: USD/JPY advances to near 154.00
USD/JPY trades around 154.00 on Tuesday. The daily chart analysis shows that the pair is consolidating within a descending channel, indicating a bearish bias. However, the 14-day Relative Strength Index (RSI) is slightly above 30, which could suggest a potential short-term rebound.
Immediate support is located near the lower boundary of the descending channel, around 153.00. A drop below this level could push the USD/JPY pair lower, possibly revisiting May's low of 151.86. Additional support may emerge at the psychological level of 151.00.
On the upside, the pair tests the "throwback support turned resistance" at around 154.50. Further resistance is anticipated at the nine-day Exponential Moving Average (EMA) of 155.13, with additional resistance near the upper boundary of the descending channel around 156.20.
USD/JPY: Daily Chart
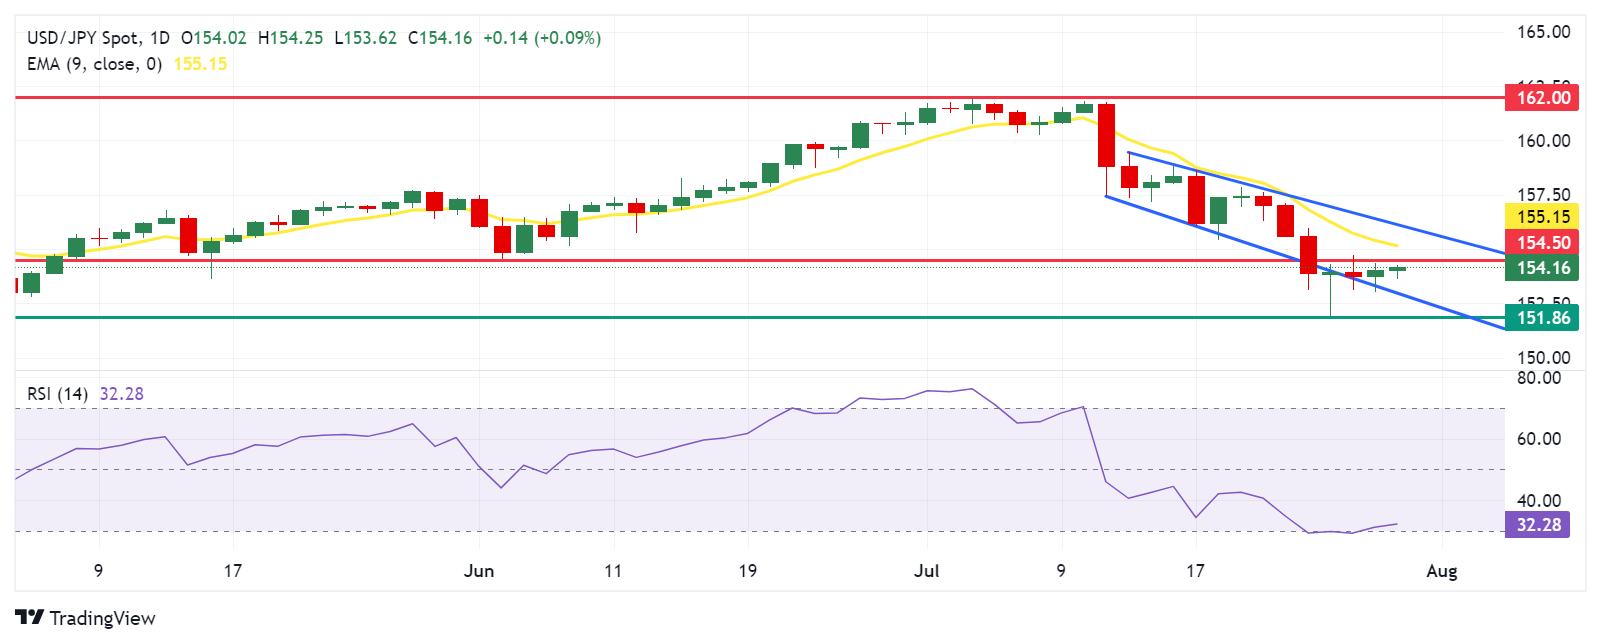
Japanese Yen PRICE Today
The table below shows the percentage change of Japanese Yen (JPY) against listed major currencies today. Japanese Yen was the weakest against the New Zealand Dollar.
| USD | EUR | GBP | JPY | CAD | AUD | NZD | CHF | |
|---|---|---|---|---|---|---|---|---|
| USD | 0.03% | 0.09% | 0.05% | 0.00% | 0.03% | -0.08% | 0.06% | |
| EUR | -0.03% | 0.06% | 0.05% | -0.01% | -0.00% | -0.11% | 0.04% | |
| GBP | -0.09% | -0.06% | 0.00% | -0.09% | -0.06% | -0.16% | -0.03% | |
| JPY | -0.05% | -0.05% | 0.00% | -0.07% | -0.03% | -0.15% | 0.00% | |
| CAD | 0.00% | 0.00% | 0.09% | 0.07% | 0.03% | -0.08% | 0.05% | |
| AUD | -0.03% | 0.00% | 0.06% | 0.03% | -0.03% | -0.12% | 0.00% | |
| NZD | 0.08% | 0.11% | 0.16% | 0.15% | 0.08% | 0.12% | 0.14% | |
| CHF | -0.06% | -0.04% | 0.03% | -0.01% | -0.05% | -0.01% | -0.14% |
The heat map shows percentage changes of major currencies against each other. The base currency is picked from the left column, while the quote currency is picked from the top row. For example, if you pick the Japanese Yen from the left column and move along the horizontal line to the US Dollar, the percentage change displayed in the box will represent JPY (base)/USD (quote).
Japanese Yen FAQs
The Japanese Yen (JPY) is one of the world’s most traded currencies. Its value is broadly determined by the performance of the Japanese economy, but more specifically by the Bank of Japan’s policy, the differential between Japanese and US bond yields, or risk sentiment among traders, among other factors.
One of the Bank of Japan’s mandates is currency control, so its moves are key for the Yen. The BoJ has directly intervened in currency markets sometimes, generally to lower the value of the Yen, although it refrains from doing it often due to political concerns of its main trading partners. The current BoJ ultra-loose monetary policy, based on massive stimulus to the economy, has caused the Yen to depreciate against its main currency peers. This process has exacerbated more recently due to an increasing policy divergence between the Bank of Japan and other main central banks, which have opted to increase interest rates sharply to fight decades-high levels of inflation.
The BoJ’s stance of sticking to ultra-loose monetary policy has led to a widening policy divergence with other central banks, particularly with the US Federal Reserve. This supports a widening of the differential between the 10-year US and Japanese bonds, which favors the US Dollar against the Japanese Yen.
The Japanese Yen is often seen as a safe-haven investment. This means that in times of market stress, investors are more likely to put their money in the Japanese currency due to its supposed reliability and stability. Turbulent times are likely to strengthen the Yen’s value against other currencies seen as more risky to invest in.
- The Indian Rupee trades with a mild positive bias in Tuesday’s Asian session.
- The INR is weighed by the month-end US Dollar demand and India’s equity outflows.
- The Fed Interest Rate Decision will be the highlight on Wednesday.
The Indian Rupee (INR) trades stronger on Tuesday despite the recovery of the US Dollar (USD). However, the local currency remains under pressure amid month-end corporate demand for USD and substantial foreign fund outflows from Indian equities. Furthermore, the volatile Chinese Yuan and weaker sentiment contribute to the INR’s downside.
Nonetheless, extended losses in crude oil prices might limit the downside for the Indian Rupee as India is the third largest consumer of oil behind the US and China. Investors will closely watch the US Federal Reserve (Fed) Interest Rate Decision on Wednesday. The Fed is widely expected to keep rates unchanged in the range of 5.25%-5.50% for the eighth time in a row at its July meeting. Market players will shift their attention to the Indian HSBC Manufacturing PMI and US employment data later this week, which will be released on Thursday and Friday, respectively.
Daily Digest Market Movers: Indian Rupee recovers despite multiple challenges
- “Rupee has been continuously depreciating due to equity outflows and tracking Asian currencies. There is Dollar demand from importers. Despite the fall in the US Dollar index, the Rupee is depreciating because the market is not looking at it right now,” said V R C Reddy, head of treasury at Karur Vysya Bank.
- The final reading of the Indian HSBC Manufacturing Purchasing Managers Index (PMI) is estimated to improve to 58.5 in July from the previous reading of 58.3.
- "The case to cut is already strong, and the Fed will likely use the July meeting to plant a seed that a cut in September is on the table," noted Ryan Sweet, chief US economist at Oxford Economics.
- Investors are now seeing that the first rate cut will come by mid-September, pricing in 100% of the Fed rate cut by at least a quarter-percentage-point by then, according to data from the CME FedWatch Tool.
- The US Dallas Fed Manufacturing Business Index came in at -17.5 in July from -15.1 in the previous reading.
Technical analysis: Indian Rupee remains bearish in the longer term
Indian Rupee trades with mild gains on the day. The constructive bias of the USD/INR pair remains in place as the pair has held above the key 100-day Exponential Moving Average (EMA) and is depicted by an uptrend line since June 3 on the daily chart. The 14-day Relative Strength Index (RSI) stands above the midline near 61.45, indicating bullish momentum in the near term and longer term.
The all-time high of 83.85 acts as an immediate resistance level for the pair. Extended gains above this barrier open USD/INR to a move to the 84.00 psychological level.
A resumption of the bearish swing might pave the way to the uptrend line around 83.70. The next contention level is located at 83.51, a low of July 12. The crucial support level is seen at 83.44, the 100-day EMA.
US Dollar price today
The table below shows the percentage change of US Dollar (USD) against listed major currencies today. US Dollar was the weakest against the New Zealand Dollar.
| USD | EUR | GBP | CAD | AUD | JPY | NZD | CHF | |
| USD | 0.01% | 0.08% | -0.02% | 0.02% | 0.13% | -0.10% | 0.05% | |
| EUR | -0.01% | 0.05% | -0.03% | 0.04% | 0.14% | -0.11% | 0.05% | |
| GBP | -0.05% | -0.06% | -0.08% | -0.04% | 0.08% | -0.15% | -0.01% | |
| CAD | 0.02% | 0.03% | 0.09% | 0.04% | 0.15% | -0.08% | 0.07% | |
| AUD | -0.05% | -0.02% | 0.03% | -0.05% | 0.09% | -0.11% | 0.00% | |
| JPY | -0.14% | -0.13% | -0.07% | -0.18% | -0.10% | -0.24% | -0.10% | |
| NZD | 0.08% | 0.11% | 0.16% | 0.07% | 0.12% | 0.23% | 0.15% | |
| CHF | -0.05% | -0.04% | 0.01% | -0.07% | -0.01% | 0.07% | -0.15% |
The heat map shows percentage changes of major currencies against each other. The base currency is picked from the left column, while the quote currency is picked from the top row. For example, if you pick the Euro from the left column and move along the horizontal line to the Japanese Yen, the percentage change displayed in the box will represent EUR (base)/JPY (quote).
Indian Rupee FAQs
The Indian Rupee (INR) is one of the most sensitive currencies to external factors. The price of Crude Oil (the country is highly dependent on imported Oil), the value of the US Dollar – most trade is conducted in USD – and the level of foreign investment, are all influential. Direct intervention by the Reserve Bank of India (RBI) in FX markets to keep the exchange rate stable, as well as the level of interest rates set by the RBI, are further major influencing factors on the Rupee.
The Reserve Bank of India (RBI) actively intervenes in forex markets to maintain a stable exchange rate, to help facilitate trade. In addition, the RBI tries to maintain the inflation rate at its 4% target by adjusting interest rates. Higher interest rates usually strengthen the Rupee. This is due to the role of the ‘carry trade’ in which investors borrow in countries with lower interest rates so as to place their money in countries’ offering relatively higher interest rates and profit from the difference.
Macroeconomic factors that influence the value of the Rupee include inflation, interest rates, the economic growth rate (GDP), the balance of trade, and inflows from foreign investment. A higher growth rate can lead to more overseas investment, pushing up demand for the Rupee. A less negative balance of trade will eventually lead to a stronger Rupee. Higher interest rates, especially real rates (interest rates less inflation) are also positive for the Rupee. A risk-on environment can lead to greater inflows of Foreign Direct and Indirect Investment (FDI and FII), which also benefit the Rupee.
Higher inflation, particularly, if it is comparatively higher than India’s peers, is generally negative for the currency as it reflects devaluation through oversupply. Inflation also increases the cost of exports, leading to more Rupees being sold to purchase foreign imports, which is Rupee-negative. At the same time, higher inflation usually leads to the Reserve Bank of India (RBI) raising interest rates and this can be positive for the Rupee, due to increased demand from international investors. The opposite effect is true of lower inflation.
- AUD/JPY oscillates in a narrow trading band for the third straight day on Tuesday.
- Traders opt to wait on the sidelines ahead of Australian CPI and BoJ on Wednesday.
- BoJ rate cut bets, a softer risk tone benefits the safe-haven JPY and caps the upside.
The AUD/JPY cross struggles to gain any meaningful traction during the Asian session on Tuesday and remains confined in a three-day-old range, well above a three-month low touched last week. Spot prices currently trade around the 100.85 region, nearly unchanged for the day as traders keenly await this week's important macro data and central bank event risks before placing fresh directional bets.
The quarterly Australian consumer inflation report is due for release on Wednesday, which might influence the Reserve Bank of Australia's (RBA) next policy move and drive the Australian Dollar (AUD). Apart from this, the official Chinese PMI prints will play a key role in providing some meaningful impetus to the China-proxy Aussie. The focus, however, remains glued to the crucial Bank of Japan (BoJ) policy decision, which should determine the near-term trajectory for the AUD/JPY cross.
In the meantime, expectations that the Japanese central bank could hike interest rates again on Wednesday might continue to act as a tailwind for the Japanese Yen (JPY). The bets were reaffirmed by data indicating that core inflation in Tokyo – Japan's national capital – continued its upward trend for the third consecutive month in July. Apart from this, a softer risk tone benefits the JPY's relative safe-haven status and caps the upside for the AUD/JPY cross amid China’s economic woes.
From a technical perspective, the recent range-bound price action might still be categorized as a bearish consolidation phase amid the overbought Relative Strength Index (RSI) on the daily chart. Moreover, the lack of any buying interest suggests that the path of least resistance for the AUD/JPY cross is to the downside. That said, it will still be prudent to wait for acceptance below the 200-day Simple Moving Average (SMA) before positioning for an extension of the recent downtrend.
Inflation FAQs
Inflation measures the rise in the price of a representative basket of goods and services. Headline inflation is usually expressed as a percentage change on a month-on-month (MoM) and year-on-year (YoY) basis. Core inflation excludes more volatile elements such as food and fuel which can fluctuate because of geopolitical and seasonal factors. Core inflation is the figure economists focus on and is the level targeted by central banks, which are mandated to keep inflation at a manageable level, usually around 2%.
The Consumer Price Index (CPI) measures the change in prices of a basket of goods and services over a period of time. It is usually expressed as a percentage change on a month-on-month (MoM) and year-on-year (YoY) basis. Core CPI is the figure targeted by central banks as it excludes volatile food and fuel inputs. When Core CPI rises above 2% it usually results in higher interest rates and vice versa when it falls below 2%. Since higher interest rates are positive for a currency, higher inflation usually results in a stronger currency. The opposite is true when inflation falls.
Although it may seem counter-intuitive, high inflation in a country pushes up the value of its currency and vice versa for lower inflation. This is because the central bank will normally raise interest rates to combat the higher inflation, which attract more global capital inflows from investors looking for a lucrative place to park their money.
Formerly, Gold was the asset investors turned to in times of high inflation because it preserved its value, and whilst investors will often still buy Gold for its safe-haven properties in times of extreme market turmoil, this is not the case most of the time. This is because when inflation is high, central banks will put up interest rates to combat it. Higher interest rates are negative for Gold because they increase the opportunity-cost of holding Gold vis-a-vis an interest-bearing asset or placing the money in a cash deposit account. On the flipside, lower inflation tends to be positive for Gold as it brings interest rates down, making the bright metal a more viable investment alternative.
| Raw materials | Closed | Change, % |
|---|---|---|
| Silver | 27.872 | -0.4 |
| Gold | 238.407 | -0.17 |
| Palladium | 903.31 | -0.19 |
Japan’s Chief Cabinet Secretary Yoshimasa Hayashi said on Tuesday that the Bank of Japan and the government will closely coordinate.
Additional comments
Monetary policy specifics are up to the BoJ to decide.
Expect the BoJ to closely coordinate with government, conduct appropriate monetary policy toward inflation target.
Market reaction
At press time, USD/JPY is up 0.06% on the day to trade at 154.10.
- The Australian Dollar loses ground due to increased risk aversion on Tuesday.
- Australia's Building Permits declined by 6.5% MoM in June, swinging from a 5.7% increase in May.
- The US Dollar could lose ground due to increased odds of a Fed rate cut in September.
The Australian Dollar (AUD) edges lower against the US Dollar (USD) following the release of Building Permits data on Tuesday. Australia's Consumer Price Index (CPI) data will be released on Wednesday, offering potential insights into the future direction of the Reserve Bank of Australia’s (RBA) monetary policy. Analysts anticipate a slight re-acceleration in Australia’s headline inflation for the second quarter, with the core rate likely remaining steady.
This inflation report will be pivotal in determining whether the RBA will opt for a rate hike at its policy meeting next week. However, economists have cautioned that an additional increase in interest rates could jeopardize Australia’s economic recovery.
The AUD/USD pair may limit its downside as the US Dollar could face challenges due to heightened expectations of the Federal Reserve’s (Fed) interest rate cut in September. Additionally, signs of cooling inflation and easing labor market conditions in the United States have fueled expectations of three rate cuts by the Fed this year. The Fed's Interest Rate Decision will be a focal point on Wednesday.
Daily Digest Market Movers: Australian Dollar declines due to risk-off mood
- Australia's Building Permits (MoM) fell by 6.5% in June, exceeding market expectations of a 3.0% decline. This follows a 5.7% increase in May. On a year-over-year basis, Building Permits declined by 3.7%, compared to the previous year's decline of 8.5%.
- National Australia Bank (NAB) anticipates that the Reserve Bank of Australia's (RBA) cash rate will remain stable at 4.35% until May 2025, according to a recent NAB Economics outlook. Looking ahead, the NAB Economics team predicts a decline to 3.6% by December 2025, with further decreases expected in 2026.
- In a media release on Monday, the Australian Prudential Regulation Authority (APRA) warned that arrears rates are increasing slowly. Following their latest quarterly assessment of domestic and international economic conditions, APRA announced that they will keep macroprudential policy settings on hold. These comments reflect their ongoing evaluation of both domestic and global economic environments.
- On Friday, the US Personal Consumption Expenditures (PCE) Price Index rose by 2.5% year-over-year in June, down slightly from 2.6% in May, meeting market expectations. On a monthly basis, the PCE Price Index increased by 0.1% after being unchanged in May.
- The US Core PCE inflation, which excludes volatile food and energy prices, also climbed to 2.6% in June, consistent with May's increase and above the forecast of 2.5%. The core PCE Price Index rose by 0.2% month-over-month in June, compared to 0.1% in May.
- Bank of America suggests that robust economic growth in the United States enables the Federal Open Market Committee (FOMC) to "afford to wait" before implementing any adjustments. The BofA notes that the economy "remains strong" and expects the Fed to begin rate cuts in December.
Technical Analysis: Australian Dollar hovers around 0.6550
The Australian Dollar trades around 0.6550 on Tuesday. The daily chart analysis shows that the AUD/USD pair treks the path of a downtrend line. The 14-day Relative Strength Index (RSI) is hovering at the oversold 30 level, indicating that the currency pair may be poised for a potential upward correction soon.
The AUD/USD pair could find immediate support around the key level of 0.6540. A break below this level could exert pressure on the pair to navigate the region around the throwback support at the 0.6470 level.
On the upside, key resistance is at the nine-day Exponential Moving Average (EMA) at 0.6595. A break above this level could lead the AUD/USD pair to test the psychological level of 0.6690, with a potential aim for a six-month high of 0.6798.
AUD/USD: Daily Chart
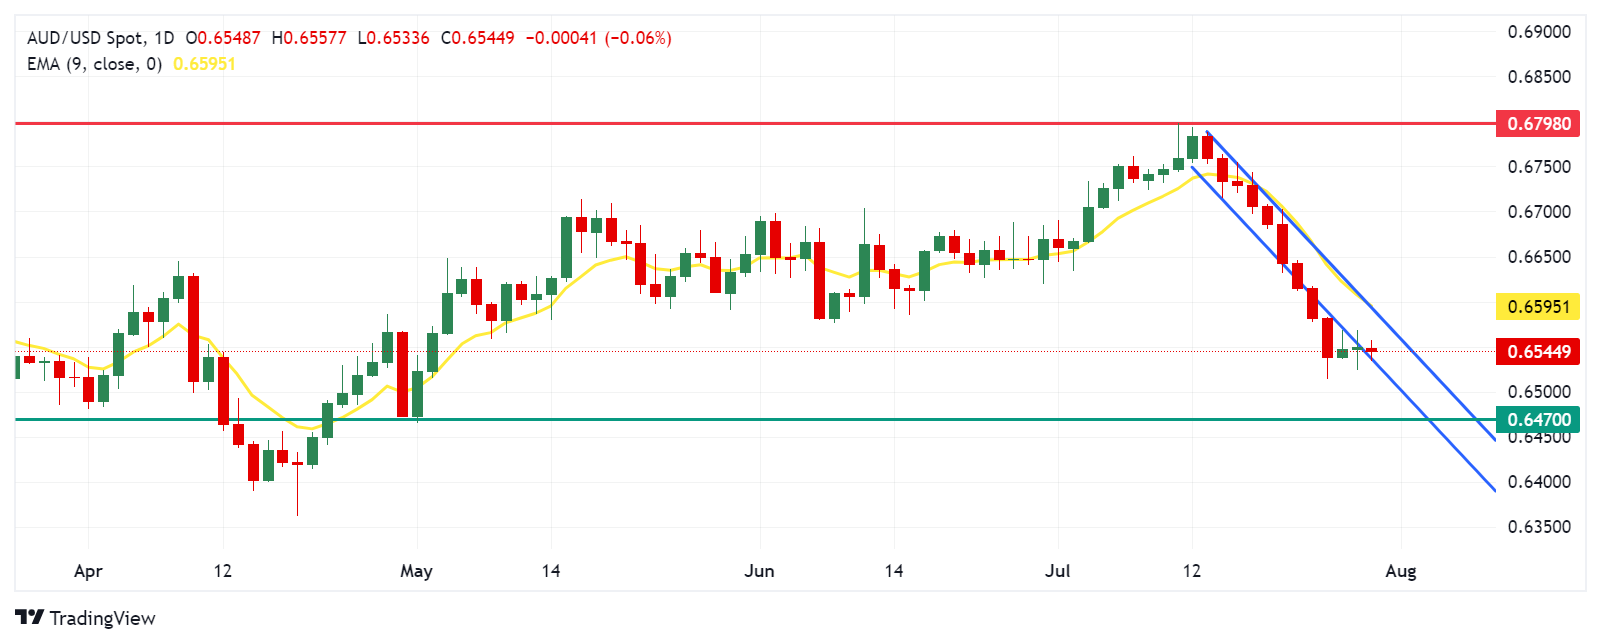
Australian Dollar PRICE Today
The table below shows the percentage change of Australian Dollar (AUD) against listed major currencies today. Australian Dollar was the strongest against the British Pound.
| USD | EUR | GBP | JPY | CAD | AUD | NZD | CHF | |
|---|---|---|---|---|---|---|---|---|
| USD | 0.05% | 0.10% | 0.03% | 0.03% | 0.06% | -0.01% | 0.06% | |
| EUR | -0.05% | 0.06% | 0.00% | -0.00% | 0.00% | -0.05% | 0.01% | |
| GBP | -0.10% | -0.06% | -0.04% | -0.07% | -0.03% | -0.09% | -0.05% | |
| JPY | -0.03% | 0.00% | 0.04% | -0.02% | 0.02% | -0.05% | 0.02% | |
| CAD | -0.03% | 0.00% | 0.07% | 0.02% | 0.04% | -0.03% | 0.01% | |
| AUD | -0.06% | -0.01% | 0.03% | -0.02% | -0.04% | -0.08% | -0.03% | |
| NZD | 0.00% | 0.05% | 0.09% | 0.05% | 0.03% | 0.08% | 0.06% | |
| CHF | -0.06% | -0.01% | 0.05% | -0.02% | -0.01% | 0.03% | -0.06% |
The heat map shows percentage changes of major currencies against each other. The base currency is picked from the left column, while the quote currency is picked from the top row. For example, if you pick the Australian Dollar from the left column and move along the horizontal line to the US Dollar, the percentage change displayed in the box will represent AUD (base)/USD (quote).
Australian Dollar FAQs
One of the most significant factors for the Australian Dollar (AUD) is the level of interest rates set by the Reserve Bank of Australia (RBA). Because Australia is a resource-rich country another key driver is the price of its biggest export, Iron Ore. The health of the Chinese economy, its largest trading partner, is a factor, as well as inflation in Australia, its growth rate and Trade Balance. Market sentiment – whether investors are taking on more risky assets (risk-on) or seeking safe-havens (risk-off) – is also a factor, with risk-on positive for AUD.
The Reserve Bank of Australia (RBA) influences the Australian Dollar (AUD) by setting the level of interest rates that Australian banks can lend to each other. This influences the level of interest rates in the economy as a whole. The main goal of the RBA is to maintain a stable inflation rate of 2-3% by adjusting interest rates up or down. Relatively high interest rates compared to other major central banks support the AUD, and the opposite for relatively low. The RBA can also use quantitative easing and tightening to influence credit conditions, with the former AUD-negative and the latter AUD-positive.
China is Australia’s largest trading partner so the health of the Chinese economy is a major influence on the value of the Australian Dollar (AUD). When the Chinese economy is doing well it purchases more raw materials, goods and services from Australia, lifting demand for the AUD, and pushing up its value. The opposite is the case when the Chinese economy is not growing as fast as expected. Positive or negative surprises in Chinese growth data, therefore, often have a direct impact on the Australian Dollar and its pairs.
Iron Ore is Australia’s largest export, accounting for $118 billion a year according to data from 2021, with China as its primary destination. The price of Iron Ore, therefore, can be a driver of the Australian Dollar. Generally, if the price of Iron Ore rises, AUD also goes up, as aggregate demand for the currency increases. The opposite is the case if the price of Iron Ore falls. Higher Iron Ore prices also tend to result in a greater likelihood of a positive Trade Balance for Australia, which is also positive of the AUD.
The Trade Balance, which is the difference between what a country earns from its exports versus what it pays for its imports, is another factor that can influence the value of the Australian Dollar. If Australia produces highly sought after exports, then its currency will gain in value purely from the surplus demand created from foreign buyers seeking to purchase its exports versus what it spends to purchase imports. Therefore, a positive net Trade Balance strengthens the AUD, with the opposite effect if the Trade Balance is negative.
- Gold price remains depressed amid a modest USD strength, though the downside seems limited.
- September Fed rate cut bets might cap further USD gains and lend support to the XAU/USD.
- Traders also seem reluctant ahead of the key central bank event risks and important macro data.
Gold price (XAU/USD) struggled to find acceptance above the $2,400 mark and attracted some intraday sellers on Monday amid a strong pickup in US Dollar (USD) demand. Apart from this, the risk-on impulse was seen as another factor exerting some downward pressure on the safe-haven precious metal. That said, geopolitical risks stemming from the ongoing conflicts in the Middle East offered some support to the commodity.
Meanwhile, growing acceptance that the Federal Reserve (Fed) will start cutting interest rates in September, bolstered by a tame US inflation report on Friday, capped gains for the USD and helped limit losses for the Gold price. Furthermore, traders opt to wait for the outcome of the highly anticipated two-day Federal Open Market Committee (FOMC) meeting on Wednesday before committing to any firm near-term trajectory for the XAU/USD.
Investors this week will further take cues from the crucial Bank of Japan (BoJ) decision on Wednesday, the Bank of England (BoE) meeting on Thursday and important US macro releases, including the Nonfarm Payrolls (NFP) on Friday. Apart from this, other economic data scheduled at the beginning of a new month should provide cues about the health of the global economy and determine the next leg of a directional move for the Gold price.
Daily Digest Market Movers: Gold price traders keenly await more cues about the Fed’s rate-cut path
- The US Dollar shot to a two-and-half-week top on Monday, which, along with a positive risk tone, failed to assist the Gold price in building on last week's modest bounce from the vicinity of the $2,350 level.
- Israel vowed retaliation against Iran-backed Lebanese group Hezbollah in response to the Golan Heights attack on Saturday, though said that it wants to avoid dragging the Middle East into an all-out war.
- Further evidence of easing price pressures in the US reaffirmed market bets for an imminent start of the Federal Reserve's policy easing cycle in September and kept the US Treasury bond yields depressed.
- The yield on the rate-sensitive 2-year US government bond fell to its lowest since February 2, while the benchmark 10-year Treasury yield hangs near a one-month low amid the improving inflation landscape.
- This, in turn, should cap any further upside for the USD and act as a tailwind for the non-yielding yellow metal as traders now look forward to this week's key central bank event risks for some meaningful impetus.
- The Bank of Japan and the Fed are scheduled to announce their respective policy decisions at the end of a two-day meeting on Wednesday, which will be followed by the Bank of England policy update on Thursday.
- Investors this week will also confront key macro releases scheduled at the start of a new month, including the official Chinese PMIs, Eurozone consumer inflation figures and the US Nonfarm Payrolls report.
Technical Analysis: Gold price needs to find acceptance below 50-day SMA for bears to seize control
From a technical perspective, the overnight failure to find acceptance above the $2,400 mark and the subsequent downtick warrants some caution before positioning for any meaningful upside. Moreover, oscillators on the daily chart have just started gaining negative traction and suggest that the path of least resistance for the Gold price is to the downside. Bearish traders, however, need to wait for a sustained break below the 50-day Simple Moving Average (SMA) support, currently pegged near the $2,358 region, before placing fresh bets.
Some follow-through selling below last week's swing low, around the $2,353 area, will reaffirm the negative outlook and drag the XAU/USD to the next relevant support near the $2,325 area. The downward trajectory could extend further towards testing the $2,300 round-figure mark for the first time since late June.
On the flip side, momentum above the $2,400 mark is likely to confront some resistance near the $2,412 area ahead of last week's swing high, around the $2,432 region. A sustained strength beyond the latter will suggest that the corrective decline from the all-time peak touched earlier this month has run its course and set the stage for additional gains. The Gold price might then climb to the $2,469-2,470 intermediate resistance and challenge the record peak, around the $2,483-2,484 zone.
Gold FAQs
Gold has played a key role in human’s history as it has been widely used as a store of value and medium of exchange. Currently, apart from its shine and usage for jewelry, the precious metal is widely seen as a safe-haven asset, meaning that it is considered a good investment during turbulent times. Gold is also widely seen as a hedge against inflation and against depreciating currencies as it doesn’t rely on any specific issuer or government.
Central banks are the biggest Gold holders. In their aim to support their currencies in turbulent times, central banks tend to diversify their reserves and buy Gold to improve the perceived strength of the economy and the currency. High Gold reserves can be a source of trust for a country’s solvency. Central banks added 1,136 tonnes of Gold worth around $70 billion to their reserves in 2022, according to data from the World Gold Council. This is the highest yearly purchase since records began. Central banks from emerging economies such as China, India and Turkey are quickly increasing their Gold reserves.
Gold has an inverse correlation with the US Dollar and US Treasuries, which are both major reserve and safe-haven assets. When the Dollar depreciates, Gold tends to rise, enabling investors and central banks to diversify their assets in turbulent times. Gold is also inversely correlated with risk assets. A rally in the stock market tends to weaken Gold price, while sell-offs in riskier markets tend to favor the precious metal.
The price can move due to a wide range of factors. Geopolitical instability or fears of a deep recession can quickly make Gold price escalate due to its safe-haven status. As a yield-less asset, Gold tends to rise with lower interest rates, while higher cost of money usually weighs down on the yellow metal. Still, most moves depend on how the US Dollar (USD) behaves as the asset is priced in dollars (XAU/USD). A strong Dollar tends to keep the price of Gold controlled, whereas a weaker Dollar is likely to push Gold prices up.
- NZD/USD trades on a stronger note near 0.5880 in Tuesday’s Asian session.
- The Fed will likely hold rates steady at its July meeting on Wednesday.
- Rising speculation of an early rate cut by RBNZ and fear of Chinese economic slowdown might weigh on the Kiwi.
The NZD/USD pair recovers some lost ground around 0.5880 during the Asian trading hours on Tuesday. However, the upside of the pair might be limited as traders prefer to wait on the sidelines ahead of the Federal Reserve (Fed) monetary policy meeting on Wednesday.
The US Fed is widely expected to hold the interest rate in the range of 5.25%-5.50% at a two-day FOMC meeting that concludes on Wednesday as Fed Chair Jerome Powell signalled that he wanted more evidence that inflation is on course to the 2% target before trimming. "The case to cut is already strong, and the Fed will likely use the July meeting to plant a seed that a cut in September is on the table," said Ryan Sweet, chief US economist at Oxford Economics.
On the Kiwi front, rising bets for an early interest rate cut by the Reserve Bank of New Zealand (RBNZ) continue to undermine the New Zealand Dollar (NZD). The financial markets anticipate the RBNZ rate cuts, with traders pricing 14 basis points (bps) of cuts in August, indicating a 55% chance of a rate cut soon.
Furthermore, the sluggish Chinese economy might cap the NZD’s upside as China is a major trading partner of New Zealand. The Chinese GDP growth rate fell short of expectations in the second quarter, as the consumer sector suffered amid labor market difficulties and a prolonged housing slowdown.
New Zealand Dollar FAQs
The New Zealand Dollar (NZD), also known as the Kiwi, is a well-known traded currency among investors. Its value is broadly determined by the health of the New Zealand economy and the country’s central bank policy. Still, there are some unique particularities that also can make NZD move. The performance of the Chinese economy tends to move the Kiwi because China is New Zealand’s biggest trading partner. Bad news for the Chinese economy likely means less New Zealand exports to the country, hitting the economy and thus its currency. Another factor moving NZD is dairy prices as the dairy industry is New Zealand’s main export. High dairy prices boost export income, contributing positively to the economy and thus to the NZD.
The Reserve Bank of New Zealand (RBNZ) aims to achieve and maintain an inflation rate between 1% and 3% over the medium term, with a focus to keep it near the 2% mid-point. To this end, the bank sets an appropriate level of interest rates. When inflation is too high, the RBNZ will increase interest rates to cool the economy, but the move will also make bond yields higher, increasing investors’ appeal to invest in the country and thus boosting NZD. On the contrary, lower interest rates tend to weaken NZD. The so-called rate differential, or how rates in New Zealand are or are expected to be compared to the ones set by the US Federal Reserve, can also play a key role in moving the NZD/USD pair.
Macroeconomic data releases in New Zealand are key to assess the state of the economy and can impact the New Zealand Dollar’s (NZD) valuation. A strong economy, based on high economic growth, low unemployment and high confidence is good for NZD. High economic growth attracts foreign investment and may encourage the Reserve Bank of New Zealand to increase interest rates, if this economic strength comes together with elevated inflation. Conversely, if economic data is weak, NZD is likely to depreciate.
The New Zealand Dollar (NZD) tends to strengthen during risk-on periods, or when investors perceive that broader market risks are low and are optimistic about growth. This tends to lead to a more favorable outlook for commodities and so-called ‘commodity currencies’ such as the Kiwi. Conversely, NZD tends to weaken at times of market turbulence or economic uncertainty as investors tend to sell higher-risk assets and flee to the more-stable safe havens.
On Tuesday, the People’s Bank of China (PBOC) set the USD/CNY central rate for the trading session ahead at 7.1364, as against the previous day's fix of 7.1316 and 7.2586 Reuters estimates.
- WTI attracts some sellers near $76.25 in Tuesday’s Asian session, down 0.45% on the day.
- The weaker outlook for crude demand in China weighs on the WTI price.
- Rising geopolitical tensions in the Middle East are likely to disrupt oil supplies, capping the downside for Oil prices.
West Texas Intermediate (WTI), the US crude oil benchmark, is trading around $76.25 on Tuesday. WTI price extends its decline to the lowest level since June 10 amid the Federal Reserve's (Fed) rate cut expectation in September and China’s weaker demand.
The Fed is anticipated to keep interest rates unchanged in the range of 5.25%-5.50% for the eighth time in a row at its July meeting on Wednesday. Traders will also take more cues from the Fed Press Conference for the interest rate cut path. Anydovish messages from the US central bank could be positive for risk-sensitive assets like WTI price.
Additionally, the weaker demand and sluggish economy in China weigh on WTI price as China is the top largest consumer of oil in the world. China's total fuel oil imports fell by 11% in the first half of 2024, according to the data released earlier this month. "The economic problems in China are also sucking the juice out of the oil market," said Bob Yawger, director of energy futures at Mizuho in New York.
The Golan Heights attack on Saturday raised worries about a war between Israel and Hezbollah. Israel accuses Hezbollah of carrying out the strike on a football pitch, which killed at least 12 people, including children, and it has promised to react. However, Hezbollah denies being involved in the attack. The market reaction to the recent Middle East conflict has been muted. However, escalating geopolitical tensions between Israel and Hezbollah might disrupt oil supplies and lift the WTI price.
WTI Oil FAQs
WTI Oil is a type of Crude Oil sold on international markets. The WTI stands for West Texas Intermediate, one of three major types including Brent and Dubai Crude. WTI is also referred to as “light” and “sweet” because of its relatively low gravity and sulfur content respectively. It is considered a high quality Oil that is easily refined. It is sourced in the United States and distributed via the Cushing hub, which is considered “The Pipeline Crossroads of the World”. It is a benchmark for the Oil market and WTI price is frequently quoted in the media.
Like all assets, supply and demand are the key drivers of WTI Oil price. As such, global growth can be a driver of increased demand and vice versa for weak global growth. Political instability, wars, and sanctions can disrupt supply and impact prices. The decisions of OPEC, a group of major Oil-producing countries, is another key driver of price. The value of the US Dollar influences the price of WTI Crude Oil, since Oil is predominantly traded in US Dollars, thus a weaker US Dollar can make Oil more affordable and vice versa.
The weekly Oil inventory reports published by the American Petroleum Institute (API) and the Energy Information Agency (EIA) impact the price of WTI Oil. Changes in inventories reflect fluctuating supply and demand. If the data shows a drop in inventories it can indicate increased demand, pushing up Oil price. Higher inventories can reflect increased supply, pushing down prices. API’s report is published every Tuesday and EIA’s the day after. Their results are usually similar, falling within 1% of each other 75% of the time. The EIA data is considered more reliable, since it is a government agency.
OPEC (Organization of the Petroleum Exporting Countries) is a group of 13 Oil-producing nations who collectively decide production quotas for member countries at twice-yearly meetings. Their decisions often impact WTI Oil prices. When OPEC decides to lower quotas, it can tighten supply, pushing up Oil prices. When OPEC increases production, it has the opposite effect. OPEC+ refers to an expanded group that includes ten extra non-OPEC members, the most notable of which is Russia.
| Index | Change, points | Closed | Change, % |
|---|---|---|---|
| NIKKEI 225 | 801.22 | 38468.63 | 2.13 |
| Hang Seng | 217.03 | 17238.34 | 1.28 |
| KOSPI | 33.63 | 2765.53 | 1.23 |
| ASX 200 | 68.3 | 7989.6 | 0.86 |
| DAX | -96.88 | 18320.67 | -0.53 |
| CAC 40 | -73.84 | 7443.84 | -0.98 |
| Dow Jones | -49.41 | 40539.93 | -0.12 |
| S&P 500 | 4.44 | 5463.54 | 0.08 |
| NASDAQ Composite | 12.32 | 17370.2 | 0.07 |
| Pare | Closed | Change, % |
|---|---|---|
| AUDUSD | 0.65477 | -0.08 |
| EURJPY | 166.658 | -0.2 |
| EURUSD | 1.08217 | -0.33 |
| GBPJPY | 198.059 | 0.07 |
| GBPUSD | 1.28605 | -0.05 |
| NZDUSD | 0.58766 | -0.27 |
| USDCAD | 1.38507 | 0.16 |
| USDCHF | 0.88605 | 0.24 |
| USDJPY | 153.993 | 0.12 |


© 2000-2026. Уcі права захищені.
Cайт знаходитьcя під керуванням TeleTrade DJ. LLC 2351 LLC 2022 (Euro House, Richmond Hill Road, Kingstown, VC0100, St. Vincent and the Grenadines).
Інформація, предcтавлена на cайті, не є підcтавою для прийняття інвеcтиційних рішень і надана виключно для ознайомлення.
Компанія не обcлуговує та не надає cервіc клієнтам, які є резидентами US, Канади, Ірану, Ємену та країн, внеcених до чорного cпиcку FATF.
Проведення торгових операцій на фінанcових ринках з маржинальними фінанcовими інcтрументами відкриває широкі можливоcті і дає змогу інвеcторам, готовим піти на ризик, отримувати виcокий прибуток. Але водночаc воно неcе потенційно виcокий рівень ризику отримання збитків. Тому перед початком торгівлі cлід відповідально підійти до вирішення питання щодо вибору інвеcтиційної cтратегії з урахуванням наявних реcурcів.
Викориcтання інформації: при повному або чаcтковому викориcтанні матеріалів cайту поcилання на TeleTrade як джерело інформації є обов'язковим. Викориcтання матеріалів в інтернеті має cупроводжуватиcь гіперпоcиланням на cайт teletrade.org. Автоматичний імпорт матеріалів та інформації із cайту заборонено.
З уcіх питань звертайтеcь за адреcою pr@teletrade.global.
переклади