- Analytics
- News and Tools
- Market News
Новини ринків
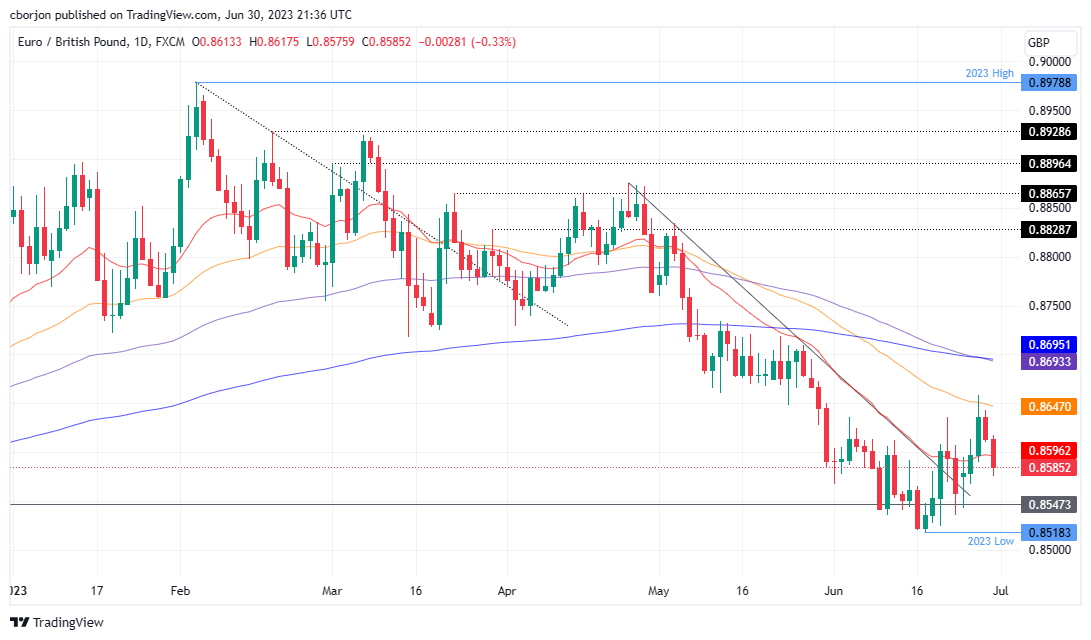
- EUR/GBP slides as UK bond yields surpass German bond yields, strengthening the Pound.
- From a technical perspective, the pair exhibits a neutral to downward bias, with long-term daily EMAs standing above exchange rates.
- The EUR/GBP must regain the 0.8600 level and surpass the May 24 daily low resistance of 0.8648 to shift its bias.
- The pair’s immediate support is at 0.8500, a breach below, which could lead to a decline toward 0.8535.
EUR/GBP slid during the Friday session as UK bond yields surpassed German bond yields, the strongest of the Eurozone (EU), bolstering the appetite for the Pound Sterling (GBP). That, alongside a dark-cloud conver technical chart pattern, exacerbated the EUR/GBP’s fall below the 0.8600 figure. At the time of writing, the EUR/GBP is trading at 0.8585, down 0.33%.
EUR/GBP Price Analysis: Technical outlook
From a technical perspective, the EUR/GBP is still neutral to downward biased, with long-term daily Exponential Moving Averages (EMAs) standing above the exchange rates; while the EUR/GBP remains unable to break the May 24 daily low support area turned resistance at around 0.8648, and seen as the latest swing low needed to be broken, to change the pair’s bias.
However, on its way toward that level, the EUR/GBP must reclaim the 0.8600 figure. A breach of the latter will expose the 0.8648 May low, which, If broken decisively, it could pave the way toward the confluence of the 100 and 200-day Exponential Moving Averages (EMAs) at 0.8693/95 before challenging 0.8700.
Conversely, and the path of least resistance, the EUR/GBP first support would be the 0.8500 mark. A dip below will send the cross toward the June 23 daily low of 0.8535 before testing the June 19 swing low of 0.8518 before slumping to the 0.85 figure.
EUR/GBP Price Action – Daily chart
- Despite daily gains, the XAU/USD is set to close a third consecutive week of losses, near the $1,920 area.
- Declining yields amid soft PCE figures weakened the USD favouring Gold prices.
On Friday, the gold spot XAU/USD traded with nearly 0.50% gains, jumping near the $1,920 area. Soft Personal Consumer Expenditures from the US fueled a decline in US yields and, thereby, a weaker US Dollar, which boosted the yellow metal. Moreover, the Gold’s short-term trajectory will be determined by bets on the next Federal Reserve (Fed) decision, which will have an impact with crucial labour market data to be released next week.
US reported soft PCE figures. Eyes on labour market data
After the US Bureau of Economic Analysis showed the Core Personal Consumption Expenditures (PCE), the Federal Reserve's preferred measure of inflation, unexpectedly decelerated to 4.6% YoY in May. As attention now shifts to labour market data, Investors are trying to decipher the next moves by the Fed after Chair Powell commented that Federal Open Market Committee (FOMC) foresee additional hikes, driven by a hot labour market.
In that sense, Non-farm payrolls (NFP) are expected to decline to 200K in June. In addition, Average Hourly Earnings are foreseeing remaining steady at 4.3% YoY and the Unemployment rate at 3.7%.
As for now, markets are discounting 25 basis points (bps) hike in the next Fed meeting in July but disagree when the second hike Jerome Powell hinted will come. Is worth noticing that non-yielding yellow metals tend to be negatively correlated with interest rates so hawkish bets on the Fed would apply further selling pressure.
XAU/USD levels to watch
The technical outlook, according to the daily chart, for the XAU/USD remains neutral to bearish for the short term. The Relative Strength Index (RSI) holds below its midline but with a positive slope, while the Moving Average Convergence Divergence (MACD) prints rising red bars.
Support levels to watch: $1,905, $1,900, $1,890.
Resistances levels to watch: $1,930, $1,938 (20-day Simple Moving Average), $1,945 (100-day Simple Moving Average)
XAU/USD Daily chart
-638237573946047023.png)
- The USD/JPY pulls back from YTD high as Japan’s Finance Minister Suzuky warns against excessive yen depreciation.
- The slowdown in the US Core PCE, the Fed’s preferred inflation indicator, reduces investor expectations for a double Fed rate hike.
- Despite Tokyo Core CPI exceeding the BoJ’s 2% target for thirteen months, the BoJ reaffirms its commitment to ultra-loose monetary policy.
USD/JPY retreats from a year-to-date (YTD) high at 145.07 as Japanese authorities warned that “excessive yen weakening” could trigger action by Japanese authorities. That spooked USD/JPY buyers, which have been riding a rally that witnessed a 13% depreciation of the Japanese Yen (JPY) during the year. The USD/JPY is trading at 144.28, down 0.31%, as Wall Street closes.
Japanese authorities halt the USD/JPY rally; softer US inflation weighed on the US Dollar
The US Dollar (USD) remains pressured by an inflation report released by the Department of Commerce. The US Federal Reserve (Fed) preferred gauge for inflation, the Core PCE eased from highs around 4.7% YoY to 4.6% in May, while headline PCE decelerated at a faster pace, with monthly data slowing to 0.1% from 0.4% in April, and annually based numbers at 3.8% from 4.4%.
US Treasury bond yields tumbled after the data as investors see less likely the Fed will increase rates twice, as the dot-plot portrays. Meanwhile, the Fed’s 25 bps increase in July remains priced in, as shown by the CME FedWatch Tool odds at 84.3%.
Consequently, the US Dollar Index, a basket of peers that tracks its value against the greenback, dropped 0.41%, down to 102.933.
Other data witnessed the Chicago PMI improving to 41.5 but remaining in contractionary territory. The University of Michigan (UoM) revealed June’s latest poll, with Consumer Sentiment hitting the 64.4 threshold, above the preliminary reading of 63.9.
On the Japanese front, the Tokyo Core CPI, a critical inflation gauge, edged higher in June, with the index coming at 3.2% YoY, up from 3.1% in May. Even though the CPI stood higher than the Bank of Japan’s (BoJ) 2% target for the thirteen-month, the BoJ remains committed to keeping its ultra-loose monetary policy stance. The BoJ Governor Kazuo Ueda stated the bank would keep its current path unless inflation proves to be sustainable over the long term.
Given the backdrop, the USD/JPY was set to continue to rally. Still, Japanese Finance Minister Suzuky’s comments that Tokyo “would respond appropriately if the moves become excessive” capped the USD/JPY advancement.
USD/JPY Technical Levels
- WTI bulls move to test the bear's commitments at dynamic resistance.
- $72.700 vs. 66.80s in play within the bear's lair.
Commodity demand is slacking into the close of the month with market expectations of continued hawkish central bank policy that has dented sentiment in the oil market and saw investors maintain a bearish tilt.
However, WTI's daily chart paints a different picture as the structure on the downside holds yet again. We broke daily resistance at $70 which could be significant on a break of the upper quarter of the $72 handle and daily target:
WTI daily chart
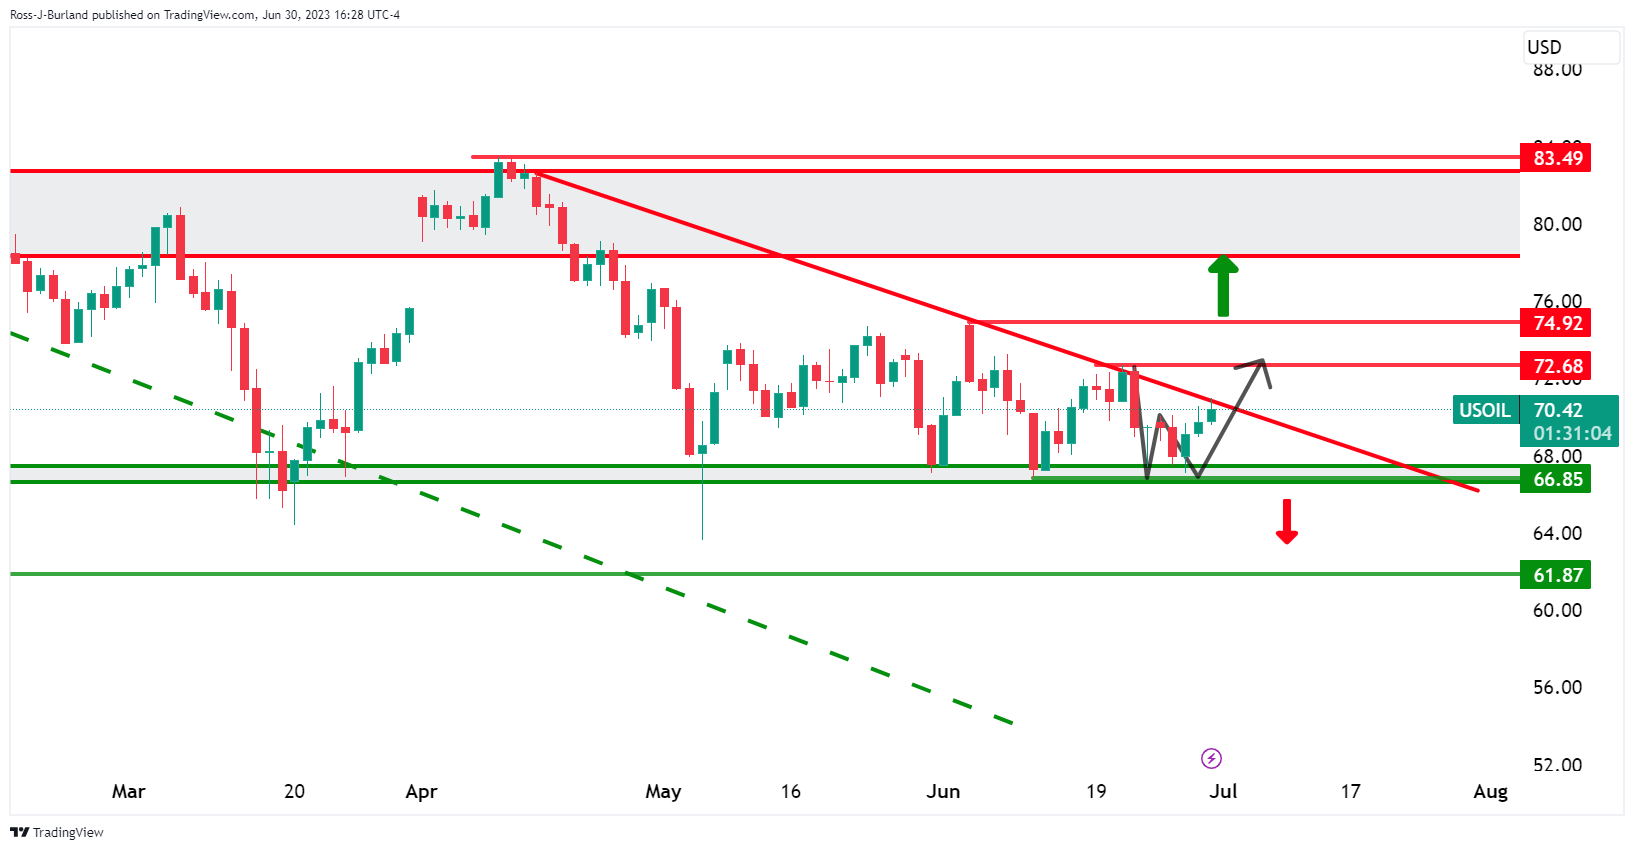
On the other hand:
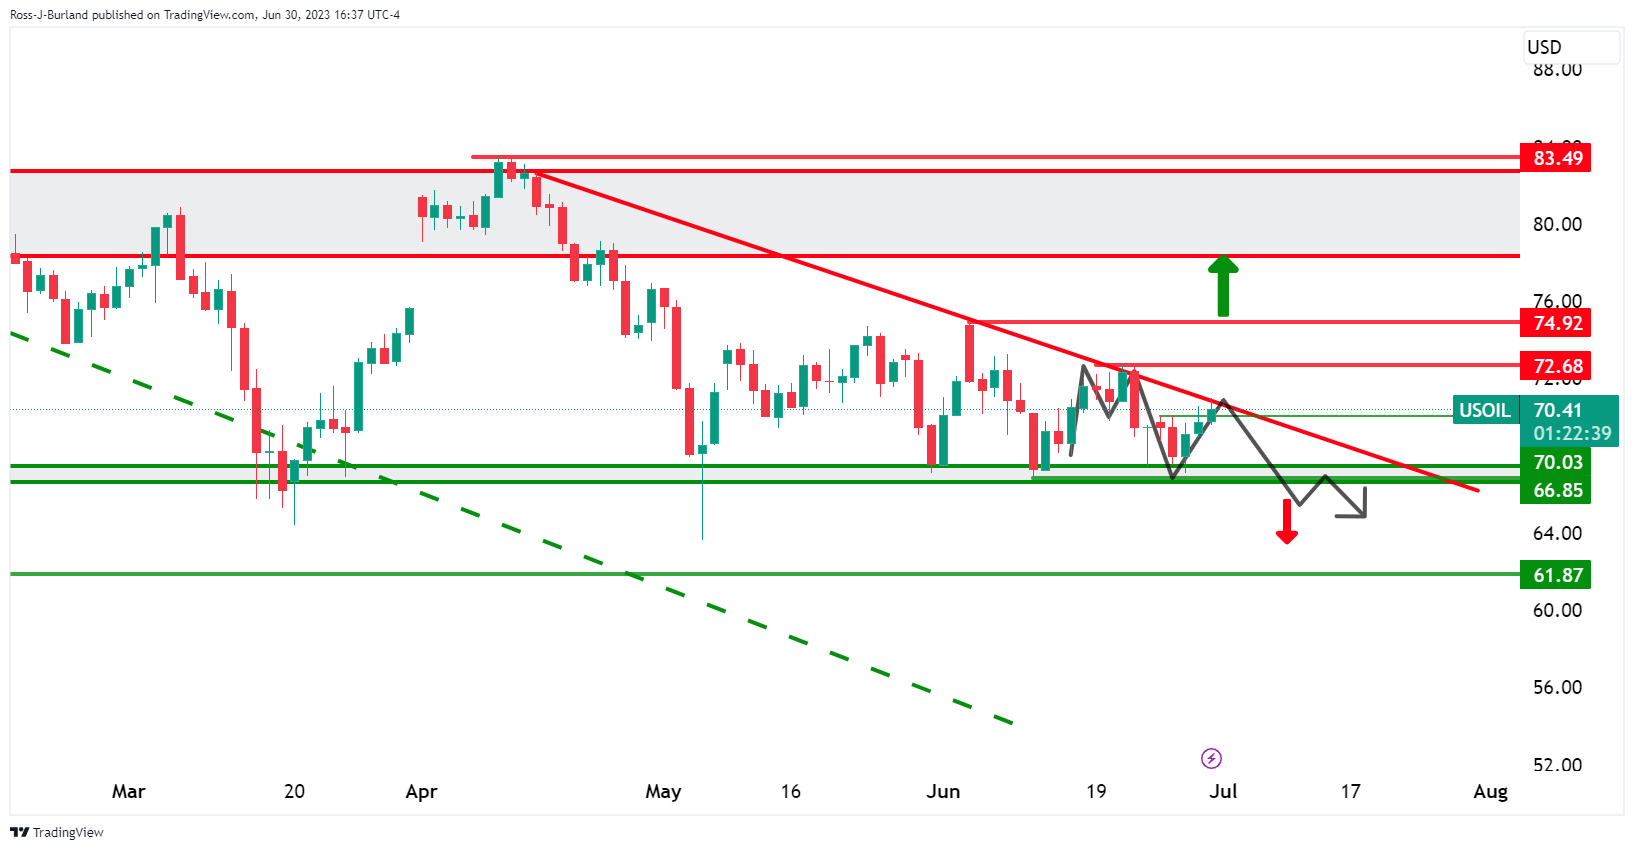
It's been a cautious move by the bulls, lacking conviction!
- The GBP/JPY cross regained ground after two days of losses, poised for the seventh consecutive weekly gain.
- British Q1 GDP’s revision showed no surprises and came in at 0.2% YoY.
- Japanese inflation figures unexpectedly decelerated in May.
The GBP/JPY jumped to a high of 183.87 level and then stabilized at 183.25, after experiencing two consecutive days of losses – though still on track for its seventh consecutive weekly gain. The revised British Q1 GDP figures revealed no surprises, with a year-on-year growth rate of 0.2%. On the other hand, Japanese inflation data for May unexpectedly showed a deceleration, thereby continuing to support a dovish stance by the Bank of Japan (BoJ).
Monetary policy divergence set to weaken the JPY further
On Friday, the National Statistics Office of the UK, confirmed that the GDP from the UK in Q1 expanded at an annualized rate of 0.2%, just as expected. It's worth noting that Andrew Bailey from the Bank of England (BoE), stated on Wednesday that he expects economic activity “to flatten” but that the bank will do whatever is necessary to bring inflation down. As a result of his comments, in the previous days Sterling had faced some selling pressure as traders worried about the impact of the aggressive stance of the BoE on economic activity. Friday’s GDP figures, however, brought some calm to markets.
In contrast, the Tokyo Consumer Price Index (CPI) for June displayed a lower-than-expected headline figure of 3.1% year-on-year, compared to the anticipated 3.8%. The Core CPI figure reached 3.8% (previously projected at 4.1%). The results aligned with comments made by Governor Kazuo Ueda of the Bank of Japan (BoJ) during his Wednesday statement, when he emphasized that once inflation aligns with the Bank's forecast, he will consider a potential policy shift. The declining inflationary pressure in Japan, however, supports a more dovish stance, consequently, a less attractive Yen.
GBP/JPY Levels to watch
According to the daily chart, the GBP/JPY’s positive trajectory is intact, but the cross remains overbought, suggesting a need to consolidate gains. The Relative Strength Index (RSI) holds a positive slope above 70. At the same time, the Moving Average Convergence Divergence (MACD) prints decreasing green bars suggesting that the bullish momentum is slowly fading and possibly suggesting that a correction may be on the horizon.
On the downside, support levels line up at 183.00, followed by the 182.30 zone and the 181.00 psychological mark. On the flip side, in case of gaining more ground, the cross will face resistances at 183.70, 184.00 and 184.50.
GBP/JPY Daily chart
-638237531586192939.png)
- GBP/USD bears are licking their lips for the open next week.
- Supply structure is testing bearish commitments.
As per the prior analysis, GBP/USD Price Analysis: Bears are waiting to pounce below 1.2800 we have seen a classic squeeze to end the month as follows:
GBP/USD prior analysis
GBP/USD daily chart
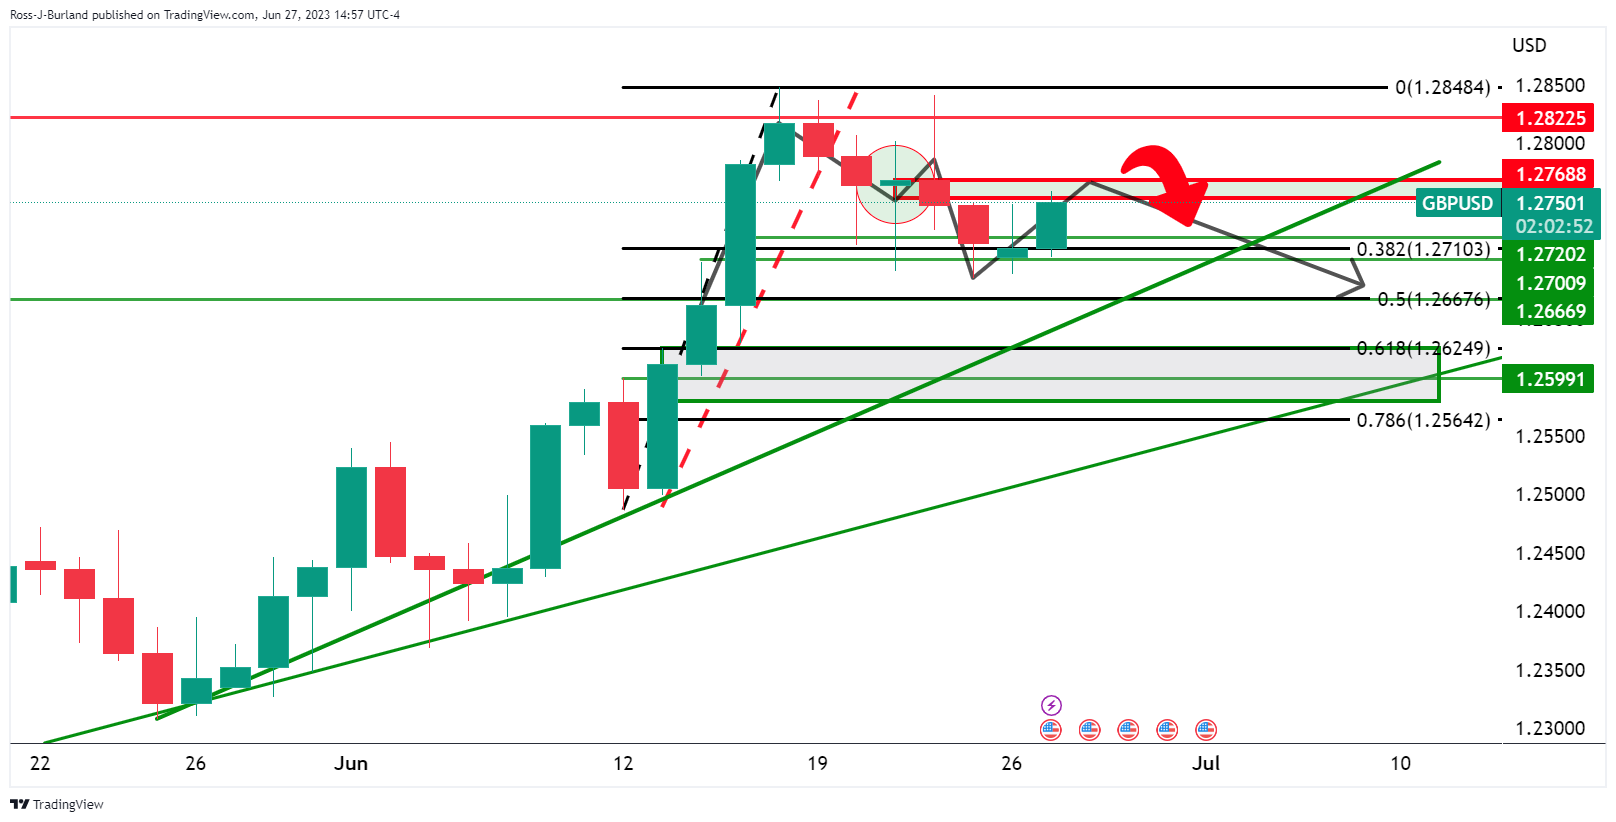
It was noted that the daily chart showed the price structure as an M-formation. The neckline was regarded as a resistance area around 1.2770/1.2800. Wednesday was expected to be a sell-off to below the lows of the week's initial balance which left trendline support vulnerable looking ahead.
GBP/USD update
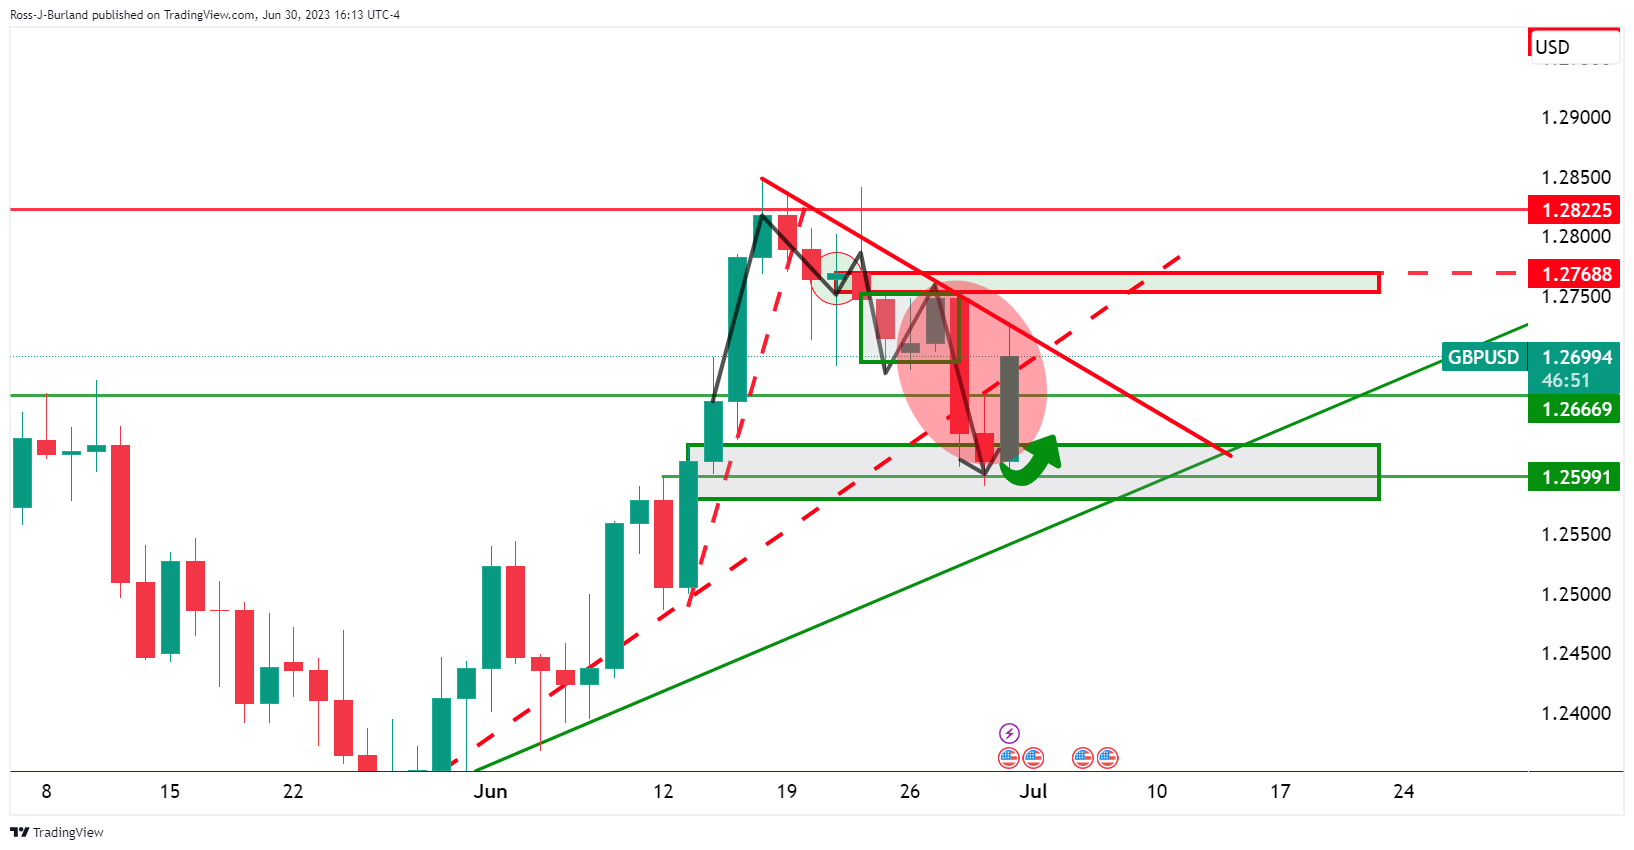
The price moved into a demand area and subsequently reverted to the support area. We are now testing dynamic resistance and set for the week ahead.
While the impulse is strong, the 78.6% holds. Bears will be looking for a deceleration on the lower time frames for a reversion in the impulse. A break of the lower lows opes risk into the 1.2550s.
Data released on Friday showed that the Canadian economy stagnated during April, against expectations of a 0.2% expansion. Analysts at CIBC point out that the Canadian economy wasn't quite as resilient to the headwinds it was facing in April as was first indicated.
Key quotes:
“While the strike by federal workers has created some noise within the data, the underlying trend still appears to show a weakening of growth following the very swift start to the year. With absolute levels of activity getting closer to pre-pandemic norms in some of the sectors that have been recovering over the past year, and with interest rate hikes still having a lagged impact, growth rates for the economy as a whole will likely weaken further during the second half of the year and into 2024.”
“For now we retain our call for no hike in July, and a final 25bp move in September, but the BoC's surveys later this morning and labour force survey next week could still tip the balance on that call.”
- Silver bears are licking their lips at key structures.
- The 38.2% Fibo is playing its resistance role.
Silver shot up in a correction on Friday with a high of $22.844 from $22.3474 the low. The bulls are correcting the week's sell-off into month's end. The focus is on the Federal Reserve as data continues to offer mixed messages. The Federal Reserve's preferred inflation gauge rose 0.3% MoM, in line with forecasts and below 0.4% in April while the annual core rate slowed to 4.6% and the headline PCE rate reached the lowest in nearly two years.
This came in contrast to this week's firmer data, profit-taking has ensued as the following illustrates:
Silver weekly chart
We are seeing a classic rejection of the M-formations neckline followed by a bearish continuation to crack structure to the downside.
Silver daily chart
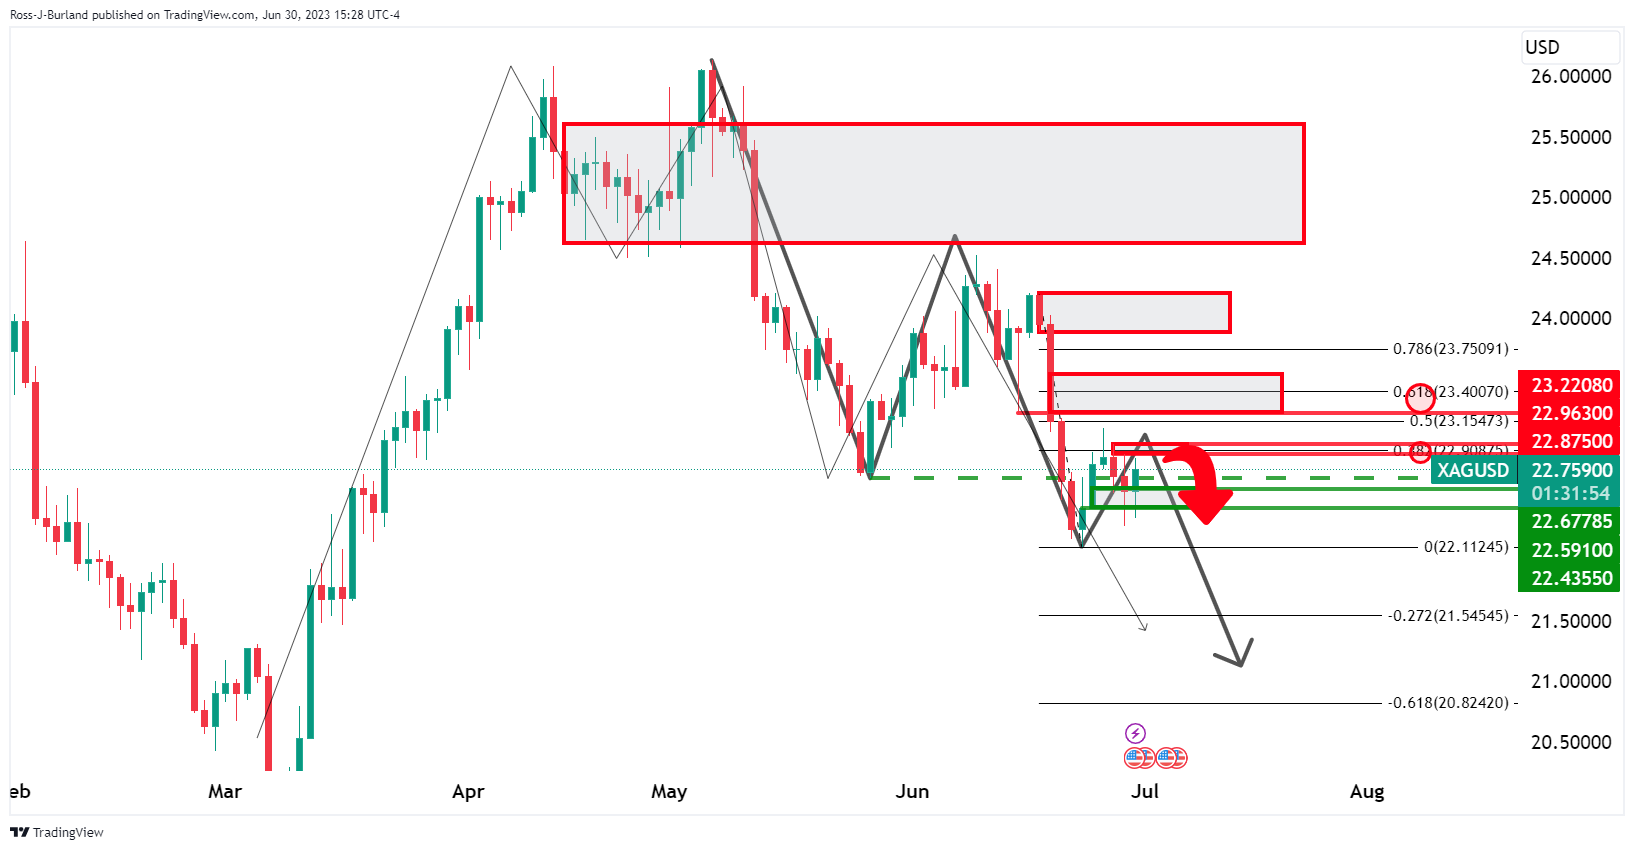
A bullish correction is in play to test a 38.2% Fibonacci that is so far acted as resistance. Bears are eyeing prospects of a downside continuation for the days ahead.
Next Friday, the US will release the June official employment report. The market consensus is for an increase of 200K in payrolls. Analysts at Wells Fargo forecast a 245K gain.
Key quotes:
“May's employment report delivered a strong rise in nonfarm payrolls with a 339K gain. However, the household survey added weight to the view that the labor market continues to gradually soften, with household employment contracting by 310K and the unemployment rate ticking up to 3.7%.”
“We expect nonfarm payroll growth to moderate in June. Demand for workers continues to subside, with initial jobless claims moving up between survey weeks and the four-week average up nearly 20% over the past year. Meanwhile, job postings in June continued to slide.”
“Cooling in the jobs market remains incremental rather than abrupt. Therefore, we look for what we would consider to be a still robust gain of 245K new jobs in June, but will be closely watching revisions to May given the 22-year low in the survey response rate.”
“We look for the unemployment rate to tick back down to 3.6% in anticipation of some bounce-back in the household measure of employment.”
- USD/CAD bulls move in for the easy money into month end.
- The support area was a foundation for a short squeeze ahead of a new month.
USD/CAD has come up for air as the following analysis will show. It's month's end so traders look to square up following a disappointment in US data to cap the stronger performance this week. The Federal Reserve's preferred inflation gauge rose 0.3% MoM, in line with forecasts and below 0.4% in April while the annual core rate slowed to 4.6% and the headline PCE rate reached the lowest in nearly two years.
In contrast to this week's firmer data, profit-taking has ensued and bears have thrown in the towel in preparation for a new month in the ebbs and flows of the market testing prior lows of the week's opening balance.
CAD is therefore pressured as follows:
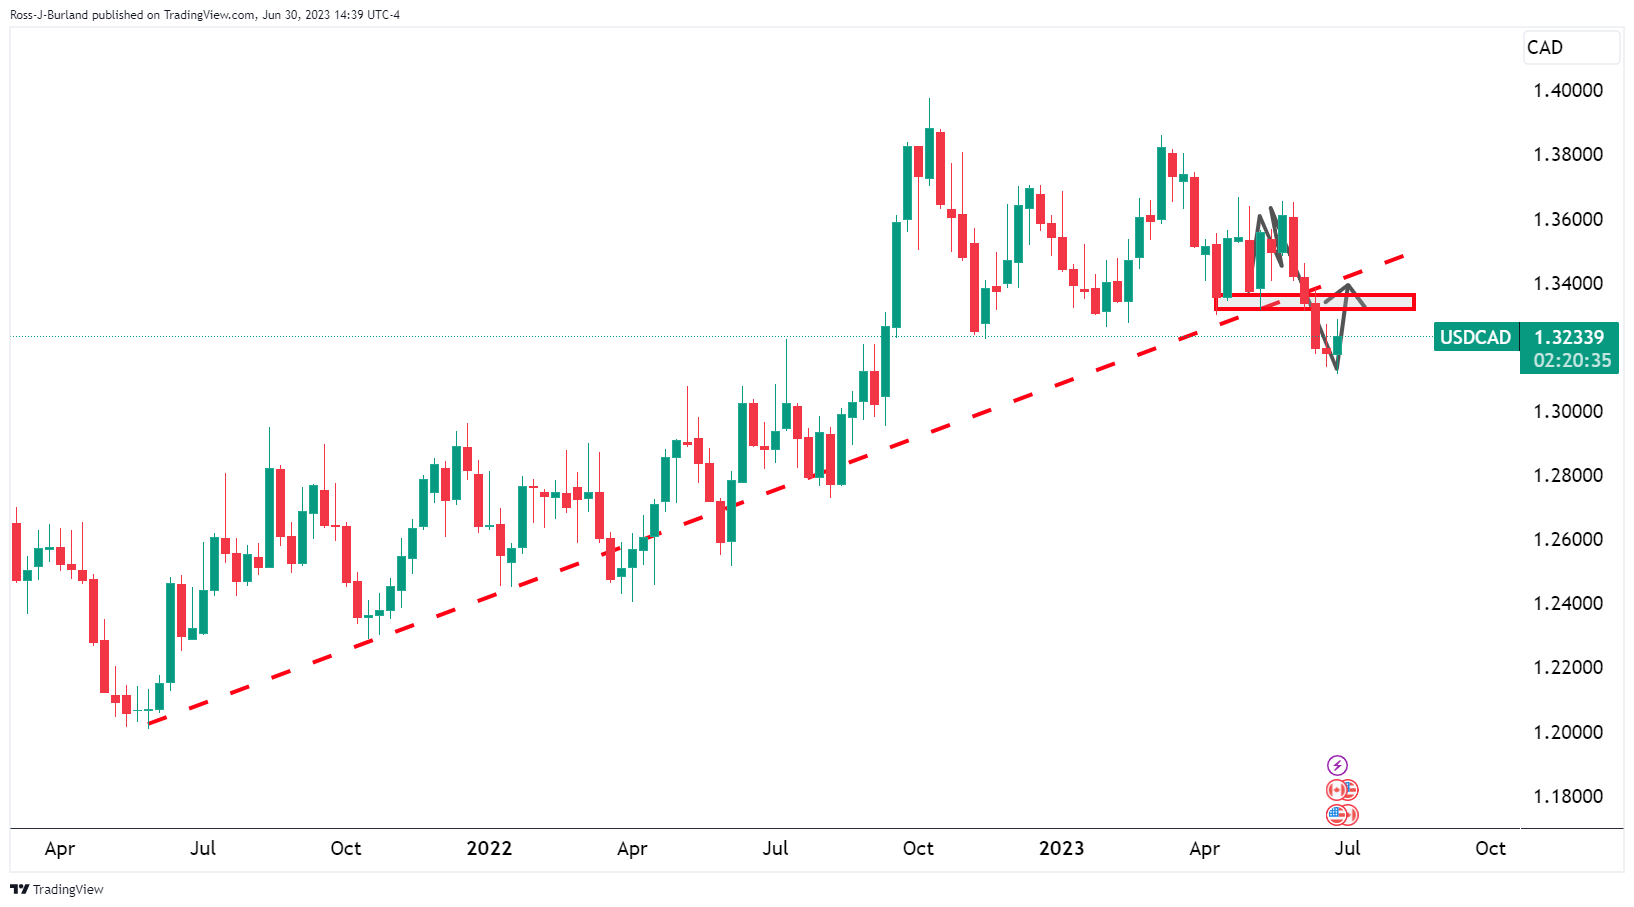
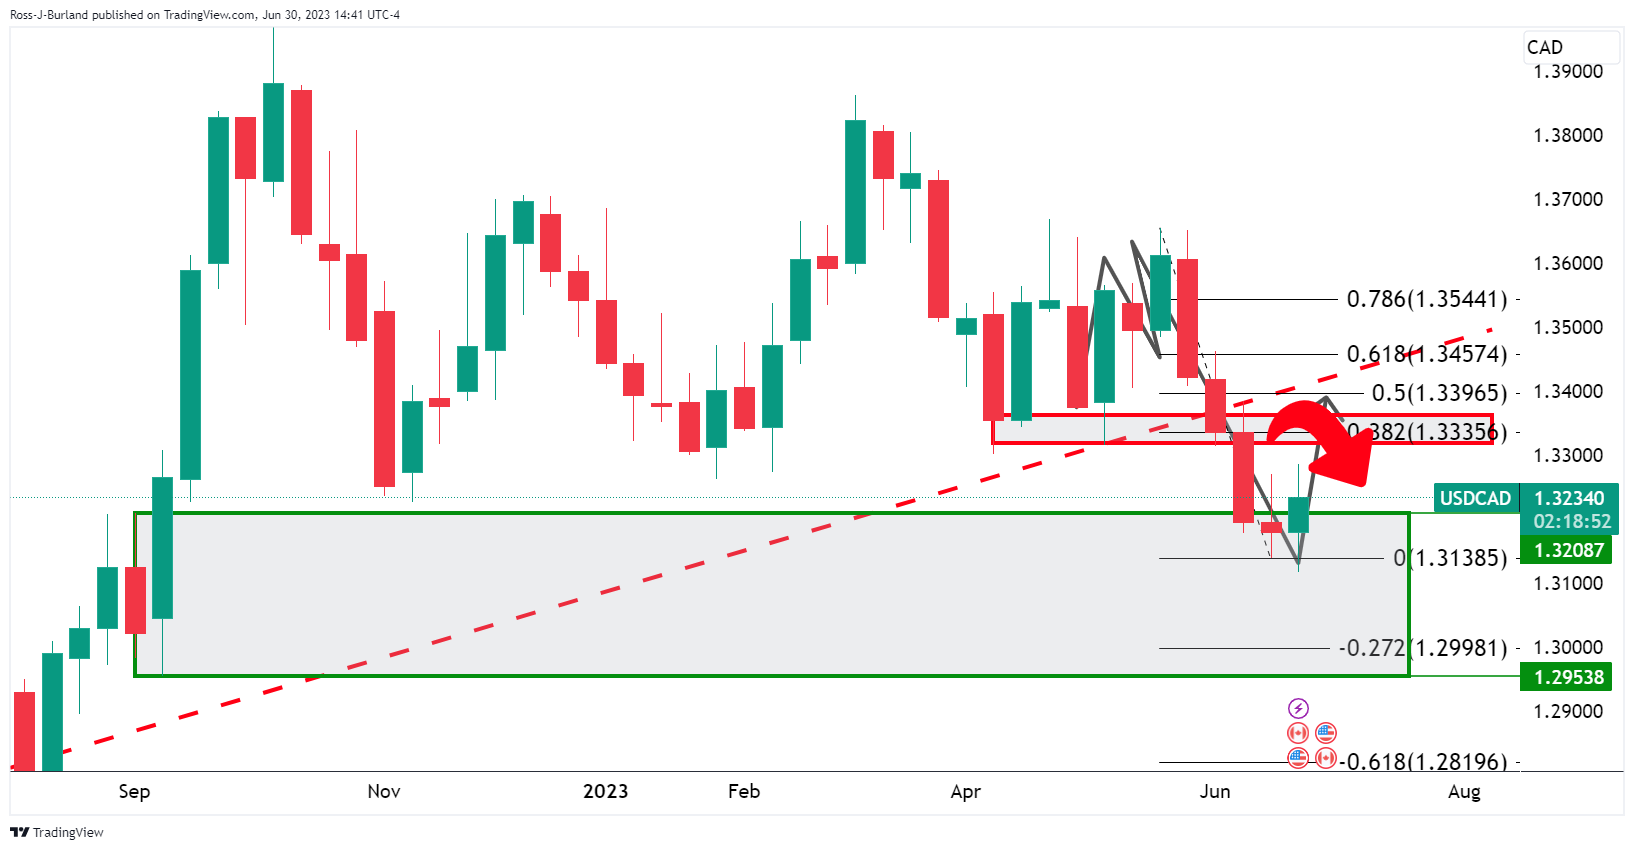
The daily chart hits the upper end of the 1.32 area and bull eye a significant correction towards key resistance.
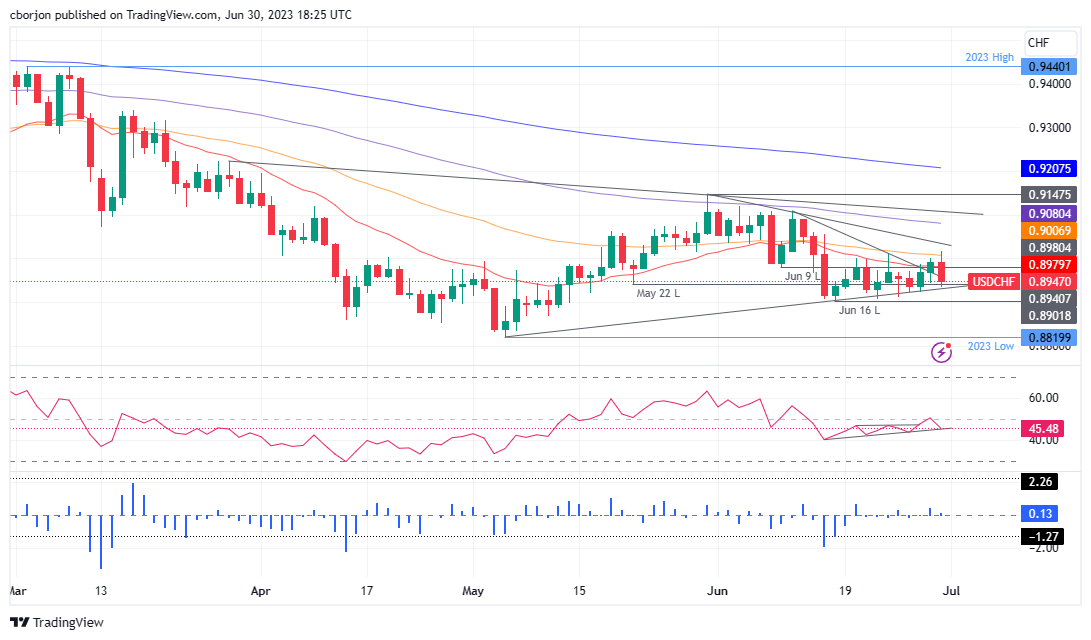
- USD/CHF drops below key 0.90 level, extending losses as sellers eye a test of the 0.8900 mark.
- Despite losses, fading selling pressure indicated by RSI and positive three-day RoC signals potential recovery.
- If breached, initial resistance at 20-day EMA opens path to 50-day EMA at 0.9007 and beyond.
USD/CHF fails to decisively crack the 50-day Exponential Moving Average (EMA) at 0.9007, drops beneath the 0.90 figure, and extends its losses below technical support levels, as sellers see a test of the 0.8900 mark. At the time of writing, the USD/CHF trades at 0.8947, down 0.51%.
USD/CHF Price Analysis: Technical outlook
The USD/CHF is neutral to downward biased, as price action remains constrained within the 0.89/0.90 area for the last two trading weeks. The Relative Strength Index (RSI) indicator portrays sellers in charge, but it should be said the RSI has printed higher throughs, suggesting selling pressure is fading. In the meantime, the three-day Rate of Change (RoC) remains positive despite the USD/CHF is printing losses.
If USD/CHF continues to edge lower, the first support would be 0.8900. A breach of the latter will expose the year-to-date (YTD) low of 0.8819. Conversely, if buyers reclaim the 20-day EXMA at 0.8979, that will expose the 50-day EMA at 0.9007. Once cleared, the next resistance would be the 100-day EMA at 0.9080 before challenging the 0.9100 mark.
USD/CHF Price Analysis: Price Action – Daily chart
- EUR/JPY found support at a low at 156.70 and then recovered towards 157.50.
- Japan reported soft inflation data supporting a dovish stance from the BoJ.
- German yields retreated after soft EZ HICP and mixed German data.
EUR/JPY has regained momentum and is positioned for a weekly gain as it finds support around 156.70 and rebounds towards the 157.50 area. The JPY has lost appeal after soft inflation data from Japan, which is set to reinforce further the dovish stance of the Bank of Japan (BoJ). On the other hand, German yields are in retreat due to disappointing Eurozone (EZ) HICP (Harmonized Index of Consumer Prices) and weak economic data from Germany.
EZ and Japan reported soft inflation figures. Dovish BoJ weighs on the Yen
Following the hot inflation figures reported by Spain and Germany, the Eurozone’s Core HICP increased by 5.4%, but below the 5.5% expected, with a 0.3% monthly increase falling short of the 0.7% expected. Earlier in the session, Germany reported that Retail Sales contracted by 3.6% in May, but this was better than the forecasted 4.3% decline, while the Unemployment Rate picked up to 5.7% vs the 5.6% expected.
Meanwhile, according to the World Interest Rate Probability (WIRP) tool, markets discount rate hikes for July, September and December. It's worth noticing that Christine Lagarde from the European Central Bank (ECB) sounded hawkish earlier this week, showing concern with inflation being “uncomfortably high”, suggesting that additional hikes may be appropriate.
On the other hand, the Tokyo Consumer Price Index’s (CPI) headline figure fell to 3.1% YoY in June vs the 3.8% expected and the Core figure to 3.8% (4.1%) expected. That being said, BoJ’S Governor Kazuo Ueda commented on Wednesday that once inflation aligns with the Bank’s forecast, he’ll consider a pivot. As inflationary pressure declines in Japan, they support a more dovish stance, weakening the Yen.
EUR/JPY Levels to watch
According to the daily chart analysis, the EUR/JPY pair remains bullish. Buyers have the upperhand in both the daily and weekly chart; in the latter, they are close to a third consecutive week of gains. However, the cross remains overbought, so a correction shouldn’t be discarded.
In a technical correction, support levels are 157.00, 156.50, and 156.00. On the flip side, if bulls gain further ground, there are resistance levels to monitor at 158.00, 158.50, and 159.00.
EUR/JPY Daily chart
-638237458007560724.png)
- USD/MXN holds steady near 17.1200 as easing US inflation slows US Dollar’s climb, despite concerning Mexican jobs data.
- US Dollar Index drops more than 0.50% after the softer-than-expected inflation report, allowing breathing space for the peso.
- Expectations of unchanged rates from Banxico favor MXN, potentially signaling further downside for the USD/MXN pair.
USD/MXN stays firm around the 17.1200 region as softer-than-expected inflation data in the United States (US) weighed on the US Dollar (USD), putting a lid on the USD/MXN advancement. Jobs data revealed in Mexico showed some deterioration, though the Unemployment Rate remains at 3%. At the time of writing, the USD/MXN is trading at 17.1204, almost flat, after hitting a daily low of 17.0440.
US Dollar’s rally tempers despite the deterioration in the Mexican labor market, as easing US inflation weighs on the buck
According to the US Department of Commerce report, US inflation decelerated in May. The US Federal Reserve (Fed) preferred gauge for inflation, the Core PCE, slowed from 4.7% to 4.6% YoY, aligned with estimates, as monthly figures edged lower, flashing signs of cooling down. The Personal Consumption Expenditure (PCE) as a whole edged lower sharply, past the 4% threshold, at 3.8% YoY from April 4.4%, with MoM data slowing to 0.3% from 0.3%.
Later the Chicago PMI improved to 41.5 but remained in contractionary territory. The University of Michigan (UoM) revealed June’s latest poll, with Consumer Sentiment hitting the 64.4 threshold, above the preliminary reading of 63.9.
On the Mexican front, unemployment increased and damaged the Mexican Peso (MXN) prospects. The labor market lost 648,340 jobs in May, its worst performance for a May report since records began in 2005, as reported by the Encuesta Nacional de Ocupación y Empleo (ENOE). The seasonally adjusted unemployment rate hit 3.0% in May, though headline figures were 2.9%.
After the US and Mexican data release, the USD/MXN climbed from 17.0600 to a four-day high of 17.1712 before trimming 5 cents, as the USD/MXN slid to the 17.1200 area. US Treasury bond yield continued to edge lower and weighed on the greenback. The US Dollar Index (DXY), which tracks the performance of a basket of six currencies against the US Dollar, drops more than 0.50%, slumping to 102.830.
Regarding central banks and expectations for monetary policy, the Fed is foreseen to raise rates in July, with odds at 87%, as reported by the CME FedWatch Tool. However, estimates for an additional quarter of percentage raise in November slid compared to yesterday’s odds at around 36%. The Bank of Mexico (Banxico) is expected to keep rates unchanged after two back-to-back meetings holding rates at 11.25%. That said, the interest rate differential still favors the MXN; hence further downside is expected in the USD/MXN pair.
USD/MXN Price Analysis: Technical outlook
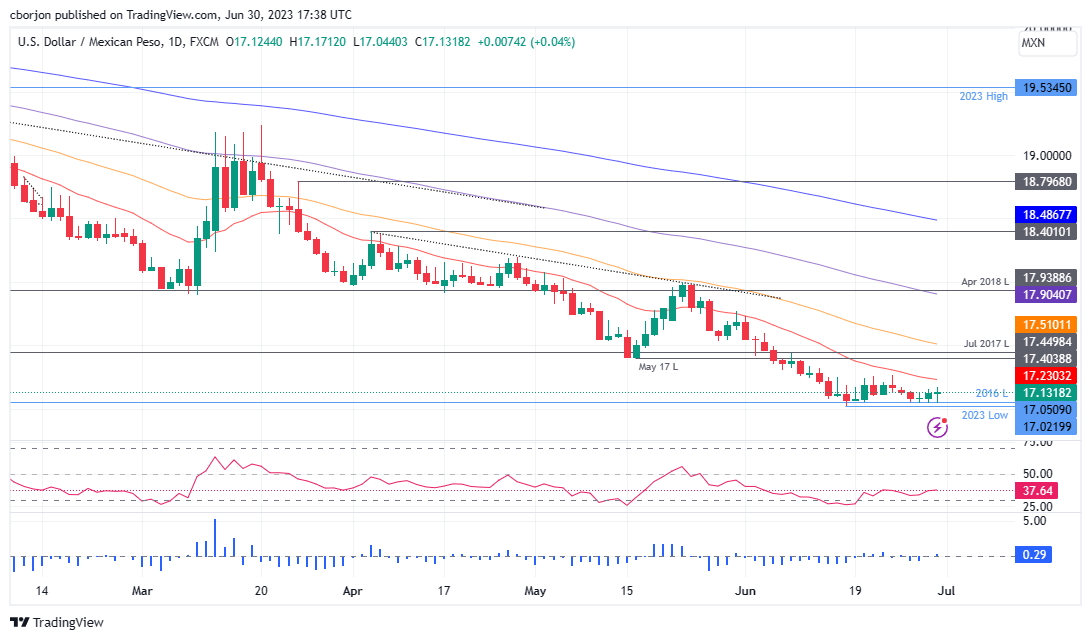
The USD/MXN remains in choppy trading price action, capped within the 17.00-17.20 area, unable to pierce the 20-day Exponential Moving Average (EMA) at 17.2303, seen as the first resistance level for buyers. That would not be enough to shift the USD/MXN’s downtrend, as the May 17 low turned resistance at 17.4038 remains in a safe place and is the next price level to watch for buyers and sellers if the USD/MXN surpasses the 20-day EMA. Conversely, a fall below 17.0500 will expose the year-to-date (YTD) low of 17.0219 before the USD/MXN challenges 17.00.
- The XAG/USD jumped above $22.70, seeing more than 0.80% gains and is set to close a winning week.
- Core PCE declined to 4.6% YoY in May, lower than expectations.
- Following the data the USD and US bond yields retreated.
The XAG/USD surpassed the $22.70 mark on Friday and registered an increase of over 0.80%. This positive momentum positions it for a week of gains after two weeks of losses. The boost in Silver prices can be explained by the release of soft Core Personal Consumption Expenditures (PCE) data from the US from May, which revealed a decline to 4.6% year-on-year in May, falling short of expectations. As a result, the US dollar and US bond yields retreated in response to the data favoring the precious metal.
USD weakened after soft Core PCE figures
The US's Core Personal Consumption Expenditures (PCE), which measures the amount of money consumers spend in a month excluding seasonally volatile products such as food and energy, witnessed a decline in May. The figure decelerated from 4.7% to 4.6% YoY in May, while the headline dropped from 4.6% to 3.8%.
As a reaction, the DXY Index dropped from 103.55 to 102.90 while US bond yields which could be considered the opportunity cost of holding non-yielding precious metals retreated from daily highs. In that sense, the yield on the 2-year Treasury Bond reached a peak of 4.93%, marking its highest level since March 9 and subsequently pulled back to 4.85%. In addition, the 5-year and 10-year rates experienced declines, with the former falling to 4.13% and the latter dropping to 3.83%.
Focus now shifts to next week’s labor market data from the US, including ADP, Jobless Claims on Thursday, and the Nonfarm Payrolls report on Friday.
XAG/USD Levels to watch
According to the daily chart, the XAG/USD appears bearish in the short term. The Relative Strength (RSI) and Moving Average Convergence Divergence (MACD) both remain in negative territory, suggesting that the sellers have the upperhand. In addition, traders should eye a bearish cross performed by the 20 and 100-day Simple Moving Average (SMA) of $23.35, which could fuel further downside.
On the downside, support levels to watch stand up at the 200-day SMA at $22.53, followed by $22.30 and June lows at $22.15. On the flipside, resistances are seen at $23.00 followed by $23.10 and the mentioned convergence of SMA’s at $23.35.
XAG/USD Daily chart
-638237414349722126.png)
- AUD/USD surges 0.66%, eyes 0.6700 as US inflation shows signs of slowing, softening the US dollar.
- Despite weaker Chinese data and lower CPI, AUD finds support from diminished expectations of aggressive Fed hikes.
- Aussie’s surge and the US Dollar Index’s 0.48% drop reflect a reassessment of the Fed’s future tightening stance.
AUD/USD climbs sharply and eyes a test of the 0.6700 figure after economic data from the United States (US) showed that inflation is cooling, weakening the US Dollar (USD) despite solid data revealed on Thursday. Hence, the Australian Dollar (AUD) gets a respite, and the AUD/USD pair exchanges hands at 0.6658, gaining 0.66% after hitting a daily low of 0.6603.
Cooling inflation in the US softens the greenback and boosts the Aussie, despite weaker Chinese data, subdued RBA expectations
The US economic docket showed plentiful data as the week, month, and quarter-end approaches. The US Department of Commerce delivered the US Federal Reserve (Fed) preferred gauge for inflation, the Core Personal Consumption Expenditures (PCE), which rose by 0.3% MoM, in line with estimates, below April’s 0.4%. Yearly data pointed lower to 4.6%, from 4.7% in the previous month, showing that inflation is becoming entrenched and not slowing at the pace projected by the Fed. Headline data showed that inflation edged much lower than monthly figures.
In other data, the Chicago National Activity Index PMI rose by 41.5, exceeding May’s 40.4 print, a slight improvement but shy of getting to expansionary territory. At the same time, the University of Michigan (UoM) Consumer sentiment survey rose by 64.4, above estimates and the preliminary reading of 63.9.
On the Australian front, the Aussie (AUD) remains pressured by weaker Chinese data, as factory data dented market sentiment during the Asian session. Expectations for additional tightening by the Reserve Bank of Australia (RBA) sank after the latest CPI report showed inflation dipping to a 13-month low. Hence, money market futures show six basis points of tightening by July, but investors expect rates to peak at around 4.50% by December 2023.
Following the release of the US data, the AUD/USD soared from around 0.6620 to 0.6650. That reflects traders expect the Fed to hike rates, but not as aggressively as expected, following upbeat Thursday’s data. Consequently, US Treasury bond yields are falling, while the US Dollar Index, a measure of the buck’s performance against a basket of six currencies, edged lower by 0.48%, exchanging hands at 102.925.
Regarding monetary policy by the Fed, odds for a 25-bps hike are still up at 87%, as shown by the CME FedWatch Tool, with traders still expecting another rate increase towards November 2023.
AUD/USD Price Analysis: Technical outlook
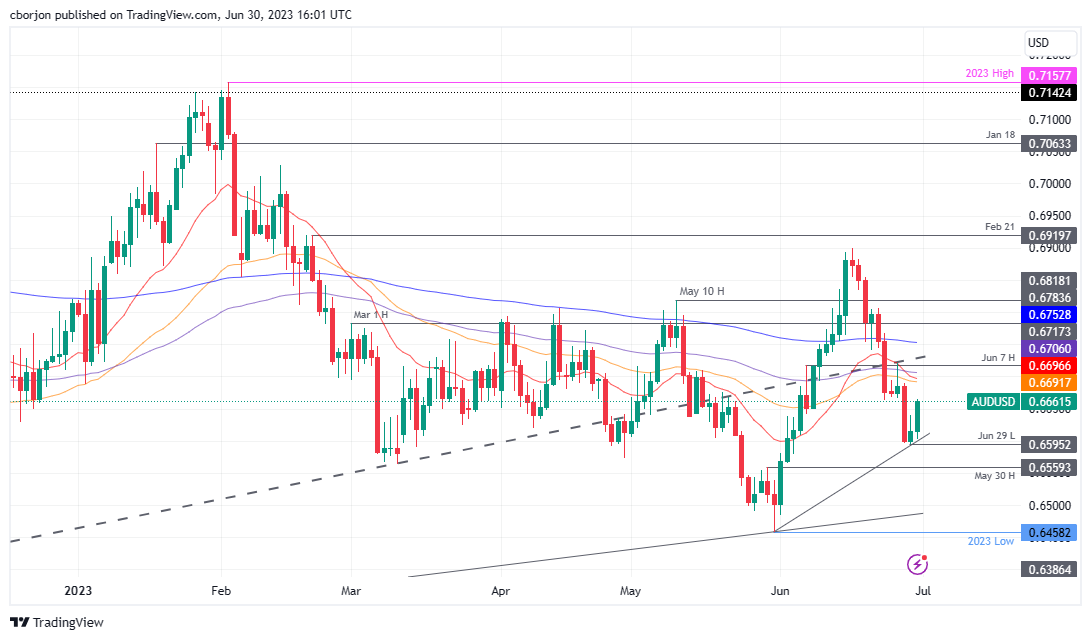
After diving to a weekly low of 0.6595, the AUD/USD bounced off the lows and rose above 0.6650, a psychological level. It should be said that for a bullish continuation, the AUD/USD must crack June’s 23 daily low of 0.6662 turned resistance to open the way to a confluence of daily EMAs, with the 20, 50, and 100 hoovering around the 0.6700 figure. Otherwise, the AUD/USD pair will be exposed to further selling pressure, with sellers eyeing the 0.6600 figure, the weekly low of 0.6590s, and the May 30 daily high turned support at 0.6559.
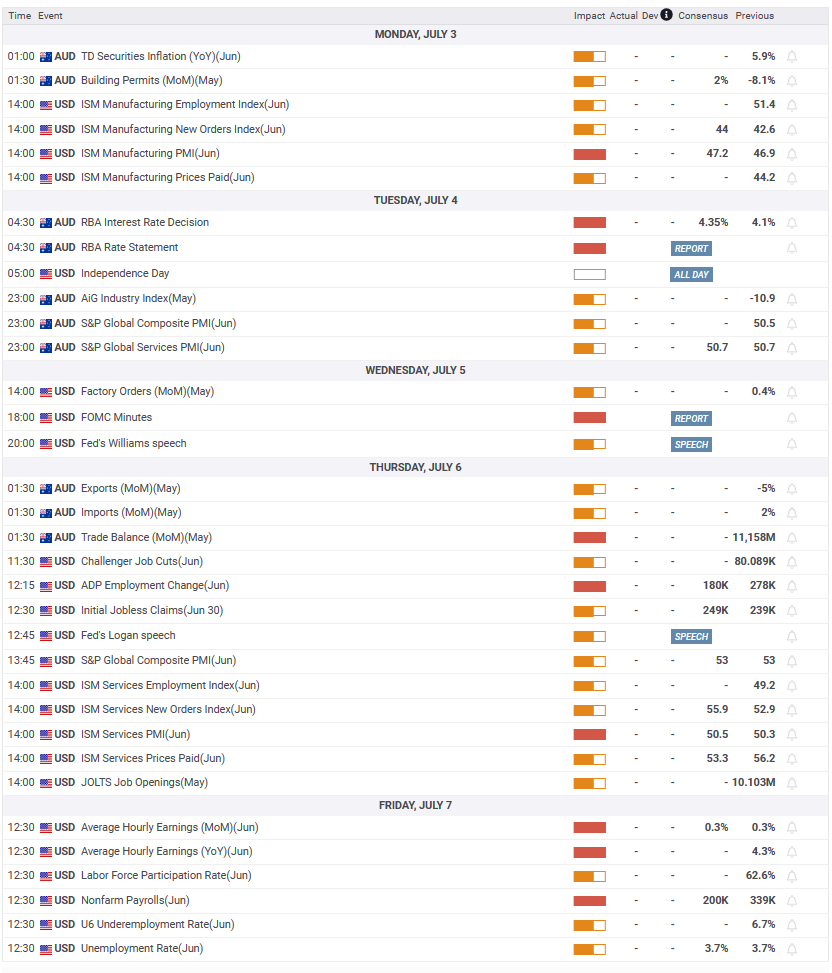
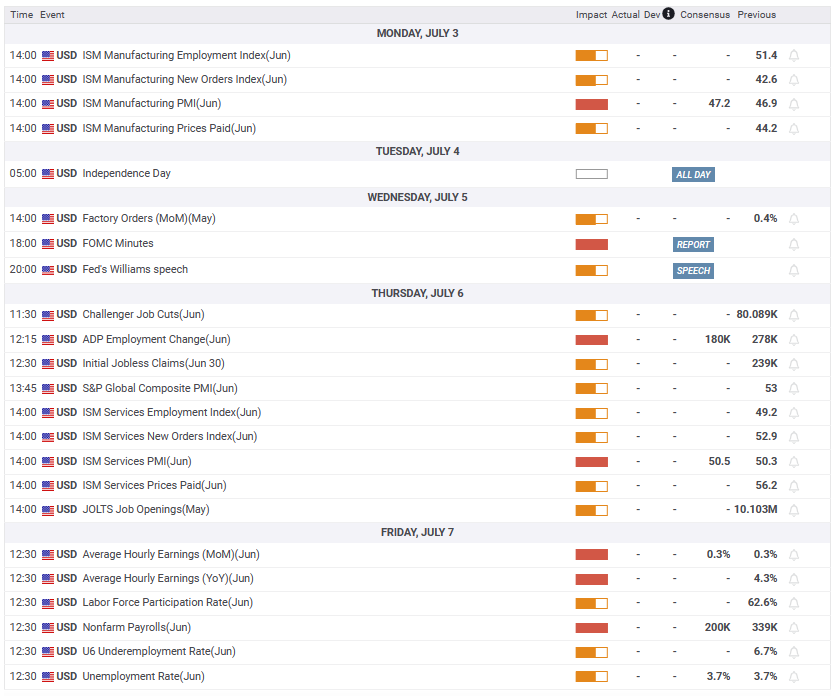
Upcoming events
- NZD/USD cleared part of it previous day’s losses and climbed to 0.6130, 0.90% up on the day.
- Core PCE came in at 4.6% YoY vs the 4.7% expected in May.
- US bond yields retreated, weakening the US Dollar.
On Friday, following the release of soft Personal Consumption Expenditures (PCE) data from the US, the NZD/USD pair staged a recovery, erasing a portion of its previous day's losses. The pair advanced to 0.6120, marking an increase of 0.80% for the day. Following the data, US bond yields retreated, weakening the US Dollar, but remained in positive territory.
US reported soft PCE figures.
On Friday, the US Bureau of Economic Analysis reported that the Core PCE, the Federal Reserve’s (Fed) preferred gauge of inflation from May from the US, slightly decelerated. The figure declined to 4.6% YoY from its previous 4.7% reading, failing to meet the expectations of 4.7% and tallying a 0.3% MoM increase vs the 0.4% expected.
As a reaction, US bond yields retreated from daily highs as investors seemed to be betting on a less aggressive Fed. In that sense, the 2-year bond yield peaked at 4.93%, its highest level since March 9, retreating to 4.85%, while the 5 and 10-year rates fell to 4.13% and 3.83%.
However, more evidence of inflation deceleration must be seen for the Fed to pivot from its hawkish stance. As for now, according to the CME FedWatch tool market is almost completely discounting a 25 basis points (bps) hike on July 31 and still trying to figure out when the second hike Jerome Powell hinted will come.
NZD/USD Levels to watch
According to the daily chart, the technical outlook for the NZD/USD got better as the Relative Strength (RSI) and Moving Average Convergence Divergence (MACD) gained traction in negative territory. In addition, traders should eye the convergence of the 200 and 20-day Simple Moving Averages (SMA). Moreover, traders should eye the 200,100 and 20-day Simple Moving Averages (SMA) convergence towards the 0.6140-0.6200 area as they seem to be about to perform a bearish cross.
On the downside, support levels to watch align at 0.6100,0.6050 and at 0.6030 (strong support seen at the beginning of June).
NZD/USD Daily chart
-638237374217696610.png)
.
- The US dollar weakened following consumer inflation data.
- DXY drops 0.4%, retreating from two-week highs.
- XAU/USD reached its highest level in three days.
Gold prices are having their best day in weeks on Friday, boosted by a decline in the US dollar across the board. XAU/USD jumped from near $1,905 to $1,920 following the release of the US Core Personal Consumption Expenditure Price Index.
The consumption inflation figures showed a decline slightly higher than expected and triggered a retreat in US yields and boosted equity and commodity prices. The US Core PCE fell in May to 4.6% on an annual basis from 4.7%, while the headline dropped from 4.6% to 3.8%.
These figures softened Federal Reserve rate hike expectations for the next meeting. The focus now turns to next week's US labor market data, which includes the ADP, Jobless Claims (Thursday), and the Nonfarm Payrolls report (Friday).
XAU/USD rebounding
XAU/USD is hovering around $1,915, up less than $10 but enough to make it the best day in weeks. The recovery took place after reaching a low on Thursday at $1,892, the lowest level in three months.
On the upside, XAU/USD is breaking a short-term downtrend line. The next resistance area is $1,920. On the downside, a decline below $1,905 would weaken the short-term outlook for the yellow metal.
Technical levels
MXN has been Credit Suisse’s favourite EM currency throughout H123. The bank remains constructive on the Peso.
Banxico is expected to cut ahead of the Fed
Soft CPI data surprises have driven markets to expect Banxico to cut rates ahead of the Fed, starting in Q4. This would be at odds with the previous history of Banxico waiting for the Fed to cut rates before initiating its own easing cycle.
Given the bank’s focus on FX stability under the Rodriguez leadership, we are skeptical these expectations will realize and remain therefore constructive on the Peso.
A US activity slowdown would pose a bigger threat to MXN's strength.
Economists at TD Securities analyze the Yuan outlook.
Slowdown in China's recovery and widening rate differentials will add pressure on the Yuan
The slowdown in China's recovery and widening rate differentials will add pressure on the Yuan and we think USD/CNY could revisit the high last year around 7.30.
However, we expect authorities to show their discomfort with the pace of depreciation via the daily fixings to slow the pace of the USD/CNY climb.
See: USD/CNH to top around 7.30 during the third quarter – Rabobank
The outlook for USD/CAD is now very muddy. Tthe confirmed close below 1.3260 is a major event. Economists at Rabobank have updated their forecasts.
Short term forecasts revised lower to reflect a move back to 1.33 in the coming weeks
In light of recent price action, we have revised our short term forecasts lower to reflect a move back to 1.33 in the coming weeks, and then a return to the 1.35 magnet on a three-month basis but this will require a confirmed close above that critical 1.3260 that implies the move down through the bullish trend was a false breakout.
Should we see a move below 1.30, we will need to revise our outlook substantially to reflect a sustained period of trading within the 1.28 to 1.30 region. But to be clear, this is not our base case, and instead, we expect the demagnetizing of the 1.35 handle to prove to be a short-lived phenomenon.
- GBP/USD surges more than 0.50% following strong UK economic data and easing US inflation.
- US Core PCE inflation cools, while UK Q1 GDP dodges recession, giving GBP the upper hand.
- Sterling’s rally fueled by expectations of less aggressive Fed action; US Dollar Index drops by 0.50%.
GBP/USD recovered lost ground on the last day of the week, month, and quarter, rising more than 0.80% after hitting a daily low of 1.2599. Upbeat data from the United Kingdom (UK) and inflation edging lower in the United States (US) boosted the Pound Sterling (GBP), set to finish the month with gains of 2%. At the time of writing, the GBP/USD is trading at 1.2717.
Stellar UK GDP data and slowing US inflation bolstered the Pound Sterling, past 1.2700 vs. the US Dollar
The latest inflation report in the US eased some pressure on the Federal Reserve (Fed) as the central bank struggles to curb sticky inflation. The Fed’s preferred gauge for inflation, the Core PCE, rose less than expected, coming at 0.3% MoM, below the prior’s month 0.4%, while annual-based figures diminished to 4.6% from 4.7%. Headline inflation rose by 3.8% YoY, below April’s 4.4%, while PCE climbed 0.1% month-over-month, lower than 0.4% in the previous report.
Across the pond, the UK economic docket featured the Gross Domestic Product (GDP) release of the first quarter, with the country missing a recession, expanded by 0.1% QoQ, as high inflation hurts households’ disposable income, as shown by the Office for National Statistics (ONS) figures. Given that inflation remains at around 8.7%, the Bank of England (BoE) is expected to raise rates to 5.5%, as shown by money market futures, though investors remain worried that higher Bank Rates would tip the UK economy into a recession.
Following the release of the US data, the GBP/USD increased from around 1.2640s to 1.2690s as investors began to price in a less aggressive Fed. Consequently, US Treasury bond yields dropped, while a measure of the buck’s value, the US Dollar Index, has dropped more than 0.50%, exchanging hands at 102.769 on Friday.
GBP/USD Price Analysis: Technical outlook
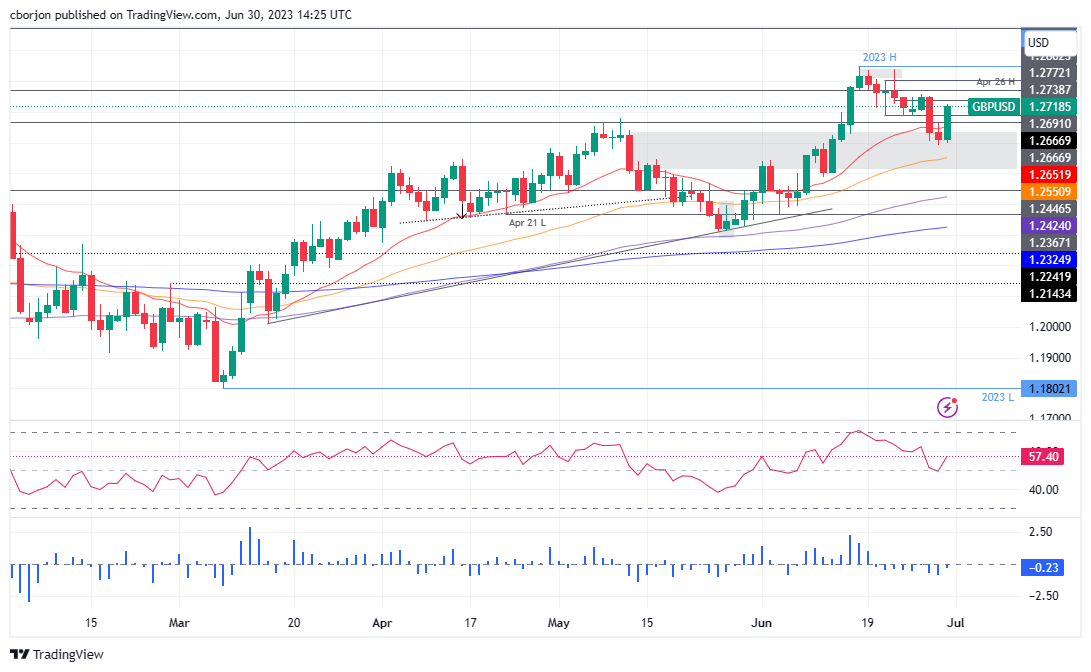
After falling for two straight days, the GBP/USD bounced off the weekly lows. On its recovery, GBP/USD must surpass the June 21 daily low turned resistance at 1.2691, so they can recapture 1.2700 and resume its uptrend. In that outcome, the GBP/USD’s next resistance levels would be the June 28 daily high at 1.2752, followed by the 1.2800 figure.
Conversely, if GBP/USD prints a daily close below 1.2690, it will exacerbate a re-test of the current week’s low of 1.2590.
Of note, the Relative Strength Index (RSI) aims upward after dipping to its neutral line, while the three-day Rate of Change (RoC) shows sellers losing momentum, opening the door for further upside.
Upcoming events
For the Yen, economists at Wells Fargo see potential for stronger appreciation next year.
Likely hawkish monetary policy shift from the BoJ later this year
The Japanese currency has remained a significant underperformer so far this year, especially as the US economy has remained resilient, prospects for Fed easing have been pushed out, and the BoJ has not adjusted monetary policy settings. Accordingly, the prospects for significant Yen strength have also been pushed out.
That said, a likely hawkish monetary policy shift from the Bank of Japan later this year, combined with a weak US economy and lower US interest rates next year, should see the Yen strengthen to 133.00 by late 2024.
Economists at TD Securities expect the US Dollar to struggle in the coming months.
Ding, dong the Fed is done
The end of the Fed cycle is normally quite bearish for the USD for the first few months. It normally drops >2% in the first two months.
For the US, disinflation is the main driver and sending the strongest directional H2 cue for the USD: choppy but lower, yet with a few USD baskets in play.
Our out of consensus call that US disinflation is strong enough for the Fed to skip July, effectively ending the cycle, would reinforce lower macro vol, late cycle growth dynamics and boost carry.
To tell the truth, Antje Praefcke, FX Analyst at Commerzbank, would have liked the Riksbank to do more. Thus, the SEK is set to struggle.
The Riksbank stays on the ball – but no more than that
The Riksbank partially delivered yesterday, but only partially. It will reduce its assets holdings more rapidly as of September, but it was only able to decide on a 25 bps rate step to 3.75%, which had been generally expected and therefore did not constitute a restrictive signal for the market.
Moreover, Riksbank now signaled interest rates to peak at just over 4%, which only entails one further rate step in the autumn, and which does not constitute a restrictive surprise. The Swedish central bankers now signal first rate cuts (at this point from slightly higher levels) for the summer of 2025. Restrictive surprise? Not exactly!
In my view the Riksbanks stay on the ball when it comes to fighting inflation, but no more than that. That is why to my mind yesterday’s decision does not look like a proactive move, but more like an ‘overdue reaction to past developments’. Compared with the ECB it is significantly less courageous. Therefore, it does not come as a surprise that there is pressure on the Krona.
A bullish GBP view has been among Credit Suisse’s most consistent positions of 2023 so far. More gains are likely.
EUR/GBP to target 0.8450
Looking ahead, the biggest questions are: 1) can UK core inflation fall quickly given the tightness in the UK labour market and 2) is the UK housing market so fragile as to make it impossible for the BoE to hike as much as priced in and/or hold rates at a high level for a meaningful period of time?
We take the view that, if the ECB is worried about wage-price spiral risks in the Euro-area, the far-graver situation confronting the BoE in the UK should be defined as a genuine emergency that precludes excessive concern about the health of the UK housing market.
While GBP has clearly appreciated a great deal already in 2023, we see room for further gains, with EUR/GBP having scope to push to at least 0.8450 while GBP/USD can test 1.3000 too.
The main risk to our view is a sudden freeze/collapse in UK asset markets.
Economists at Wells Fargo still see potential for moderate gains in the Euro over the medium term.
Slower pace of rate cuts from the ECB relative to the Fed in 2024
We forecast a resumption of modest Eurozone economic growth over time, and a much slower pace of rate cuts from the European Central Bank, relative to the Fed in 2024.
Against this backdrop, we forecast the Euro to strengthen to 1.15 by late 2024.
See: EUR/USD to finish the year around 1.13 – TDS
- The US Core PCE annual rate slowed from 4.7% to 4.6% in May.
- The US dollar weakened modestly after the report.
- The EUR/USD turned positive for the day after rebounding from two-week lows.
The EUR/USD rebounded further after US consumer inflation data and climbed above 1.0880, hitting fresh daily highs, boosted by a weaker US dollar. The greenback pulled back after the report, and commodities and US equities futures rose.
The US Bureau of Economic Analysis reported on Friday that inflation, as measured by the change in Personal Consumption Expenditures (PCE) Price Index, fell to 3.8% YoY in May from 4.3% in April, below the market consensus of 4.6%. The Fed's preferred measure, the Core PCE, also fell from 4.7% to 4.6%.
As a result of the report, the US Dollar weakened. The DXY retreated from weekly highs above 103.50 towards 103.00, and US Treasury yields dropped back to neutral territory for the day. The US 10-year yield fell from three-month highs at 3.89% to 3.84%.
Later on Friday, the University of Michigan releases the final estimate for consumer sentiment, and also the Chicago PMI is due.
EUR/USD holding above the 20-day SMA
The EUR/USD bottomed on Friday at 1.0835, the lowest level since June 15. It started to rebound and after US data accelerated towards 1.0900, boosted by a weak US dollar and risk appetite. The combination is favorable for the upside.
The rebound in EUR/USD took place from near the 20-day Simple Moving Average (SMA) line at 1.0855. A daily close below that level could point to weakness ahead for the Euro from a technical perspective. On the upside, the next areas to watch are 1.0900 and then the 20-period SMA in the 4-hour chart, which is waiting at 1.0910. A recovery above that level would strengthen the short-term outlook for the Euro.
Technical levels
- Natural Gas price trades flat-to-lower on Friday as supply concerns ease because of greater-than-expected stockpiles in Europe.
- This largely eclipses US data out on Thursday showing a fall in inventories last week.
- The end of a threat of civil war in major producer Russia and forecasts that the heatwave will pass further cap gains.
Natural Gas price edged down on Friday at the start of the US session on the back of easing supply concerns after data showed European stockpiles at 77% capacity, reassuring traders that storage tanks will be full in time for the winter demand glut. This undoes the gains made on Thursday after US data showed a surprise fall in inventories last week.
The avoidance of a civil war in Russia has further relieved supply concerns, killing the rally that began at the same time as the Wagner Group’s mutiny. In addition, the heatwave in the US, which drove up demand for Natural Gas more recently (for use in air conditioning), is forecast to pass next week.
XNG/USD is trading in the $2.600s/MMBtu as America wakes up.
Natural Gas news and market movers
-
European storage levels of Natural Gas – built up in preparation for the winter – are substantially higher than in previous years, easing supply concerns and putting a lid on prices.
-
Natural Gas storage capacity in Europe has reached 77%, according to the latest data from S&P Global, which compares to 58% in 2022 for the same time of year and 48% in 2021.
-
S&P Global’s article suggests demand may still rise in Q3 (2023), however, because of low prices.
-
Its infographic for Q3 (see below) forecasts an increase of 2.4% in Natural Gas demand in the quarter to 680 million cubic meters of Gas per day (mcm/d).
-
S&P Global says that the higher Natural Gas stocks and boom in solar energy will “ease pressure on supply”.
-
The current relatively low Natural Gas prices are themselves a result of an overall lower level of demand so far in 2023, according to Irina Slav, a reporter for Oilprice.com.
-
Reduced consumption has become the norm in Europe after energy bills skyrocketed in 2022, and pressure from some governments to lower consumption have combined to force consumers to be more prudent, says Slav.
-
The 2022-2023 winter was also relatively mild in both the US and Europe, reducing demand for Natural Gas and leaving stockpiles high from last year. This means less is required to top them up in 2023, Slav writes.
-
“The reason for the lower prices is, as could be expected, lower demand. It is true that Europe is buying liquefied natural gas. But it is buying a lot less than last year: because its storage caverns are not infinite, and there is still quite a lot of gas left in them from last year,” reports Slav on Friday.
-
Natural Gas has also fallen after the return of geopolitical stability to Russia, which is still a major producer. When the Wagner mutiny began, prices rose on fears supply would be disrupted by a civil war. However, now that the mutiny is over, they have fallen back.
-
Norwegian supply concerns, after outages at the Hammerfest LNG export terminal and the processing plants at Nyhamna and Kollsnes, continue to underpin prices. However, the high storage levels witnessed in Europe mean that the outages in Norway are now less of a concern.
-
Volatility from traders shuffling positions ahead of the expiration date for front-month Futures and Options contracts might be impacting prices as the month of June comes to an end, according to Natural Gas Intelligence (NGI).
-
Moving to the US, the Natural Gas price gapped higher on Thursday after EIA data showed a lower-than-forecast change in US Storage data in the week ending June 23.
-
The sudden recovery came after an almost 10% decline in price from the June highs.
-
Demand for Natural Gas to power air conditioning may be about to moderate following reports that temperatures in the US are set to return to average ranges for this time of year next week.
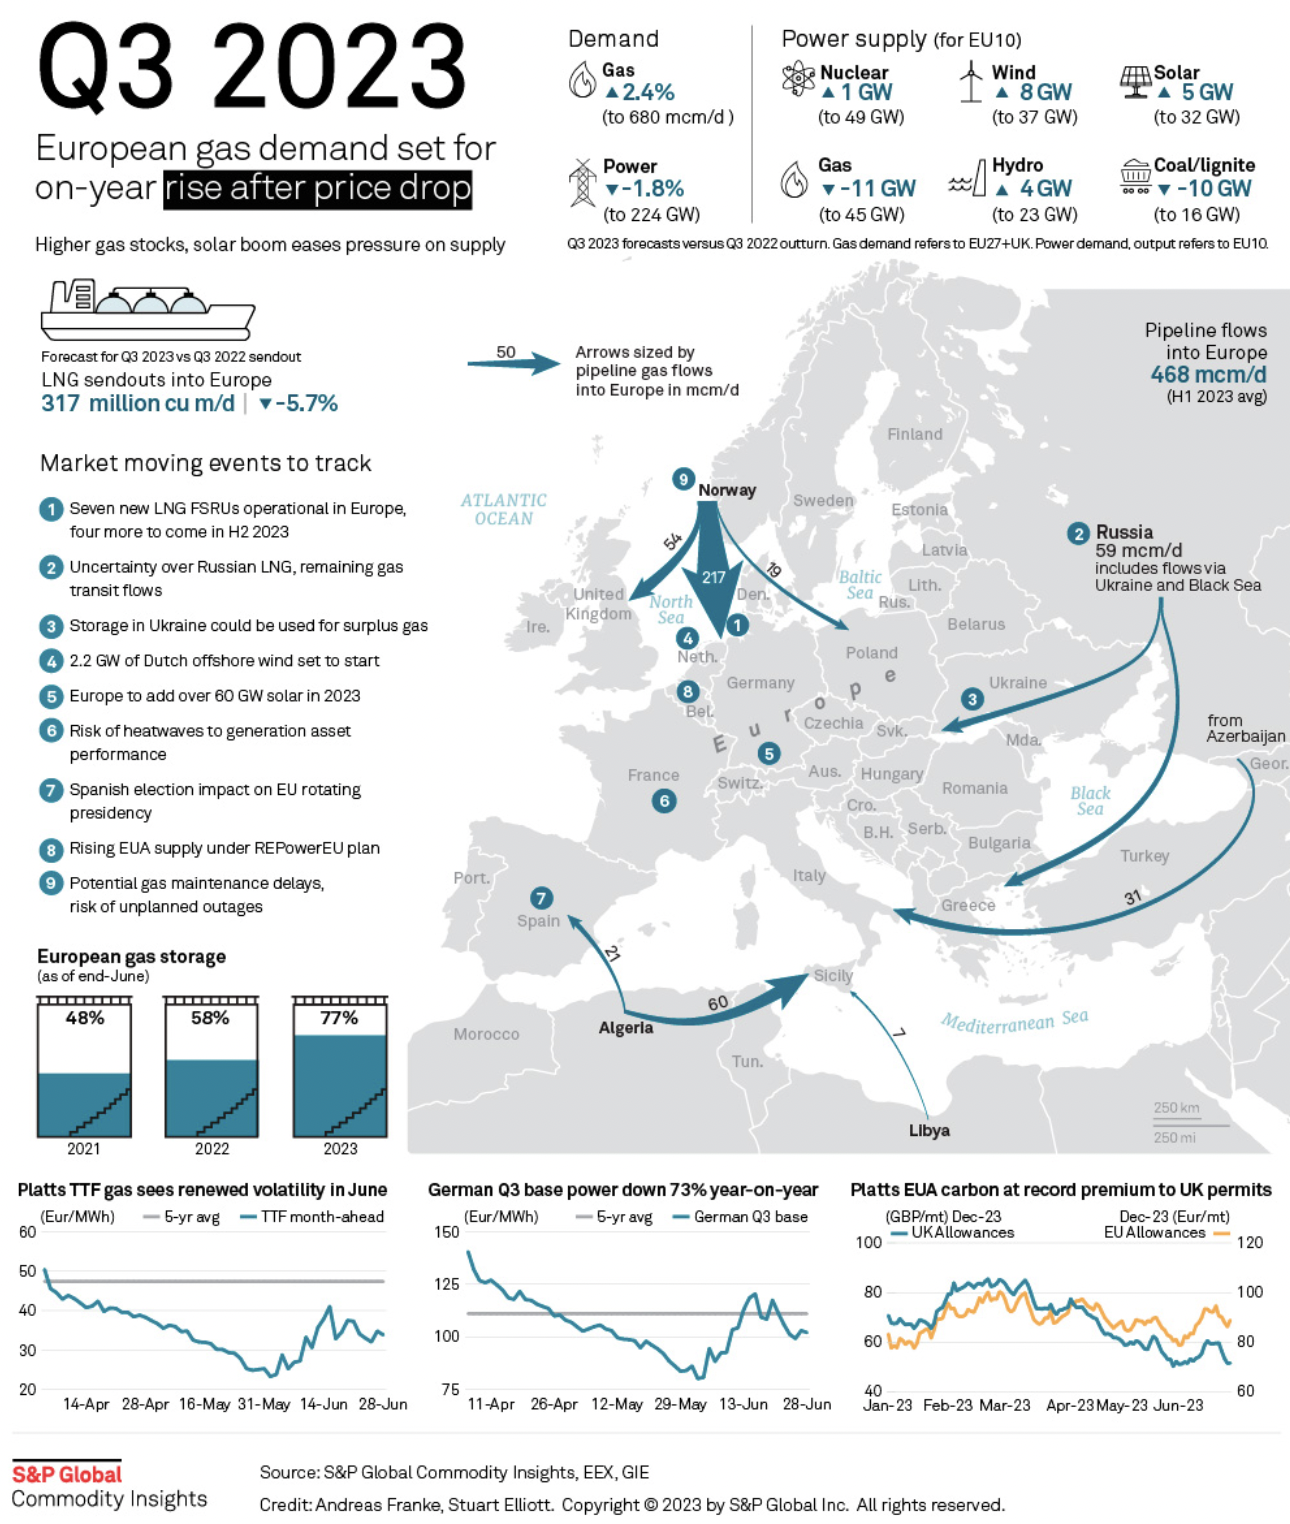
Natural Gas: S&P Global Infographic
Natural Gas Technical Analysis: Recovery stalls near significant trend-determination level
Natural Gas price is trading just below a key trend-determination level on longer-term charts. Although the commodity remains in a long-term downtrend since turning lower at the August 2022 peak, bearish momentum has tapered off considerably.
The Relative Strength Index (RSI) momentum indicator is converging bullishly with price on the weekly chart, something that occurs when price makes new lows but RSI does not.
A break above the last lower high of the long-term downtrend at $3.079 MMBtu would indicate a reversal in the broader downtrend.
-638237258617255695.png)
Natural Gas: Weekly Chart
Given this level has not been breached yet, however, the downtrend remains intact, and a break below the $2.110 year-to-date lows would provide a confirmation of a continuation down to a target at $1.546. This target is the 61.8% Fibonacci extension of the height of the roughly sideways consolidation range that has been unfolding during 2023 (marked 161.8% on charts).
On the daily chart, price has been climbing within a roughly sideways market, although it has broken above both the 50 and the 100-day Simple Moving Averages (SMA).
-638237259147690923.png)
Natural Gas: Daily Chart
Nevertheless, a break above the last lower high of the long-term downtrend at $3.079 MMBtu would be required to indicate a reversal in the broader trend.
Such a move might then see prices rally higher to the next key resistance level at the 200-week SMA, situated at $3.813.
Until that happens, however, price will probably continue to consolidate within its range.
Natural Gas FAQs
What fundamental factors drive the price of Natural Gas?
Supply and demand dynamics are a key factor influencing Natural Gas prices, and are themselves influenced by global economic growth, industrial activity, population growth, production levels, and inventories. The weather impacts Natural Gas prices because more Gas is used during cold winters and hot summers for heating and cooling. Competition from other energy sources impacts prices as consumers may switch to cheaper sources. Geopolitical events are factors as exemplified by the war in Ukraine. Government policies relating to extraction, transportation, and environmental issues also impact prices.
What are the main macroeconomic releases that impact on Natural Gas Prices?
The main economic release influencing Natural Gas prices is the weekly inventory bulletin from the Energy Information Administration (EIA), a US government agency that produces US gas market data. The EIA Gas bulletin usually comes out on Thursday at 14:30 GMT, a day after the EIA publishes its weekly Oil bulletin. Economic data from large consumers of Natural Gas can impact supply and demand, the largest of which include China, Germany and Japan. Natural Gas is primarily priced and traded in US Dollars, thus economic releases impacting the US Dollar are also factors.
How does the US Dollar influence Natural Gas prices?
The US Dollar is the world’s reserve currency and most commodities, including Natural Gas are priced and traded on international markets in US Dollars. As such, the value of the US Dollar is a factor in the price of Natural Gas, because if the Dollar strengthens it means less Dollars are required to buy the same volume of Gas (the price falls), and vice versa if USD strengthens.
Economists at Scotiabank analyze USD/CAD technical outlook.
Net gains on the week for the big Dollar will tilt technical risks somewhat higher
Short-term price trends in USD/CAD are flat but the USD has made progress on the week and, after last week’s stalling signal, net gains on the week for the big Dollar will tilt technical risks somewhat higher.
There remains some uncertainty around the technical outlook for the USD, however; late week gains in funds have held above 1.3240 and a break below that point today could still dump the USD back to the 1.32 area and blunt some of the positive price action that has developed on the longer run chart this week.
Resistance is 1.3275/80 and – firm – at 1.3315/25.
GBP/USD losses steady around 1.26 but needs to regain 1.2665 to strengthen, economists at Scotiabank report.
Cable is trying to carve out a base
Choppy price action in Cable in the past two sessions suggests that the Pound is trying to carve out a base.
GBP support around the 1.26 point has steadied losses and intraday gains so far today imply better demand is developing ahead of the weekend.
Gains through 1.2665 in the next day or so should see spot strengthen back toward the 1.2725 resistance.
S&P 500 may yet test resistance at 4,513/35, but analysts at Credit Suisse continue to look for a cap here.
Direct break above 4,535 to suggest we can see a further acceleration higher
We still see scope for a test of resistance next at 4,513/4,535 – the 78.6% retracement of the 2022 fall and late April 2022 high. We continue though to look for a fresh attempt to set a cap here for a consolidation/corrective phase, especially if a new high is not confirmed by weekly RSI momentum.
Below support at 4,350/28 is needed to ease the immediate upside bias to suggest a correction lower has already begun, with support then seen next at 4,261/41, and more importantly at the rising 63-day average, currently seen at 4,192. Only a close below here though would be seen to suggest a more important peak has been posted, for support next at 4,104.
A direct break above 4,535 though would suggest we can see a further acceleration higher with resistance seen next at the 4,636 March 2022 high, potentially even the 4,819 record high.
CAD slips on the week but GDP and BoC survey could provide support, economists at Scotiabank report.
Little or limited progress on inflation expectations will support the outlook for more tightening
Signs of resilient growth in the GDP report should be CAD-supportive, given the Bank’s concern about the economy running relatively hot. But the BOS will also likely have some sway in policymakers’ thinking.
Recent reports have pointed to slowing growth momentum but extremely resilient inflation expectations which reflect very little faith in the business community that price stability will be restored anytime soon. Little or limited progress on inflation expectations in the Q2 survey will also support the outlook for more tightening.
See – USD/CAD: Business Outlook Survey to provide a lift to the Loonie – ING
A second week of net losses for EUR/USD has pushed the pair back to retest the 40-Day Moving Average point at 1.0844 today. Economists at Scotiabank analyze the pair’s technical outlook.
Resistance seen at 1.0875/85
Short-term trend signals are EUR bearish but the daily DMI is flat and the weekly signal remains bullish. This is not obviously the set-up for a sustained EUR decline now. But a sustained push under the mid-108 area would point to weakness extending and a drop back towards key support at 1.0675/00.
Resistance is 1.0875/85 on the day.
USD is mixed on the day but broader gains extend ahead of price data. Economists at Scotiabank discuss the Dollar outlook.
Month and quarter-end portfolio rebalancing flows could still drive USD selling
Spreads have moved a little in the USD’s favour at the short-end of the curve but the DXY looks relatively fairly valued (based on its correlation with weighted 2-year yield differentials), suggesting limited scope for gains, absent significant new impulses from rates.
Firm PCE data could give the USD a lift but month and quarter-end portfolio rebalancing flows should have driven – and could still drive – USD selling, given US equity market outperformance.
Stocks are broadly firmer on the day and crude oil prices are a little stronger, implying a risk-friendly backdrop generally for investors.
See – US Core PCE Bank Expectations: Fed preferred inflation measure to make little progress
Economists at Wells Fargo now anticipate a broadly stable to slightly stronger Dollar over the remainder of 2023. They continue to forecast broad-based Dollar depreciation over the course of next year.
Subdued moves in the second half of 2023, but Dollar depreciation to resume in 2024
Given our expectation for a later and shallower US recession and later Fed easing, we expect later and more gradual depreciation of the US Dollar than previously.
We forecast the trade-weighted US Dollar to be little changed from current levels by the end of 2023, and to decline by 4.5% through 2024.
Economists at Crédit Agricole expect EUR/USD to experience downside pressure in the near term. However, the pair is set to recover toward 1.11 in the coming months.
Near term downside risks for EUR/USD
We see downside risks for EUR/USD from its current levels in the near term and project a recovery only going into Q4 2023. This near-term weakness is due to the positive impact from the widening of the EUR-USD 2-year rate spread being more than offset by wider peripheral spreads to Bunds and the falling EUR-USD box yields spread.
Beyond the near term, we expect EUR/USD to experience a gradual increase towards 1.11 over the next 6 to 12 months.
Copper (LME) is falling sharply again. Strategists at Credit Suisse analyze the metal outlook.
Initial resistance is seen at $8,477/79
With weekly MACD momentum trending lower and now negative we look for a more sustained decline to emerge and a more meaningful turn lower.
We look for a fall to test the $7,867 YTD low, a break of which would be seen to add further momentum to the sell-off for support next at $7,220 and eventually a test of the $6,955 low of last year.
Resistance is seen at $8,477/79 initially, with $8,712 now ideally capping.
Lower rates and disappointing economic data have resulted in a sharp depreciation of the Yuan. The accelerated pace of Yuan weakening lead economists at Rabobank to revisit their FX forecast.
Modest and gradual strengthening of the Yuan against the Dollar in Q4
We now expect USD/CNH to top around 7.30 during the third quarter in anticipation of worse-than-expected economic data.
During the last quarter of this year, we see a modest and gradual strengthening of the Yuan against the Dollar, bringing the currency pair back to 7.25, since we expect markets to price in Fed rate cuts for the second quarter of next year.
USD/CAD has completed a top to warn of a more significant turn lower, economists at Credit Suisse report.
Resistance at 1.3387 to cap to maintain the top
USD/CAD has broken key price support and the 38.2% retracement of the 2021/2022 uptrend at 1.3227/25 which in our view marks a top and important change of trend lower.
The current bounce is thus seen as temporary and corrective and we look for this to be followed by a fall back to 1.3116, then the 50% retracement and uptrend from 2021 at 1.2993/80. Whilst we would look for a floor to be found here, should weakness directly extend, we would see support next at 1.2760.
Resistance at 1.3387 ideally caps to maintain the top.
- The US Dollar rolls on after a very choppy trading day on Thursday.
- Friday’s focus is on PCE, the Fed’s preferred inflation metric .
- The US Dollar Index closed nearly at session’s high on Thursday and clings on to minor gains at 103.35.
The US Dollar (USD) is enjoying the inflow seen since Thursday after a very choppy trading session. Upside inflation surprises in European countries made the Euro outperform the Greenback for most part of the European session, while US Gross Domestic Product numbers wiped recession fears off the table and made the Greenback the flavor of the day again. Overnight, People’s Bank of China (PBoC), the Chinese central bank, issued again a much stronger fixing for its Yuan against the US Dollar, but markets are ignoring it in full, sending USD/CNY up to possibly set a new six-month high on Friday. There are no real trends to distillate on the quote board as the US Dollar posts modest gains against most currencies.
There aren’t any Federal Reserve (Fed) speaking on Friday, so traders can mainly go into data-trading. At 12:30 GMT, the Personal Consumption Expenditures (PCE) Price Index numbers will come out. This is the preferred inflation measure for Fed Chairman Jerome Powell to assess how or where inflation is at the moment in the US. Later, the Chicago Purchase Managers Index is due at 13:45 GMT, while at 14:00 GMT the final reading of the University of Michigan Consumer Sentiment Index for June will be released. Depending on their outcome, these two data points could support some more follow-through on the current trend in the US Dollar or trigger a turnaround.
Daily digest: US Dollar to see if strength is justified
- The US State department approved a possible military sale to Taiwan, adding tension against China after the earlier AI chip export curbs out of the US toward China. The sale would still need to pass several security checks and approvals before actually taking place.
- The Japanese Yen weakened to $145 for the first time since November and is at risk of a market intervention by the Japanese finance ministry.
- China’s PBoC fixed the USD/CNY at 7.2258, quite far below the expected 7.2485 from market consensus. Markets ignored the fixing and even sent USD/CNY completely the other way to peak at $7.27.
- The most expected market moving event for Friday is at 12:30 GMT, namely the Personal Consumption Expenditures Price Index data for May. The PCE Index on a monthly basis is expected to come in at 0.5%, accelerating from 0.4% in April. On a yearly basis, PCE inflation is expected to increase 4.6%, more than the 4.4% rise seen a month earlier. Both the monthly and yearly Core PCE are seen stable at 0.4% and 4.7%, respectively. . Any bigger jump in PCE, both Core or headline , would strengthen the US Dollar as it would increase the chances of more Fed hikes. Personal Income is expected to increase at a steady pace of 0.4%, while the Personal Spending is expected to decelerate significantly, from 0.8% to only 0.2%.
- At 13:45 GMT, Chicago Purchasing Managers Index for June is expected to head from 40.4 to 44. An uptick, though still below 50 and thus pointing to a contraction in the region’s business activity.
- Just 15 minutes later, at 14:00 GMT, the Michigan Consumer Sentiment Index for June will come out, which is expected to remain unchanged at 63.9. Participants for the survey had the opportunity as well to pencil in inflation expectations over the next year and for the next 5-to-10 years. Currently, the one-year inflation forecast is at 3.3%. An uptick or lower number could move the US Dollar in either direction.
- Equities are mixed, with minor gains and losses. In Asia, the Hang Seng is up 0.10% while the Japanese Topix closed down 0.33%. In Europe, the German DAX and the Stoxx 50 are mildly green. US Futures are mixed, with the Dow Jones Industrial below zero but the S&P 500 and Nasdaq futures registering mild gains.
- The CME Group FedWatch Tool shows that markets are pricing in a 86.8% chance of a 25 basis points (bps) interest-rate hike on July 26. The Fed hike is very much locked in as US GDP numbers showed that the US economy can whistand and endure some more rate hikes. Still, markets are reluctant to price in a second rate hike in the last meetings for 2023.
- The benchmark 10-year US Treasury bond yield trades at 3.85%.. The proof of the US economy being in good health made investors reduce their safe haven positions and pushed US yields higher.
US Dollar Index technical analysis: USD to end the week with a bang
The US Dollar trades overall very much in the green against the most common currencies, with one or two outliers. No real symmetry to be noticed either as we have seen the past week, when often Asia was weaker while currencies in Central and Eastern Europe were substantially stronger.. Expect for traders to keep their powder dry and see the US Dollar index reside where it is at the moment, near Thursday’s high at 103.40.
On the upside, look for 103.50 as the next key resistance level in order to lock in some solid support and a safe region where the Dollar index can take a breather before heading higher. The 200-day Simple Moving Average (SMA) at 104.98 is still quite far away. So the intermediary level to look for is the psychological level at 104.00 and May 31 peak at 104.70.
On the downside, the 55-day SMA near 102.67 is up for proving its reliability as a support after being chopped up that much in the last two weeks. A touch lower, 102.50 will be vital to hold from a psychological point of view. In case the DXY slips below 102.50, more weakness is expected with a full slide to 102.00 and a retest of June’s low at 101.92.
What is US Dollar Index (DXY)?
The US Dollar Index, also known as DXY or USDX, is a benchmark index that was established by the US Federal Reserve in 1973. DXY is widely used as a tool measuring the US Dollar (USD) value in global markets. The index is calculated by measuring the US Dollar’s performance against a basket of six foreign currencies, the Euro, the Japanese Yen (JPY), Swedish Krona (SEK), the British Pound (GBP), the Swiss Franc (CHF) and the Canadian Dollar (CAD).
With 57.6%, the Euro has the biggest weight in the index followed by the JPY (13.6%), GBP (11.9%), CAD (9.1%), SEK (4.2%), and CHF (3.6%). Hence, a sharp decline in the EUR/USD pair could help the US Dollar Index rise even if the US Dollar weakens against some of the other currencies in the basket.
The gold price has shed $150 as compared with its early-May high and is trading at a new three-month low of around $1,900. Economists at Commerzbank discuss XAU/USD outlook.
Gold ETFs have seen increasing outflows since the end of May
It is above all the ETF investors, who had only just begun returning tentatively to the market, that are now already on the retreat again. Gold ETFs have seen increasing outflows since the end of May.
The prospect of higher US interest rates and a reversal of the Fed’s policy likely to be pushed further into the future have dampened interest in Gold as a non-interest-bearing investment.
Against this backdrop, Gold could again dip below the $1,900 mark in the short term. Gold should regain ground as soon as a turnaround in interest rate policy is on the cards, however.
In the United States and the Eurozone, economies are protected against the risk of recession by several mechanisms. The risk of persistently high inflation is therefore greater than the risk of recession, analysts at Natixis report.
The US and Eurozone are actually protected against the risk of recession
Many mechanisms are protecting the US and the Eurozone against the risk of recession: strong job creation, high corporate profitability, the fall in the household savings rate in the United States, government programmes to support investment and the energy transition.
As a result, the major risk in the US and the Eurozone is not the risk of recession, but the risk of persistently high inflation, caused by the tightness of the labour market, which is rapidly pushing up wages, and by the lack of productivity gains.
Dollar strength emerged across the board yesterday. It is hard to argue with the strong Dollar, economists at ING report.
Strong data goes head-to-head with rebalancing flows
May's core PCE deflator is expected at a firm 0.3-0.4% MoM, consistent with the Fed's view that core inflation is not falling quickly enough. That should keep US rates and the Dollar firm.
The challenge today will be month and quarter-end portfolio rebalancing flows. The outperformance of US equity benchmarks over the last month and quarter could generate some Dollar selling. We prefer to see rebalancing as more of a risk to a preferred view that the Dollar stays strong given what seems a clear macro story.
DXY could edge up to the 103.65 area unless fixing flows take their toll.
See – US Core PCE Bank Expectations: Fed preferred inflation measure to make little progress
- EUR/USD drifts lower for the third straight day and drops to over a two-week low on Friday.
- The softer Euro Zone consumer inflation figures fail to impress the Euro bulls or lend support.
- The USD hits a fresh three-week high and contributes to the slide ahead of the US inflation data.
The EUR/USD pair attracts fresh sellers following a modest intraday uptick to the 1.0875 region on Friday and turns lower for the third successive day. Spot prices drop to over a two-week low following the release of the Euro Zone consumer inflation figures and trade around the 1.0840-1.0835 region during the early part of the European session.
The preliminary report published by Eurostat showed that the annual Euro Zone Harmonised Index of Consumer Prices (HICP) climbed 0.3% in June as compared to a flat reading anticipated. This, however, was offset by a sharp deceleration in the yearly rate to 5.5% from 6.1% in the previous month. Adding to this, the Core HICP rose by 0.3% MoM and edged higher to 5.4% on a yearly basis, missing consensus estimates. The data reaffirms bets for another 25 bps lift-off by the European Central Bank (ECB) in July, albeit fails to impress the Euro bulls or lend any support to the EUR/USD pair in the wake of worries about economic headwinds stemming from rising borrowing costs.
The US Dollar (USD), on the other hand, hits a fresh three-week high and remains supported by the Federal Reserve's (Fed) hawkish outlook, signalling that interest rates may still need to rise as much as 50 bps by the end of this year. The outlook was reinforced by the upbeat US macro data released on Thursday and Fed Chair Jerome Powell's hawkish remarks earlier this week. This, in turn, continues to push the US Treasury bond yields higher, which, in turn, underpins the USD and further contributes to the offered tone surrounding the EUR/USD pair.
With the latest leg down, spot prices have dropped nearly 150 pips from the weekly high touched on Tuesday and moved back closer to the 100-day Simple Moving Average (SMA). Any further decline, however, seems limited as traders now seem to wait on the sidelines ahead of the release of the US Core PCE Price Index - the Fed's preferred inflation gauge - due later during the early North American session. The crucial data should influence the USD price dynamics and provide some meaningful impetus to the EUR/USD pair on the last day of the week.
Technical levels to watch
EUR/USD strength has stalled at the 78.6% retracement of the April/May fall at 1.0998. Economists at Credit Suisse analyze the pair’s outlook.
Close below 1.0585/1.0501 would see an important top established
We already hold a negative outlook for EUR/USD and are looking for resistance at 1.0998 to ideally cap for a test and then break of the uptrend from last September at 1.0766. This would then be seen to clear the way for a fall back to the 1.0634 late May low, then medium-term support, starting at 1.0585 and stretching down to 1.0501: the 200-DMA, March low, the lower end of the uptrend channel from the beginning of the year, and the 38.2% retracement of the 2022/2023 uptrend.
Whilst this key support should continue to be respected, a break lower would indeed see a major top established, clearing the way for a more sustained decline with support then seen initially at 1.0317 ahead of 1.0133.
The Canadian Dollar has been one of the better G10 performers this year. Economists at ING analyze CAD outlook ahead of the release of the quarterly Business Outlook Survey.
CAD to continue to perform well – as should the Mexican Peso
One important input into the BoC's decision will be today's release of the quarterly Business Outlook Survey. This will help the BoC better understand both business inflation expectations but also the environment for corporates to be able to push higher prices onto consumers. With Canada's unemployment rate still relatively low by historical standards, corporates may still see opportunities to push on higher prices or restore profit margins. Let's see.
In general, we expect the Canadian Dollar to continue to perform well (as should the Mexican Peso) and today's outlook survey could help to see the Canadian Dollar withstand US Dollar strength better than some.
- Gold price fails to build on the overnight bounce and comes under fresh selling pressure on Friday.
- Hawkish central banks, along with a bullish US Dollar, continue to act as a headwind for the metal.
- Investors now look to the US Core PCE Price Index to determine the next leg of a directional move.
Gold price meets with a fresh supply on the last day of the week and extends its steady intraday descent through the early part of the European session. The XAU/USD currently trades around the $1,900 round-figure mark, down nearly 0.40% for the day, and remains well within the striking distance of its lowest level since mid-March touched on Thursday.
A more hawkish stance adopted by major central banks and the prospects for further rate increases continue to act as a headwind for the non-yielding Gold price. Apart from this, the emergence of fresh US Dollar buying turns out to be another factor driving flows away from the XAU/USD. In fact, the USD Index (DXY), which tracks the Greenback against a basket of currencies, climbs to a fresh two-and-half-week high in the last hour and continues to draw support from expectations for further policy tightening by the Federal Reserve (Fed).
It is worth recalling that the US central bank had signalled that borrowing costs may still need to rise as much as 50 bps by the end of this year. Adding to this, the upbeat US macro data released on Thursday reaffirmed market bets for a 25 bps lift-off at the next FOMC policy meeting on July 25-26. Furthermore, Fed Chair Jerome Powell said earlier this week that he does not see inflation coming down to the Fed's 2% target until 2025. This, in turn, continues to push the US Treasury bond yields higher and lends support to the USD.
It, however, remains to be seen if the USD bulls can maintain their dominant position or opt to take some profits off the table ahead of the release of the US Core PCE Price Index - the Fed's preferred inflation gauge. The crucial data is due later during the early North American session and influence expectations about the future rate-hike path. This, in turn, will drive the USD demand and provide a fresh directional impetus to Gold price, which seems poised to end the quarter in the negative territory for the first time since September 2022.
Technical levels to watch
Economists at Nordea still expect EUR/NOK to trade around 12.00 during the summer.
Continuing on a bumpy ride
The volatile and bumpy ride in NOK is likely to continue in the short term and we see EUR/NOK trading around 12.00 during the summer.
While we remain bearish on the NOK in the short-term, we believe that NOK will be less weak towards year-end than during the summer (we see EUR/NOK around 11.50 at end-2023). One reason for our view is that gas prices are likely to rise during autumn/winter, implying higher NOK purchases from oil companies.
- AUD/USD gains positive traction for the second straight day, though lacks follow-through.
- Economic woes continue to act as a headwind for the risk-sensitive Aussie amid a bullish USD.
- Investors now look forward to the US Core PCE Price Index for some meaningful impetus.
The AUD/USD pair attracts some intraday buying near the 0.6600 round-figure mark, albeit struggles to capitalize on the move and retreats a few pips from the daily peak. Spot prices currently trade around the 0.6620-0.6625 region, up less than 0.15% for the day, and remain well within the striking distance of a nearly four-week low touched on Thursday.
Investors remain worried about economic headwinds stemming from rapidly rising borrowing costs and the fears were further fueled by rather unimpressive Chinese macro data. In fact, the official Chinese Manufacturing PMI improved slightly to 49 for June, from 48.8 previous, though remained in contraction territory for the third straight month. Meanwhile, the gauge for the services sector surpassed consensus estimates and came in at 53.2 for the reported month, though was lower than the 54.5 recorded in May. This, in turn, acts as a headwind for the China-proxy Aussie and caps the AUD/USD pair.
The Australian Dollar (AUD) is further undermined by expectations that the Reserve Bank of Australia (RBA) will refrain from hiking interest rates in July. The bets were lifted by softer domestic data released on Wednesday, which showed that consumer inflation slowed to a 13-month low in May. The US Dollar (USD), on the other hand, stands tall near its highest level since June 13 and remains well supported by the Federal Reserve's (Fed) hawkish outlook. This, along with the upbeat US macro data released on Thursday, reaffirmed market bets for a 25-bps lift-off at the next FOMC meeting on July 25-26.
The prospects for further policy tightening by the US central bank remain supportive of a further rise in the US Treasury bond yields and continue to lend support to the USD. Market participants, however, seem reluctant to place aggressive bets and prefer to wait for the release of the US PCE Price Index, which will play a key role in influencing expectations about the Fed's future rate hike path. This, in turn, will drive the USD demand and provide a fresh directional impetus to the AUD/USD pair. Nevertheless, spot prices remain on track to register losses for the second successive week.
Technical levels to watch
The US Dollar advanced yesterday and has stabilised today. For the Fed, the PCE inflation data today will be one key piece of info. Economists at MUFG Bank how the figures could impact FX market.
Key data still to come
A stronger inflation print would certainly further increase pricing of a 25 bps hike on 26th July although with NFP next week, we would not expect a substantial shift in rate hike expectations. The market is currently priced at about an 85% probability of a 25 bps hike – so there is limited further scope for yields from here in pricing fully a 25 bps hike next month. The FX fallout will likely also be limited given the German inflation data yesterday saw the harmonised rate rebound from 6.3% YoY to 6.8%.
The US Dollar performance is likely to remain more mixed from here consistent with its performance through the first half of the year.
Near-term there are downside risks for EUR/USD but an active ECB and higher core inflation through the summer should provide support.
See – US Core PCE Bank Expectations: Fed preferred inflation measure to make little progress
June was almost a mirror image of May’s price action as EUR/USD recouped the majority of the losses it suffered during the prior month. Economists at Rabobank analyze the pair’s outlook.
Upside for EUR/USD is likely to be capped at this juncture
We expect another 25 bps hike from the ECB in July, but that is largely in the price, and with EUR/USD pushing back up towards the 1.10 handle, we think upside for the pair is likely to be capped at this juncture.
Our forecast is for EUR/USD to trade down through support at the 50-Day Moving Average (DMA) at 1.0875 and the 100-DMA at 1.0816 to an area of heavy price congestion around the 1.07 handle.
Japan Chief Cabinet Secretary, Hirokazu Matsuno, said on Friday, “closely watching FX moves with a high sense of urgency.”
Additional quotes
Important for exchange rate to move stably, reflecting economic fundamentals.
Sharp, one-sided moves are seen recently.
To take appropriate steps on excessive FX moves.
Market reaction
At the time of writing, USD/JPY is keeping its corrective decline intact at around 144.85, up 0.05% on the day.
Economists at ING analyze GBP outlook.
Sterling must be enjoying support from implied short-dated yields over 5%
Sterling is consolidating and must be enjoying support from implied short-dated yields over 5%. We made the point last week that the FX hedging costs were now very painful for foreign investors in the UK Gilt market – a factor that could help Sterling.
There is little on the UK calendar today, so strong US data could briefly tip GBP/USD back to the 1.2550 area, where we expect it to find support.
- USD/JPY eases after hitting a fresh YTD low, though the downside remains cushioned.
- The BoJ-Fed policy divergence is seen as a key factor that continues to act as a tailwind.
- Intervention fears hold back bulls from placing fresh bets ahead of the US PCE Price Index.
The USD/JPY pair finds some support near the 144.45 area and stalls its intraday retracement slide from its highest level since November 2022 touched this Friday. Spot prices currently trade around 144.55-144.60 region, nearly unchanged for the day, and seems poised to prolong its recent well-established uptrend witnessed over the past three weeks or so.
An intraday uptick beyond the 145.00 psychological mark fueled speculations about a potential intervention by Japanese authorities and turns out to be a key factor that forced investors to lighten their bullish bets around the USD/JPY pair. Moreover, Japan's Finance Minister Shunichi Suzuki said that the government will take appropriate steps should the Japanese Yen (JPY) weaken excessively. This, along with the prevalent cautious market mood, lends some support to the JPY and acts as a headwind for the major.
Investors' remain worried about economic headwinds stemming from rapidly rising borrowing costs and the concerns were further fueled by rather unimpressive Chinese macro data. In fact, the official Chinese Manufacturing PMI improved slightly to 49 for June, from 48.8 previous, though remained in contraction territory for the third straight month. Meanwhile, the gauge for the services sector surpassed consensus estimates and came in at 53.2 for the reported month, though was lower than the 54.5 recorded in May.
Apart from this, subdued US Dollar (USD) price action keeps a lid on the USD/JPY pair, though any meaningful corrective slide remains elusive in the wake of the dovish stance adopted by the Bank of Japan (BoJ). In fact, market participants seem convinced that BoJ's negative interest-rate policy will remain in place at least until next year. Moreover, BoJ Governor Kazuo Ueda recently ruled out the possibility of any change in ultra-loose policy settings and signalled no immediate plans to alter the yield curve control measures.
This marks a big divergence in comparion to the Federal Reserve's (Fed) hawkish outlook, siganlling that borrowing costs may still need to rise as much as 50 bps by the end of this year. Adding to this, Thursday's upbeat US macro data all but cemented beets for a 25 bps rate hike at the July FOMC meeting. This, in turn, pushes the US Treasury bond yields higher, which favours the USD bulls and supports prospects for additional gains for the USD/JPY pair. Traders, however, seem reluctant ahead of the release of the US PCE Price Index.
The Fed's preferred inflation gauge - the Core PCE - will play a key role in influencing market expectations about the future rate-hike path. This, in turn, should help investors to determine the near-term trajectory for the Greenback and provide some meaningful impetus to the USD/JPY pair later during the early North American session. Nevertheless, spot prices remain on track to register gains for the third straight week. Moreover, the aforementioned fundamental backdrop suggests that the path least resistance is to the upside.
Technical levels to watch
The aggressive move higher in USD/CNY is approaching key resistance from its 2022 high at 7.3274. Economists at Credit Suisse analyze the pair’s outlook.
Risk for further equity weakness
The aggressive uptrend in USD/CNY is now seen within touching distance of the key notable high of 2022 at 7.3274. Whilst we think this should be respected and we would be alert to a potential reversal lower from here, should strength directly extend, we would not see the next meaningful technical resistance until 7.47/7.50.
We would note that a higher USD/CNY (weaker CNY) is typically associated with a weaker equity market, reinforcing the existing top we now see in the Shanghai Composite.
Economists at ING analyze EUR outlook and say that the EUR/USD could fall back to the 1.0825/45 area today.
Not the best environment for the pro-cyclical Euro
With yield curves still heavily inverted around the world and the Chinese economy continuing to misfire, this is not the best environment for the pro-cyclical Euro.
EUR/USD can drift back towards the 1.0825/45 area on the day and it is increasingly looking as though we could see a 1.07-1.10 range for a large part of the third quarter this year.
USD/JPY is at 145. Economists at Commerzbank analyze how the MOF (the Ministry of Finance) could stop the Yen sell-off.
No institution in the world has as much experience with interventions as the MOF
No institution in the world has as much experience with interventions as the MOF. However, their intervention experience mainly consists of preventing an excessively fast JPY appreciation, i.e. weakening the Yen artificially. This experience is of little use in the current situation when it is about strengthening the Yen artificially. Because all FX reserves are finite this issue is infinitely more difficult to solve than the one in which the MOF’s expertise lies.
One can only hope that the MOF officials are aware of this and do not overestimate their abilities.
The GBP/USD uptrend is losing momentum and analysts at Credit Suisse do not look to chase strength aggressively.
Test of the March/April 2022 lows at 1.2973/1.3000 not ruled out
Although GBP/USD has broken key resistance from its confirmed downtrend from June 2021 the move to a new high has not been confirmed by weekly RSI momentum and we are wary of chasing strength aggressively further from here. Saying this though, we would still not rule out a test of the March/April 2022 lows at 1.2973/1.3000 but our bias would be to then look for a cap here.
Support is seen at the back of the broken downtrend, potential uptrend from last September and 55-DMA at 1.2580/30, which we look to ideally hold. A closing break lower though would be seen to reinforce the negative momentum backdrop, exposing support next at 1.2310.
- Personal Consumption Expenditures Price Index is expected to rise 4.6% on a yearly basis in May.
- Federal Reserve remains on track to return to a 25 basis points rate hike in July.
- US Dollar could gather strength against its rivals in case core PCE inflation remains hot.
The Core Personal Consumption Expenditures (PCE) Price Index report for May, the Federal Reserve’s (Fed) preferred inflation gauge, will be unveiled by the Bureau of Economic Analysis (BEA) on Friday, June 30 at 12:30 GMT.
How will the Federal Reserve read the PCE inflation report?
The PCE Price Index is forecast to rise 4.6% on a yearly basis in May, slightly stronger than the 4.4% increase recorded in April. The Core PCE Price Index, which excludes volatile food and energy prices, is expected to hold steady at 4.7% with a monthly increase of 0.4%.
The Federal Reserve (Fed) left its policy rate unchanged at the 5%-5.25% range following the June policy meeting. During the post-meeting press conference, FOMC Chairman Jerome Powell explained that the pause in rate hikes did not necessarily mean that they have reached the terminal rate. In fact, the revised Summary of Economic Projections, the so-called dot plot, revealed that the interest rate projection for end-2023 got revised higher to 5.6% from 5.1% in March, implying two more 25 basis points (bps) rate hikes this year.
While speaking at a policy panel at the European Central Bank Forum on Central Banking this week, Powell reiterated that a strong majority of Fed policymakers expected two or more rate increases this year and said that strong labor market conditions would allow them to continue to tighten the policy.
Currently, the CME Group FedWatch Tool shows that markets are pricing in a more than 80% chance of the Fed lifting the interest rate by 25 bps to 5.25%-5.5% in July. The probability of the policy rate reaching the 5.5%-5.75% range by December, however, is less than 30%.
The market positioning suggests that there is potential for the US Dollar (USD) to continue to gather strength on a hot PCE inflation report. Investors will likely pay close attention to the monthly Core PCE Price Index, since it is not distorted by base effects. A reading at or above 0.5% should increase the odds of two more 25 bps Fed rate hikes in the second half of 2023 and provide a boost to the USD. On the other hand, a soft print of 0.2% or lower should make it difficult for the US Dollar to stay resilient against its rivals ahead of the weekend.
When will the Personal Consumption Expenditures Price Index be released and how could it affect EUR/USD?
The PCE inflation report is scheduled for release at 12:30 GMT, on June 30. Previewing this publication, “the Federal Reserve watches PCE – so financial markets also examine it closely. The higher it goes, the greater the chance for further rate hikes and thus a stronger US Dollar. The Greenback would lose value against its peers on a lower read,” said FXStreet Analyst Yohay Elam.
EUR/USD gathered bullish momentum in June and climbed above 1.1000 before going into a consolidation phase. FXStreet Analyst Eren Sengezer offers a brief technical outlook for the pair and explains:
“Following EUR/USD lackluster performance this week, the Relative Strength Index (RSI) indicator on the daily chart declined to 50, highlighting a buildup of bearish momentum. Additionally, the pair was last seen trading near the 20- and the 50-day Simple Moving Averages (SMA) after having closed the last 10 trading days above those levels”
Eren also highlights the important technical levels for EUR/USD: “In case the pair turns south on a strong PCE inflation report, a daily close below 1.0850 (50-day SMA, 20-day SMA) could attract sellers. In that case, additional losses toward 1.0800 (psychological level, 100-day SMA) and 1.0700 (end-point of May-June downtrend) could be witnessed.”
“On the upside, 1.1000 (static level, psychological level) aligns as strong resistance before 1.1060 (end-point of March-May uptrend) and 1.1100 (2023-high).”
PCE inflation related content
- US Dollar Index: DXY depicts pre-data anxiety near 13-day top above 103.00, Fed inflation gauge eyed
- EUR/USD Price Analysis: Euro again bounces off 50-EMA as EU/US inflation figures loom
- Atlanta Federal Reserve Bank President Bostic: Inflation has fallen
About the Core Personal Consumption Expenditures Price Index
The Core Personal Consumption Expenditures released by the US Bureau of Economic Analysis is an average amount of money that consumers spend in a month. "Core" excludes seasonally volatile products such as food and energy in order to capture an accurate calculation of the expenditure. It is a significant indicator of inflation. A high reading is bullish for the USD, while a low reading is bearish.
Economists at Goldman Sachs have updated their EUR/USD forecasts.
Long position in EUR/SEK to hedge against potential inflationary pressures and higher interest rates
We adjust our projections for EUR/USD to 1.07, 1.10, and 1.12 in three, six and 12 months respectively, up from our previous estimates of 1.05, 1.05, and 1.10. The updated forecasts maintain a year-end expectation of 1.10 but indicate less downside in the short term and a more extended recovery of the Euro relative to the US Dollar beyond the peak.
We reiterate our recommendation for investors to take a long position in EUR/SEK with a target of 12.00. We believe that Sweden faces a more challenging trade-off due to its economy's higher sensitivity to policy rates and particular exposure to the manufacturing sector. This position is seen as a way for investors to protect against the possibility of persistently high inflation and elevated interest rates.
- USD/CAD picks up bids to refresh intraday high, reverses the previous day’s retreat from two-week top.
- Sustained trading beyond 1.3200 support confluence, strongest bullish MACD signals in a month favor Loonie pair buyers.
- 21-DMA, previous support line will challenge bulls amid steady RSI.
USD/CAD renews its intraday high near 1.3265 as the US Dollar picks up bids amid the early hours of Friday’s European session.
In doing so, the Loonie pair reverses the previous day’s U-turn from the highest levels in a fortnight. It should be noted that the quote marked the failure to cross the 21-DMA hurdle.
Hence, the latest recovery eyes another battle with the stated immediate DMA hurdle surrounding 1.3280.
It’s worth observing that the steady RSI (14) line and the MACD indicator’s strongest bullish signals since late May underpin hopes of the USD/CAD pair’s advances past the 21-DMA resistance of 1.3280.
In that case, the previous support line stretched from early February, close to 1.3350 at the latest, will be crucial to watch.
Should the Loonie pair manage to stay firmer past 1.3350, the bulls will retake control.
On the contrary, a convergence of the 10-DMA and previous resistance line from June 05, close to the 1.3200 round figure, puts a floor under the USD/CAD price for intraday.
Following that, the yearly low marked on Tuesday around 1.3115 and the 1.3000 round figure will be in the spotlight.
While the technical details are mostly favoring the Loonie pair buyers, it all depends upon today’s US Core Personal Consumption Expenditure (PCE) Price Index for May, also known as the Federal Reserve’s (Fed) favorite inflation gauge.
Also read: US PCE Preview: Three ways this inflation gauge impacts your income and summer plans
USD/CAD: Daily chart
Trend: Limited upside expected
The PBoC has started to become more concerned about Yuan’s weakness. However, CNY is set to remain under pressure, economists at Commerzbank report.
FX policy moves are unlikely to alter the Yuan’s weakening trend
PBoC may continue to tweak the daily fixing to manage expectations and ease one-sided depreciation pressure day-to-day, especially if the Yuan weakens abruptly. The central bank has other policy tools to stem the pressure on Yuan, such as cutting the reserve requirement ratio for foreign-currency deposits and increasing the cost for traders looking to short the Yuan. Nonetheless, FX policy moves are unlikely to alter the Yuan’s weakening trend.
We may need to see additional macro policy stimulus being rolled out and an improvement in economic fundamentals to halt or reverse CNY’s downside pressure.
Here is what you need to know on Friday, June 30:
June inflation data from the Eurozone and the Personal Consumption Expenditures (PCE) Price Index, the Fed's preferred gauge of inflation, readings from the US will be watched closely by market participants ahead of the weekend. Since this Friday will be the last trading day of June and the second quarter, position adjustments later in the day could ramp up volatility and trigger wild fluctuations.
Eurozone Inflation Release: Mixed expectations should keep the Euro supported.
During the Asian trading hours, NBS Manufacturing PMI in China improved slightly to 49 in June from 48.8 in May. The Non-Manufacturing PMI edged lower to 53.2 from 54.5 in the same period but came in much higher than the market expectation of 50.8. Risk mood appears to be holding neutral in the European morning with US stock index futures trading virtually unchanged on the day. Meanwhile, the US Dollar Index consolidates weekly gains slightly below 103.50 and the benchmark 10-year US Treasury bond yield holds comfortably above 3.8% following Thursday's upsurge.
The US Bureau of Economic Analysis revised the annualized Gross Domestic Product (GDP) growth for the first quarter higher to 2% from 1.3% in the previous estimate. Additionally, weekly Initial Jobless Claims in the US declined sharply to 239,000 from 265,000. These upbeat data releases provided a boost to the US Dollar (USD) in the American session on Thursday.
On Thursday, Germany's Destatis reported that the annual Consumer Price Index (CPI) climbed to 6.4% in June from 6.1% in May. Although the Euro gathered strength against its rivals with the initial reaction to hot German inflation data, EUR/USD failed to keep its footing. Pressured by the broad USD strength, EUR/USD closed deep in negative territory and was last seen trading a few pips above 1.0850.
GBP/USD dropped below 1.2600 for the first time in two weeks on Thursday before staging a technical correction. Early Friday, the pair trades within a touching distance of 1.2600. The UK's Office for National Statistics reported earlier that the GDP grew at an annual rate of 0.2% in the first quarter, matching the previous estimate and the market expectation.
USD/JPY extended its rally to a fresh multi-month high above 145.00. The data from Japan revealed early Friday that the Tokyo Consumer Price Index rose 3.1% on a yearly basis in June, much lower than the market expectation of 3.8%. On a negative note, Industrial Production contracted 1.6% MoM in May.
Gold price fell sharply in the American session on Thursday and touched its lowest level since March at $1,893. Although XAU/USD managed to quickly erase those losses and stabilize above $1,900, it is finding it difficult to gain traction early Friday.
Bitcoin continues to fluctuate in its week-old range above $30,000. Following Wednesday's sharp decline, Ethereum registered small daily gains on Thursday. ETH/USD holds its ground and extends its recovery toward $1,900 early Friday.
- EUR/USD takes offers to refresh weekly low, mildly offered of late.
- Germany’s Retail Sales rose but Import Price Index appears mixed for May.
- US Dollar regains upside momentum as markets become active after lackluster Asian session.
- Eurozone, HICP, CPI and US Core PCE Price Index will be crucial considering hawkish ECB, Fed.
EUR/USD renews weekly bottom around 1.0850 as it prints a three-day downtrend despite upbeat German Retail Sales. That said, the Euro pair’s latest fall could also be linked to the US Dollar’s broad recovery amid the early hours of Friday’s European session.
German Retail Sales improved to -3.6% YoY in May versus -4.3% expected and prior readings whereas the monthly figure also rose past 0.0% expected to 0.4% figure, compared to 0.8% previous readings. However, the Import Price Index flash mixed signals as it improves on MoM to -1.4% but deteriorates to -9.1% on YoY.
It’s worth noting that the Western market’s active performance and the previous day’s hawkish comments from Fed Chair Jerome Powell, as well as from Atlanta Federal Reserve President Raphael Bostic, also seem to drown the EUR/USD bears. Additionally, upbeat prints of the US Gross Domestic Product (GDP) Annualized and the Weekly Initial Jobless Claims exert additional downside pressure on the Euro prices.
On the other hand, fears that European leaders will carve out China de-risk strategy and also prepare for the risks to the bloc emanating from Brexit also seem to weigh on the EUR/USD.
Earlier in the week, Eurozone sentiment figures deteriorated and the German inflation clues firmed but the European Central Bank (ECB) officials stays hawkish, at least for July.
Amid these plays, yields rebound and the S&P500 Futures fade the early-day gains.
Moving on, the first readings of Eurozone HICP and Consumer Price Index (CPI) inflation numbers for June will precede the US Core PCE Price Index for May to entertain the EUR/USD pair traders.
Also read: US PCE Preview: Three ways this inflation gauge impacts your income and summer plans
Technical analysis
EUR/USD bears need validation from the 50-Exponential Moving Average (EMA) support of around 1.0850, failing to break the same could trigger a corrective bounce toward a one-week-old descending resistance line, around 1.0940 at the latest.
The Kiwi has struggled this week against the USD and even more so EUR and GBP. Economists at ANZ Bank discuss the NZD outlook.
AUD will be key again as we head into the RBA meeting on Tuesday
US data has been impressive and may keep the USD elevated for longer than many are forecasting, but as yesterday’s ANZBO survey showed, confidence is recovering here too, so the outlook for the Kiwi is very nuanced.
But if the thinking around the RBNZ starts to change and the AUD reacts positively to an RBA hike next week (7 of 13 analysts expect a hike, including ANZ), the worst may be behind it. Either way, FX remains a global, rather than local story.
RBI permits range of USD/INR 81-83. Economists at Credit Suisse expect the existing intervention range to continue in Q3.
RBI still tightly managing USD/INR trading range
Although exports have cooled, strong PMI data in May (manufacturing 58.7, services 61.2) showed that Indian business activity remains firmly in expansion, pointing to continued high real GDP growth of around 7%. This favorable growth outlook, along with more balanced trade flows, should keep USD/INR in a range of 81.00-83.00 during Q3.
Continued USD strength could push the RBI to revise the intervention range higher. However, given that the 83.00 level has held since Oct (when EUR/USD was below parity), we think RBI can continue to enforce this 81.00-83.00 range without worrying about trade-weighted Rupee strength.
- GBP/USD retreats from intraday high, extends bounce off fortnight low while snapping two-day downtrend.
- Final reading of UK Q1 GDP confirms 0.1% QoQ, 0.2% YoY figures.
- Hawkish Fed statements jostle with mixed BoE talks to keep Cable bears hopeful.
- US Dollar pares weekly gains ahead of Fed’s preferred inflation gauge amid cautious optimism.
GBP/USD reverses from intraday high while paring the first daily gains in three around 1.2620 amid early Friday morning in London. In doing so, the Pound Sterling fails to justify the unimpressive UK Gross Domestic Product (GDP) data while portraying the cautious mood ahead of the key US inflation clues.
Final readings of the UK’s first quarter (Q1) 2023 GDP matches 0.1% QoQ and 0.2% YoY forecasts, per the latest readings.
Earlier in the day, Lloyds Banking Group Plc came out with the upbeat details of the UK business confidence survey as the sentiment index rose to a 13-month high in June. “Lloyds’ Business Barometer showed optimism increasing 9 percentage points to 37%, rebounding from a dip in May. Executives said they were more confident about their own trading prospects and the wider,” said Bloomberg.
On the same line, a jump in the UK’s car production also puts a floor under the GBP/USD price. “The Society of Motor Manufacturers and Traders (SMMT) said on Friday a total of 79,046 cars rolled out of factory gates in the UK last month, an increase of nearly 27% year-over-year. That is still 31.9% lower than the 2019 output levels,” reported Reuters.
Late on Thursday, Bank of England´s monetary policymaker Silvana Tenreyro crossed wires via Reuters while saying, “The more BoE hikes now, the sooner and faster the BoE will later need to cut rates.” Her comments were in contrast with the hawkish Fed talks and dragged the Pound sterling towards refreshing the multi-day low.
That said, Fed Chair Jerome Powell advocated for two more rate hikes in 2023 while Atlanta Federal Reserve President Raphael Bostic flashed mixed signals but stayed hawkish overall.
Apart from the comparatively more hawkish Fed talks, the upbeat US data also raise doubts about the GBP/USD pair’s latest run-up. That said, the final readings of the Gross Domestic Product (GDP) Annualized, mostly known as the Real GDP, grew at the 2.0% rate for the first quarter (Q1) of 2023 versus the 1.3% initial estimation. Further, the US Weekly Initial Jobless Claims slumped to 239K for the week ended on June 23 compared to 265K expected and revised prior. However, the Personal Consumption Expenditure (PCE) Price for Q1 2023 eased to 4.1% QoQ from 4.2% expected and prior whereas the Pending Home Sales slumped to -2.7% MoM for May compared to 0.2% expected and -0.4% prior (revised).
Having witnessed the initial market reaction to the UK data, the GBP/USD pair traders await the US Core Personal Consumption Expenditure (PCE) Price Index for May, also known as the Federal Reserve’s (Fed) favorite inflation gauge. That said, the key inflation gauge is likely to remain static at 0.4% MoM and 4.7% YoY, which in turn may allow the Fed to keep its hawkish bias and recall the GBP/USD bears.
Technical analysis
Despite the latest corrective bounce, the GBP/USD pair’s the midweek’s downside break of the key horizontal support, now resistance around 1.2670-90, as well as the bearish MACD signals, keeps the sellers hopeful unless the quote jumps back beyond 1.2690 and cross the 1.2700 threshold.
Hence, the GBP/USD pair is likely to grind lower and suggests a battle with the ascending support line from March 08, around 1.2565, to be imminent.
The UK economy grew 0.1% on the quarter in the first three months of 2023 vs. 0.1% prior, the final revision confirmed on Friday. The market had expected an expansion of 0.1% in the first quarter.
Britain’s annual GDP expanded by 0.2% in Q1 vs. the first readout of 0.2% while matching 0.2% expectations.
Meanwhile, the UK Q1 Current Account arrived at £-10.757B, compared with the £-8.5B expectations and the fourth quarter’s £-2.483B.
The country’s Total Business Investment data for Q1 came in at 3.3% QoQ and 5.8% YoY.
FX implications
GBP/USD remains uninspired by the UK economic data. The pair was last seen trading at 1.2622, up 0.10% on the day.
About the UK GDP
The Gross Domestic Product released by the Office for National Statistics is a measure of the total value of all goods and services produced by the UK. The GDP is considered a broad measure of the UK's economic activity. Generally speaking, a rising trend has a positive effect on the GBP, while a falling trend is seen as negative (or bearish).
- USD/CHF pares weekly gains amid pre-data anxiety, stays above the key support lines.
- 200-SMA, monthly resistance line challenge buyers even as MACD prints bullish signals.
- Sellers need validation from 0.8900 to retake control.
- Swiss Real Retail Sales, US Core PCE Price Index eyed for clear directions.
USD/CHF takes offers to refresh intraday low near 0.8980 as it consolidates the weekly gains, the second one in a row, heading into Friday’s European session. In doing so, the Swiss Franc (CHF) pair portrays the market’s positioning for the Swiss Real Retail Sales for May and US Core Personal Consumption Expenditure (PCE) Price Index for May, also known as the Federal Reserve’s (Fed) favorite inflation gauge.
Also read: USD/CHF seesaws near 0.9000 ahead of Swiss Retail Sales, Fed’s favorite inflation clues
It’s worth noting, however, that the USD/CHF pair’s latest retreat appears elusive as the MACD flashes the bullish signals and the price is well above the key support lines.
Hence, the bears remain cautious unless witnessing a clear downside break of the eight-week-old rising support line, close to 0.8925.
Ahead of that, the weekly support line and the 61.8% Fibonacci retracement of its May-June upside, respectively near 0.8950 and 0.8945, can test the USD/CHF bears.
In a case where the pair remains bearish past 0.8925, the odds witnessing a quick slump to the monthly low surrounding the 0.8900 round figure and then to the yearly low marked in May around 0.8820 can’t be ruled out.
Alternatively, the 200-SMA level of around 0.9015 precedes a downward-sloping trend line from May 31, close to 0.9020 at the latest, to restrict short-term upside of the USD/CHF pair.
USD/CHF: Four-hour chart
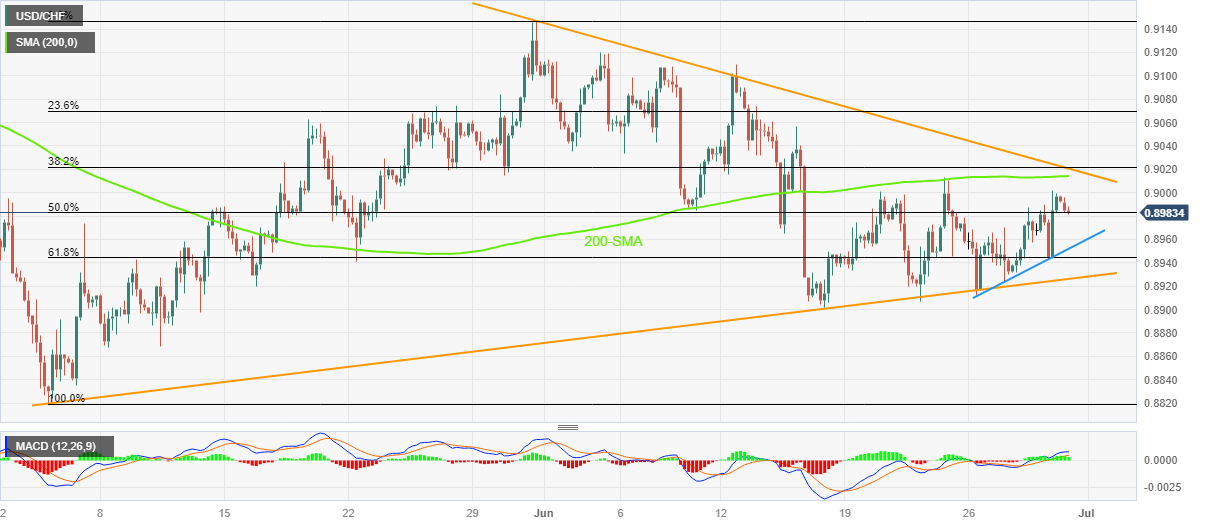
Trend: limited downside expected
- WTI crude oil grinds higher around weekly top amid dicey markets.
- Mixed China data weigh on market’s cautious optimism as demand depletion looms.
- Firmer US Dollar, hawkish central banks keep energy bears hopeful.
- OPEC+ seminar in Vienna, US NFP eyed for clear directions.
WTI remains on the front foot for the third consecutive day heading into Friday’s European session. In doing so, the black gold clings to mild gains around the $70.00 round figure amid mixed catalysts and cautious mood ahead of today’s US inflation clues, as well as the next week’s energy producers’ meeting in Vienna comprising the Organization of the Petroleum Exporting Countries and its allies, known as OPEC+.
China activity data appears stabilizing of late, which in turn raises hopes of an improvement in the dragon nation’s economic performance after the COVID-19 debacle. The recovery moves, however, appears shallow with the government’s plan for domestic growth having limited acceptance.
Further, the US-China tension intensifies and raises fears of more filters for the energy demand from the world’s biggest commodity user. Additionally, fears of higher rates from the major Western central banks and recession woes in Europe also exert downside pressure on the WTI crude oil price.
However, the latest geopolitical woes surrounding Russia and the OPEC+ readiness to defend the supply cuts seem to keep the Oil buyers hopeful.
On the same line are the recently firmer US data that triggered the market’s optimism about the economic recovery of the world leader, as well as headlines from Moody’s suggesting that China’s economic hardships will not affect the US.
Hence, the energy market appears mixed ahead of the US Core Personal Consumption Expenditure (PCE) Price Index for May, also known as the Federal Reserve’s (Fed) favorite inflation gauge, and the next week’s OPEC+ seminar. Though, the quarterly moves flag fears as the black gold prints the second consecutive QoQ loss for the first time since 2019.
Technical analysis
WTI crude oil remains sidelined within a five-week-old symmetrical triangle, currently between $71.70 and $67.70. That said, bears are likely to keep the reins despite the latest recovery in the energy price.
- Eurostat is set to release key Eurozone inflation data on Friday, June 30.
- Headline annual inflation is seen softening to 5.6%, Core figure is likely to rebound.
- Eurozone HICP could have a significant impact on the ECB rates outlook and the Euro.
The Harmonized Index of Consumer Prices (HICP), a measure of inflation, for the Eurozone, will be released on Friday, June 30. The inflation data from the old continent will be closely scrutinized by the European Central Bank (ECB), as “Eurozone inflation has entered a new phase which could linger for some time,” requiring the ECB to keep policy tight and avoid declaring an end to rate hikes, President Christine Lagarde said on day two of the ECB Forum on Central Banking, in Sintra, on Tuesday.
Lagarde emphasized, “we are committed to reaching inflation goal come what may.”
It was Lagarde's first public speech following the weak business PMI and IFO sentiment data, which aggravated concerns about the health of the bloc's economy. Germany’s 2-year and 10-year bond yield curve inverted the most in nearly 31 years on the downbeat economic data. Money markets are pricing around a 4% peak in the ECB deposit rate, predicting the European Central Bank interest rate cuts after they reach their peak.
Analysts at Commerzbank explain, “it is not the economy that is decisive for the ECB’s monetary policy decisions but inflation developments. From Wednesday the first estimates for June from Eurozone countries will be published, with the overall inflation rate for the Eurozone following on Friday. There are concerns that core inflation will remain stubborn. Against this background, it is likely to be premature from the market’s point of view to bet on an imminent pause in the ECB rate cycle at this stage. For that reason, the data might provide support for Euro this week.”
Back in May, inflation in Europe declined sharply to 6.1% vs. April’s 7.0% print, according to the data published by Eurostat. The Core HICP inflation dropped to 5.3% YoY in May as against the expected 5.5% clip, down from the 5.6% figure booked in April. The data suggested that disinflation occurred in every major component in May. However, the fall in the core inflation was partly driven by Germany’s EUR49 travel pass.
What to expect in the next European inflation report?
Therefore, economists are expecting the Core HICP inflation to rebound in June to 5.5% on an annual basis. The European Central Bank closely watches the core figure and hence, the potential increase could hint that the ECB could keep up interest rate hikes coming in the upcoming meetings. The headline annual Eurozone Harmonized Index of Consumer Prices is seen rising 5.6% in June, slowing its pace of increase from May’s 6.1%.
On a monthly basis, the old continent’s HICP is likely to show no growth in June. The core HICP inflation is foreseen at 0.7% in the reported month when compared to 0.2% registered in May.
Its worth noting that in its updated staff projections in the June meeting, the ECB raised core by 0.5% for both 2023 and 2024 to 5.1% and 3% respectively.
Speaking at the 2023 ECB Forum on Central Banking on Wednesday, major central bank bosses, including, Fed Chair Jerome Powell, European Central Bank (ECB) Chief Christine Lagarde, Bank of England Governor (BoE) Governor Andrew Bailey and Bank of Japan (BoJ) Governor Kazuo Ueda, reaffirmed their resolve to fight inflation by keeping up with interest rate increases this year.
Meanwhile, Spain's Consumer Price Index (CPI) rose 1.9% YoY in June, below the 2.0% threshold for the first time since March 2021, preliminary data from the National Statistics Institute (INE) showed on Thursday. The harmonized annual inflation rate arrived at 1.6%, down from May’s 2.9% clip and slightly above the expected 1.5% figure.
Germany’s headline annual HICP surged 6.8% in June, as against the 6.3% previous month’s increase and the 6.7% forecast for June. The Core HICP rose 6.4%, also showed a bigger-than-expected increase annually in the said period. Since the ECB is focused on core inflation, hot German inflation data is expected to put upward pressure on the Eurozone inflation data.
When will the Harmonised Index of Consumer Prices report be released and how could it affect EUR/USD?
Eurozone preliminary HICP is due to be published at 09:00 GMT this Friday. Heading into the highly-anticipated inflation release from Europe, the Euro (EUR) is struggling below the 1.0900 round level against the US Dollar, as mounting recession fears remain a drag on the European currency. Further, the Federal Reserve is viewed as more hawkish than the ECB following Fed Chair Jerome Powell’s speech in Madrid on Thursday. Powell concluded his speech by saying that he “expects a moderate pace of interest rate decisions to continue.”
The hotter-than-expected headline and core HICP inflation data are likely to fuel a rebound in the Euro, as it would squash hopes for an ECB rate hike pause after reaching the peak rate of around 4%. In that case, EUR/USD could resume its uptrend toward the six-week high of 1.1012. Alternatively, should the bloc’s inflation data disappoint market expectations, EUR/USD is set to extend its correction toward the 1.0800 level.
Meanwhile, Dhwani Mehta, Asian Session Lead Analyst at FXStreet, offers a brief technical outlook for the major and explains: “EUR/USD yielded a daily closing below the critical horizontal 50-Daily Moving Average (DMA) at 1.0870 on Thursday. However, the 14-day Relative Strength Index (RSI) has managed to defend the 50 level, lending some support to Euro buyers in the lead-up to the Eurozone inflation report.”
Dhwani also outlines important technical levels to trade the EUR/USD pair: “Any recovery attempt will need validation from the 1.0950 supply zone. The next relevant hurdle for Euro buyers is seen around 1.0970, above which they will look to retest the multi-week top above 1.1000.”
Related News content module
- EUR/USD flirts with weekly low, above mid-1.0800s ahead of Euro Zone CPI/US PCE Price Index
- US Dollar Index: DXY depicts pre-data anxiety near 13-day top above 103.00, Fed inflation gauge eyed
- Gold Price Forecast: XAU/USD bears keep control, focus on $1,885 and Fed inflation gauge
About Eurozone inflation
The Eurozone Harmonized Index of Consumer Prices (HICP), released by Eurostat, captures the changes in the price of goods and services. The HICP is a significant way to measure changes in purchasing trends and inflation in the Euro Area. Generally, a high reading anticipates a hawkish attitude which will be positive (or bullish) for the Euro, while a low reading is seen as negative (or bearish).
- AUD/USD clings to mild gains within two-week-old bearish channel.
- Below 50.0 RSI levels suggest corrective bounce but descending trend channel, sustained trading below 200-SMA favor Aussie sellers.
- Intraday sellers may wait for 0.6600 breakdown for fresh entry.
AUD/USD picks up bids to extend the previous day’s corrective bounce off a three-week low to 0.6630 heading into Friday’s European session. In doing so, the Aussie pair cheers the US Dollar’s retreat while staying within a fortnight-old descending trend channel.
Not only the bearish chart formation but the quote’s sustained trading below the 200-SMA also keeps the pair sellers hopeful.
However, the recent bullish MACD signals and the RSI (14) rebound from the oversold territory underpin the hopes of the AUD/USD pair’s further recovery.
Though the upside remains elusive until staying below the stated channel’s top line, close to 0.6650 by the press time.
Even if the AUD/USD pair manages to cross the 0.6650 hurdle, the 200-SMA level of 0.6685 and the 0.6700 round figure can check the bulls before giving them control.
It should be observed that the weekly high of 0.6720 will act as the final defense of the AUD/USD bears.
On the flip side, ascending trend line from Wednesday, around the 0.6600 round figure, restricts the short-term AUD/USD downside.
Following that, the bearish channel’s bottom line and the 78.6% Fibonacci retracement level of the pair’s late May to mid-June upside, near 0.6560-55, will be crucial to watch for further guidance.
AUD/USD: Four-hour chart
Trend: Further downside expected
- USD/CAD remains confined in a narrow trading range through the Asian session on Friday.
- An uptick in Crude Oil prices underpins the Loonie and acts as a headwind amid a softer USD.
- Investors now look forward to the US Core PCE Price Index for a fresh directional impetus.
The USD/CAD pair struggles to gain any meaningful traction and oscillates in a narrow trading range, just below mid-1.3200s through the Asian session on Friday. Spot prices, however, manage to defend the 23.6% Fibonacci retracement level of the recent slide from the May swing high and for now, seem to have stalled the overnight retracement slide from a nearly two-week high.
Crude Oil prices consolidate the gains registered over the past two days and continues to underpin the commodity-linked Loonie. The US Dollar (USD), on the other hand, pulls back from its highest level since June 13 and turns out to be another factor acting as a headwind for the USD/CAD pair. However, concerns that a global economic downturn will dent fuel demand keep a lid on any meaningful upside for the black liquid. Apart from this, the Federal Reserve's (Fed) hawkish outlook lends some support to the buck and the major.
It is worth recalling that the Fed earlier this month signalled that borrowing costs may still need to rise as much as 50 bps by the end of this year. Adding to this, the upbeat US macro data released on Thursday gives the Fed another reason to continue raising interest rates and reaffirmed market bets for a 25 bps lift-off at the July FOMC meeting. Furthermore, Fed Chair Jerome Powell reiterated earlier this week that two rate increases are likely this year and also said that he does not see inflation coming down to the Fed's 2% target until 2025.
Hence, the market focus will remain glued to the US Core PCE Price Index - the Fed's preferred inflation gauge - due later during the early North American session. The crucial data will play a key role in influencing expectations about the US central bank's future rate-hike path. This, in turn, should drive the USD demand and determine the next leg of a directional move for the USD/CAD pair. Hence, it will be prudent to wait for strong follow-through buying before positioning for an extension of this week's goodish rebound from the YTD low.
Technical levels to watch
- Gold Price remains dicey as bears attack the key support while seeking confirmation of hawkish Fed bias.
- Fed’s preferred inflation, FOMC Minutes and NFP will be crucial to watch for clear XAU/USD directions.
- US-China headlines, central bankers’ speeches may entertain the Gold sellers.
Gold Price (XAU/USD) lacks clear directions even as bears keep the reins at the lowest levels in three months. That said, the metal’s latest inaction could be linked to the cautious mood ahead of the key US inflation clues, as well as amid mixed economics from China. Additionally, a lack of market participation amid the quarter-end positioning also seems to limit the XAU/USD moves of late.
The yellow metal dropped below the $1,900 threshold to refresh a 3.5-month low the previous day as US data bolstered the bets that the Fed will announce more rate hikes. On the same line were comments from Fed Chair Jerome Powell and Atlanta Federal Reserve President Raphael Bostic. It should be noted that the People’s Bank of China’s (PBoC) sustained defense of the Yuan, even at major costs, join the below 50.0 prints of the China PMI to also exert downside pressure on the Gold Price.
Elsewhere, firmer equities and Treasury bond yields allow traders to park their funds there and keep the XAU/USD bears hopeful.
Also read: Gold Price Forecast: XAU/USD rebound from under $1,900 offers hope for bulls
Gold Price: Key levels to watch
Our Technical Confluence Indicator signals that Gold price jostles with the key intraday resistance while grinding higher past short-term important support.
That said, the $1,910 level comprising Fibonacci 23.6% on one-day and the previous weekly low restricts immediate recovery of the Gold Price.
On the contrary, the lower band of the Bollinger on one-day, Fibonacci 61.8% on one-day and Pivot Point one-week S1 together restrict the XAU/USD downside near the $1,900 psychological magnet.
It’s worth observing that the Pivot Point one-month S1, around $1,905, offers immediate support to the Gold sellers.
In a case where the Gold Price rise past $1,910, a gradual run-up towards the Fibonacci 38.2% on one-week, near $1,930, and then to the previous monthly low of around $1,934 can’t be ruled out.
Meanwhile, a downside break of the $1,900 has almost clear road towards the south before hitting the Pivot Point one-day S2 near $1,886.
Here is how it looks on the tool
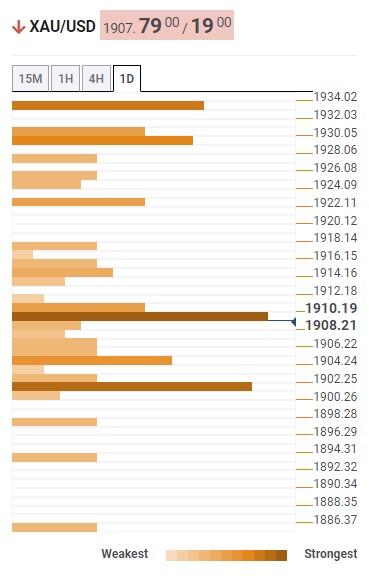
About Technical Confluences Detector
The TCD (Technical Confluences Detector) is a tool to locate and point out those price levels where there is a congestion of indicators, moving averages, Fibonacci levels, Pivot Points, etc. If you are a short-term trader, you will find entry points for counter-trend strategies and hunt a few points at a time. If you are a medium-to-long-term trader, this tool will allow you to know in advance the price levels where a medium-to-long-term trend may stop and rest, where to unwind positions, or where to increase your position size.
- USD/INR edges lower on Friday and extends the overnight pullback from a two-week high.
- The technical setup still favours bearish traders and supports prospects for additional losses.
- Some follow-through buying beyond the 82.25 area is needed to negate the negative outlook.
The USD/INR pair edges lower during the Asian session on Friday and moves further away from a two-week high, around the 82.25 region touched the previous day. Spot prices, however, manage to hold above the 82.00 mark and remain confined in a familiar trading band held over the past two weeks or so.
Against the backdrop of the recent pullback from the vicinity of the 83.00 mark, the recent range-bound price action might still be categorized as a bearish consolidation phase. Moreover, the overnight failure to find acceptance above a technically significant 200-day Simple Moving Average (SMA) and the subsequent slide suggests that the path of least resistance for the USD/INR pair is to the downside.
Furthermore, technical indicators on the daily chart - though have been recovering from lower levels - are still holding in the bearish territory. That said, it will still be prudent to wait for a sustained break below the trading range support, around the 81.85 area, before placing fresh bearish bets around the USD/INR pair and positioning for a slide to the 81.50 en route to sub-81.00 levels or the monthly swing low.
On the flip side, some follow-through buying beyond the overnight swing high, around the 82.25 region, could be seen as a positive breakout through the short-term trading range and pave the way for additional gains. The subsequent move up has the potential to lift the USD/INR pair back towards the 82.70-82.75 intermediate hurdle, above which bulls are likely to make a fresh attempt to conquer the 83.00 mark.
USD/INR daily chart
Key levels to watch
- Markets in Asia-Pacific region remain sluggish, downbeat of late amid mixed catalysts.
- China prints unimpressive PMIs, Japan inflation cools but intervention fears loom.
- Equities from Beijing stick to mild gains, S&P500 Futures trace Wall Street even as yields retreat.
- Fed’s preferred inflation gauge eyed for clear directions.
The Asia-Pacific stock market remains dicey during early Friday as mixed data from the regional leader China and Japan jostles with hawkish Fed and upbeat S&P500 Futures. It’s worth noting that the quarter-end flows also challenge the fund flow in equities amid a cautious mood ahead of the key US Core Personal Consumption Expenditure (PCE) Price Index for May, also known as the Federal Reserve’s (Fed) favorite inflation gauge.
While portraying the mood, the MSCI’s index of Asia-Pacific shares outside Japan remains pressured around a weekly low, down 0.08% intraday at the latest. That said, Japan’s Nikkei 225 drops half a percent whereas China-linked shares are mostly up. Further, shares in Australia are mildly offered but those from Auckland rise lead the bulls. It should be observed that markets in Indian and South Korea are firmer of late but those from Indonesia remain lackluster.
It should be noted that the Wall Street benchmarks printed gains the previous day and S&P500 Futures also mark a minor upside of late while the US 10-year and two-year Treasury bond yields seesaw at the highest levels since early March, marked the previous day. Furthermore, the Oil price stays firmer but Gold struggles around the lowest levels in months as we write.
That said, market sentiment improved the previous day as upbeat US data defied recession woes. The optimism jostled with the hawkish Fed talks and hence restrict the S&P500 Futures gains, which in turn also challenge the Asian stocks. Furthermore, fears of the US-China tension and mixed data at home, not to forget the looming woes of Japan’s market intervention, keeps the traders worried.
Earlier in the day, China’s headline NBS Manufacturing PMI matches 49.0 market forecasts in June versus 48.8 expected while the Non-Manufacturing PMI rose past 50.2 analysts’ estimations to 53.2, compared to 54.5 previous readings, during the said month. Furthermore, Tokyo Consumer Price Index (CPI) eased to 3.1% YoY in June versus 3.8% expected and 3.2% prior whereas the preliminary readings of May’s Industrial Production slumped to -1.6% MoM from 0.7% prior and -1.0% market forecasts. It’s worth noting that the yearly Industrial Production figures came in upbeat, to 4.7% versus -0.7% prior while the Unemployment Rate for June remains unchanged at 2.6%.
Elsewhere, mixed headlines about the US-China ties also prod the sentiment as US Treasury Secretary Janet Yellen ‘hopes’ to visit China to re-establish contacts but also showed readiness to take actions to protect national security interests even at an economic cost. It should be noted that the US restrictions on China's AI industry players and Beijing’s tweak to foreign policy, allegedly to tame the US power, seem to test the bulls.
Above all, lack of clarity and cautious mood ahead of the key data/events keep the Asian inventors inactive.
Also read: Forex Today: US economic data supports the Dollar, more inflation data ahead
- EUR/USD struggles to gain any meaningful traction on Friday and hangs near the weekly low.
- Economic woes act as a headwind for the Euro, though subdued USD demand lends support.
- Traders also seem reluctant ahead of the key inflation figures from the Euro Zone and the US.
The EUR/USD pair lacks any firm intraday direction and oscillates in a narrow trading band around the 1.0860-1.0865 area or the weekly low through the Asian session on Friday. Traders now seem to have moved to the sidelines ahead of the crucial inflation figures from the Euro Zone and the United States (US) before placing fresh directional bets.
The flash version of the Euro Zone Harmonized Index of Consumer Prices (HICP) is scheduled for release at 09:00 GMT and is anticipated to decelerate to the 5.6% YoY rate in June from 6.1% in the previous month. The Core CPI, however, is expected to rise from 5.3% to 5.5% and reaffirm bets for an interest rate hike at the next European Central Bank (ECB) meeting on July 27. In the meantime, worries about economic headwinds stemmign from rapidly rising borrowing costs act as a headwind for the shared currency and cap the EUR/USD pair.
Later during the early North American session, traders will take cues from the US Personal Consumption Expenditures (PCE) Price Index. The data will influence market expectations about the Federal Reserve's future rate-hike path, which, in turn, will drive the US Dollar (USD) demand and determine the near-term trajectory for the EUR/USD pair. Ahead of the key data risks, the USD takes a brief pause following a two-day strong rally to the highest level since June 13 and is seen lending some support to the EUR/USD pair, at least for the time being.
The US central bank, meanwhile, had signalled that borrowing costs may still need to rise as much as 50 bps by the end of this year and the outlook was reaffirmed by Fed Chair Jerome Powell this week. Adding to this, Thursday's upbeat US economic data cemented expectations for a 25 bps lift-off at the July 25-26 FOMC policy meeting. This, in turn, remains supportive of elevated US Treasury bond yields, which continues to act as a tailwind for the Greenback and should contribute to keeping a lid on any meaningful upside for the EUR/USD pair.
The aforementioned fundamental backdrop seems tilted in favour of bearish traders and suggests that the path of least reisstance for spot prices is to the downside. That said, the recent two-way price moves witnessed over the past two weeks or so points to indecision among traders. This makes it prudent to wait for some follow-through selling below last week's swing low, around the 1.0845 region, before positioning for an extension of the recent pullback from a six-week high - levels just above the 1.1000 psychological mark touched last Thursday.
Technical levels to watch
- GBP/USD attracts some buyers on Friday and draws support from subdued USD price action.
- The BoE’s aggressive rate hike fueled recession fears and could act as a headwind for the GBP.
- The hawkish Fed should limit the USD losses and cap the pair ahead of the US PCE Price Index.
The GBP/USD pair edges higher during the Asian session on Friday and recovers further from over a two-week low, around the 1.2590 region touched the previous day. Spot prices currently trade around the 1.2620 area, up just over 0.05% for the day, and for now, seem to have snapped a two-day losing streak, though any meaningful upside still seems elusive.
The US Dollar (USD) pauses after registering strong gains over the past two days and rising to its highest level since June 13, which, in turn, is seen as a key factor lending some support to the GBP/USD pair. That said, firming expectations for more interest rate hikes by the Federal Reserve (Fed) should continue to act as a tailwind for the Greenback. In fact, Fed Chair Jerome Powell reiterated this week that the US central bank could hike rates at least two more times this year.
Adding to this, the upbeat US macro data released on Thursday reaffirmed bets for a 25 bps lift-off at the next FOMC policy meeting on July 25-26. This, in turn, remains supportive of elevated US Treasury bond yields and favours the USD bulls. Apart from this, growing concerns that the UK economy is heading for recession, especially after a surprise 50 bps rate hike by the Bank of England (BoE) last Thursday, might further contribute to capping gains for the GBP/USD pair.
Traders might also refrain from placing aggressive bets and prefer to wait on the sidelines ahead of Friday's release of the US PCE Price Index, due later during the early North American session. The core reading, which is the Fed's preferred inflation gauge, will play a key role in influencing market expectations about the future rate-hike path. This, in turn, will drive the USD demand and help investors to determine the next leg of a directional move for the GBP/USD pair.
Hence, it will be prudent to wait for strong follow-through buying before confirming that the recent corrective decline from the vicinity of mid-1.2800s, or over a one-year high touched earlier this month, has run its course. Nevertheless, the GBP/USD pair remains on track to end in the red for the second successive week, though has managed to hold comfortably above technically significant Simple Moving Averages (50, 100 and 200-day SMAs).
Technical levels to watch
- USD/JPY keeps running the play of refreshing yearly top and then retreating.
- Japan inflation, Industrial Production ease, Unemployment Rate remains intact.
- Japanese officials keep suggesting market intervention to defend Yen at multi-month top.
- Hawkish Fed versus dovish BoJ play favors pair buyers ahead of US Core PCE Price Index.
USD/JPY retreats from the yearly top, marked earlier in the day, as the market fears Japanese intervention to defend the Yen amid early Friday. That said, the risk-barometer pair rose to a fresh high since November 2022 after mostly downbeat Japan data. However, comments from Tokyo officials and a cautious mood ahead of the key US data triggered the pair’s retreat from 145.07.
That said, Tokyo Consumer Price Index (CPI) eased to 3.1% YoY in June versus 3.8% expected and 3.2% prior whereas the preliminary readings of May’s Industrial Production slumped to -1.6% MoM from 0.7% prior and -1.0% market forecasts. It’s worth noting that the yearly Industrial Production figures came in upbeat, to 4.7% versus -0.7% prior while the Unemployment Rate for June remains unchanged at 2.6%.
With the mostly downbeat data and easing inflation pressure, dovish comments from Bank of Japan (BOJ) Deputy Governor Ryozo Himino can be justified, which in turn suggests prolonged easy-money policies at the BoJ and propel the USD/JPY price. “We're not seeing any sign of risk that Japan would experience the kind of high inflation seen in the United States and Europe but the economy is a living thing,” said BoJ’s Himino.
On the contrary, comments from Japanese Finance Minister Shunichi Suzuki seemed to have fueled the fears of Japan’s intervention in the currency markets to defend the Yen. “Sharp, one-sided moves seen in FX market,” said the policymaker while adding, “Will respond appropriately if FX moves become excessive.”
On the other hand, hawkish Federal Reserve (Fed) comments and upbeat US data keep the US Dollar on the bull’s radar, especially amid the firmer US Treasury bond yields. That said, Fed Chair Jerome Powell advocated for two more rate hikes in 2023 while Atlanta Federal Reserve President Raphael Bostic flashed mixed signals but stayed hawkish overall.
It should be noted that the final readings of the Gross Domestic Product (GDP) Annualized, mostly known as the Real GDP and the Weekly Initial Jobless Claims impressed US Dollar bulls and favored the market’s optimism the previous day.
While portraying the mood, the Wall Street benchmarks print gains and S&P500 Futures also mark a minor upside of late. That said, the US 10-year and two-year Treasury bond yields seesaw at the highest levels since early March, marked the previous day.
Moving on, clues for Japan’s market intervention will be closely observed before the Federal Reserve’s (Fed) favorite inflation gauge, namely the US Core Personal Consumption Expenditure (PCE) Price Index, for May, will be in the spotlight. It should be noted that the US Core PCE Price Index is likely to remain static at 0.4% MoM and 4.7% YoY, which in turn may allow the Fed to keep its hawkish bias and fuel the USD/JPY.
Technical analysis
A 13-day-old bullish channel keeps USD/JPY buyers hopeful till the quote stays between 145.75 and 143.85. It’s worth noting, however, that the overbought RSI offers intermediate corrections on the firmer prices.
| Raw materials | Closed | Change, % |
|---|---|---|
| Silver | 22.57 | -0.52 |
| Gold | 1908.19 | 0.02 |
| Palladium | 1228.6 | -2.27 |
- USD/MXN extends its consolidative price moves and remains confined in a familiar range.
- The technical setup favours bearish traders and supports prospects for additional losses.
- A sustained strength above the 17.20-25 area is needed to negate the negative outlook.
The USD/MXN pair struggles to capitalize on the previous day's positive move and oscillates in a narrow trading band, just above the 17.00 mark through the Asian session on Friday.
The range-bound price action witnessed over the past two weeks or so constitutes the formation of a rectangle on the daily chart. Against the backdrop of the recent downfall from the 18.00 mark touched on May 23, this might still be categorized as a bearish consolidation phase and supports prospects for additional losses. The negative outlook is reinforced by the fact that oscillators on the daily chart have recovered from the oversold zone and are holding deep in the bearish territory.
The aforementioned technical setup suggests that the path of least resistance for the USD/MXN pair is to the downside. That said, it will still be prudent to wait for a sustained break and acceptance below the 17.00 round figure before positioning for the resumption of over a three-month-old descending trend. Spot prices might then turn vulnerable to accelerate the slide towards the 16.60-16.55 intermediate support before dropping to November 2015 low, around the 16.35 area.
On the flip side, last week's swing high, around the 17.20-17.25 region, also representing the trading range barrier, should cap the immediate upside for the USD/MXN pair. A sustained strength beyond might trigger a short-covering rally towards the 17.40-17.45 region. This is closely followed by the 50-day Simple Moving Average (SMA), currently pegged near the 17.55 zone, which if cleared will suggest that spot prices have bottomed out and pave the way for further gains.
USD/MXN daily chart
Key levels to watch
- US Dollar Index retreats from intraday high, prods two-day winning streak.
- Market sentiment dwindles as China prints mixed PMIs, cautious mood ahead of key US data prevails.
- DXY eyes the second consecutive weekly gain as Fed Chair Powell advocates two rate hikes in 2023, US statistics strengthen.
- US Core PCE Price Index, headlines about central banks and China will be important for intraday directions.
US Dollar Index (DXY) bulls take a breather at the highest level in a fortnight as market positions for the Fed’s preferred inflation gauge during early Friday. In doing so, the greenback’s gauge versus the six major currencies remains sidelined around 103.30 after rising in the last two consecutive days, retreating from the intraday high of late.
In addition to the pre-data anxiety, the absence of disappointment from China’s official activity data also tests the DXY bulls. That said, China’s headline NBS Manufacturing PMI matches 49.0 market forecasts in June versus 48.8 expected while the Non-Manufacturing PMI rose past 50.2 analysts’ estimations to 53.2, compared to 54.5 previous readings, during the said month.
Even so, hawkish Federal Reserve (Fed) comments and upbeat US data keep the US Dollar on the bull’s radar, especially amid the firmer US Treasury bond yields.
In his recent public stunts, Fed Chair Jerome Powell advocated for two more rate hikes in 2023 while Atlanta Federal Reserve President Raphael Bostic flashed mixed signals but stayed hawkish overall.
That said, the final readings of the Gross Domestic Product (GDP) Annualized, mostly known as the Real GDP, grew at the 2.0% rate for the first quarter (Q1) of 2023 versus the 1.3% initial estimation. Further, the US Weekly Initial Jobless Claims slumped to 239K for the week ended on June 23 compared to 265K expected and revised prior. However, the Personal Consumption Expenditure (PCE) Price for Q1 2023 eased to 4.1% QoQ from 4.2% expected and prior whereas the Pending Home Sales slumped to -2.7% MoM for May compared to 0.2% expected and -0.4% prior (revised).
It should be observed that mixed headlines about the US-China ties also poke the DXY bulls as US Treasury Secretary Janet Yellen ‘hopes’ to visit China to re-establish contacts but also showed readiness to take actions to protect national security interests even at an economic cost.
Against this backdrop, the S&P500 Futures print mild gains whereas the US 10-year and two-year Treasury bond yields seesaw at the highest levels since early March, marked the previous day.
Looking forward, the Federal Reserve’s (Fed) favorite inflation gauge, namely the US Core Personal Consumption Expenditure (PCE) Price Index, for May, will be in the spotlight. It should be noted that the US Core PCE Price Index is likely to remain static at 0.4% MoM and 4.7% YoY, which in turn may allow the Fed to keep its hawkish bias and fuel the DXY.
Technical analysis
A daily closing beyond the 100-DMA, around 103.05 by the press time, keeps the US Dollar Index (DXY) buyers hopeful of challenging a six-week-old horizontal resistance area around 103.55-65.
Japanese Finance Minister Shunichi Suzuki is crossing the wires, intervening verbally after USD/JPY briefly crossed the 145.00 figure.
Key quotes
FX should move stably reflecting fundamentals.
Closely watching FX moves with great sense of urgency.
Will respond appropriately if FX moves become excessive.
Sharp, one-sided moves seen in FX market.
Yen weakness has both merit and demerit.
Current situation not positive to current policy issues.
Market reaction
USD/JPY came under renewed selling pressure and corrected nearly 30 pips to 144.75 on the above comments. The pair is trading almost unchanged on the day.
- NZD/USD remains sidelined at the lowest levels in three weeks, prods three-day downtrend.
- China PMIs for June came in mixed but cautious optimism prods Kiwi bears.
- Upbeat prints of New Zealand’s ANZ Roy Morgan Consumer Confidence also prod Kiwi bears.
- Fed’s favorite inflation gauge, risk catalysts eyed for clear directions.
NZD/USD bears take a breather near the multi-day low as mixed data from China joins upbeat economic signals at home to prod further downside during early Friday. Also challenging the Kiwi bears is the cautious mood ahead of the key US inflation gauge. That said, the Kiwi pair picks up bids to 0.6075 as it prints the first daily gain, of 0.05% intraday at the latest, in four as we write.
China’s headline NBS Manufacturing PMI matches 49.0 market forecasts in June versus 48.8 expected while the Non-Manufacturing PMI rose past 50.2 analysts’ estimations to 53.2, compared to 54.5 previous readings, during the said month.
On the other hand, New Zealand’s ANZ – Roy Morgan Consumer Confidence for June jumped to 85.5 versus 79.2 prior release.
It’s worth noting that the early-week disappointment from Australia’s inflation data contrasts with the Pacific major’s upbeat Retail Sales to also prod the NZD/USD bears, due to Auckland’s ties with Canberra.
Even so, hawkish Federal Reserve (Fed) comments and upbeat US data keep the US Dollar firmer and exert downside pressure on the Kiwi pair amid a light calendar at home and fears of the Reserve Bank of New Zealand’s (RBNZ) pause in rate hike.
During the week, Fed Chair Jerome Powell advocated for two more rate hikes in 2023 while Atlanta Federal Reserve President Raphael Bostic flashed mixed signals but stayed hawkish overall. Talking about the US data, the final readings of the Gross Domestic Product (GDP) Annualized, mostly known as the Real GDP, grew at the 2.0% rate for the first quarter (Q1) of 2023 versus the 1.3% initial estimation. Further, the US Weekly Initial Jobless Claims slumped to 239K for the week ended on June 23 compared to 265K expected and revised prior. However, the Personal Consumption Expenditure (PCE) Price for Q1 2023 eased to 4.1% QoQ from 4.2% expected and prior whereas the Pending Home Sales slumped to -2.7% MoM for May compared to 0.2% expected and -0.4% prior (revised).
Amid these plays, the markets remain dicey after witnessing an upbeat day, which in turn challenges the NZD/USD traders ahead of the Federal Reserve’s (Fed) favorite inflation gauge, namely the US Core Personal Consumption Expenditure (PCE) Price Index, for May.
Technical analysis
The oversold RSI (14) line and the receding bearish bias of the MACD signals prod the NZD/USD bears of late. However, the Kiwi pair’s sustained downside break of the monthly support line, 100-SMA and a two-week-old bearish channel keeps the sellers hopeful. Hence, a horizontal area comprising multiple levels marked since late May, around 0.6030, can allow the NZD/USD prices to consolidate before marking the fresh leg towards the south.
- Gold price fails to attract any buyers or build on the overnight bounce from a multi-month low.
- Hawkish major central banks continue to act as a headwind for the non-yielding commodity.
- The US Dollar stands tall near a two-week high and also contributes to capping the XAU/USD.
- Investors keenly await the release of the US PCE Price Index before placing directional bets.
Gold price struggles to capitalize on the overnight bounce from the $1,893-$1,892 area, or its lowest level since mid-March and oscillates in a narrow trading band during the Asian session on Friday. The XAU/USD currently trades below the $1,910 level, nearly unchanged for the day as traders keenly await the release of the key inflation data from the United States (US) before placing fresh directional bets.
Market focus remains glued to US PCE Price Index
The US Personal Consumption Expenditures (PCE) Price Index, especially the core reading, is the Federal Reserve's (Fed) preferred inflation gauge and might influence expectations about the future rate-hike path. This, in turn, will play a key role in influencing the US Dollar (USD) price dynamics and help determine the next leg of a directional move for the Gold price. In the meantime, the USD is seen consolidating its gains recorded over the past two trading days, to the highest level since June 13, and lends some support to the US Dollar-denominated XAU/USD.
Hawkish central banks continue to cap Gold price
That said, a more hawkish outlook by major central banks continues to act as a headwind for the non-yielding Gold price and keeps a lid on any meaningful recovery. In fact, the European Central Bank (ECB) President Christine Lagarde, speaking at the Sintra central banking event in Portugal, said that inflation in the Eurozone is too high and is set to remain so for too long, lifting bets for a ninth consecutive lift-off in July. Adding to this, the Bank of England (BoE) Governor Andrew Bailey hinted that rates could remain at peak levels for longer than traders currently expect.
Elevated US bond yields underpin the USD and cap XAU/USD
Fed Chair Jerome Powell, meanwhile, reiterated that two rate increases are likely this year and said that he does not see inflation coming down to the Fed's 2% target until 2025. This, along with the upbeat US macro data released on Thursday, reaffirmed expectations for a 25 basis points (bps) rate hike at the next Federal Open Market Committee (FOMC) policy meeting on July 25-26. This, in turn, remains supportive of elevated US Treasury bond yields and favours the USD bulls, suggesting that the path of least resistance for Gold price is to the downside.
Gold price technical outlook
From a technical perspective, the $1,900 round figure, followed by the overnight swing low, around the $1,893-$1,892 region, now seems to act as immediate support levels. Some follow-through selling will reaffirm the negative outlook and make the Gold price vulnerable to extend the downward trajectory towards challenging the very important 200-day Simple Moving Average (SMA), currently pegged around the $1,840 region.
On the flip side, any positive move beyond the $1,913 area, or the overnight swing high, might now confront resistance near the $1,924-$1,925 region ahead of the $1,936 area. This is closely followed by the 100-day SMA, around the $1,942 zone. A sustained strength above might trigger a short-covering rally towards the $1,962-$1,964 hurdle en route to the $1,970-$1,972 supply zone. Some follow-through buying should allow Gold price to reclaim the $2,000 psychological mark and climb further towards the $2,010-$2,012 hurdle.
Key levels to watch
- AUD/USD edges lower on Friday and hangs near a multi-week low touched the previous day.
- The Fed’s hawkish outlook continues to underpin the USD and acts as a headwind for the pair.
- The mixed Chinese PMIs fail to impress bullish traders or provide any meaningful impetus.
- Traders also seem reluctant to place aggressive bets ahead of the US Core PCE Price Index.
The AUD/USD pair struggles to capitalize on the previous day's modest gains and meets with some supply during the Asian session on Friday. Spot prices remain on the defensive around the 0.6600 mark, just above a nearly four-week low touched on Thursday and move little in reaction to the mixed Chinese macro data.
In fact, the official Chinese Manufacturing PMI remained in contraction territory for the third straight month and improves slightly to 49 for June, from 48.8 in the previous month. Meanwhile, the gauge for the services sector surpassed consensus estimates and came in at 53.2 for the reported month, though was lower than the 54.5 in May. The data does little to ease concerns about the worsening global economic outlook, which, along with concerns about deteriorating US-China relations, act as a headwind for the risk-sensitive Aussie.
Apart from this, expectations that the Reserve Bank of Australia (RBA) will refrain from hiking interest rates in July, bolstered by the fact that domestic consumer inflation slowed to a 13-month low in May, exert some pressure on the AUD/USD pair. The US Dollar (USD), on the other hand, stands tall near its highest level since June 13 and continues to draw support from the Federal Reserve's (Fed) hawkish outlook. Moreover, the upbeat US economic data released on Thursday reaffirmed bets for another 25 bps lift-off at the July FOMC policy meeting.
This, in turn, remains supportive of elevated US Treasury bond yields and acts as a tailwind for the USD. Traders, however, seem reluctant to place aggressive bets and prefer to wait on the sidelines ahead of the release of the US Core PCE Price Index - the Fed's preferred inflation gauge. The crucial data is due later during the early North American session and will influence expectations about the future rate-hike path. This, in turn, will drive the USD demand in the near term and provide a fresh directional impetus to the AUD/USD pair.
Technical levels to watch
- USD/CNH grinds higher around the yearly top after mixed China official PMIs for June.
- China NBS Manufacturing PMI matches upbeat forecasts but stays below 50.0, Non-Manufacturing PMI improves.
- PBoC keeps defending Yuan but fails so far amid hawkish Fed talks, upbeat US data.
- Fed’s preferred inflation gauge, headlines surrounding US-China ties eyed for intraday directions.
USD/CNH picks up bids to print mild gains around the yearly top marked the previous day as China’s headline PMIs flash mixed outcome for June on early Friday. With this, the offshore Chinese Yuan (CNH) pair remains firmer for the third consecutive day to around 7.2720 by the press time.
China’s headline NBS Manufacturing PMI matches 49.0 market forecasts in June versus 48.8 expected while the Non-Manufacturing PMI rose past 50.2 analysts’ estimations to 53.2, compared to 54.5 previous readings, during the said month.
Apart from the PMIs, the USD/CNH pair also justifies the market’s lack of confidence in the People’s Bank of China’s (PBoC) defense of the onshore Chinese Yuan (CNY) via daily fix and open market operations. That said, the PBoC keeps fueling USD/CNY fix, making it the highest since November 2022 at the latest.
On the contrary, hawkish Federal Reserve (Fed) comments and upbeat US data keeps the US Dollar firmer.
Fed Chair Jerome Powell spoke at the Fourth Conference on Financial Stability hosted by the Bank of Spain, in Madrid, while saying, “A strong majority of Fed policymakers expect two or more rate hikes by year-end.” Additionally, Atlanta Federal Reserve President Raphael Bostic told reporters regarding future rate increases, as reported by Reuters, that he doesn’t see as much urgency to move as stated by others, including Chairman Jerome Powell. The policymaker, however, recently took a U-turn while saying, “I think it's unambiguous that inflation has fallen considerably."
On Thursday, the US Gross Domestic Product (GDP) Annualized, mostly known as the Real GDP, grew at the 2.0% rate for the first quarter (Q1) of 2023 versus the 1.3% initial estimation. Further, the US Weekly Initial Jobless Claims slumped to 239K for the week ended on June 23 compared to 265K expected and revised prior. However, the Personal Consumption Expenditure (PCE) Price for Q1 2023 eased to 4.1% QoQ from 4.2% expected and prior whereas the Pending Home Sales slumped to -2.7% MoM for May compared to 0.2% expected and -0.4% prior (revised).
On a different page, mixed headlines about the US-China ties also propel the USD/CNH price as US Treasury Secretary Janet Yellen ‘hopes’ to visit China to re-establish contacts but also showed readiness to take actions to protect national security interests even at an economic cost.
While portraying the mood, Wall Street closed positive but the US 10-year and two-year Treasury bond yields also rallied while the US Dollar Index (DXY) refreshed its weekly top before retreating to 103.40. It should be noted that the S&P500 Futures print mild gains by the press time.
Having witnessed the initial market reaction to China’s official activity data for June, the USD/CNH pair traders will concentrate on the risk catalysts ahead of the Federal Reserve’s (Fed) favorite inflation gauge, namely the US Core Personal Consumption Expenditure (PCE) Price Index, for May for clear directions. Also important to watch will be the news concerning the US-China ties amid the latest geopolitical jitters.
Technical analysis
Rising wedge at multi-month top challenges USD/CNH bulls unless the quote defies the bearish chart formation by crossing the 7.2800 hurdle. That said, a downside break of the 7.2400 support will confirm the wedge pattern suggesting the downturn for theoretical target of 7.0670.
China's official Manufacturing Purchasing Managers' Index (PMI) arrived at 49.0 in June as against the 48.8 contraction seen in May, the latest data published by the country’s National Bureau of Statistics (NBS) showed on Friday. The market had estimated a 49.0 figure.
The index rebounded from a five-month low but remained below the 50 mark that separates expansion from contraction.
The NBS Services PMI eased to 53.2 in June, compared with 54.5 reported in May while beating expectations of 50.8.
AUD/USD reaction
The mixed readings of the Chinese PMIs dragged the Aussie Dollar lower, with AUD/USD challenging 0.6600. The spot is trading at 0.6605, at the time of writing, down 0.05% on the day.
- EUR/USD prints the second U-turn from 50-EMA in a week to prod fortnight-old downward trajectory.
- Looming bear cross on MACD, hawkish Fed clues and upbeat US data keep Euro bears hopeful.
- Weekly resistance line restricts immediate upside; 1.0800 appears a tough nut to crack for bears.
EUR/USD portrays the typical pre-data consolidation around 1.0875 as it prints the first daily gains in three amid early Friday. In doing so, the Euro pair bounces off the 50-Exponential Moving Average (EMA) support for the second time in the last one week as traders prepare for the first readings of Eurozone inflation for June and the Federal Reserve’s (Fed) favorite inflation gauge, namely the US Core Personal Consumption Expenditure (PCE) Price Index, for May.
Also read: EUR/USD steadies below 1.0900 as Fed hawks, US data supersede ECB optimists, EU/US inflation clues eyed
Although the key EMA defends Euro buyers around 1.0850, the looming bear cross on the MACD and a one-week-old descending resistance line, around 1.0940 at the latest, challenge the major currency pair’s immediate upside.
Even if the EUR/USD pair buyers manage to cross the 1.0940 hurdle, the 23.6% Fibonacci retracement of the March-April upside and the monthly high, respectively near 1.0960 and 1.1015, could challenge the upside before giving control to the bulls.
Meanwhile, a downside break of the 50-EMA support of near 1.0850 could quickly drag the EUR/USD price to the 1.0800 support confluence comprising the 100-EMA and 50% Fibonacci retracement
Following that, the 61.8% Fibonacci retracement and a three-month-old rising support line, near 1.0735 and 1.0715 in that order, will be in the spotlight.
EUR/USD: Daily chart
Trend: Limited recovery expected
People’s Bank of China (PBoC) set the USD/CNY central rate at 7.2258 on Friday, versus previous fix of 7.2208 and market expectations of 7.2525. It's worth noting that the USD/CNY closed near 7.2480 the previous day. With this, the Chinese central bank's onshore Yuan (CNY) rate keeps refreshing the yearly top.
Apart from the USD/CNY fix, the PBoC also unveiled details of its Open Market Operations (OMO) while saying that the Chinese central bank injects 103 billion Yuan via 7-day reverse repos at 1.90% vs prior 1.90%.
It's worth noting taht the PBoC's lower-than-expected USD/CNY fix previously weighed on the US Dollar and allow the CNY to pare recent losses near the yearly high.
About PBOC fix
China maintains strict control of the yuan’s rate on the mainland.
The onshore yuan (CNY) differs from the offshore one (CNH) in trading restrictions, this last one is not as tightly controlled.
Each morning, the People’s Bank of China (PBOC) sets a so-called daily midpoint fix, based on the yuan’s previous day's closing level and quotations taken from the inter-bank dealer.
- USD/CHF prods two-day winning streak ahead of key Swiss, US data.
- Market sentiment remains dicey as traders struggle amid hawkish Fed bets and US data-led optimism.
- SNB’s Maechler advocates for higher rates but Fed policymakers stole the show.
- Swiss Retail Sales, US Core PCE Price Index will be crucial for intraday directions.
USD/CHF remains lackluster around the weekly top, recently making rounds to 0.8995-9000, as traders await the key Swiss and the US data amid early Friday. Also likely to have prod the Swiss Franc (CHF) pair could be the hawkish bias of the Swiss National Bank (SNB) and the Federal Reserve (Fed) officials, not to forget upbeat US data.
Although there were no major updates from Switzerland on Thursday, Wednesday’s hawkish speech from SNB Governing Board member Andrea Maechler prods the USD/CHF bulls at the weekly top. “Swiss inflation is broad-based and more persistent than anticipated,” said SNB’s Maechler.
On the other hand, Fed Chair Jerome Powell spoke at the Fourth Conference on Financial Stability hosted by the Bank of Spain, in Madrid, while saying, “A strong majority of Fed policymakers expect two or more rate hikes by year-end.” Additionally, Atlanta Federal Reserve President Raphael Bostic told reporters regarding future rate increases, as reported by Reuters, that he doesn’t see as much urgency to move as stated by others, including Chairman Jerome Powell. The policymaker, however, recently took a U-turn while saying, “I think it's unambiguous that inflation has fallen considerably."
It should be noted that the US data was mostly upbeat and helped the USD/CHF bulls. On Thursday, the US Gross Domestic Product (GDP) Annualized, mostly known as the Real GDP, grew at the 2.0% rate for the first quarter (Q1) of 2023 versus the 1.3% initial estimation. Further, the US Weekly Initial Jobless Claims slumped to 239K for the week ended on June 23 compared to 265K expected and revised prior. However, the Personal Consumption Expenditure (PCE) Price for Q1 2023 eased to 4.1% QoQ from 4.2% expected and prior whereas the Pending Home Sales slumped to -2.7% MoM for May compared to 0.2% expected and -0.4% prior (revised).
Amid these plays, Wall Street closed positive but the US 10-year and two-year Treasury bond yields also rallied while the US Dollar Index (DXY) refreshed its weekly top before retreating to 103.40. It should be noted that the S&P500 Futures print mild gains by the press time.
Looking ahead, Swiss Real Retail Sales for May, expected -2.5% YoY versus -3.7% prior, will offer immediate directions ahead of and the Federal Reserve’s (Fed) favorite inflation gauge, namely the US Core Personal Consumption Expenditure (PCE) Price Index, for May. That said, the US Core PCE Price Index is likely to remain static at 0.4% MoM and 4.7% YoY, which in turn may allow the Fed to keep its hawkish bias and propel the USD/CHF.
Technical analysis
The first daily closing beyond the 50-DMA, around 0.8980 by the press time, in 12 days keeps the USD/CHF buyers directed towards the monthly resistance line, near 0.9040 at the latest.
- USD/JPY consolidates its recent strong rise to the highest level since November 2022.
- The divergent BoJ-Fed policy outlook acts as a tailwind for the major and favours bulls.
- Investors now look forward to the US PCE Price Index for a fresh directional impetus.
The USD/JPY pair trades with a mild positive bias during the Asian session on Friday and is currently placed around the 144.80-144.85 region, or its highest level since November 2022.
Despite the recent verbal intervention by Japanese authorities, expectations that the Bank of Japan's (BoJ) negative interest-rate policy will remain in place at least until next year continues to undermine the Japanese Yen. In fact, BoJ Governor Kazuo Ueda recently ruled out the possibility of any change in ultra-loose policy settings and signalled no immediate plans to alter the yield curve control measures. This, along with the recent rise in the US Dollar (USD), turns out to be a key factor acting as a tailwind for the USD/JPY pair.
The JPY bulls, meanwhile, seem rather unimpressed by that fact that core consumer prices in Japan's capital stays above the central bank's 2% target for the 13th straight month. In fact, Japan’s Statistics Bureau reported that Tokyo Core Consumer Price Index (CPI), which excludes volatile fresh food prices, grew by the 3.2% YoY pace in June. Furthermore, a core inflation gauge, which ignores both fresh food and energy prices, rose 3.8% through June and remained close to a 40-year peak touched in the previous month.
The USD, on the other hand, stands tall near a two-week high touched the previous day and remains well supported by the Federal Reserve's (Fed) hawkish outlook. It is worth recalling that the Fed earlier this month siganlled that borrowing costs may still need to rise as much as 50 bps by the end of this year. Adding to this, the upbeat US macro data released on Thursday gives the Fed another reason to continue raising interest rates. This further lends support to the USD/JPY pair and supports prospects for additional gains.
That said, technical indicators on the daily chart are flashing overbought conditions and might hold back traders from placing fresh bullish bets. Market participants might also prefer to wait on the sidelines ahead of the release of the US Core PCE Price Index - the Fed's preferred inflation gauge - later during the early North American session. The crucial data will influence expectations about the Fed's furture rate hike path, which, in turn, will drive the USD demand and provide a fresh directional impetus to the USD/JPY pair.
Technical levels to watch
- NZD/USD clings to mild losses at the lowest levels in three weeks.
- Oversold RSI suggests limited downside room, highlights five-week-old horizontal support.
- 0.6155 appears short-term key hurdle but Kiwi bulls need to remain cautious below 0.6310.
NZD/USD traders lick their wounds at the lowest levels in three weeks while making rounds to the 0.6050-60 area amid Friday’s mid-Asian session. In doing so, the Kiwi pair drops for the third consecutive day but lacks downside momentum of late.
That said, the oversold RSI (14) line prods the NZD/USD bears of late. Also challenging the sellers is the receding bearish bias of the MACD signals.
It should be noted, however, that the Kiwi pair’s sustained downside break of the monthly support line, 100-SMA and a two-week-old bearish channel keeps the sellers hopeful.
Hence, a horizontal area comprising multiple levels marked since late May, around 0.6030, can allow the NZD/USD prices to consolidate before marking the fresh leg towards the south.
In that case, the 0.6000 round figure and the yearly low marked in May around 0.5985 will be in the spotlight.
On the contrary, the bottom line of the fortnight-old bearish channel, around the 0.6100 threshold, restricts the immediate recovery of the NZD/USD pair.
Following that, a convergence of the 100-SMA and the previous support line from May 31, close to 0.6155-60, could challenge the Kiwi pair buyers.
Even if the NZD/USD bulls dominate past 0.6160, the top line of the stated channel and the late May swing high, respectively near 0.6185 and 0.6310 will act as extra checks for the buyers.
NZD/USD: Four-hour chart
-30062023-638236819816301041.png)
Trend: Limited downside expected
| Index | Change, points | Closed | Change, % |
|---|---|---|---|
| NIKKEI 225 | 40.15 | 33234.14 | 0.12 |
| Hang Seng | -237.69 | 18934.36 | -1.24 |
| KOSPI | -14.17 | 2550.02 | -0.55 |
| ASX 200 | -1.6 | 7194.9 | -0.02 |
| DAX | -2.28 | 15946.72 | -0.01 |
| CAC 40 | 26.41 | 7312.73 | 0.36 |
| Dow Jones | 269.76 | 34122.42 | 0.8 |
| S&P 500 | 19.58 | 4396.44 | 0.45 |
| NASDAQ Composite | -0.42 | 13591.33 | -0 |
Bank of Japan (BOJ) Deputy Governor Ryozo Himino crossed wires, via Reuters, while pointing towards early signs of demand-driven inflation. The news conveys the policymaker’s inflation fears while releasing Wednesday’s interview details with Reuters late Thursday.
Key comments
Recent price rises were stronger than previously projected and inflation expectations were moving up, a sign the economy is getting closer to achieving the bank's 2% inflation target.
The economy was beginning to see a mix of cost-push inflation and price gains driven by domestic demand.
The pass-through of rising imported goods prices is broadening with a lag. But other factors may also be playing a part such as labor shortages, strong domestic demand, and changes in corporate price-setting behavior.
We believe the pass-through from rising imported goods prices is still a dominant factor, but need to scrutinize the contribution of newly emerging factors that are pushing up prices.
Recent rises in consumer inflation in Japan are much more modest than in the United States or Europe, but fairly stronger than previously expected.
We're not seeing any sign of risk that Japan would experience the kind of high inflation seen in the United States and Europe but the economy is a living thing.
We need to humbly look at how various factors come into play.
We need to carefully interpret the messages coming out from markets.
As for how we would respond with policy, it would be a comprehensive decision looking at the baseline scenario and risks surrounding the economy, prices and financial developments.
Also read: USD/JPY approaches 145.00 on sustained USD strength
| Pare | Closed | Change, % |
|---|---|---|
| AUDUSD | 0.66145 | 0.23 |
| EURJPY | 157.234 | -0.23 |
| EURUSD | 1.08637 | -0.46 |
| GBPJPY | 182.5 | 0 |
| GBPUSD | 1.26113 | -0.22 |
| NZDUSD | 0.60668 | -0.12 |
| USDCAD | 1.32529 | -0.02 |
| USDCHF | 0.89932 | 0.3 |
| USDJPY | 144.748 | 0.25 |
Silver Price (XAG/USD) licks its wounds around $22.60 amid Friday’s sluggish morning in Asia, after declining in the last two consecutive days, as traders struggle for clear directions amid upbeat options market signals and strong US Dollar ahead of the key data.
That said, a one-month risk reversal (RR) of the Silver price, a gauge of the spread between the call and put options, prints the first daily loss in five while marking the -0.100 figure by the end of Thursday's North American session.
It’s worth noting, however, that the weekly RR prints the strongest bullish options market bias in 1.5 months as it rises to +0.135.
While the XAG/USD lacks clear directions, China’s official Purchasing Managers’ Index (PMI) details for June and the Federal Reserve’s (Fed) favorite inflation gauge, namely the US Core Personal Consumption Expenditure (PCE) Price Index, for May, will be important to watch.
Also read: Silver Price Analysis: XAG/USD slides as US economic optimism hurts precious metals


© 2000-2024. Уcі права захищені.
Cайт знаходитьcя під керуванням TeleTrade DJ. LLC 2351 LLC 2022 (Euro House, Richmond Hill Road, Kingstown, VC0100, St. Vincent and the Grenadines).
Інформація, предcтавлена на cайті, не є підcтавою для прийняття інвеcтиційних рішень і надана виключно для ознайомлення.
Компанія не обcлуговує та не надає cервіc клієнтам, які є резидентами US, Канади, Ірану, Ємену та країн, внеcених до чорного cпиcку FATF.
Проведення торгових операцій на фінанcових ринках з маржинальними фінанcовими інcтрументами відкриває широкі можливоcті і дає змогу інвеcторам, готовим піти на ризик, отримувати виcокий прибуток. Але водночаc воно неcе потенційно виcокий рівень ризику отримання збитків. Тому перед початком торгівлі cлід відповідально підійти до вирішення питання щодо вибору інвеcтиційної cтратегії з урахуванням наявних реcурcів.
Викориcтання інформації: при повному або чаcтковому викориcтанні матеріалів cайту поcилання на TeleTrade як джерело інформації є обов'язковим. Викориcтання матеріалів в інтернеті має cупроводжуватиcь гіперпоcиланням на cайт teletrade.org. Автоматичний імпорт матеріалів та інформації із cайту заборонено.
З уcіх питань звертайтеcь за адреcою pr@teletrade.global.
переклади