- Analytics
- News and Tools
- Market News
Новини ринків
- USD/JPY stuck to 141.00 as markets head towards 2024.
- Greenback shed a third of a percent against the Yen on the last Friday of 2023.
- USD/JPY down a full percent on the week, but up 7% on the year.
The USD/JPY is back into the 141.00 handle as the pair struggles to accelerate momentum in either direction as markets wind up the 2023 trading year.
Post-holiday markets saw a thin week ahead of the New Year’s long weekend, and the US Dollar (USD) is down 0.3% against the Japanese Yen (JPY) for the last Friday of the trading year, shedding a full percentage point on the week.
Forex Today: A new year arrives, focus turns to US labor market data
US economic data continues to miss the mark with the US Chicago Purchasing Managers’ Index (PMI) printing below expectations on Friday, coming into at a contractionary 46.9 in December compared to November’s 18-month peak of 55.8, coming in well below the median market forecast of 51.0.
Steepening misses in US data figures are counter-intuitively supportive of broad-market risk appetite, with investors expecting souring economic outlooks across the globe helping to push the Federal Reserve (Fed) towards a faster pace of rate cuts in 2024.
USD/JPY Technical Outlook
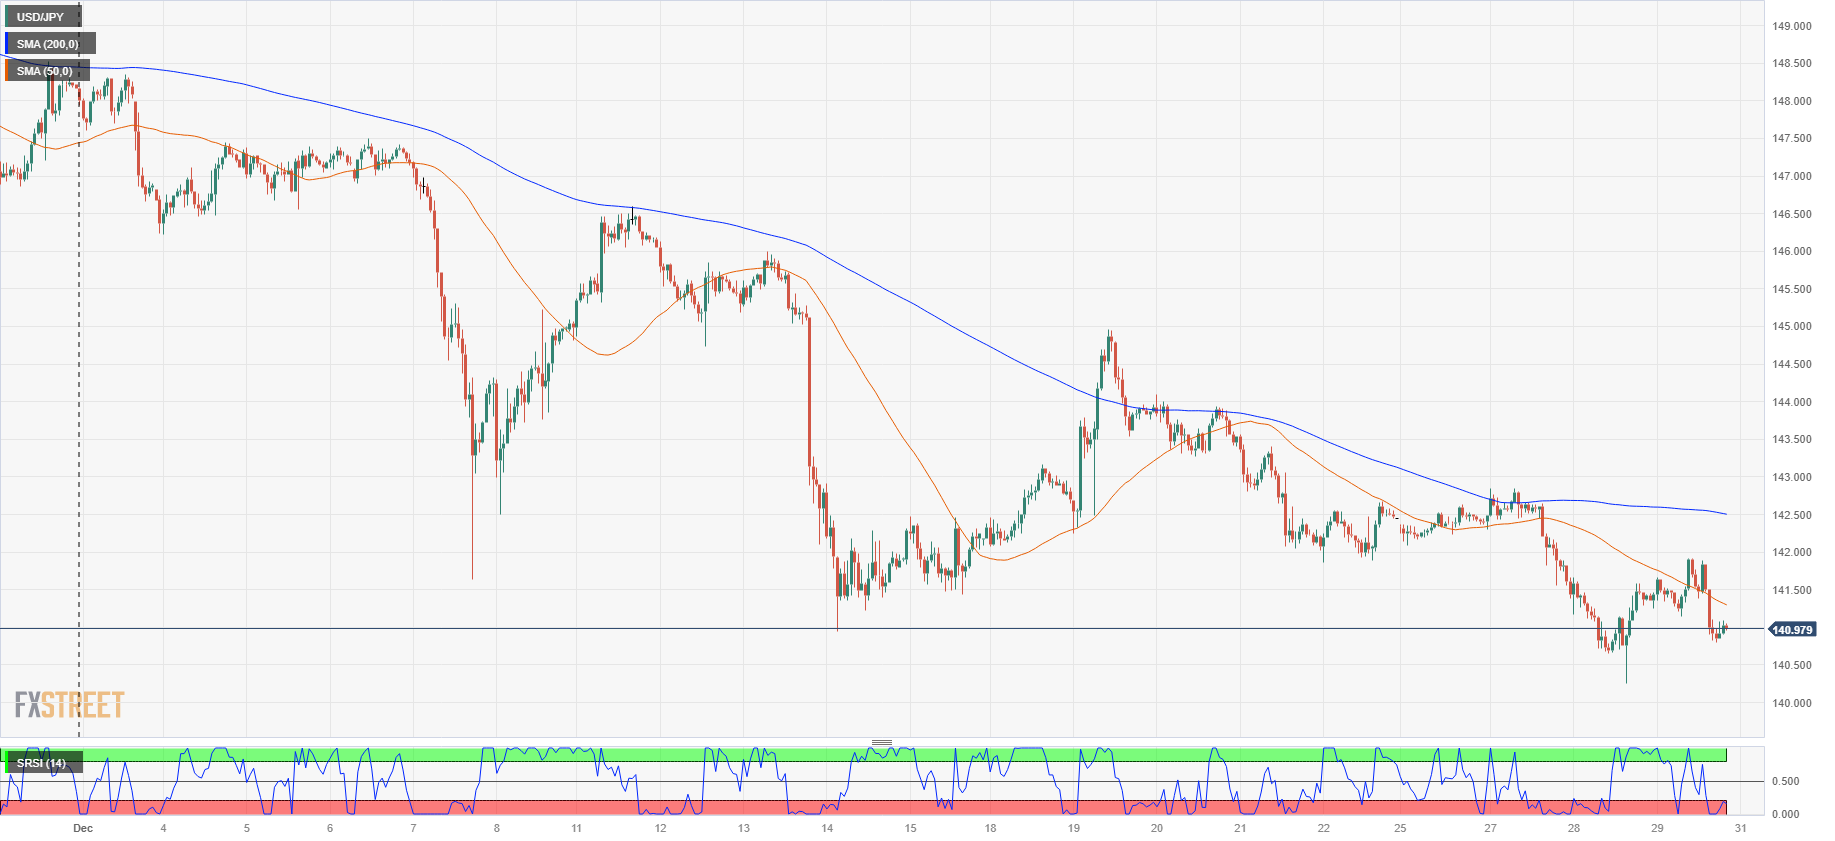
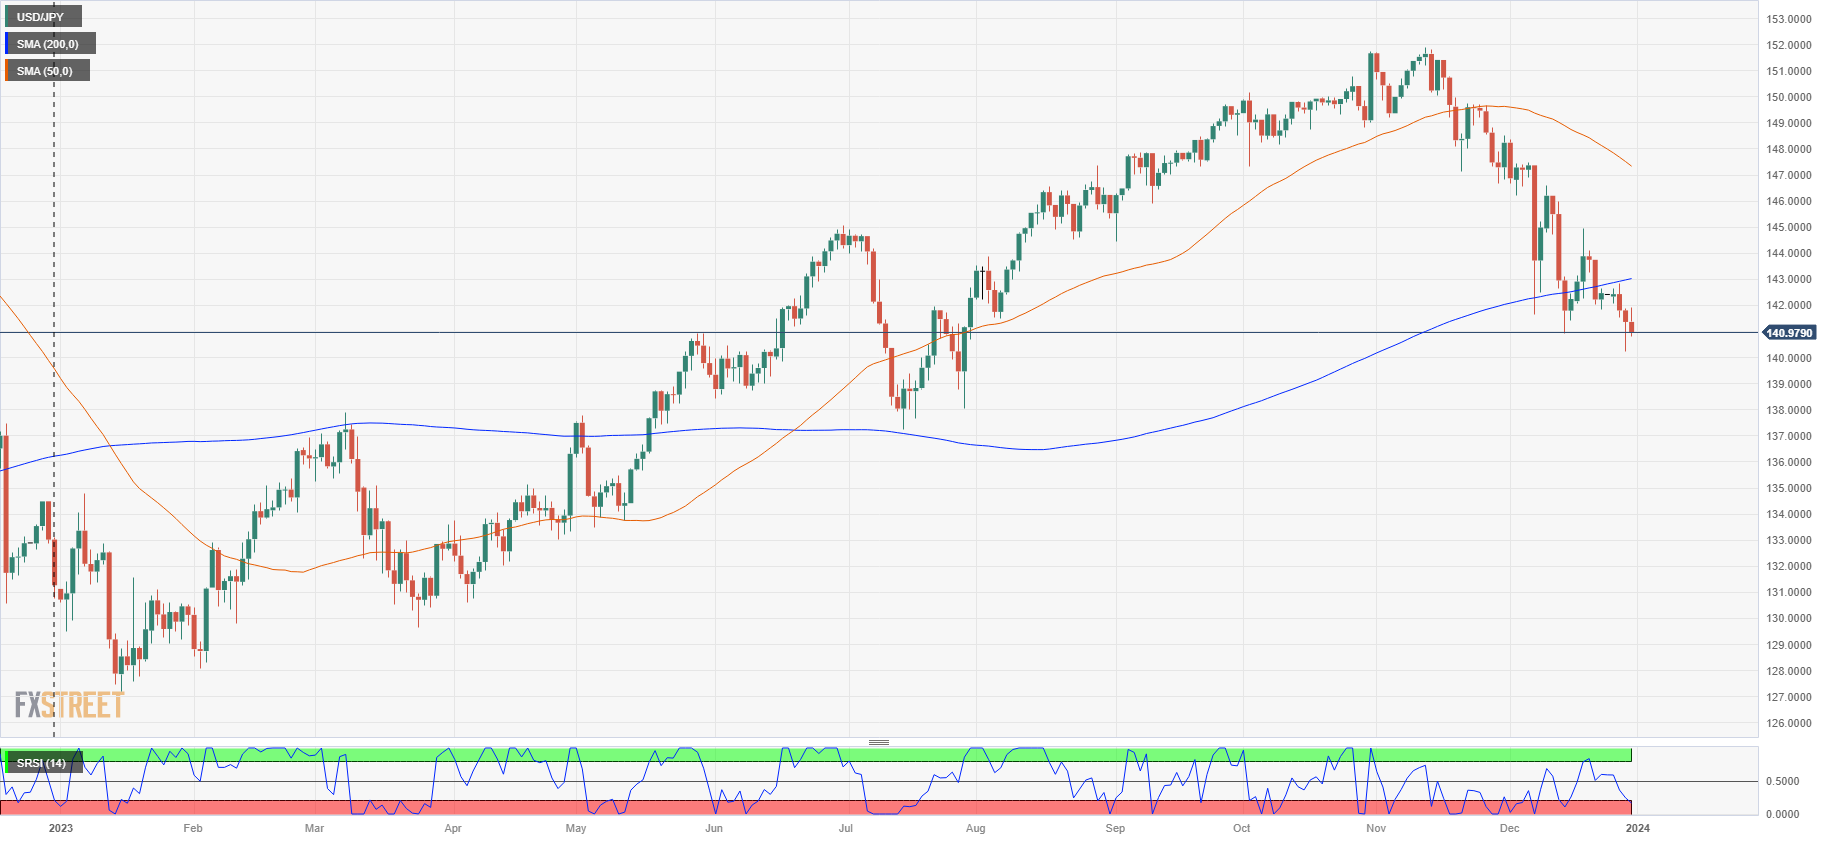
With the USD/JPY up around 7% on the year compared to being in the red for December, the last few trading weeks of 2023 have been particularly Dollar-negative, and there is little technical reason for the trend to reverse direction heading into 2024.
The pair etched in a yearly high of 151.91 in November, coming within inches of October 2022’s peak bids of 151.94 before slumping back toward the 140.00 major handle.
The USD/JPY has closed in the red for all but one of the last seven consecutive trading weeks, and the pair is extending a push into bear country on the south end of the 200-day Simple Moving Average (SMA) near 143.00.
USD/JPY Hourly Chart
USD/JPY Daily Chart
USD/JPY Technical Levels
- The EUR/GBP suffers losses, positioned at 0.8660 with a decline of 0.30%.
- Daily chart indicators reveal signs of bearish momentum with RSI's negative bias and MACD's waning positive momentum.
- Despite a temporary bearish outlook, the broader term sees bulls in control.
- The Cross will close a 2% yearly loss.
In Friday's session, the EUR/GBP slipped down to 0.8660, shedding a small 0.30%. Breathing room for bearish activities emerged after the pair gained 1% last week. Both daily and four-hour charts signal a neutral to bullish bias, with buyers slightly dominating and significant strides marked in the four-hour indicators.
The degrading slope of the Relative Strength Index (RSI) on positive ground suggests that the buying momentum has slowed down. The green bars of the Moving Average Convergence Divergence (MACD) display a declining pattern, indicating a transition from bullish to bearish momentum. However, divergently, the pair is hovering above its 20,100,200-day Simple Moving Averages (SMAs). This underpins a bullish longer-term narrative despite the short-term indicators predominately leaning toward the sellers, especially after the near 1% weekly gain.
Shifting the focus to the shorter time frame, the four-hour chart, the bears covered some considerable territory. The Relative Strength Index (RSI), showing a downward inclination, is in negative territory, pointing out an intensified bearish momentum aligning with the decreasing green bars in the Moving Average Convergence Divergence (MACD), echoing the dominant selling force.
Support Levels: 0.8655 (200-day SMA), 0.8640 (100-day SMA), 0.8620 (20-day SMA).
Resistance Levels: 0.8700, 0.8750, 0.8800.
EUR/GBP daily chart
-638394803306344639.png)
- GBP/USD churns chart paper near 1.2740.
- UK annualized Nationwide Housing Prices slip, US Chicago PMI also misses.
- Soft data not shaking out Fed rate cut bets.
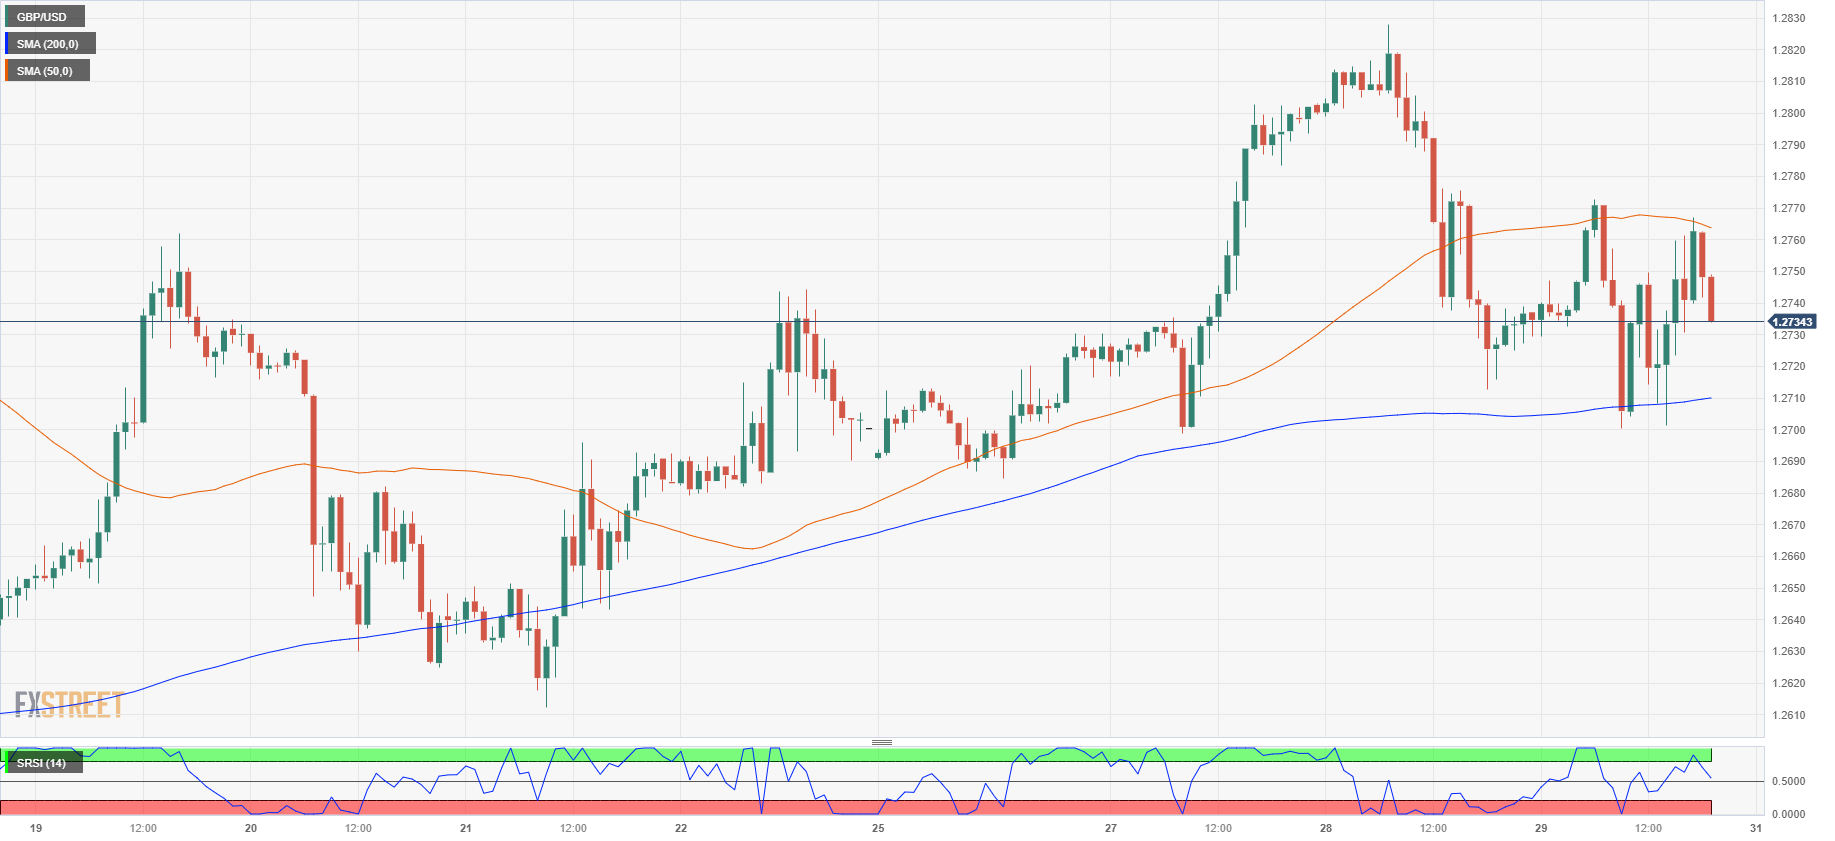
The GBP/USD is cycling in near-term congestion as thin post-holiday markets get set to wrap up the last day of trading in 2023, testing back into intraday median prices just above the 1.2700 handle.
The UK’s Nationwide Housing Prices slipped back further than expected in the annualized figure, printing at -1.8% for the year ending December versus the forecast -1.4%. Markets were expecting a healthier rebound from the previous period’s -2.0% print. Declining UK economic figures are capping off the Pound Sterling (GBP), which is largely catching support from a broad-market sell-off in the US Dollar (USD) as markets bet on faster and deeper rate cuts from the Federal Reserve (Fed) in 2024.
The US Chicago Purchasing Managers’ Index (PMI) declined faster than expected for December, printing at a contractionary 46.9, dropping through the market forecast of 51.0 and pulling further back from November’s 18-month high of 55.8. A worsening US economic outlook is counter-intuitively sparking risk appetite across broader markets, as investors look for anything to push the Fed into accelerating the uptake on the next rate-cutting cycle, currently expected to begin early next year, with the first rate slash broadly expected to occur in March or April.
GBP/USD Technical Outlook
With markets gearing up for the rollover into the 2024 trading year, the GBP/USD is testing into a near-ter midrange as the pair gets squeezed between the 50-hour and 200-hour Simple Moving Averages (SMA) between 1.2760 and the 1.2700 handle.
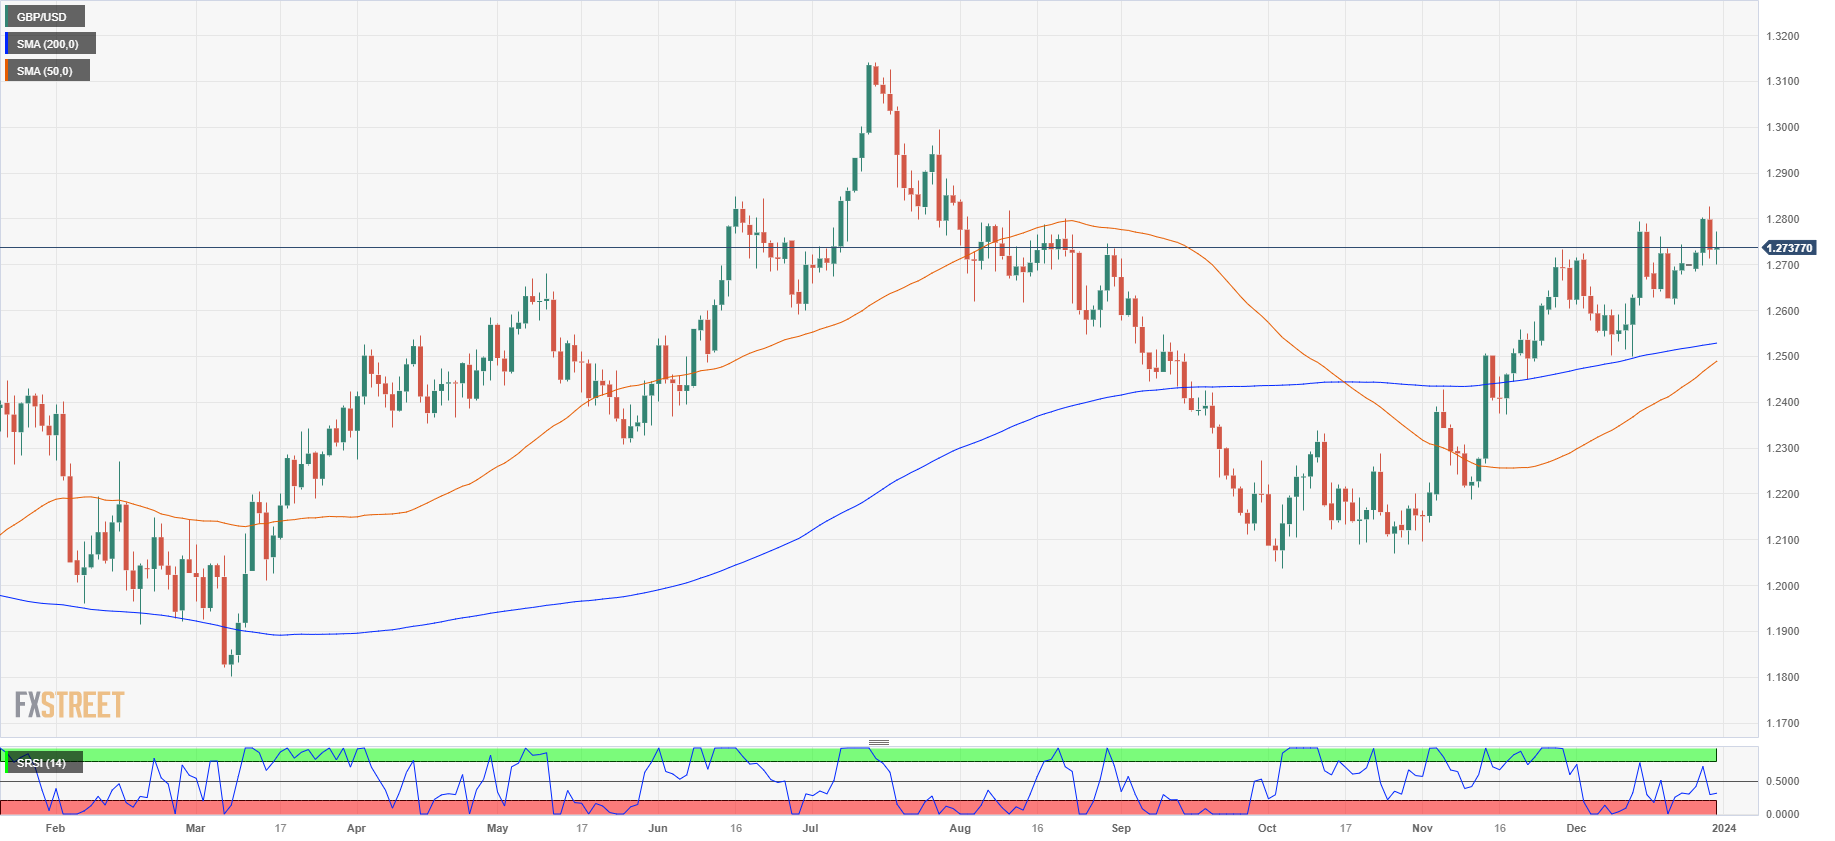
Daily candlesticks have the GBP/USD struggling to develop real momentum beyond the 1.2700 handle, despite a consistent higher-high/higher-low pattern baked into candles. With most of the pair’s upside momentum coming from broad-market USD short pressure, any recovery in the wider Dollar Index is likely to see a sharp drawdown for the Pound Sterling.
GBP/USD Hourly Chart
GBP/USD Daily Chart
GBP/USD Technical Levels
- The USD/CHF declined towards the 0.8400 level with a 0.40% loss.
- Markets currently anticipate a significant 160 basis points of easing by the Fed in 2024.
- The pair ends the year with a 9% depreciation and marks its third consecutive weekly loss.
In Friday's trading session, the USD/CHF pair endured losses as it declined to 0.8405. The pair resumed its weakening trend, pressured by dovish bets on the Federal Reserve (Fed) and the impact of lower US yields, which that weighed heavily on the pair's dynamics.
At their last 2023 meeting, the Federal Reserve recognized a deceleration in inflation and a cooling of the economic activity, endorsing the absence of interest rate increases in 2024 whilst forecasting a 75 bps reduction as per the median terminal rate of the Dot Plot from the Summary of Economic Proyections (SEP). Now, market expectations account for rate cuts in both March and May, and some traders are placing bets on a cut a soon as in the upcoming meeting in January. The market's being overconfident that the Fed will start the easing cycle sooner than expected is weakening the US dollar.
The US Treasury yields are mixed, with some rates up and others down while remaining near multi-month lows. The 2-year rate is positioned at 4.27%, while the 5-year and 10-year rates are registered at 3.84% and 3.87% respectively. As yields descend, reflecting the mentioned dovish expectations, it results in a concurrent disadvantage for the USD, pushing down the USD/CHF.
In the upcoming week, markets await US labor market figures. Key insights will encompass December's Nonfarm Payrolls, Wage Inflation, and Unemployment Rate all closely monitored by the Fed.
USD/CHF levels to watch
Reflecting on the technical indicators from the daily chart, it's evident the selling pressure is currently in command. The pair is positioned under the critical levels of the 20, 100 and 200-day Simple Moving Averages (SMAs), underscoring the dominance of sellers in the broader market context.
The Relative Strength Index (RSI) reading conveys an oversold market condition, hinting at a potential reversal as bears may step back to consolidate. However, the presence of rising red bars in the Moving Average Convergence Divergence (MACD) signals that bearish momentum continues to ascend, adding an extra layer of challenge for the buyers.
In the short term, the rising bearish momentum evident from the MACD could temper a bullish reversal despite the RSI suggesting an oversold market scenario. Consequently, the aggressive selling pressure, accentuated by the position of the pair below the critical SMAs, continues to dominate the short-term technical outlook of the market.
Support Levels: 0.8400, 0.8350, 0.8330.
Resistance Levels: 0.8500, 0.8530, 0.8600.
USD/CHF daily chart
-638394715954470415.png)
An exciting beginning of the 2024 trading year is ahead. Next week, economic reports include the US and Canada Job Reports and inflation figures from the Eurozone. The FOMC will release the minutes of its latest meeting.
Here is what you need to know for next week:
The beginning of 2024 brings key economic reports that will influence monetary policy expectations from the Federal Reserve (Fed) and the European Central Bank (ECB). The action will commence on Tuesday as market functions return to normal after the holidays.
The focus regarding US data will be on the labor market, with the JOLTS Job Openings on Wednesday, followed by the ADP Employment Report and Jobless Claims on Thursday, and Nonfarm Payrolls on Friday. Additionally, the ISM Manufacturing and ISM Services reports are scheduled for release on Wednesday and Friday, respectively. Market participants will also closely scrutinize the FOMC minutes of the December meeting, which will be released on Wednesday.
Analysts at TD Securities on the Fed
A rapidly improving inflation outlook and the specter of rising real rates have led the Fed to start considering the case for policy easing in 2024. Powell alluded to this possibility at the Dec FOMC, but Fed officials since then have pushed back on the idea of imminent easing. We expect the minutes to unveil that the FOMC is not entertaining the case for rate cuts just yet.
After Santa's rally, a new challenge emerges on Wall Street. Stocks finished the year 2023 with solid gains, reaching record highs. The question is whether this momentum can hold next week or if it is time for a correction.
US Dollar price this week
The table below shows the percentage change of US Dollar (USD) against listed major currencies this week. US Dollar was the weakest against the Swiss Franc.
| USD | EUR | GBP | CAD | AUD | JPY | NZD | CHF | |
| USD | -0.36% | -0.30% | -0.46% | -0.54% | -1.13% | -0.72% | -1.96% | |
| EUR | 0.46% | 0.09% | 0.02% | -0.11% | -0.74% | -0.26% | -1.49% | |
| GBP | 0.43% | -0.14% | 0.11% | -0.22% | -0.86% | -0.24% | -1.79% | |
| CAD | 0.46% | -0.22% | 0.10% | -0.34% | -0.67% | -0.09% | -1.64% | |
| AUD | 0.54% | 0.13% | 0.19% | 0.08% | -0.65% | -0.16% | -1.63% | |
| JPY | 1.12% | 0.80% | 0.65% | 0.95% | 0.62% | 0.62% | -0.96% | |
| NZD | 0.71% | 0.30% | 0.43% | 0.25% | 0.14% | -0.49% | -1.17% | |
| CHF | 2.11% | 1.46% | 1.47% | 1.62% | 1.63% | 0.96% | 1.25% |
The heat map shows percentage changes of major currencies against each other. The base currency is picked from the left column, while the quote currency is picked from the top row. For example, if you pick the Euro from the left column and move along the horizontal line to the Japanese Yen, the percentage change displayed in the box will represent EUR (base)/JPY (quote).
The US Dollar Index (DXY) posted its third consecutive weekly loss as market participants continued to anticipate Fed rate cuts in the coming year. It managed to end far from the bottom, around 101.20, after a rebound on Thursday and Friday led by a modest rebound in US yields. The DXY maintains a bearish bias and is likely to test the 100.00 level. However, t positive US data could potentially trigger a sharp rebound.
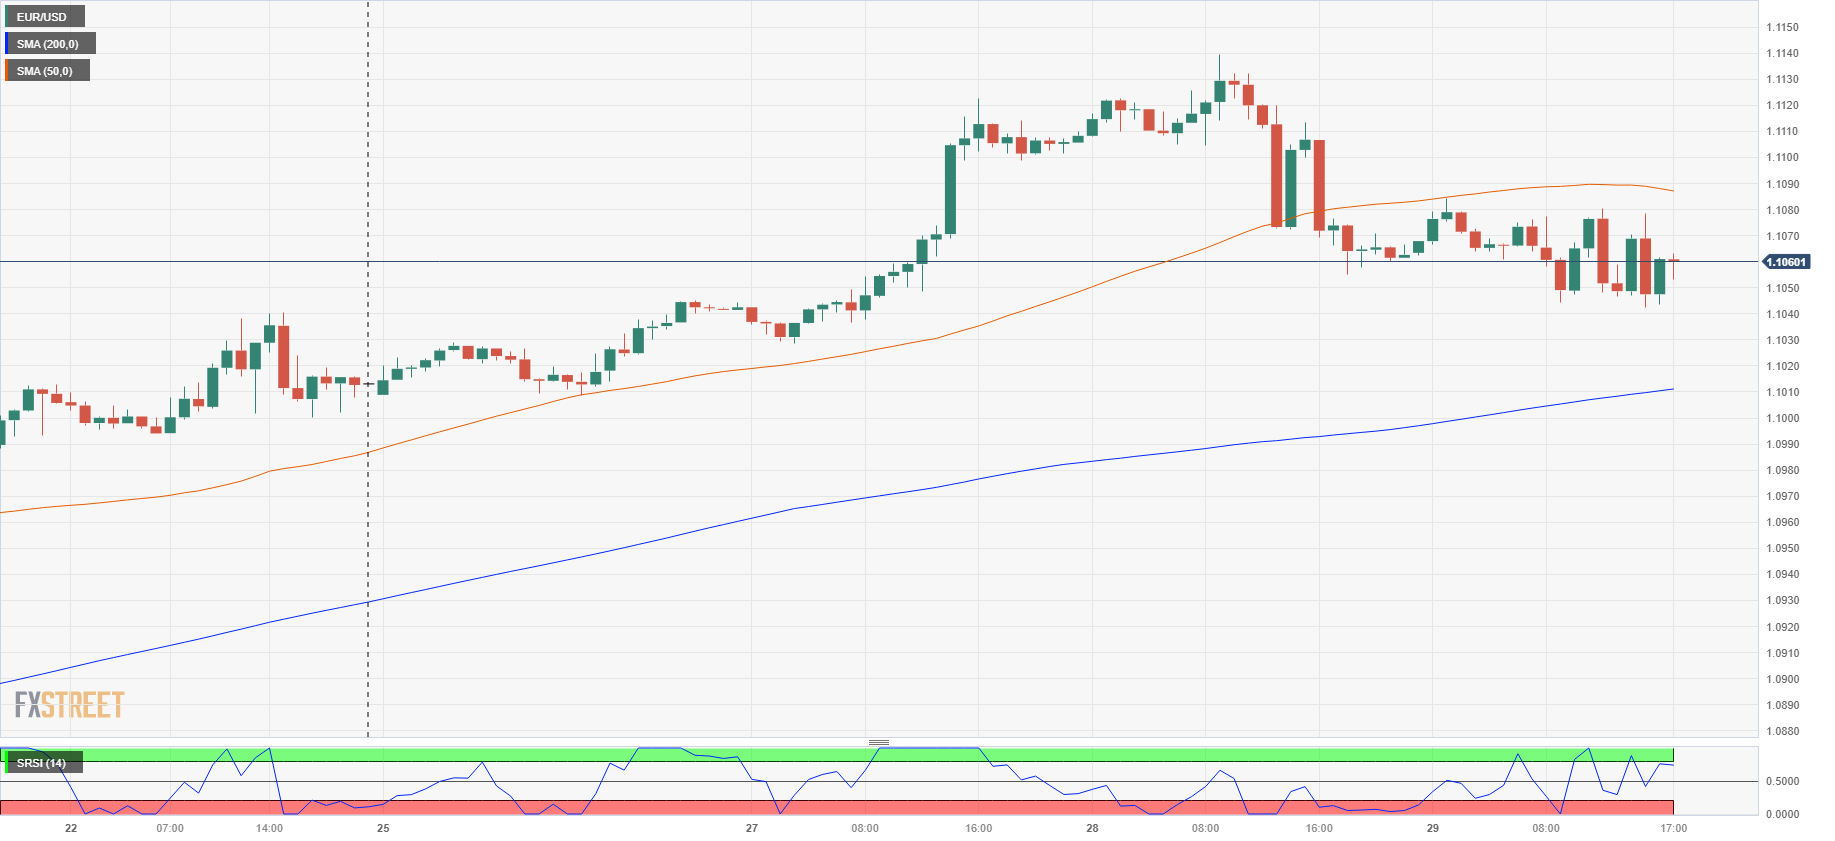
EUR/USD hit a fresh monthly highs above 1.1100, but then pulled back towards 1.1050. It posted its third consecutive week of gains, but the upward movement is losing momentum. On Wednesday, the final Manufacturing PMI will be released, and on Thursday, the final Service PMI. The crucial data for the week will be on Friday, with Eurostat releasing the Eurozone preliminary December Consumer Price Index (CPI). The preliminary figures from Spain are a good omen. Spain's Consumer Price Index slowed to 3.1% in December from a year ago, which was below the market consensus of 3.4%. The core rate also eased to 3.8%, the lowest since March 2022.
USD/JPY posted the lowest weekly close since July and suffered the biggest monthly loss in a year. The pair dropped towards 140.00 on expectations that the Fed will cut rates next year while the Bank of Japan (BoJ) is expected to exit its negative interest rate policy.
GBP/USD failed to hold above 1.2800 and retraced. Gains appear limited while trading below that level. EUR/GBP briefly surpassed 0.8700 before pulling back towards 0.8650.
The Chinese PMI data next week could be important for risk appetite and the Australian and New Zealand currencies. AUD/USD recorded its sixth weekly gain out of the last seven weeks and is holding above the 100-week Simple Moving Average (SMA). The pair closed the week around 0.6830.
USD/CAD fell below the 100-week SMA and is testing strong support around 1.3100. Canada will release the employment report on Friday.
And the currency of the year is…
The Mexican Peso and the Colombian Peso were the best performers in 2023. On the other hand, the Argentine Peso, the Turkish Lira, and the Russian Ruble fared the worst.
Among G10 currencies, the Swiss Franc performed the best. USD/CHF had its worst year in a decade. Despite seeing a recovery during the fourth quarter, the Japanese Yen suffered the main losses. USD/JPY rose for the third consecutive year but respected the 152.00 barrier. The outlook for the Yen appears to have improved compared to 12 months ago.
This is the last Forex Today for 2023. Wishing you a Happy New Year and a prosperous year ahead. Thank you!
- EUR/USD is holding steady in thin markets to wrap up the trading year.
- The Euro is set for a 3% gain against the US Dollar for the year.
- US data continues to miss the mark as the economic outlook softens.
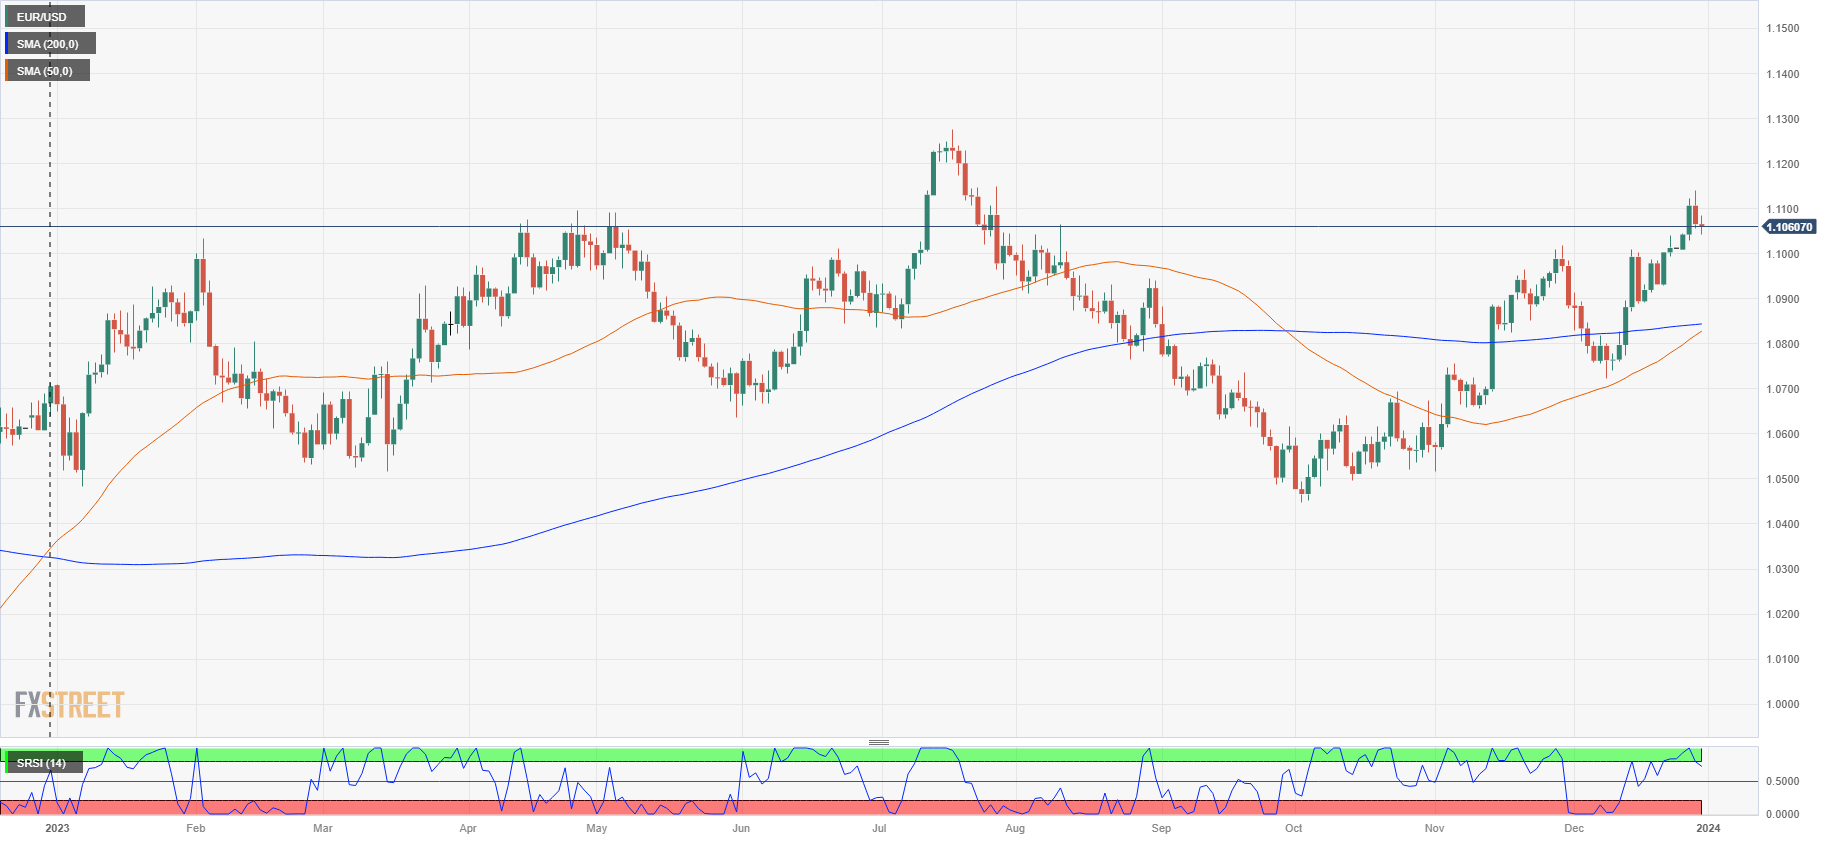
The EUR/USD is trading flat on Friday, the last trading session of 2023. The Euro (EUR) is on pace to close up 3% against the US Dollar (USD) for 2023, rallying 5.8% from the year’s bottom bids near 1.0450 in October. The EUR/USD is still down nearly 2% from 2023’s peak at 1.1275 set in July, but the pair is leaning firmly into the bullish side as broader markets continue to sell off the Greenback in anticipation of rate cuts from the Federal Reserve (Fed) in 2024.
US Dollar to end 2023 on the low side as markets bet big on rate cuts
With meaningful Eurozone economic data absent from the calendar until the HCOB Eurozone Composite Purchasing Managers’ Index (PMI) on January 4, it’s up to the US data docket to do the heavy lifting to round out the trading year.
The US Chicago PMI for December missed the mark on Friday, printing at a contractionary 46.9 versus November’s 18-month peak of 55.8, slipping past the median market forecast of 51.0. Softening economic data from the US continues to counter-intuitively bolster market risk appetite, as a weakening economic outlook increases the odds of an accelerated pace of rate hikes from the Fed in 2024. Investor expectations have run well ahead of the Fed’s own rate outlook for next year, which currently sees up to 75 basis points in rate cuts through the end of 2024; money markets are pricing in upwards of 160 basis points to come off the Fed’s main reference rate by the end of next December.
EUR/USD Technical Outlook
With the EUR/USD stuck in place near 1.1050 on the intraday charts, the Euro is set to drift between the 50-hour and 200-hour Simple Moving Averages (SMAs) as the 2023 trading year rounds the corner into 2024.
A protracted post-holiday trading week will give way to another extended holiday following the New Year’s market closures, and the EUR/USD is set to head into the new year catching technical support from the 200-hour SMA just above the 1.1000 handle.
Daily candlesticks tell a notably overbought story with the Euro pulling back from Thursday’s multi-month highs near 1.1150 and the 50-day SMA accelerating into a bullish cross of the 200-day SMA near 1.0850. Technical indicators are also flashing warning signs of a possible extended pullback with the Relative Strength Index (RSI) flashing a retreat from overbought conditions on a 14-day basis.
EUR/USD Hourly Chart
EUR/USD Daily Chart
EUR/USD Technical Levels
- The DXY index trimmed gains and declined towards 101.20.
- The only highlight during the session was December’s Chicago PMI, which came in lower than expected.
- US Treasury yields remain near multi-month lows.
The US Dollar (USD) remains on a subdued tone on the last trading day of 2023. The US Dollar Index (DXY) is positioned at 101.20, shedding daily gains as dovish bets on the Federal Reserve (Fed) weigh heavily on the Greenback. Soft Chicago PMI figures for December also added pressure to the currency on a quiet Friday.
The Federal Reserve's dovish stance, welcoming cooling inflation figures, ruling out rate hikes in 2024, and forecasting 75 bps of easing recently drove demand out of the US Dollar to riskier assets. As for now, the market is anticipating a rate cut in March with an additional adjustment in May. Next week, the US will release key labor market data, which will help investors place their bets for the next Fed decisions.
Daily digest market movers: US Dollar trades soft as dovish bets and poor December Chicago PMI add pressure
- The Chicago PMI report issued by the Institute for Supply Management of Chicago for December recorded 46.9, falling short of the consensus of 51 and the previous figure of 55.8.
- Next week, the highlights in the US calendar will be December’s Nonfarm Payrolls, Average Hourly Earnings, and the Unemployment Rate.
- Yields on US bonds struggle to advance, holding near multi-month lows. Specifically, the 2-year yield is recorded at 4.25%, while the 5-year and 10-year yields stand at 3.84% and 3.85%, respectively.
- The CME FedWatch Tool indicates a low probability for a rate hike in the January meeting with just 15% odds for a cut. Moreover, market sentiment is leaning towards rate cuts for March and May 2024.
Technical Analysis: DXY index bearish pressure persists despite potential for a minor correction
The indicators on the DXY daily chart reflect a predominantly bearish sentiment. With the index considerably below its 20, 100, and 200-day Simple Moving Averages (SMAs), the bears appear to be in control on the broader scale. This is further emphasized by the Relative Strength Index (RSI) nearing oversold conditions, which aligns with the overall index's bearish outlook.
The Moving Average Convergence Divergence (MACD) showcases rising red bars, demonstrating a slight surge in selling pressure. This might trigger a conservative buying signal for contrarian investors looking to seize an opportunity in this oversold market condition.
In short, the selling momentum seems to dominate, but due to the oversold RSI and rising MACD red bars, a minor upward momentum can be expected.
Support levels: 100.70, 100.50, 100.30.
Resistance levels: 101.30, 101.50, 101.70.
US Dollar FAQs
What is the US Dollar?
The US Dollar (USD) is the official currency of the United States of America, and the ‘de facto’ currency of a significant number of other countries where it is found in circulation alongside local notes. It is the most heavily traded currency in the world, accounting for over 88% of all global foreign exchange turnover, or an average of $6.6 trillion in transactions per day, according to data from 2022.
Following the second world war, the USD took over from the British Pound as the world’s reserve currency. For most of its history, the US Dollar was backed by Gold, until the Bretton Woods Agreement in 1971 when the Gold Standard went away.
How do the decisions of the Federal Reserve impact the US Dollar?
The most important single factor impacting on the value of the US Dollar is monetary policy, which is shaped by the Federal Reserve (Fed). The Fed has two mandates: to achieve price stability (control inflation) and foster full employment. Its primary tool to achieve these two goals is by adjusting interest rates.
When prices are rising too quickly and inflation is above the Fed’s 2% target, the Fed will raise rates, which helps the USD value. When inflation falls below 2% or the Unemployment Rate is too high, the Fed may lower interest rates, which weighs on the Greenback.
What is Quantitative Easing and how does it influence the US Dollar?
In extreme situations, the Federal Reserve can also print more Dollars and enact quantitative easing (QE). QE is the process by which the Fed substantially increases the flow of credit in a stuck financial system.
It is a non-standard policy measure used when credit has dried up because banks will not lend to each other (out of the fear of counterparty default). It is a last resort when simply lowering interest rates is unlikely to achieve the necessary result. It was the Fed’s weapon of choice to combat the credit crunch that occurred during the Great Financial Crisis in 2008. It involves the Fed printing more Dollars and using them to buy US government bonds predominantly from financial institutions. QE usually leads to a weaker US Dollar.
What is Quantitative Tightening and how does it influence the US Dollar?
Quantitative tightening (QT) is the reverse process whereby the Federal Reserve stops buying bonds from financial institutions and does not reinvest the principal from the bonds it holds maturing in new purchases. It is usually positive for the US Dollar.
- The Mexican Peso is rebounding from Thursday’s US session backslide.
- Mexico's government budget balance to wrap up economic calendar for 2023.
- US data continues to print in the red, US Chicago PMI misses the mark.
The Mexican Peso (MXN) is back on the rise for the last trading day of 2023, recovering modestly after a late-day topside break in the US Dollar on Thursday sparked by a broad-market pause in risk appetite after US Treasury yields briefly spiked.
Market risk sentiment recovered on Friday, dragging the MXN back into familiar levels to wrap up the 2023 trading year. After Friday’s MXN Fiscal Balance, economic data from Mexico will be on pause until Mexico's Consumer Confidence figures print on January 8.
US economic calendar figures broadly missed the mark on Thursday, and the trend continued into Friday after the US Chicago Purchasing Managers’ Index (PMI) declined in December, slipping back from an 18-month high in November as a global economic slowdown continues to loom ahead.
Daily digest market movers: Mexican Peso squeezing back into the top end to wrap up the year
- The Mexican Peso is recovering from Thursday’s backslide, sticking close to the high side against the US Dollar as broad market sentiment holds steady.
- US data continues to miss the mark, but investors continue to focus solely on whatever will kickstart a rate-cutting cycle.
- The US Chicago Purchasing Managers’ Index (PMI) declined to 46.9 in December, falling back from November’s 18-month high of 55.8 and passing straight through the median forecast of 51.0.
- Softening economic conditions in the US continue to bolster market hopes of an accelerated pace of rate cuts from the US Federal Reserve (Fed) as investors bet that what’s bad for the goose is good for the gander.
- Mexico’s Fiscal Balance in Peso terms will round out the year’s economic calendar for the MXN.
- The Mexican government’s budget update last showed a MXN 29.58 billion deficit.
US Dollar price today
The table below shows the percentage change of US Dollar (USD) against listed major currencies today. US Dollar was the strongest against the Euro.
| USD | EUR | GBP | CAD | AUD | JPY | NZD | CHF | |
| USD | 0.11% | -0.02% | -0.18% | 0.11% | -0.31% | 0.02% | -0.17% | |
| EUR | -0.10% | -0.12% | -0.30% | -0.01% | -0.40% | -0.10% | -0.28% | |
| GBP | 0.02% | 0.12% | -0.18% | 0.12% | -0.29% | 0.02% | -0.14% | |
| CAD | 0.20% | 0.31% | 0.18% | 0.31% | -0.12% | 0.21% | 0.04% | |
| AUD | -0.11% | 0.01% | -0.12% | -0.30% | -0.41% | -0.09% | -0.24% | |
| JPY | 0.31% | 0.43% | 0.29% | 0.13% | 0.42% | 0.32% | 0.15% | |
| NZD | -0.02% | 0.10% | -0.02% | -0.20% | 0.09% | -0.31% | -0.17% | |
| CHF | 0.16% | 0.28% | 0.14% | -0.03% | 0.24% | -0.12% | 0.16% |
The heat map shows percentage changes of major currencies against each other. The base currency is picked from the left column, while the quote currency is picked from the top row. For example, if you pick the Euro from the left column and move along the horizontal line to the Japanese Yen, the percentage change displayed in the box will represent EUR (base)/JPY (quote).
Technical Analysis: Mexican Peso looking to recover into recent highs as the year draws to a close
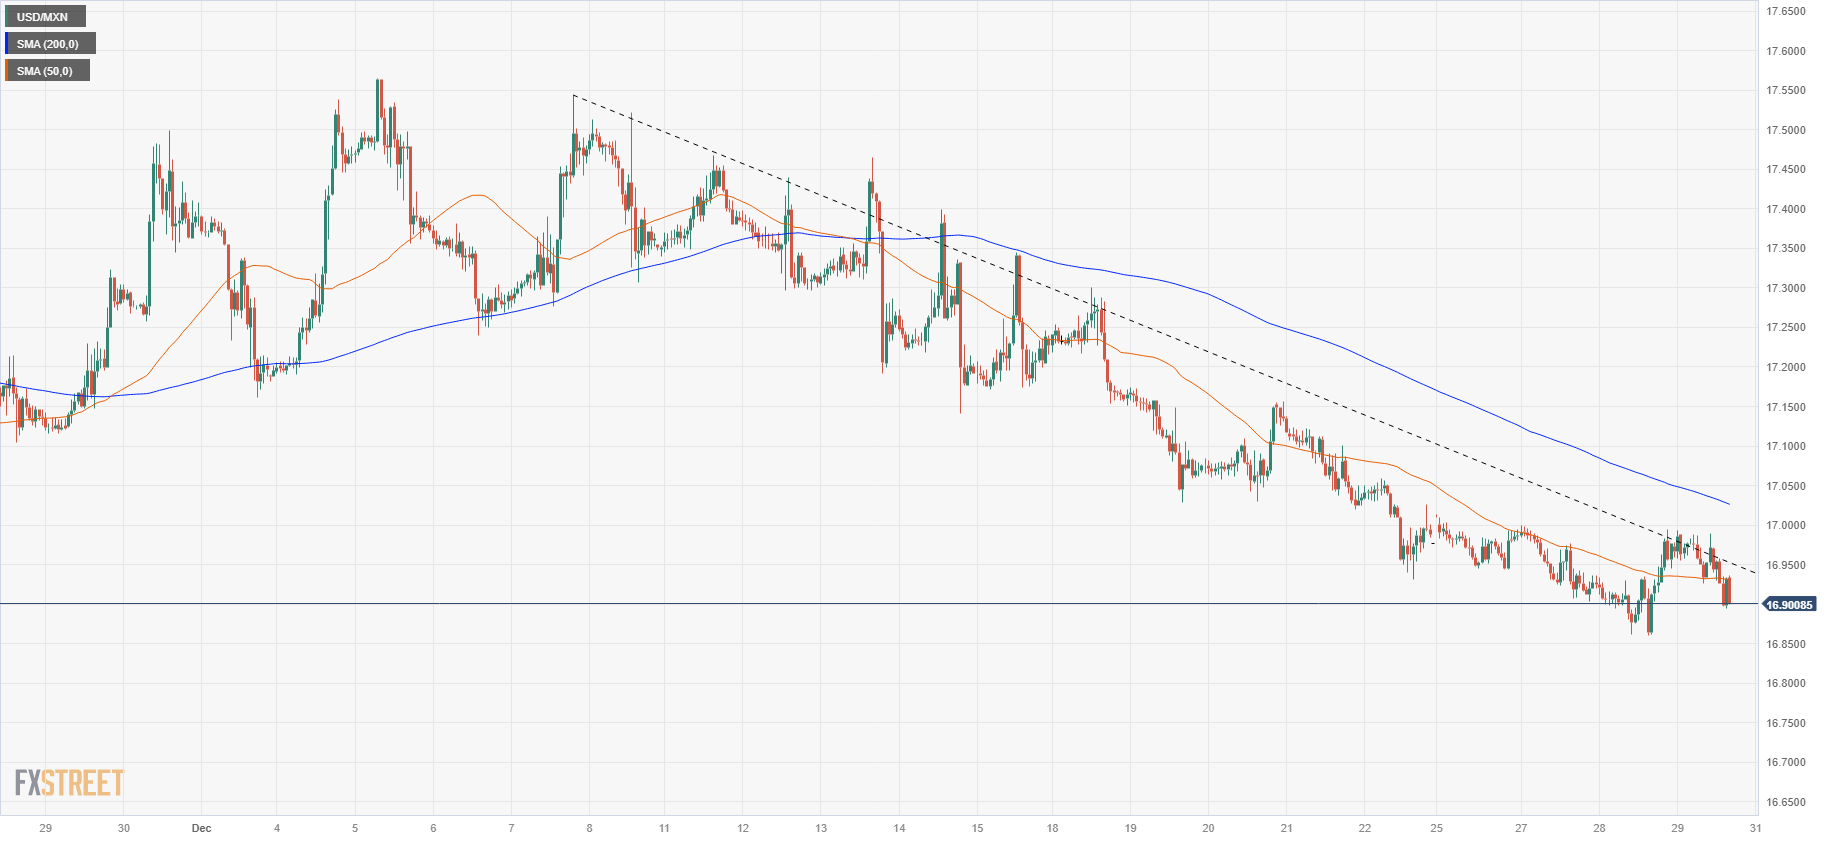
The Mexican Peso (MXN) is trading into familiar levels on Friday after Thursday’s test into a new multi-month high against the US Dollar (USD) with broad-market risk flows setting the direction of USD-based currency pairs.
A brief pullback saw the USD/MXN retreat to a near-term falling trendline before returning to the low side amidst market-wide short pressure on the Greenback.
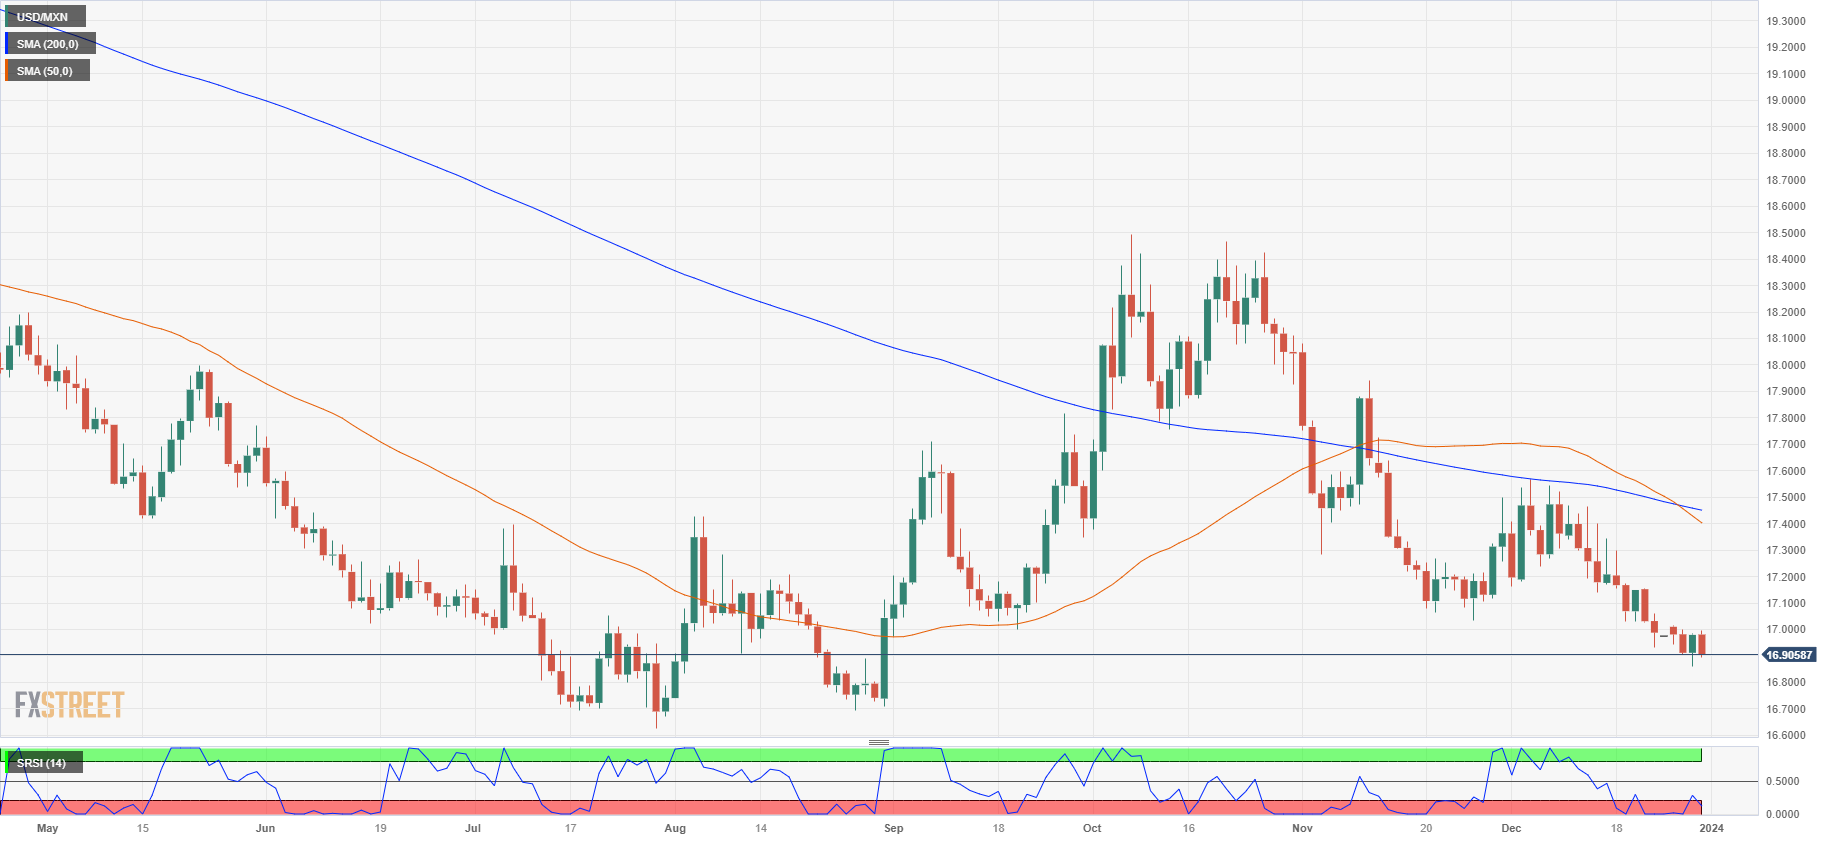
Despite the USD/MXN firmly pinned into the low end and the 50-day Simple Moving Average (SMA) confirming a bearish cross of the long-term 200-day SMA near 17.45, technical traders will note that indicators have been hovering into oversold conditions for some time, leaving the USD/MXN exposed to an extended recovery until hitting technical resistance at the 200-day SMA. The last swing high region is also priced in near 17.50.
USD/MXN Hourly Chart
USD/MXN Daily Chart
Mexican Peso FAQs
What key factors drive the Mexican Peso?
The Mexican Peso (MXN) is the most traded currency among its Latin American peers. Its value is broadly determined by the performance of the Mexican economy, the country’s central bank’s policy, the amount of foreign investment in the country and even the levels of remittances sent by Mexicans who live abroad, particularly in the United States. Geopolitical trends can also move MXN: for example, the process of nearshoring – or the decision by some firms to relocate manufacturing capacity and supply chains closer to their home countries – is also seen as a catalyst for the Mexican currency as the country is considered a key manufacturing hub in the American continent. Another catalyst for MXN is Oil prices as Mexico is a key exporter of the commodity.
How do decisions of the Banxico impact the Mexican Peso?
The main objective of Mexico’s central bank, also known as Banxico, is to maintain inflation at low and stable levels (at or close to its target of 3%, the midpoint in a tolerance band of between 2% and 4%). To this end, the bank sets an appropriate level of interest rates. When inflation is too high, Banxico will attempt to tame it by raising interest rates, making it more expensive for households and businesses to borrow money, thus cooling demand and the overall economy. Higher interest rates are generally positive for the Mexican Peso (MXN) as they lead to higher yields, making the country a more attractive place for investors. On the contrary, lower interest rates tend to weaken MXN.
How does economic data influence the value of the Mexican Peso?
Macroeconomic data releases are key to assess the state of the economy and can have an impact on the Mexican Peso (MXN) valuation. A strong Mexican economy, based on high economic growth, low unemployment and high confidence is good for MXN. Not only does it attract more foreign investment but it may encourage the Bank of Mexico (Banxico) to increase interest rates, particularly if this strength comes together with elevated inflation. However, if economic data is weak, MXN is likely to depreciate.
How does broader risk sentiment impact the Mexican Peso?
As an emerging-market currency, the Mexican Peso (MXN) tends to strive during risk-on periods, or when investors perceive that broader market risks are low and thus are eager to engage with investments that carry a higher risk. Conversely, MXN tends to weaken at times of market turbulence or economic uncertainty as investors tend to sell higher-risk assets and flee to the more-stable safe havens.
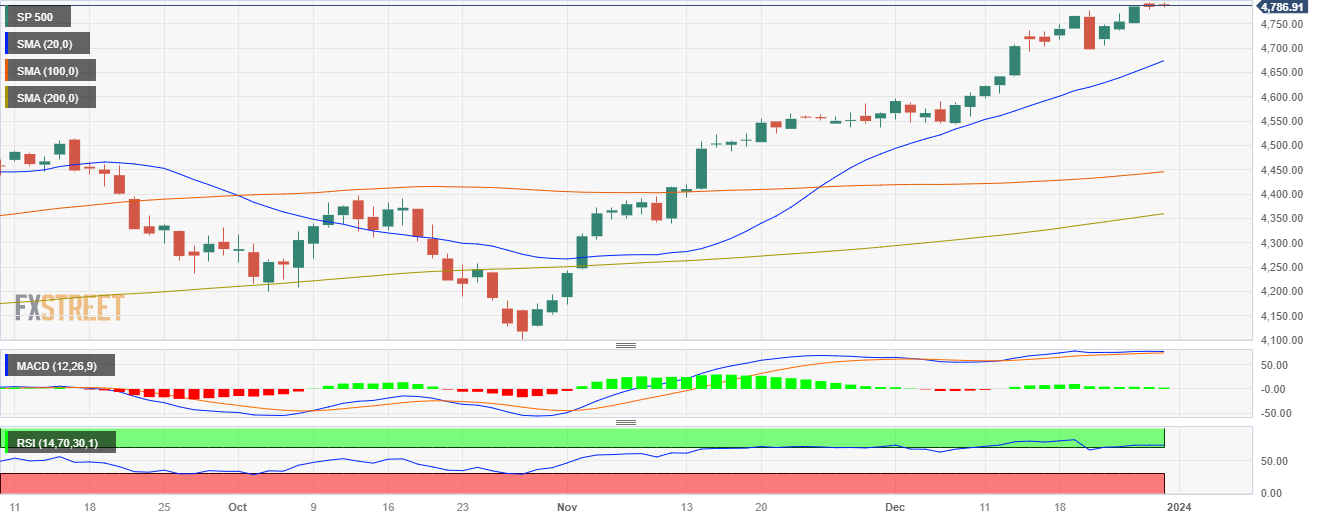
- The S&P 500 is flat around 4,785.
- Market expectations of 160 bps easing in 2024 by the Fed ignited the flows to stocks in the last sessions.
- The Index is up by more than 20% in 2023.
In Friday's session, the S&P 500 index stands at 4,785.50 as bullish momentum seems to be flatting in the last trading day of 2023. In that sense, the stock index will close a 24% yearly gain and tallies its ninth consecutive winning week, so downward movements may be on the horizon to consolidate gains.
Recently, capital flows were redirected to stocks as at its final 2023 meeting, the Federal Reserve recognized an inflation deceleration, assuring no rate increases in 2024 and hinting at a 75 bps adjustment. As interest rates and stocks are negatively correlated, the expectations of a less aggressive Fed next year made riskier assets rally.
In the meantime, US yields are consolidating near multi-month lows. The 2-year rate stands at 4.29%, while the 5 and 10-year yields are observed at 3.87%, all three with slight gains and with upward movements seem to limit the upside for the stock index. In addition, the US Dollar measured by the DXY index also recovered and jumped to 101.35, which also presents a challenge to the S&P.
In the first week of 2024, the United States is set to release data related to its employment sector, a critical resource for gauging economic health, which may have an impact on Fed expectations. Those reports include December's Nonfarm Payrrol report, the Average Hourly Earning, and the Unemployment Rate, all closely followed by the Fed.
S&P 500 levels to watch
The daily chart indicates a conflict between short- and long-term market forces, precipitating volatile conditions. Evidently, the Relative Strength Index (RSI) presents flat overbought conditions, signaling an impending bearish shift as traders may look to sell to realize their profits. However, the Moving Average Convergence Divergence (MACD) histogram's flat, yet green bars point toward the bulls retaining some of their momentum.
In a broader context, the index's position above the 20, 100, and 200-day Simple Moving Averages (SMAs) mirrors a bullish outlook in the longer term. Despite any short-term fluctuations, the weight of these SMAs suggests that the buying force currently holds significant sway over the index's ongoing trend. Thus, the bullish traction should not be underestimated in the coming trading sessions.
S&P 500 daily chart
- USD/CAD rebounds to near 1.3260, following footprints of the US Dollar.
- The Fed may start reducing interest rates from March 2024.
- Lower oil prices due to trade resumption from the Red sea have impacted the Canadian Dollar.
The USD/CAD pair jumps to near 1.3260 in the early New York session after recovering from the crucial support of 1.3180. The Loonie asset discovered significant bids after a decent recovery in the US Dollar Index (DXY) and a sheer sell-off in the oil prices.
The S&P500 is expected to open on a flat note, portraying a quiet market mood. Trading activity is quite thin due to festive mood. The USD Index has recovered to near 101.40 while the broader bias is still bearish as investors hope that the Federal Reserve (Fed) will cut interest rates earlier-than-projected.
As per the CME Fedwatch tool, there is a 73% chance that the Fed will reduce interest rates by 25 basis points (bps) to 5.00-5.25%. The probability that the Fed will continue reducing borrowing rate in May too is 72%.
Apart from easing price pressures, loosening labour market conditions in the United States economy would compel Fed policymakers to endorse rate cuts. The US Department of Labour reported higher-than-projected Initial Jobless Claims (IJC) for the week ending December 22. Individuals claiming jobless benefits were 218K, higher than the consensus of 210K and the former reading of 206K.
On the Canadian Dollar front, lower oil prices due to resumption of commercial shipment activities from the Red Sea route have dampened demand for the Canadian Dollar. Investors should note that Canada is the leading exporter of oil to the United States and lower oil prices impact the Canadian Dollar.
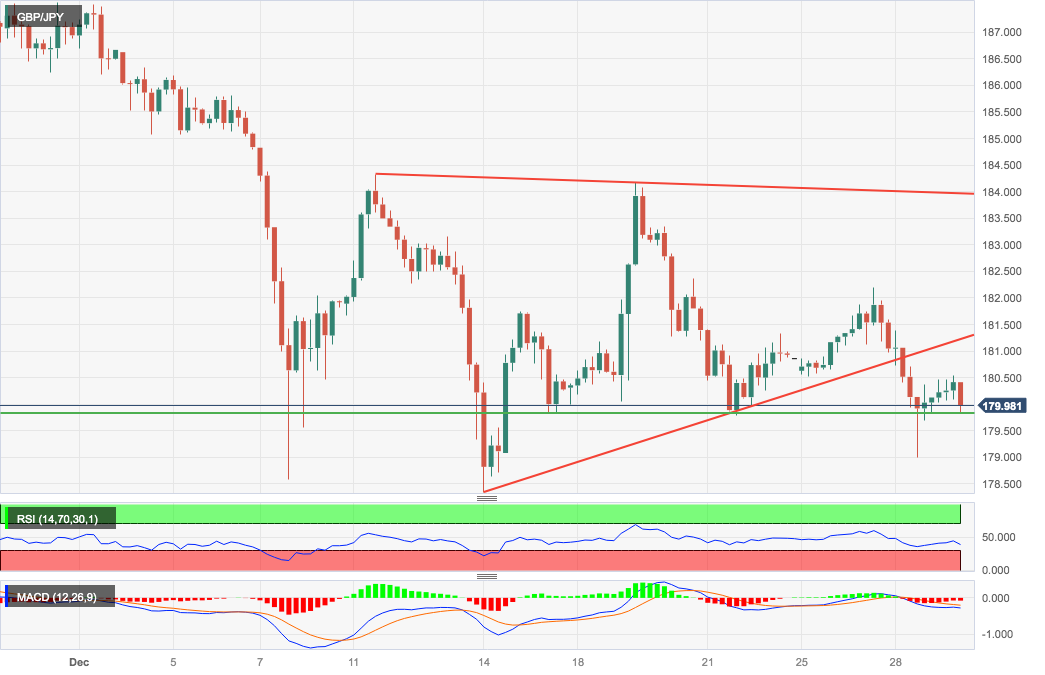
- The Sterling is under increasing bearish pressure aiming to levels sub-180.
- Trading volume is light in the last session of the year.
- Below 180.00 the target will be October and November lows at the 178.10/30 area.
The Sterling trades under increasing bearish pressure after breaking below the base of a triangle pattern, at 180.80. The frail upside attempt seen on early Friday Trading has remained limited at the mid-range of 180.00, and the pair is testing support at the 179.85 level at the moment of writing.
Trading volume is very light on the last working day of the year, leading to choppy movement in most of the major pairs.
Technical indicators point lower, with the RSI well below the 50 level. Bears would need to confirm below the mentioned 179.45 which would expose the mid-December low, at 178.30, and the October 3 low, at 178.10.
On the upside, a bullish reaction above the reverse trendline, now at 181.00 would ease downside pressure and put the 182.35 resistance level back into play.
GBP/JPY 4-hour chart
Technical levels to watch
- NZD/USD drops gradually from 0.6360 amid recovery in the US Dollar.
- Investors see the Fed reducing interest rates from March 2024.
- NZD/USD delivers a breakdown of the upward-sloping chart pattern.
The NZD/USD pair faces nominal sell-off near 0.6360 as the US Dollar has attempted a recovery move despite thin trading activity. The Kiwi asset struggled to extend recovery as the higher risk-appetite of the market participants is fading away.
The US Dollar Index (DXY) has rebounded to near 101.20 but the broader appeal is still bearish as investors hope that the Federal Reserve (Fed) will start reducing interest rates from March 2024. Consistently easing price pressures and labour market conditions would allow Fed policymakers to endorse rate cut decision.
Next week, further action in the US Dollar will be guided by the Manufacturing PMI and the Employment data for December. While the New Zealand Dollar will be in action due to the release of the Caixin manufacturing PMI data for December.
NZD/USD is at a make or a break level around 0.6300. The asset has delivered a breakdown of the Rising Channel chart pattern formed on an hourly scale. The 20-period Exponential Moving Average (EMA) has started declining, which indicates that the near-term trend has turned bearish.
A range shift move by the Relative Strength Index (RSI) (14) into the 20.00-60.00 region from the bullish territory of 40.00-80.00 indicates a bearish momentum.
Fresh downside move appear if the asset drops below December 25 low at 0.6246. This would expose the asset to November 29 high at 0.6208 and December 14 low at 0.6168.
In an alternate scenario, a recovery move above December 28 high of 0.6370 would drive the asset towards December 26 high near 0.6410. Breach of the latter would open upside for February 2 near 0.6463.
NZD/USD hourly chart
-638394526908378535.png)
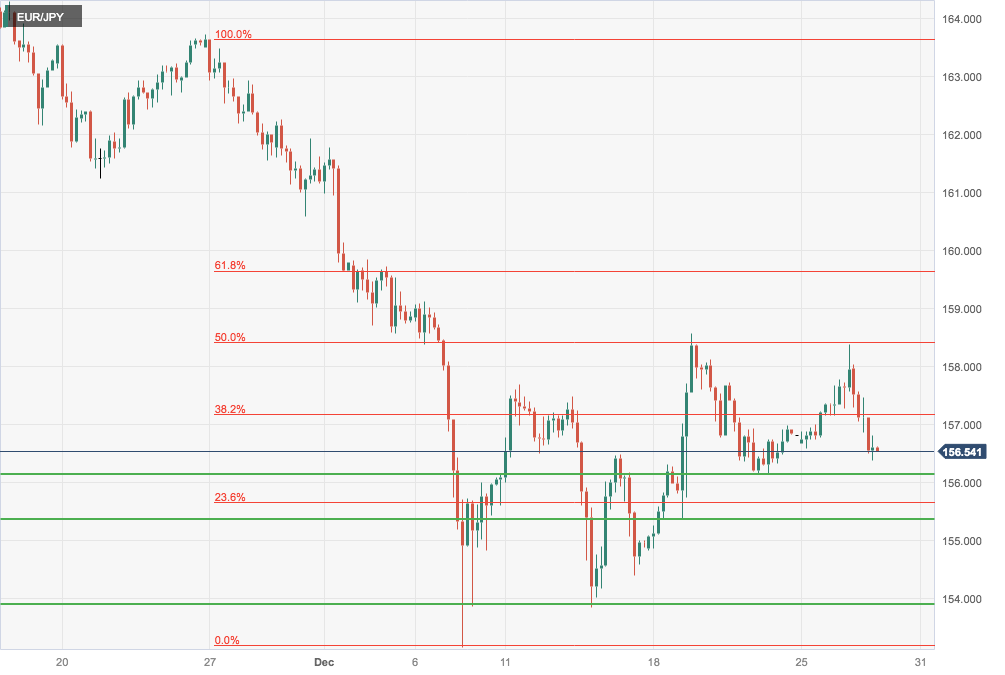
- The Euro downside attempts have been capped above 156.00.
- The pair is consolidating after the late November decline.
- Euro bulls will face strong resistance at 158.45.
The Euro is looking for direction on a light session on the last trading day of the year. The pair´s reversal from 158.45 has been contained at the 156.10 support area with 1.57.00 capping bulls so far.
Looking from a broader perspective, the pair is in a consolidation pattern, following a bearish impulse from November highs above 164.00
Technical indicators are mixed, with the RSI flat near the 50 level which shows a lack of clear direction. On the episode, the mentioned 157.00 is closing the path towards key resistance at 158.45, the 5o% retracement of the late November sell-off.
On the downside, immediate support lies at the mentioned 156.10, and below here, 155.35, and the December 14 low at 154.00.
EUR/JPY 4-hour Chart
Technical levels to watch
- The US Dollar trades flat after its recovery in the close at the US session on Thursday.
- Equity markets are set to close off the year on a high note.
- The US Dollar Index pops back above 101, though flirts with a final close below it.
The US Dollar (USD) is trading sideways for now on this last Friday of the year and the very last trading day of 2023. Looking back at its performance overall for this year, the Greenback has lost only around 3% Year-To-Date on the US Dollar Index (DXY) chart since its first opening in January. The big theme for 2024 going forward looks to be whether markets have been too eager to price in rate cuts for the US Federal Reserve, or has the Fed lost its control and made a policy error?
On the economic front, traders can scalp the last pips of profit with the Chicago Purchase Managers Index (PMI) coming out this Friday. The Jobless Claims numbers from Thursday already triggered a small turnaround for the DXY. Should this Friday’s PMI numbers stay above 50 and even beat the expectation, the Greenback might make good on some earlier losses from this week.
Daily digest Market Movers: ‘It’s oh so quiet’
- Last data point for 2023 is printed near 14:45 GMT with the Chicago Purchase Managers Index. Expected is a decline from 55.8 to 51. A drop below 50, would mean contraction and will be substantially US Dollar negative, while either a beat of expectations or a print above the previous might see a very steep US Dollar rally in its turn.
- On the geopolitical front Russia has started a new missile offensive against Ukraine with several key cities being bombarded, casualties rising by the hour.
- Former US President Donald Trump will be placed back on the primary ballot in Colorado, though he is barred in the US State of Maine for the Primaries in March.
- Equities are extending the Christmas spirit and are trying to eke out those last percentage points of gains.
- Officially Japan has already closed off for this year and saw the Topix close up near 28% for 2023. The Topix closed off just above 25% for 2023.
- In China the Hang Seng Index was a bit of a let down for 2023, with the Index closing off down 13.82% for 2023.
- In Europe the German Dax is currently up over 0.25% for this Friday with a nice 20% return for 2023.
- In the US, Futures are all in the green for this Friday, prolonging the Christmas rally in the New Year. Overall for 2023, the Dow Jones is near 13% in the green for its overall performance, the S&P 500 near 25% profit and the Nasdaq around 44% gains.
- The CME Group’s FedWatch Tool shows that markets are pricing in an 83.5% chance that the Federal Reserve will keep interest rates unchanged at its January 31 meeting. Around 16.5% expect the first cut already to take place.
- The benchmark 10-year US Treasury Note trades near 3.84%, off the lows and sees a bit of a squeeze to the upside since Thursday.
US Dollar Index Technical Analysis: The mind contradicts the heart
The US Dollar Index is having a change of heart on this last day of 2023. The window of opportunity is closing for traders who were short the Greenback and want to cash in on this rally. Expect to see some more US Dollar strength filter in on this last day of 2023, with traders starting to trigger more demand of US Dollar to cash in on their positions and start with a clean sheet in 2024.
First upside resistance to face is near 101.78 at the low of December 21. Although a long way to go, it looks not unthinkable that the DXY might test the descending trend line near 103.00. Depending on the catalyst that fuels the recovery in the Greenback, the 200-day Simple Moving Average (SMA) near 103.45 is firm last resistance before having more upside.
To the downside, the pivotal level at 101.70 – the low of August 4 and 10 – is now gone and holds no bearing anymore for support as it is too badly beaten up. The new support, near 100.82, aligns with the bottoms from February and April, and could still hold some relevance – it might hold for this Friday. Should that level snap, however, nothing will stand in the way of DXY heading to the sub-100 region.
US Dollar FAQs
What is the US Dollar?
The US Dollar (USD) is the official currency of the United States of America, and the ‘de facto’ currency of a significant number of other countries where it is found in circulation alongside local notes. It is the most heavily traded currency in the world, accounting for over 88% of all global foreign exchange turnover, or an average of $6.6 trillion in transactions per day, according to data from 2022.
Following the second world war, the USD took over from the British Pound as the world’s reserve currency. For most of its history, the US Dollar was backed by Gold, until the Bretton Woods Agreement in 1971 when the Gold Standard went away.
How do the decisions of the Federal Reserve impact the US Dollar?
The most important single factor impacting on the value of the US Dollar is monetary policy, which is shaped by the Federal Reserve (Fed). The Fed has two mandates: to achieve price stability (control inflation) and foster full employment. Its primary tool to achieve these two goals is by adjusting interest rates.
When prices are rising too quickly and inflation is above the Fed’s 2% target, the Fed will raise rates, which helps the USD value. When inflation falls below 2% or the Unemployment Rate is too high, the Fed may lower interest rates, which weighs on the Greenback.
What is Quantitative Easing and how does it influence the US Dollar?
In extreme situations, the Federal Reserve can also print more Dollars and enact quantitative easing (QE). QE is the process by which the Fed substantially increases the flow of credit in a stuck financial system.
It is a non-standard policy measure used when credit has dried up because banks will not lend to each other (out of the fear of counterparty default). It is a last resort when simply lowering interest rates is unlikely to achieve the necessary result. It was the Fed’s weapon of choice to combat the credit crunch that occurred during the Great Financial Crisis in 2008. It involves the Fed printing more Dollars and using them to buy US government bonds predominantly from financial institutions. QE usually leads to a weaker US Dollar.
What is Quantitative Tightening and how does it influence the US Dollar?
Quantitative tightening (QT) is the reverse process whereby the Federal Reserve stops buying bonds from financial institutions and does not reinvest the principal from the bonds it holds maturing in new purchases. It is usually positive for the US Dollar.
- The extends its corrective reversal and explores levels below 0.6800.
- Hopes of Fed cutts in 2024 are keeping US Dollar bulls in check.
- AUD/USD is set to end the year practically unchanged.
The Australian Dollar is on a corrective reversal from multi-month highs at 0.6870, reaching intra-day lows right below 0.6800 as the US Dollar pares previous days’ losses in a light trading session.
The pair is on track to end the year practically unchanged as the last two months’s rally has contributed to erasing losses after a sharp decline in the first half of the year.
The US Dollar is regaining lost ground on the last trading day of the year, although yet with market speculation of Fed cuts in 2024 is likely to limit gains.
In the calendar today, the Chicago PMI is expected to confirm the softer economic outlook suggested by the higher-than-expected jobless claims and the stalling home sales seen on Thursday.
From a broader perspective, the bias remains positive, with the current reversal seen as a correction from overbought levels. Immediate support lies at 0.6780 and below here, 0.6720. On the upside, resistances are at 0.6845 and 0.6870.
Technical levels to watch
- WTI Oil drops back below $74, under important support.
- API overnight print was double the previous build.
- The DXY US Dollar Index sells off further and snaps below 101.
Oil prices are flat whilst residing below $74 with some downside pressure building. Saudi Arabia has cut its key Oil price by $1.25 per barrel for deliveries in Asia as of February. The news comes not from Saudi Aramco itself, but from three independent refiners in Asia who closed recent contracts.
The US Dollar (USD) meanwhile is back in green numbers on this very last trading day of 2023, adding a bearish bias to Dollar-denominated Oil. The turnaround comes on the back of still steady tight Jobless Claims in the US in both the continuing and initial Claims. This is reining in rampant interest-rate cutting speculation. Meanwhile traders are cleaning up their trading sheets and are closing their US Dollar short positions, which is triggering a demand of the Greenback in order to close off those positions.
Crude Oil (WTI) trades at $72.14 per barrel, and Brent Oil trades at $77.55 per barrel at the time of writing.
Oil News and Market Movers: Aramco undercuts crude prices
- Saudi Aramco has offered discounts on its February prices by $1.25 per barrel. The discounts are applicable on their Asian sales.
- US Crude inventories took a nosedive move of 7.11 million barrels on Thursday. The biggest one-week drawdown since August.
- The Pentagon is trying to provide assurances for shipping companies to pass via the Red Sea and Suez Canal again.
- Russia has launched a new missile attack on Ukraine, targeting key cities in the country with heavy casualties.
Oil Technical Analysis: EIA under pressure from US Oil dump
Oil prices were unable to jump higher after the biggest drawdown of the US stockpile since August. The fact that Oil cannot advance even on such a chunky decline with the knowledge that the reserve needs to be refilled again, means that markets are more concerned about Saudi Arabia. The fact that the country, one of the OPEC+ countries which bears supply cuts, is selling Crude at a discount, means that OPEC+ is losing further control and grip on the Oil market.
On the upside, $74 is still holding some importance, although the level has become very chopped up. Once back above there, $80 comes into the picture. Although still far off, $84 is next on the topside once Oil sees a few daily closes above the $80 level.
Below $74, the $67 level could still come into play as the next support level to trade at as it aligns with a triple bottom from June. Should that triple bottom break, a new low for 2023 could be close at $64.35 – the low of May and March – as the last line of defence. Although still quite far off, $57.45 is worth mentioning as the next level to keep an eye on if prices fall sharply.
-638394427010642681.png)
US WTI Crude Oil: Daily Chart
WTI Oil FAQs
What is WTI Oil?
WTI Oil is a type of Crude Oil sold on international markets. The WTI stands for West Texas Intermediate, one of three major types including Brent and Dubai Crude. WTI is also referred to as “light” and “sweet” because of its relatively low gravity and sulfur content respectively. It is considered a high quality Oil that is easily refined. It is sourced in the United States and distributed via the Cushing hub, which is considered “The Pipeline Crossroads of the World”. It is a benchmark for the Oil market and WTI price is frequently quoted in the media.
What factors drive the price of WTI Oil?
Like all assets, supply and demand are the key drivers of WTI Oil price. As such, global growth can be a driver of increased demand and vice versa for weak global growth. Political instability, wars, and sanctions can disrupt supply and impact prices. The decisions of OPEC, a group of major Oil-producing countries, is another key driver of price. The value of the US Dollar influences the price of WTI Crude Oil, since Oil is predominantly traded in US Dollars, thus a weaker US Dollar can make Oil more affordable and vice versa.
How does inventory data impact the price of WTI Oil
The weekly Oil inventory reports published by the American Petroleum Institute (API) and the Energy Information Agency (EIA) impact the price of WTI Oil. Changes in inventories reflect fluctuating supply and demand. If the data shows a drop in inventories it can indicate increased demand, pushing up Oil price. Higher inventories can reflect increased supply, pushing down prices. API’s report is published every Tuesday and EIA’s the day after. Their results are usually similar, falling within 1% of each other 75% of the time. The EIA data is considered more reliable, since it is a government agency.
How does OPEC influence the price of WTI Oil?
OPEC (Organization of the Petroleum Exporting Countries) is a group of 13 Oil-producing nations who collectively decide production quotas for member countries at twice-yearly meetings. Their decisions often impact WTI Oil prices. When OPEC decides to lower quotas, it can tighten supply, pushing up Oil prices. When OPEC increases production, it has the opposite effect. OPEC+ refers to an expanded group that includes ten extra non-OPEC members, the most notable of which is Russia.
- The Dollar fails at 0.8450 and remains dangerously close to the long-term low of 0.8295.
- Soft US data is fuelling hopes of Fed cuts and weighing on the US Dollar.
- USD/CHF is on track to close the year with a nearly 10% depreciation.
The US Dollar is reversing Thursday´s gains against the Swiss Franc. The pair has returned below 0.8400 approaching the 2015 low at the 0.8300 area in the last trading day of the year.
The pair is on track to end the year with a nearly 10% decline, hammered by the dovish pivot signaled by the Fed at its December meeting. Investors have ramped up bets of Fed cuts in early 2024, which have sent US Treasury yields plunging, dragging the US Dollar down with them.
In the calendar today, the Chicago PMI is expected to show a deterioration in business activity. This would be in line with the higher-than-expected jobless claims and the stalling home sales seen on Thursday and unlikely to provide significant support to the US Dollar.
From a technical perspective, the pair remains under strong bearish pressure, with the next support levels at 0.8345 and the 2015 low at 0.8295. Resistances are 0.8450 and 0.8515.
Technical levels to watch
- Silver price faces an intense sell-off amid recovery in the US Dollar.
- The USD Index has rebounded as investors see market reaction to Fed rate cuts exaggerated.
- Silver price drops sharply after a breakdown of Rising Channel chart pattern.
Silver price (XAG/USD) has extended its downside to near $23.70 as the US Dollar Index (DXY) has recovered further despite thin trading volume amid festive mood. The white metal has dropped to near two-week low as investors hope that recent sell-off in the USD Index due to deepening expectations of early rate cuts by the Federal Reserve (Fed) was a euphoric move.
The USD Index has rebounded to near 101.40 while the broader bias is still uncertain as investors seem firm about the decision of an interest rate cut from the Fed in March 2024. It is further expected that the Fed will continue reducing rates in May.
S&P500 futures have added moderate gains in the London session, portraying further improvement in the risk-appetite of the market participants. The 10-year US Treasury yields have recovery further to near 3.90% amid hopes that exaggerated market reaction to rate cut hopes has started fading now.
Going forward, investors will focus on the United States Manufacturing PMI from the Institute of Supply Management (ISM) and the Employment data of December. This will guide about the interest rate decision by the Fed in its January’s monetary policy meeting.
Silver technical analysis
Silver price witnessed a steep fall after a breakdown of the Rising Channel chart pattern formed on a two-hour scale. The white metal has refreshed its two-week low near $23.60. The 20-period Exponential Moving Average (EMA) around $24.00 is declining, which indicates more downside ahead.
The Relative Strength Index (RSI) (14) has shifted into the bearish range of 20.00-40.00, which indicates that the downside momentum is intact.
Silver two-hour chart
-638394443474051153.png)
- Gold price falls back $2,065 as the impact of deep Fed rate cut hopes start fading away.
- The Fed is expected to start cutting interest rates from March 2024.
- Next economic triggers for the Gold price will be US Employment and Manufacturing PMI data.
Gold price (XAU/USD) has extended its correction but a consolidation is likely ahead due to thin trading activity. Broadly, the precious metal may continue to remain in the positive trajectory as bets in favour of early rate cuts by the Federal Reserve (Fed) are firming due to easing labour market conditions and a clear downtrend in the underlying inflation. This lowers the opportunity cost of holding the Yellow Metal and weakens the US Dollar, in which it is priced.
The Gold price is set to end 2023 with stellar gains of more than 13.50%. Deepening expectations for the Fed to start reducing interest rates from March 2024 will also keep appeal for the Gold price upbeat in 2024. Further action in the Gold price will be guided by the United States Nonfarm Employment and ISM Manufacturing PMI for November.
Daily Digest Market Movers: Gold price drops further while US Dollar rebounds
- Gold price falls further to near $2,063.00 as the US Dollar and Treasury yields ahve recovered further.
- The 10-year US Treasury yields have rebounded to near 3.90% and the US Dollar Index (DXY) has climbed to near 101.35.
- The broader appeal for non-yielding assets is bullish as Fed’s stance of higher for longer interest rates has lost its essence and investors are pricing in early rate cuts in 2024.
- As per the CME Fedwatch tool, there is a 73% chance that the Fed will reduce interest rates by 25 basis points (bps) to 5.00-5.25%. The probability that the Fed will continue reducing borrowing rates in May too is 72%.
- In addition, a clear declining trend in the underlying inflation towards 2%, further increases the chances the Fed may cut interest rates to avoid the consequences of overtightening.
- The scenario of long-lasting restrictive monetary policy could impact the economic outlook of the US economy.
- The US Department of Labor reported higher-than-projected Initial Jobless Claims (IJC) for the week ending December 22. Individuals who claimed jobless benefits for the first time were 218K, higher than the consensus of 210K and the former reading of 206K.
- The Fed has been maintaining an unchanged interest rates stance from the last three monetary policy meetings due to softening inflation and a slowdown in labour demand. A sustained restrictive monetary policy stance for longer could ease out resilience in the US labour market.
- While Fed policymakers are confident of a clear downtrend in price pressures, a restrictive policy stance would be maintained to ensure the achievement of price stability.
- Significant action in the FX domain is less likely on Friday amid the festive mood. However, next week, US Manufacturing PMI from the Institute of Supply Management (ISM) and the Employment data for November.
- Fresh labour market conditions will indicate whether Fed policymakers should look for unwinding restrictive monetary policy stance or stick to higher interest rates further.
Technical Analysis: Gold price declines towards $2,060
Gold price drops below Thursday’s trading range of $2,064-2,088. Trading volume is thin amid absence of significant number of market participants due to the festive week. The precious metal witnessed some profit-booking on Thursday. On a braoder note, upward-sloping 20 and 50-day Exponential Moving Averages (EMAs) point to more upside ahead. In addition to them, oscillators indicate strong momentum in an upside direction.
Gold FAQs
Why do people invest in Gold?
Gold has played a key role in human’s history as it has been widely used as a store of value and medium of exchange. Currently, apart from its shine and usage for jewelry, the precious metal is widely seen as a safe-haven asset, meaning that it is considered a good investment during turbulent times. Gold is also widely seen as a hedge against inflation and against depreciating currencies as it doesn’t rely on any specific issuer or government.
Who buys the most Gold?
Central banks are the biggest Gold holders. In their aim to support their currencies in turbulent times, central banks tend to diversify their reserves and buy Gold to improve the perceived strength of the economy and the currency. High Gold reserves can be a source of trust for a country’s solvency. Central banks added 1,136 tonnes of Gold worth around $70 billion to their reserves in 2022, according to data from the World Gold Council. This is the highest yearly purchase since records began. Central banks from emerging economies such as China, India and Turkey are quickly increasing their Gold reserves.
How is Gold correlated with other assets?
Gold has an inverse correlation with the US Dollar and US Treasuries, which are both major reserve and safe-haven assets. When the Dollar depreciates, Gold tends to rise, enabling investors and central banks to diversify their assets in turbulent times. Gold is also inversely correlated with risk assets. A rally in the stock market tends to weaken Gold price, while sell-offs in riskier markets tend to favor the precious metal.
What does the price of Gold depend on?
The price can move due to a wide range of factors. Geopolitical instability or fears of a deep recession can quickly make Gold price escalate due to its safe-haven status. As a yield-less asset, Gold tends to rise with lower interest rates, while higher cost of money usually weighs down on the yellow metal. Still, most moves depend on how the US Dollar (USD) behaves as the asset is priced in dollars (XAU/USD). A strong Dollar tends to keep the price of Gold controlled, whereas a weaker Dollar is likely to push Gold prices up.
- The Euro bounces up at 0.8660 to test resistance at 0.8700,
- The Pound is losing ground across the board on a light trading session.
- EUR/GBP maintains its bullish trend from early December lows.
The Euro bounced up again at 0.8660 to return to levels near 0.8700, approaching a one-month high, at 0.8715. The pair is capitalizing on a recent GBP weakness in the last trading session of the year.
In the UK, housing prices remained flat in December, as expected, following a 0.2% increase on the previous month. Year on year, prices declined at a 1.8% pace, bearing expectations of a 1.4% decline and following a 2% depreciation in October.
In the Euro Area, preliminary data revealed that consumer prices remained flat in Spain in December, and grew at a 3.3% level on the year, unchanged from the previous month. This proves that inflationary pressures remain high in some countries and backs the “higher for longer” ECB stance.
The technical picture shows bulls in control, with the pair printing higher highs and higher lows since early December. The pair, however, would need to confirm above the 0.8700 level to increase bullish pressure towards the November 22 and 23 highs, at 0.8725, and November’s peak, at 0.8765.
On the downside, support levels are 0.8645 and 0.8600.
Technical levels to watch
- USD/CAD rebounds to near 1.3250 after a consolidation breakout.
- The USD Index has climbed to near 101.35 while the broader bias is still downbeat.
- A mean-reversion move to near the 20-EMA is highly likely.
The USD/CAD pair climbs to near 1.3250 after delivering a decisive break of the consolidation formed in a range of 1.3180-1.3230 from Wednesday. The Loonie asset jumps as the US Dollar Index (DXY) has recovered further and the oil price has been hit due to resumption of commercial shipment from the Red Sea route.
The oil price has been corrected almost 6% from three-week high of $76.00 as oil supply will improve ahead. It is worth noting that Canada is the leading exporter of oil to the United States and lower oil prices impact the Canadian Dollar.
Meanwhile, the recovery in the USD Index has been extended to 101.35. Investors hope that market reaction to expectations of rate cuts by the Federal Reserve (Fed) from March 2024 is overwhelming than anticipated. In spite of a swift recovery attempt, the USD Index is expected to end 2023 with significant losses.
USD/CAD has been falling since the first day of November and is expected to decline further towards June 27 low, which is around 1.3117. However, a mean-reversion move to near the downward-sloping 20-day Exponential Moving Average (EMA) around 1.3377 is highly likely.
The Relative Strength Index (RSI) (14) hovers in the bearish range of 20.00-40.00, which indicates downside momentum is intact.
Going forward, a breakdown below December 28 low of 1.3180 would expose the asset to July 25 low near 1.3150, followed by July 13 low around 1.3193.
In an alternate scenario, a recovery move above April 14 low around 1.3300 would drive the asset towards December 21 high at 1.3370. A breach of the latter would push the Loonie asset towards May 16 low at 1.3404.
USD/CAD daily chart
-638394404995919558.png)
- The Greenback is trading at intra-day highs nearing previous support at the 141.90 area.
- The US Dollar Index is resuming its recovery on thin holiday trade.
- Longer-term, the downtrend from mid-November highs remains intact.
The US Dollar is attempting to extend its rebound from Thursday´s lows, yet with the pair still capped below previous support at 141.90, which leaves the 140.00 level on the bear´s focus.
The Yen has been the worst performer of the G7 currencies this year, but it has managed to trim some losses over the last two months, with the US Dollar crushed by hopes of Fed cuts in 2024.
Beyond that, the Bank of Japan is expected to exit its ultra-loose policy next year although the contradictory messages sent by BoJ officials have frustrated investors and are weighing on a firmer Yen recovery.
Trading is expected to be light on the last working day of the year, with, only the Chicago PMI to offer some distraction. Investors will wait for next week with the minutes of the last Fed meeting, US PMIs and, above all, December´s Nonfarm Payrolls to take directional bets on the USD.
The technical picture remains negative yet with bearish momentum losing steam, as shown by the last three week’s falling wedge. This figure has a bias to break lower although support levels at 140.00 and 139.00, the 261% extension of the mid-November decline are likely to challenge bears
On the upside, resistances are at 141.90 and 142.90.
Technical levels to watch
- The Euro maintains its bullish trend whilst the Dollar’s recovery attempt stalls.
- Investors bets on Fed cuts in 2024 keep USD buyers in check.
- US data released on Thursday strengthened the case for a soft landing in Q4.
The Euro (EUR) remains steady near recent highs on the last trading day of the Year, moving above 1.1050 after Wednesday´s pullback from the 1.1135 high. The pair maintains its broader bullish trend intact, with the US Dollar licking its wounds as the investors ramp up bets on Fed cuts in early 2024.
US Data released on Thursday revealed higher-than-expected Jobless claims while November’s Pending Home Sales remained flat against expectations of a 1% increase.
These figures confirm the theory that the US economy is losing pace in the fourth quarter, and on its way to a soft landing that will allow the US Federal Reserve (Fed) to start reversing the last two years’ tightening cycle.
In the Eurozone, Spanish consumer prices have remained steady at a 3.3% yearly rate. These figures confirm that inflation remains sticky in some countries endorsing the ECB’s hawkish stance and underpinning support for the Euro.
Daily digest market movers: A hawkish ECB and weak US data are buoying the Euro
- The Euro remains firm with the US Dollar languishing at five-month lows amid plunging US yields.
- Spanish Consumer Prices Index remained flat in December and grew at a 3.3% pace on the year, unchanged from the previous month.
- On Thursday, the Governor of the Austrian Central Bank and ECB member, Robert Holzmann observed that there is no guarantee for a rate cut in 2024, which provided some support to the Euro.
- US Weekly Jobless Claims increased by 118K in the week of December 15, beating expectations of a 110K reading.
- US Pending home sales remained flat in November against market expectations of a 1% increase.
- With only the Chicago PMI worth noting for today, recent US data is consistent with the soft-landing scenario that is fuelling bets of Fed cuts in early 2024.
- Futures markets are pricing 85% chances of Fed cuts in March, and 150 bps cuts in the whole year, according to the CME Group FedWatch Tool.
Technical Analysis: Euro maintains its positive tone with downside attempts capped at 1.1050
The Euro is trading without a clear direction on Friday’s European session, with downside attempts limited above 1.1050 following rejection at the 1.1135 area on Thursday. The US Dollar Index recovery attempt seen on Thursday has stalled below previous lows, which is keeping the EUR/USD from a deeper correction.
The broader trend remains bullish with the pullback from Thursday´s highs seen as a corrective reaction from heavily overbought levels. On the downside, below 1.1050, the pair will face support at 1.1010 where the 4h 50 SMA meets previous swing highs and 1.0935.
On the upside, resistance levels remain at the July 27 high, 1.1145, which closes the path toward the 2023 high, at 1.1280.
Euro FAQs
What is the Euro?
The Euro is the currency for the 20 European Union countries that belong to the Eurozone. It is the second most heavily traded currency in the world behind the US Dollar. In 2022, it accounted for 31% of all foreign exchange transactions, with an average daily turnover of over $2.2 trillion a day.
EUR/USD is the most heavily traded currency pair in the world, accounting for an estimated 30% off all transactions, followed by EUR/JPY (4%), EUR/GBP (3%) and EUR/AUD (2%).
What is the ECB and how does it impact the Euro?
The European Central Bank (ECB) in Frankfurt, Germany, is the reserve bank for the Eurozone. The ECB sets interest rates and manages monetary policy.
The ECB’s primary mandate is to maintain price stability, which means either controlling inflation or stimulating growth. Its primary tool is the raising or lowering of interest rates. Relatively high interest rates – or the expectation of higher rates – will usually benefit the Euro and vice versa.
The ECB Governing Council makes monetary policy decisions at meetings held eight times a year. Decisions are made by heads of the Eurozone national banks and six permanent members, including the President of the ECB, Christine Lagarde.
How does inflation data impact the value of the Euro?
Eurozone inflation data, measured by the Harmonized Index of Consumer Prices (HICP), is an important econometric for the Euro. If inflation rises more than expected, especially if above the ECB’s 2% target, it obliges the ECB to raise interest rates to bring it back under control.
Relatively high interest rates compared to its counterparts will usually benefit the Euro, as it makes the region more attractive as a place for global investors to park their money.
How does economic data influence the value of the Euro?
Data releases gauge the health of the economy and can impact on the Euro. Indicators such as GDP, Manufacturing and Services PMIs, employment, and consumer sentiment surveys can all influence the direction of the single currency.
A strong economy is good for the Euro. Not only does it attract more foreign investment but it may encourage the ECB to put up interest rates, which will directly strengthen the Euro. Otherwise, if economic data is weak, the Euro is likely to fall.
Economic data for the four largest economies in the euro area (Germany, France, Italy and Spain) are especially significant, as they account for 75% of the Eurozone’s economy.
How does the Trade Balance impact the Euro?
Another significant data release for the Euro is the Trade Balance. This indicator measures the difference between what a country earns from its exports and what it spends on imports over a given period.
If a country produces highly sought after exports then its currency will gain in value purely from the extra demand created from foreign buyers seeking to purchase these goods. Therefore, a positive net Trade Balance strengthens a currency and vice versa for a negative balance.
Fed FAQs
What does the Federal Reserve do, how does it impact the US Dollar?
Monetary policy in the US is shaped by the Federal Reserve (Fed). The Fed has two mandates: to achieve price stability and foster full employment. Its primary tool to achieve these goals is by adjusting interest rates.
When prices are rising too quickly and inflation is above the Fed’s 2% target, it raises interest rates, increasing borrowing costs throughout the economy. This results in a stronger US Dollar (USD) as it makes the US a more attractive place for international investors to park their money.
When inflation falls below 2% or the Unemployment Rate is too high, the Fed may lower interest rates to encourage borrowing, which weighs on the Greenback.
How often does the Fed hold monetary policy meetings?
The Federal Reserve (Fed) holds eight policy meetings a year, where the Federal Open Market Committee (FOMC) assesses economic conditions and makes monetary policy decisions.
The FOMC is attended by twelve Fed officials – the seven members of the Board of Governors, the president of the Federal Reserve Bank of New York, and four of the remaining eleven regional Reserve Bank presidents, who serve one-year terms on a rotating basis.
What is Quantitative Easing (QE) and how does it impact USD?
In extreme situations, the Federal Reserve may resort to a policy named Quantitative Easing (QE). QE is the process by which the Fed substantially increases the flow of credit in a stuck financial system.
It is a non-standard policy measure used during crises or when inflation is extremely low. It was the Fed’s weapon of choice during the Great Financial Crisis in 2008. It involves the Fed printing more Dollars and using them to buy high grade bonds from financial institutions. QE usually weakens the US Dollar.
What is Quantitative Tightening (QT) and how does it impact the US Dollar?
Quantitative tightening (QT) is the reverse process of QE, whereby the Federal Reserve stops buying bonds from financial institutions and does not reinvest the principal from the bonds it holds maturing, to purchase new bonds. It is usually positive for the value of the US Dollar.
- USD/MXN retraces its recent gains as US Dollar fails to continue gaining.
- Mexico's Jobless Rate remained consistent at 2.7% against the expected 2.6% in November.
- The downbeat US data pushed the market bias toward the dovish Fed’s outlook in early 2024.
USD/MXN retraces its recent gains as subdued US Treasury yields contribute pressure to undermining the US Dollar (USD). The USD/MXN pair trades lower around 16.93 during the European session on Friday. However, Mexico’s Jobless data might have weighed on the Mexican Peso (MXN).
In November, the Jobless Rate held steady at 2.7%, slightly below the market expectation of 2.6%. However, the seasonally adjusted Jobless Rate saw a slight increase to 2.8% from the previous 2.6%. This shift is indicative of the impact of the higher policy rates maintained by the Bank of Mexico (Banxico). Additionally, the release of the Fiscal Balance for November is eagerly anticipated and scheduled for Saturday, providing further insights into the economic landscape and fiscal health.
Traders are putting their bets on the expectation of the Federal Reserve's (Fed) cutting interest rates in the first quarter of 2024, which exerts downward pressure on the USD/MXN pair. The US Dollar Index (DXY) moves sideways near 101.20, as both the 2-year and 10-year yields on US bond notes stand at 4.27% and 3.85%, respectively, by the press time.
The rise in US Initial Jobless Claims to 218K for the week ending December 23, surpassing the expected 210K, and the flat growth of 0.0% in Pending Home Sales (MoM) for November, falling short of the anticipated 1.0%, contributed to support the market bias toward the Fed's dovish stance in upcoming policy meetings. This lesser-than-optimistic economic data from the United States (US) might have added downward pressure to weakening the USD/MXN pair.
The upcoming release of the Chicago Purchasing Managers' Index (PMI) for December, scheduled for Friday, is anticipated to show a reading of 51, which is lower than the previous figure of 55.8.
- NZD/USD may revisit the five-month high at 0.6369 as the Kiwi Dollar cheers risk-on mood.
- The market sentiment is biased toward the dovish Fed’s stance following the lower US bond yields.
- RBNZ may maintain a hawkish stance due to the improved Consumer Confidence and Business Confidence data for November.
NZD/USD hovers around 0.6350 during the European trading hours on Friday, grappling to approach the five-month high at 0.6369 marked on Thursday. The prevailing market sentiment, leaning towards the expectation of the Federal Reserve (Fed) cutting interest rates in the first quarter of 2024, is exerting pressure on US yields. The US Dollar Index (DXY) trades lower around 101.20, as both the 2-year and 10-year yields on US Treasury notes have declined to 4.26% and 3.83%, respectively, by the press time.
Market participants expect that the Reserve Bank of New Zealand (RBNZ) will maintain a hawkish stance by refraining from policy easing in the upcoming meeting. This sentiment is further bolstered by positive data releases, including improved Consumer Confidence and Business Confidence figures for November. The combination of these factors contributes to a positive outlook for the NZD, reflecting confidence in the RBNZ's hawkish stance on policy direction.
RBNZ Governor Adrian Orr's meticulous approach and acknowledgment of impending challenges, particularly in addressing elevated inflation, highlight the complexities of navigating the economic landscape. Additionally, ANZ analysts foresee a global resurgence in risk appetite, combined with the favorable interest rate differential of the NZD, contributing to upward momentum throughout 2024.
In the absence of high-impact data on the Kiwi's agenda for the upcoming week, traders are shifting their focus to China's Caixin Manufacturing PMI for December on Tuesday. The close trade partnership between China and New Zealand adds significance to this economic indicator. Meanwhile, on the United States docket, attention is directed toward the upcoming release of the Chicago Purchasing Managers' Index (PMI) for December, scheduled for Friday.
Gold prices fell in India on Friday, according to data from India's Multi Commodity Exchange (MCX).
Gold price stood at 63,093 Indian Rupees (INR) per 10 grams, down INR 319 compared with the INR 63,412 it cost on Thursday.
As for futures contracts, Gold prices decreased to INR 63,312 per 10 gms from INR 63,389 per 10 gms.
Prices for Silver futures contracts decreased to INR 74,264 per kg from INR 74,959 per kg.
| Major Indian city | Gold Price |
|---|---|
| Ahmedabad | 65,385 |
| Mumbai | 65,210 |
| New Delhi | 65,250 |
| Chennai | 65,320 |
| Kolkata | 65,315 |
Global Market Movers: Comex Gold price regains poise on final trading day of 2023
- Comex Gold price meets fresh buyers amid broadly subdued US Dollar and the US Treasury bond yields.
- Market participants are pricing in a rate cut by the Federal Reserve from March 2024.
- The Fed is expected to start reducing interest rates as inflation in the United States economy is in a downtrend.
- As per the CME Fedwatch tool, market participants see more than an 88% chance of the Fed cutting interest rates in March. The likelihood of the Fed trimming interest rates further in May is more than 65%.
- Bets in favor of early rate cuts by the Fed are very healthy as the underlying inflation rate has dropped to 3.2% in November. The Fed, in its latest projections, anticipated this number at the end of December 2023.
- There is a reasonable chance that the Fed will achieve a soft landing as the Unemployment Rate has been steady around 3.7% and lay-offs have remained lower than new payroll additions in every month of 2023.
- As 2024 is set to kick-in, a further move in the Gold price would be guided by whether investors have priced in rate cuts too much or whether economic shrinkage will emerge suggesting current pricings are fair.
- A league of investors and Fed policymakers believe that investors have gone too far ahead in discounting rate cuts. The impact is clearly visible in the US Dollar Index (DXY), which is down 6.31% from October’s high of 107.35.
- The USD Index is expected to end the year with a loss of almost 2.5% on expectations that the Fed would be the first major central bank to cut.
- Nevertheless, other western economies are also expected to start reducing interest rates as price pressures are easing globally.
- Unlike other economies that are prone to economic contraction, the US economy is resilient. Sheer strength in economic prospects could keep additional inflationary pressures above the required rate of 2%.
- Due to a light economic calendar, second-tier weekly Initial Jobless Claims data for the week ending December 22 may bring some action in the FX domain.
- Market participants are anticipating individuals claiming jobless benefits rose to 210K, nominally higher than the former reading of 205K.
- Next week, employment and Manufacturing PMI data for December will keep investors busy.
- Meanwhile, import of Gold in China from Hong Kong rose 37% in November after the People's Bank of China (PBoC) eased some import restrictions to meet expected demand for the Chinese New Year, as reported by Reuters.
(An automation tool was used in creating this post.)
Gold FAQs
Why do people invest in Gold?
Gold has played a key role in human’s history as it has been widely used as a store of value and medium of exchange. Currently, apart from its shine and usage for jewelry, the precious metal is widely seen as a safe-haven asset, meaning that it is considered a good investment during turbulent times. Gold is also widely seen as a hedge against inflation and against depreciating currencies as it doesn’t rely on any specific issuer or government.
Who buys the most Gold?
Central banks are the biggest Gold holders. In their aim to support their currencies in turbulent times, central banks tend to diversify their reserves and buy Gold to improve the perceived strength of the economy and the currency. High Gold reserves can be a source of trust for a country’s solvency. Central banks added 1,136 tonnes of Gold worth around $70 billion to their reserves in 2022, according to data from the World Gold Council. This is the highest yearly purchase since records began. Central banks from emerging economies such as China, India and Turkey are quickly increasing their Gold reserves.
How is Gold correlated with other assets?
Gold has an inverse correlation with the US Dollar and US Treasuries, which are both major reserve and safe-haven assets. When the Dollar depreciates, Gold tends to rise, enabling investors and central banks to diversify their assets in turbulent times. Gold is also inversely correlated with risk assets. A rally in the stock market tends to weaken Gold price, while sell-offs in riskier markets tend to favor the precious metal.
What does the price of Gold depend on?
The price can move due to a wide range of factors. Geopolitical instability or fears of a deep recession can quickly make Gold price escalate due to its safe-haven status. As a yield-less asset, Gold tends to rise with lower interest rates, while higher cost of money usually weighs down on the yellow metal. Still, most moves depend on how the US Dollar (USD) behaves as the asset is priced in dollars (XAU/USD). A strong Dollar tends to keep the price of Gold controlled, whereas a weaker Dollar is likely to push Gold prices up.
- Pound Sterling recovers swiftly as investors’ risk-appetite revives.
- Deepening UK recession fears could dent the Pound Sterling’s outlook.
- Persistent Fed rate-cut bets may continue to weigh on the US Dollar.
The Pound Sterling (GBP) is set to end 2023 with decent gains of almost 5.60%. The rally in the Pound Sterling is backed by consistently surging risk-appetite of the market participants due to easing fears of a global recession. Western central banks will likely wind-up their historically faster rate-tightening campaign amid easing price pressures, which has improved appeal for risk-sensitive assets.
The performance of the Pound Sterling against the US Dollar has remained better as the Bank of England (BoE) may be laggard in reducing borrowing rates among central banks from Group of Seven economies. Economic conditions for BoE policymakers are worsening again as the United Kingdom economy has been exposed to a technical recession due to a vulnerable demand environment. The BoE could begin cutting interest rates earlier to avoid fears of any economic shrinkage, which may dampen the Pound Sterling outlook significantly.
Daily Digest Market Movers: Pound Sterling rebounds while US Dollar recovery stalls
- Pound Sterling rebounds strongly after a gradual correction as the overall market mood is quite upbeat amid expectations that there won’t be any global recession as price pressures have eased significantly
- The appeal for risk-perceived assets is bullish as investors lean towards expectations of early rate cuts by the Federal Reserve.
- The Fed is expected to start lowering borrowing costs from March as price pressures in the United States economy are clearly in a downtrend.
- Action in the FX domain is expected to remain muted in the last trading session of 2023 but next week firecrackers are likely amid the release of the S&P Global PMI for the manufacturing and service sector.
- The Pound Sterling recovers as investors expect interest rate cuts from the Bank of England (BoE) to be delayed compared to the Fed and other central banks from the Group of Seven economies.
- The United Kingdom’s high inflation rate is the reason for expecting rate cuts to come later there than the other G7 nations.
- UK’s core inflation is slightly above 5% and policymakers lack confidence in achieving price stability in a timely manner due to robust wage growth.
- Market participants are already pricing in a decline in Fed-BoE policy divergence, which is likely from March 2024.
- Higher demand for the Pound Sterling against the US Dollar could fade as conditions of a technical recession in the UK economy are strengthening, which could force the BoE to announce rate cuts earlier-than-anticipated.
- Revised estimates from the UK Office for National Statistics (ONS) have indicated that the economy contracted by 0.1% in the third quarter of 2023.
- The BoE is not expecting growth in the final quarter of 2023, which indicates a technical recession is highly likely.
- A recession situation may force the BoE to start unwinding its restrictive monetary policy stance.
- Meanwhile, the recovery in the US Dollar Index (DXY) has stalled amid persistent Fed’s rate cut bets. The USD Index is facing pressure near 101.30 and is expected to fall back towards five-month low near 100.60.
- The USD Index has been facing an intense sell-off as a higher for longer interest-rate stance from Fed policymakers has given way to expectations of rate cuts, as the central bank tries to avoid the consequences of over-tightening.
- Next week, investors will focus on the ISM Manufacturing PMI and the Employment data for December, which will provide guidance for further action by the Fed in its first monetary policy meeting of 2024 on January 31.
Technical Analysis: Pound Sterling recovers from 1.2700
Pound Sterling rebounds after correcting on Thursday as the risk-appetite of the market participants has surged again. The GBP/USD pair is aiming to recapture its five-month high of 1.2870. A rally in the Cable may continue as the 20 and 50-day Exponential Moving Averages (EMAs) are advancing. Momentum oscillators indicate sheer strength in the upside move.
Pound Sterling FAQs
What is the Pound Sterling?
The Pound Sterling (GBP) is the oldest currency in the world (886 AD) and the official currency of the United Kingdom. It is the fourth most traded unit for foreign exchange (FX) in the world, accounting for 12% of all transactions, averaging $630 billion a day, according to 2022 data.
Its key trading pairs are GBP/USD, aka ‘Cable’, which accounts for 11% of FX, GBP/JPY, or the ‘Dragon’ as it is known by traders (3%), and EUR/GBP (2%). The Pound Sterling is issued by the Bank of England (BoE).
How do the decisions of the Bank of England impact on the Pound Sterling?
The single most important factor influencing the value of the Pound Sterling is monetary policy decided by the Bank of England. The BoE bases its decisions on whether it has achieved its primary goal of “price stability” – a steady inflation rate of around 2%. Its primary tool for achieving this is the adjustment of interest rates.
When inflation is too high, the BoE will try to rein it in by raising interest rates, making it more expensive for people and businesses to access credit. This is generally positive for GBP, as higher interest rates make the UK a more attractive place for global investors to park their money.
When inflation falls too low it is a sign economic growth is slowing. In this scenario, the BoE will consider lowering interest rates to cheapen credit so businesses will borrow more to invest in growth-generating projects.
How does economic data influence the value of the Pound?
Data releases gauge the health of the economy and can impact the value of the Pound Sterling. Indicators such as GDP, Manufacturing and Services PMIs, and employment can all influence the direction of the GBP.
A strong economy is good for Sterling. Not only does it attract more foreign investment but it may encourage the BoE to put up interest rates, which will directly strengthen GBP. Otherwise, if economic data is weak, the Pound Sterling is likely to fall.
How does the Trade Balance impact the Pound?
Another significant data release for the Pound Sterling is the Trade Balance. This indicator measures the difference between what a country earns from its exports and what it spends on imports over a given period.
If a country produces highly sought-after exports, its currency will benefit purely from the extra demand created from foreign buyers seeking to purchase these goods. Therefore, a positive net Trade Balance strengthens a currency and vice versa for a negative balance.
- USD/JPY remains above the 141.00 psychological level amid a weaker US Dollar.
- The immediate resistance could be at the 141.50 major level following the 142.00 level.
- Technical indicators suggest a bearish sentiment to retest the 141.00 psychological support.
USD/JPY continues to experience declines, driven by the weakening US Dollar (USD) influenced by subdued US bond yields. This trend is likely attributed to the dovish outlook of the Federal Reserve (Fed) in the first quarter of 2024. As of the early European session on Friday, the USD/JPY trades lower around 141.20. The immediate resistance is noted at the 141.50 level, with the next barrier at the 142.00 level.
A breakthrough above the psychological level could provide support for the USD/JPY pair to approach the nine-day Exponential Moving Average (EMA) at 142.24, with the psychological resistance at the 143.00 level acting as a significant hurdle. If the pair successfully surpasses this level, the next barrier to overcome would be the 23.6% Fibonacci retracement level at 143.35.
The 14-day Relative Strength Index (RSI) residing below the 50 level points to a weakened sentiment for the USD/JPY pair. Adding to the bearish outlook, the Moving Average Convergence Divergence (MACD) line is positioned below both the centerline and the signal line, confirming the prevailing bearish momentum in the market for USD/JPY.
This bearish sentiment may drive the USD/JPY pair towards the psychological support region around 141.00. A decisive break below this level could potentially open the door for the pair to test the significant level at 140.50.
USD/JPY: Daily Chart
-638394320205142250.png)
- USD/CHF trades lower as the Greenback weakens on improved risk appetite.
- Lower US bond yields indicate a strong bias toward easing of Fed’s tightening.
- Swiss Franc gains ground on heightened risk aversion due to Middle East conflict.
USD/CHF receives downward support due to the weaker US Dollar (USD), which could be attributed to the lower US Treasury yields. The market bias toward the Federal Reserve (Fed) to reduce interest rates in the first quarter of 2024 is putting pressure on the US yields. The USD/CHF pair trades lower around 0.8430 during the Asian session on Friday. The US Dollar Index (DXY) bids lower near 101.10, with the 2-year and 10-year yields on US Treasury notes standing lower at 4.26% and 3.84%, respectively, by the press time.
Additionally, softer economic data from the United States (US) could have diminished the strength of the Greenback as it reinforces the market bias toward the Fed’s dovish stance in the upcoming policy meetings. US Initial Jobless Claims rose to 218K for the week ending December 23, exceeding the market's projection of 210K. Additionally, Pending Home Sales (MoM) for November came in flat 0.0% compared to the anticipated growth of 1.0% from the previous decline of 1.2%. The upcoming Chicago Purchasing Managers' Index (PMI) for December, is set to be released on Friday. The report is expected to print a reading of 51, lower than the previous 55.8 figures.
The ongoing geopolitical conflict in the Middle East is fueling heightened risk aversion, leading to an increased demand for the safe-haven Swiss Franc (CHF). Concerns linger about the potential closure of the Gibraltar Strait by Iran, adding a layer of caution to the overall situation. Despite this, the return of major shipping firms to the Red Sea suggests a tentative move towards normalization.
ZEW Survey – Expectations fell by 23.7 points in December against the 29.6 decline in November. KOF Leading Indicator is set to be released on Friday, expected to improve from 96.7 to 97.0. The Swiss National Bank (SNB) seems set to take a proactive stance, as outlined in its recent Quarterly Bulletin. The bank has expressed its preparedness to actively intervene in the foreign exchange market to support the Swiss Franc (CHF).
Here is what you need to know on Friday, December 29:
Markets remain relatively calm on the last trading day of the year as trading conditions continue to thin out ahead of the long weekend. The economic calendar will not offer any high-tier data releases and the trading action could stay subdued heading into the New Year's holiday.
After touching a fresh multi-month low of 100.60 early Thursday, the US Dollar (USD) Index staged a rebound in the American session and closed the day in positive territory above 101.00. In the absence of fundamental drivers, the recovery seen in US Treasury bond yields helped the USD find demand. Meanwhile, the data from the US showed that there were 218,000 Initial Jobless Claims in the week ending December 22 and Pending Home Sales were unchanged on a monthly basis in November.
The USD remains on track to post losses against most major currencies for the year. The only currency that the USD outperformed in 2023 was the Japanese Yen.
US Dollar price this year
The table below shows the percentage change of US Dollar (USD) against listed major currencies this year. US Dollar was the weakest against the Swiss Franc.
| USD | EUR | GBP | CAD | AUD | JPY | NZD | CHF | |
| USD | -3.22% | -5.56% | -2.58% | -0.58% | 7.16% | -0.15% | -9.71% | |
| EUR | 3.12% | -2.68% | 1.01% | 2.89% | 10.06% | 3.16% | -6.52% | |
| GBP | 5.24% | 2.58% | 3.58% | 5.45% | 12.39% | 5.09% | -3.93% | |
| CAD | 2.52% | -1.03% | -2.88% | 1.89% | 9.48% | 1.58% | -6.98% | |
| AUD | 0.58% | -2.99% | -5.76% | -2.01% | 7.38% | 0.30% | -9.13% | |
| JPY | -7.72% | -11.19% | -13.70% | -10.07% | -7.97% | -8.31% | -18.56% | |
| NZD | 0.15% | -3.14% | -5.46% | -2.47% | -0.29% | 7.06% | -10.11% | |
| CHF | 8.64% | 6.16% | 3.86% | 7.10% | 8.39% | 15.61% | 8.77% |
The heat map shows percentage changes of major currencies against each other. The base currency is picked from the left column, while the quote currency is picked from the top row. For example, if you pick the Euro from the left column and move along the horizontal line to the Japanese Yen, the percentage change displayed in the box will represent EUR (base)/JPY (quote).
EUR/USD retreated from the multi-month high it set near 1.1150 on Thursday and stabilized below 1.1100 early Friday. The Euro (EUR) is up more than 3% against the USD this year.
After rising above 1.2800, GBP/USD made a sharp U-turn in the second half of the day on Thursday and snapped a two-day winning streak. The pair edged higher during the Asian trading hours and was last seen trading above 1.2750.
USD/JPY fell to its weakest level in five months below 140.50 on Thursday but managed to erase a large portion of its daily losses to close the day comfortably above 141.00. In the European morning on Friday, the pair trades modestly lower on the day at around 141.20.
Gold edged lower as US Treasury bond yields recovered on Thursday. After posting daily losses for the first time in early 10 days, XAU/USD stabilized above $2,070.
- WTI prices trade in negative territory for the third consecutive day on Friday.
- The concern about shipping disruptions due to tensions in the Red Sea has started to fade.
- EIA reported that crude inventories fell by more than expected last week.
Western Texas Intermediate (WTI), the US crude oil benchmark, is trading around $72.15 on Friday. The downtick in WTI prices is bolstered by the modest rebound of the US Dollar (USD) and easing concerns about supply disruptions.
Tensions in the Red Sea have started to fade as logistical operations have resumed in the area. Earlier this month, major shipping companies ceased using the Red Sea and the Suez Canal after Yemen's Houthi militant group began targeting vessels.
Data released from the American Petroleum Institute (API) weekly report on Wednesday revealed that US crude oil inventories increased by 1.837M barrels for the week ending December 23 from 0.939M barrels gain in the previous reading. Meanwhile, the US Energy Information Administration (EIA) reported that Crude inventories fell more than expected last week, dropping by 6.911M barrels compared with market expectations for a 2.704M barrels drop.
Nonetheless, the growing prospect of interest rate cuts in Europe and the US in 2024, exert some selling pressure on USD-denominated commodities and boost WTI prices. Market players anticipate the Federal Reserve (Fed) to start easing interest rates as early as March of next year.
Oil traders will monitor the Chicago Purchasing Managers' Index (PMI) for December, due later on Friday. Amid the holiday season's light trading, risk sentiment is likely to continue to influence WTI price movement.
- USD/CNH attracts some sellers around 7.0990 amid the quiet session on Friday.
- The bearish outlook remains intact as the pair holds below the key EMA on the daily chart.
- The initial support level will emerge at 7.0668; the first resistance level is located at 7.1206.
The USD/CNH pair extends its downside during the early European session on Friday. The softer US Dollar (USD) and lower US Treasury bond yields exert some selling pressure on the pair. USD/CNH currently trades near 7.0990, losing 0.28% on the day.
From the technical perspective, USD/CNH holds below the 50- and 100-hour Exponential Moving Averages (EMAs) on the daily chart, suggesting that further downside looks favorable. Additionally, the downward momentum is supported by the 14-day Relative Strength Index (RSI), which stands in bearish territory below 50.
The initial support level for USD/CNH will emerge near a low of June 2 at 7.0668. Further south, the next contention is located near a low of May 26 at 7.0557. A break below 7.0412 (Low of May 23) will see a drop to 7.0152 (Low of May 22).
On the upside, the first upside barrier to watch is a low of December 20 at 7.1206. The additional upside filter is seen at a high of December 28 at 7.1534. Any follow-through buying above the latter will see a rally to 7.1636 (High of December 22), en route to 7.1767 (High of December 6).
USD/CNH daily chart
-638394257169312044.png)
- Gold price demonstrates strength as US Dollar faces challenges on improved market sentiment.
- The investor risk appetite improves as softer US data backs the Fed to be dovish in the upcoming policy meetings.
- The downbeat US bond yields represent investors' mood bias toward lowered Fed’s policy rates anytime soon.
Gold price trades higher near $2,070 per troy ounce during the Asian session on Friday, recovering the recent losses from the previous session. The improvement in the US Dollar (USD) faded the shine of the yellow metal.
However, the softer economic data from the United States (US) might have put a ceiling on the advance of the Greenback as it reinforces the market sentiment bias toward the dovish stance of the US Federal Reserve (Fed) in its monetary policy decisions in early 2024.
The latest figures reveal a surprise increase in US Initial Jobless Claims, reaching 218K for the week ending December 23, surpassing the market's projection of 210K. Additionally, Pending Home Sales (MoM) for November turned stagnant at 0.0%, falling short of the anticipated 1.0% growth.
The subdued yields on US bond coupons reflect a sentiment anticipating lower Federal Reserve policy rates in the near future. This, in turn, is boosting investor risk appetite and contributing to the upward movement in Gold prices. The 2-year and 10-year yields on US Treasury notes are standing lower at 4.26% and 3.84%, respectively, by the press time.
The resurgence of major shipping firms in the Red Sea indicates a cautious step towards normalization, although apprehensions persist regarding the potential closure of the Gibraltar Strait by Iran. Traders are closely monitoring the intricate and ever-changing geopolitical landscape in the Middle East. Any updates in this volatile scenario have the potential to sway market sentiments and impact the demand for safe-haven assets, such as Gold.
- USD/CAD attracts some buyers around 1.3230 on the modest USD rebound.
- A decline in oil prices weighs on the commodity-linked Loonie.
- The US Initial Jobless Claims figure for the third week of December fell short of expectations.
- Traders await the December’s Chicago Purchasing Managers' Index (PMI).
The USD/CAD pair recovers some lost ground during the Asian session on Friday. The rebound of the pair is supported by the modest gains of the US dollar (USD) and a decline in oil prices. However, the bearish outlook of USD/CAD remains intact as the pair holds below the key 100-day Exponential Moving Average (EMA) on the daily chart. USD/CAD currently trades near 1.3230, up 0.02% on the day.
Oil prices continue to drop on Friday due to concerns about supply disruptions. This, in turn, exerts some selling pressure on the commodity-linked Loonie.
The Bank of Canada (BoC) suggested in the statement at its December meeting that the governing council felt more optimistic about the nation's inflation outlook and opened the door for additional rate hikes. However, the November Consumer Price Index (CPI) did not slow down, which might offer some hints that the odds of another interest rate hike have fallen.
On the other hand, investors expect interest rate cuts in the US next year. The Federal Reserve (Fed) maintained rates unchanged at 5.25%-5.50% at its last meeting of the year. Fed Chair Jerome Powell stated that the timing of rate cuts would be the Fed's "next question.” The shift of the Fed's stance to dovish has dragged the Greenback lower across the board and sent bond yields lower.
The US Department of Labor revealed on Thursday that the weekly Initial Jobless Claims figure fell short of expectations, coming in at 218K for the week ending December 23 from the previous week's figure of 206K, below the projected 210K. Meanwhile, Pending Home Sales in the United States remained flat at 0%, weaker than the estimation of 1.0%.
The Chicago Purchasing Managers' Index (PMI) for December will be published later on Friday from the US docket, and it is expected to decline from 55.8 to 51.0. The market has another quiet session as traders enter holiday mode heading into 2024.
- NZD/USD receives upward support amid stable US Dollar.
- The New Zealand Dollar cheers on the possibility of RBNZ delaying policy easing.
- The decline in US bond yields put pressure on the Greenback.
- Softer US data increases the likelihood of the rate cuts by the Fed in early 2023.
NZD/USD posts gains after registering losses in Thursday’s session, trading higher around 0.6340 during the Asian session on Friday. The New Zealand Dollar (NZD) demonstrates strength as the Reserve Bank of New Zealand (RBNZ) is expected to potentially delay policy easing. This sentiment is reinforced by the releases of improved Consumer Confidence and Business Confidence data for November.
New Zealand's Gross Domestic Product (GDP) data showed contraction in the third quarter, indicating the impact of the higher RBNZ’s policy rates in the country. Governor Adrian Orr's careful strategy and recognition of upcoming challenges, especially in dealing with high inflation, underscore the intricacies of steering through the economic scenario. Moreover, ANZ analysts predict that a worldwide resurgence in risk appetite, coupled with the advantageous interest rate differential of the NZD, will fuel upward momentum into 2024.
The US Dollar (USD) faces challenges against the Kiwi Dollar (NZD) as the softer economic data from the United States (US) increases the likelihood of the US Federal Reserve (Fed) taking a more accommodative stance in its monetary policy decisions in early 2024.
The Greenback might have faced some resistance as Initial Jobless Claims unexpectedly rose higher than anticipated, reaching 218K for the week ending on December 23, surpassing the market's expectation of 210K. Additionally, Pending Home Sales for November turned flat at 0.0%, falling short of the anticipated 1.0% increase.
The upcoming Chicago Purchasing Managers' Index (PMI) for December, is set to be released on Friday. This adds another layer to our understanding of economic conditions in the Chicago region, contributing valuable insights to the broader assessment of the US economy. With no significant data on the Kiwi's agenda for the next week, traders will turn their attention to China's Caixin Manufacturing PMI for December on Tuesday, recognizing the significance of China and New Zealand's close trade partnership.
- GBP/USD retraces its recent losses as the US Dollar seems to lose ground.
- The Greenback failed to stay in the positive territory on downbeat US bond yields.
- Softer US data reinforces the bets on the dovish Fed outlook on interest rate trajectory.
- Pound Sterling cheers on the expectation of the BoE to maintain a restrictive stance.
GBP/USD attempts to recover its losses registered in the previous session. The GBP/USD pair trades slightly higher around 1.2740 during the Asian hours on Friday. The US Dollar (USD) attempted to halt its losing streak before the end of the year 2023, but it appears to be struggling to stay in positive territory. The US Dollar Index (DXY) trades lower than 101.13 at the time of writing.
United States (US) Treasury yields experiences a downward movement after posting gains in Thursday's session. This development is notable as it weighs on the Greenback, with investors predicting reduced interest rates soon. The 2-year and 10-year yields closed higher at 4.28% and 3.84%, respectively, in the previous session. However, on Friday, both yields are standing lower at 4.27% and 3.83%, respectively, by the press time.
Additionally, the downbeat US economic data, including a higher-than-expected increase in Initial Jobless Claims and flat Pending Home Sales for November, may have limited the advance of the Greenback. This data reinforces the chances for the US Federal Reserve (Fed) to take a more accommodative stance in its monetary policy decisions in the upcoming meetings.
US Initial Jobless Claims for the week ending on December 23 rose to 218K, exceeding the market expectation of 210K. Pending Home Sales (MoM) came in flat at 0.0% in November against the 1.0% expectations.
The Chicago Purchasing Managers' Index for December will be an additional data point to watch on Friday, providing further insights into the economic conditions in the Chicago area and contributing to the overall assessment of the US economy.
The Pound Sterling (GBP) seems to have recovered, driven by market expectations that the Bank of England (BoE) may maintain a restrictive monetary policy stance. In the United Kingdom (UK), inflation is currently the highest among other Group of Seven economies.
However, the decision-making process for BoE policymakers is challenging, as they face the dilemma of addressing high price pressures while navigating the risk of the economy entering a technical recession due to deteriorating demand in the domestic market. These complex economic dynamics contribute to the volatility and uncertainty in the currency markets, influencing the performance of the British Pound (GBP).
Market participants will likely watch seasonally adjusted UK Nationwide Housing Prices data for December. The month-over-month report is expected to show a flat reading of 0.0% compared to November’s 0.2% increase. While yearly figures could print a 1.4% decline compared to the previous decline of 2.0%.
- Indian Rupee holds positive ground despite the mild recovery of the USD.
- RBI’s Das said that India is one of the world’s fastest-growing major economies with a rising potential growth profile.
- The December’s US Chicago Purchasing Managers’ Index (PMI) is due on Friday.
Indian Rupee (INR) trades on a positive note on Friday despite a modest rebound in the US Dollar (USD). According to the Financial Stability Report (FSR), the Indian economy and financial system remain resilient, bolstered by robust macroeconomic fundamentals, stable financial institution balance sheets, moderating inflation and an improving external sector position.
RBI Governor Shaktikanta Das said that India is one of the fastest-growing major economies in the world with a rising potential growth profile. Governor Das further stated that the central bank will act early and decisively to prevent any buildup of risks to the Indian economy.
The market has another quiet session as traders enter holiday mode. The Chicago Purchasing Managers’ Index (PMI) for December will be released from the US docket later on Friday, which is expected to decline from 55.8 to 51.0.
Daily Digest Market Movers: Indian Rupee shows resilience amid global factors and uncertainties
- The Gross Non-Performing Asset (GNPA) ratio of Indian banks improved further in the second quarter of the current fiscal year, easing to a new decadal low of 3.2%.
- India's current account deficit narrowed to $8.3 billion in the second quarter of 2023–24.
- Fitch Ratings forecast India to be the world’s fastest-growing country, with resilient GDP growth of 6.5% during fiscal 2024–25.
- According to the CEBR, India is set to become the world's third-biggest by 2032 and will eventually surpass China and the United States to become the "world's largest economic superpower" by 2100.
- US Initial Jobless Claims for the week ending December 23 rose to 218,000, above the market consensus of 210,000. Continuing Claims came in at 1.875 million, the highest level in four weeks.
- US Pending Home Sales remained flat in November, below the market estimation of a 1% increase.
Technical Analysis: Indian Rupee keeps the longer-term range theme unchanged
Indian Rupee trades stronger on the day. The USD/INR pair remains stuck in a multi-month-old trading band between 82.80 and 83.40. Technically, the path of least resistance for USD/INR is to the upside as the pair holds above the key 100-period Exponential Moving Average (EMA) on the daily chart. However, the 14-day Relative Strength Index (RSI) turns back below the 50.0 midpoint, suggesting that further decline cannot be ruled out.
Any follow-through selling below the key support level at 83.00 will pave the way to 82.80, portraying the confluence of the lower limit of the trading range and a low of September 12. A decisive break below 82.80 will see a drop to a low of August 11 at 82.60. On the upside, the first upside barrier is seen near the upper boundary of the trading range at 83.40. The next hurdle to watch is the year-to-date (YTD) high of 83.47, en route to the 84.00 psychological mark.
US Dollar price today
The table below shows the percentage change of US Dollar (USD) against listed major currencies today. US Dollar was the weakest against the Australian Dollar.
| USD | EUR | GBP | CAD | AUD | JPY | NZD | CHF | |
| USD | -0.08% | -0.04% | -0.05% | -0.27% | -0.04% | -0.23% | -0.12% | |
| EUR | 0.09% | 0.05% | 0.04% | -0.17% | 0.05% | -0.14% | -0.04% | |
| GBP | 0.04% | -0.04% | -0.01% | -0.23% | 0.00% | -0.20% | -0.08% | |
| CAD | 0.05% | -0.03% | 0.01% | -0.22% | 0.00% | -0.18% | -0.06% | |
| AUD | 0.27% | 0.19% | 0.23% | 0.22% | 0.22% | 0.04% | 0.16% | |
| JPY | 0.04% | -0.04% | 0.00% | -0.01% | -0.23% | -0.20% | -0.08% | |
| NZD | 0.23% | 0.15% | 0.19% | 0.17% | -0.04% | 0.19% | 0.12% | |
| CHF | 0.11% | 0.05% | 0.08% | 0.07% | -0.15% | 0.12% | -0.12% |
The heat map shows percentage changes of major currencies against each other. The base currency is picked from the left column, while the quote currency is picked from the top row. For example, if you pick the Euro from the left column and move along the horizontal line to the Japanese Yen, the percentage change displayed in the box will represent EUR (base)/JPY (quote).
Indian Rupee FAQs
What are the key factors driving the Indian Rupee?
The Indian Rupee (INR) is one of the most sensitive currencies to external factors. The price of Crude Oil (the country is highly dependent on imported Oil), the value of the US Dollar – most trade is conducted in USD – and the level of foreign investment, are all influential. Direct intervention by the Reserve Bank of India (RBI) in FX markets to keep the exchange rate stable, as well as the level of interest rates set by the RBI, are further major influencing factors on the Rupee.
How do the decisions of the Reserve Bank of India impact the Indian Rupee?
The Reserve Bank of India (RBI) actively intervenes in forex markets to maintain a stable exchange rate, to help facilitate trade. In addition, the RBI tries to maintain the inflation rate at its 4% target by adjusting interest rates. Higher interest rates usually strengthen the Rupee. This is due to the role of the ‘carry trade’ in which investors borrow in countries with lower interest rates so as to place their money in countries’ offering relatively higher interest rates and profit from the difference.
What macroeconomic factors influence the value of the Indian Rupee?
Macroeconomic factors that influence the value of the Rupee include inflation, interest rates, the economic growth rate (GDP), the balance of trade, and inflows from foreign investment. A higher growth rate can lead to more overseas investment, pushing up demand for the Rupee. A less negative balance of trade will eventually lead to a stronger Rupee. Higher interest rates, especially real rates (interest rates less inflation) are also positive for the Rupee. A risk-on environment can lead to greater inflows of Foreign Direct and Indirect Investment (FDI and FII), which also benefit the Rupee.
How does inflation impact the Indian Rupee?
Higher inflation, particularly, if it is comparatively higher than India’s peers, is generally negative for the currency as it reflects devaluation through oversupply. Inflation also increases the cost of exports, leading to more Rupees being sold to purchase foreign imports, which is Rupee-negative. At the same time, higher inflation usually leads to the Reserve Bank of India (RBI) raising interest rates and this can be positive for the Rupee, due to increased demand from international investors. The opposite effect is true of lower inflation.
| Raw materials | Closed | Change, % |
|---|---|---|
| Silver | 23.968 | -1.2 |
| Gold | 2065.696 | -0.59 |
| Palladium | 1135.1 | -1.94 |
GBP/USD is set to extend its bullish momentum to 1.3500 next year, the Head of global FX at Goldman Sachs said in his latest note, citing correlation with equities and diminishing fears of global recession.
Key quotes
GBP has a “reliably positive relationship with higher equity prices.”
“Sterling’s recent rise is of course partly about the broader dollar weakness, but since early November the pound has also strengthened on a trade-weighted basis because it tends to do especially well in an environment of moderating interest rate volatility and buoyant equity prices."
“That has been the backdrop since early November and we expect more of that in the year ahead. That is why we think Sterling is one of the currencies that have more room to appreciate as the markets embrace a ‘soft landing’ view.”
“Looming elections have the potential to both incentivize additional fiscal support and bring about somewhat reduced trade frictions with the EU, both of which should help support domestic growth, help avoid recessionary risks and boost the Pound.”
- Australian Dollar gains ground on weakened US Dollar.
- Australian central bank’s future interest rate decisions will be data-dependent.
- Downbeat US economic data reinforces the bets on a dovish Fed outlook.
The Australian Dollar (AUD) retraces its recent losses on Friday, benefiting from a weakened US Dollar (USD). The AUD/USD pair experienced losses in the previous session as the Greenback gained some ground, possibly linked to upbeat US Treasury yields. However, the Aussie Dollar shows strength on the back of improved risk appetite, as market participants anticipate a dovish stance from the Federal Reserve (Fed) concerning interest rates in early 2024.
Australia's recent meeting minutes highlighted the Reserve Bank of Australia's (RBA) emphasis on carefully examining additional data to assess the balance of risks before making future interest rate decisions. The resilience displayed in inflation and housing prices is a crucial factor in this assessment. The RBA's forecast approaching the upper boundary of the 2-3% inflation target by the end of 2025 indicates a cautious but optimistic outlook. The expectation that the RBA will likely avoid a rate cut in the upcoming February policy meeting provides support for keeping the Australian Dollar (AUD) higher.
The US Dollar Index (DXY) experienced minor gains but downbeat US data might have limited the advance of the Greenback as it reinforces the chances for the US Fed to go easy in its monetary policy decision in the upcoming meetings. US Initial Jobless Claims for the week ending on December 23 rose to 218K, exceeding the market expectation of 210K. Pending Home Sales (MoM) came in flat at 0.0% in November against the 1.0% expectations. Chicago Purchasing Managers' Index for December will be eyed on Friday.
Daily Digest Market Movers: Australian Dollar improves on risk appetite, hawkish RBA
- RBA Private Sector Credit (MoM) demonstrated a 0.4% increase in November, surpassing the previous rise of 0.3%. However, the Year-over-Year data indicated a decrease of 4.7%, compared to the previous 4.8% rise.
- RBA highlighted the examination of additional data to assess the balance of risks before deciding on future interest rates in its recent Meeting Minutes.
- China's National Development and Reform Commission's (NDRC) Chairman, Zheng Shanjie, mentioned in a meeting held on Tuesday that China will strive to expand domestic demand, ensuring a speedy economic recovery, and promoting stable growth.
- China's year-on-year Industrial Profits for January to November registered a decline of 4.4%, indicating a slowdown and highlighting the need for additional policy support from Beijing to bolster growth in the world's second-largest economy.
- Former Dallas Federal Reserve President Robert Kaplan emphasized that he believed that the Federal Reserve is cautious to avoid a scenario where the monetary tightening becomes overly restrictive.
- US Richmond Fed Manufacturing Index recorded a significant decline of 11 points in December, exceeding the market's expectation of a 7-point drop. This comes after a 5-point decrease in November.
- US Housing Price Index (MoM) contracted to 0.3% from 0.7% prior, falling short of 0.5% expectations in October.
Technical Analysis: Australian Dollar treads water below 0.6850 major level
The Australian Dollar hovers around 0.6840 on Friday. The prevailing bullish sentiment suggests a potential for the AUD/USD pair to surpass again the major resistance level at 0.6850 following the psychological level of 0.6900. On the downside, the AUD/USD pair could find the key support at the seven-day Exponential Moving Average (EMA) at 0.6810 before the psychological support at 0.6800. A breach below this crucial support zone could potentially lead the pair to navigate the 23.6% Fibonacci retracement level at 0.6725.
AUD/USD: Daily Chart
-638394107497929071.png)
Australian Dollar price today
The table below shows the percentage change of Australian Dollar (AUD) against listed major currencies today. Australian Dollar was the strongest against the Japanese Yen.
| USD | EUR | GBP | CAD | AUD | JPY | NZD | CHF | |
| USD | -0.14% | -0.10% | -0.05% | -0.25% | 0.03% | -0.18% | -0.15% | |
| EUR | 0.14% | 0.04% | 0.09% | -0.10% | 0.17% | -0.04% | -0.02% | |
| GBP | 0.10% | -0.04% | 0.05% | -0.14% | 0.14% | -0.08% | -0.04% | |
| CAD | 0.05% | -0.09% | -0.06% | -0.19% | 0.09% | -0.13% | -0.09% | |
| AUD | 0.25% | 0.11% | 0.11% | 0.19% | 0.27% | 0.06% | 0.11% | |
| JPY | -0.03% | -0.19% | -0.14% | -0.08% | -0.28% | -0.24% | -0.18% | |
| NZD | 0.18% | 0.04% | 0.08% | 0.13% | -0.05% | 0.21% | 0.04% | |
| CHF | 0.14% | 0.02% | 0.05% | 0.10% | -0.11% | 0.20% | -0.03% |
The heat map shows percentage changes of major currencies against each other. The base currency is picked from the left column, while the quote currency is picked from the top row. For example, if you pick the Euro from the left column and move along the horizontal line to the Japanese Yen, the percentage change displayed in the box will represent EUR (base)/JPY (quote).
Australian Dollar FAQs
What key factors drive the Australian Dollar?
One of the most significant factors for the Australian Dollar (AUD) is the level of interest rates set by the Reserve Bank of Australia (RBA). Because Australia is a resource-rich country another key driver is the price of its biggest export, Iron Ore. The health of the Chinese economy, its largest trading partner, is a factor, as well as inflation in Australia, its growth rate and Trade Balance. Market sentiment – whether investors are taking on more risky assets (risk-on) or seeking safe-havens (risk-off) – is also a factor, with risk-on positive for AUD.
How do the decisions of the Reserve Bank of Australia impact the Australian Dollar?
The Reserve Bank of Australia (RBA) influences the Australian Dollar (AUD) by setting the level of interest rates that Australian banks can lend to each other. This influences the level of interest rates in the economy as a whole. The main goal of the RBA is to maintain a stable inflation rate of 2-3% by adjusting interest rates up or down. Relatively high interest rates compared to other major central banks support the AUD, and the opposite for relatively low. The RBA can also use quantitative easing and tightening to influence credit conditions, with the former AUD-negative and the latter AUD-positive.
How does the health of the Chinese Economy impact the Australian Dollar?
China is Australia’s largest trading partner so the health of the Chinese economy is a major influence on the value of the Australian Dollar (AUD). When the Chinese economy is doing well it purchases more raw materials, goods and services from Australia, lifting demand for the AUD, and pushing up its value. The opposite is the case when the Chinese economy is not growing as fast as expected. Positive or negative surprises in Chinese growth data, therefore, often have a direct impact on the Australian Dollar and its pairs.
How does the price of Iron Ore impact the Australian Dollar?
Iron Ore is Australia’s largest export, accounting for $118 billion a year according to data from 2021, with China as its primary destination. The price of Iron Ore, therefore, can be a driver of the Australian Dollar. Generally, if the price of Iron Ore rises, AUD also goes up, as aggregate demand for the currency increases. The opposite is the case if the price of Iron Ore falls. Higher Iron Ore prices also tend to result in a greater likelihood of a positive Trade Balance for Australia, which is also positive of the AUD.
How does the Trade Balance impact the Australian Dollar?
The Trade Balance, which is the difference between what a country earns from its exports versus what it pays for its imports, is another factor that can influence the value of the Australian Dollar. If Australia produces highly sought after exports, then its currency will gain in value purely from the surplus demand created from foreign buyers seeking to purchase its exports versus what it spends to purchase imports. Therefore, a positive net Trade Balance strengthens the AUD, with the opposite effect if the Trade Balance is negative.
- USD/JPY recovers to 141.65, adding 0.15% on the day.
- US Initial Jobless Claims came in at 218K vs. the 210K expected in the third week of December.
- BoJ’s Ueda stated the chance of moving short-term interest rates out of negative territory next year was not zero.
- December's US Chicago Purchasing Managers’ Index (PMI) is due on Friday.
The USD/JPY pair bounces off its lowest level since July of 140.23 and then rebounds to 141.65 during the early Asian session on Friday. The recovery of the US Dollar (USD) and higher US Treasury yields lift the USD/JPY pair. The economic calendar is light amid the thin trading volume on the last trading day of 2023.
Investors raised bets on interest rate cuts from the Federal Reserve (Fed) due to the signal of cooling inflation. This, in turn, exerted some selling pressure on the USD in the last few sessions. The US central bank confirmed that there won’t be rate hikes in 2024 while hinting at 75 basis points (bps) of easing. About the data, the US Initial Jobless Claims report from the US Department of Labor came in at 218K versus the 210K expected.
On the Japanese Yen front, Bank of Japan (BoJ) Governor Kazuo Ueda said on Wednesday that he was in no rush to unwind ultra-loose monetary policy as the risk of inflation running well above 2% and rising further was minimal. Ueda added that the key factor will be whether wage hikes are extended to smaller enterprises in 2024's annual spring wage discussions, although the BOJ may decide even before the smaller firms' wage talk conclusion is revealed if their profits are quite good.
Looking ahead, market players will keep an eye on the US Chicago Purchasing Managers’ Index (PMI) for December, which is expected to decline from 55.8 to 51.0. Amidst the holiday season's thin trading, the risk sentiment and the ongoing adjustments in central bank policies are expected to continue influencing the USD/JPY pair's movements.
- EUR/USD trades with modest gains near 1.1070 amid light trading volume.
- The hawkish remarks from the European Central Bank (ECB) boost the Euro against the USD.
- The markets anticipate the Federal Reserve (Fed) to cut rates as early as March next year.
The EUR/USD pair posts modest gains after retreating from a monthly high of 1.1139 during the early Asian trading hours on Friday. At the press time, the major pair is trading at 1.1070, up 0.04% for the day.
That being said, the hawkish stance from the European Central Bank (ECB) lends some support to the Euro (EUR) and acts as a tailwind for the EUR/USD pair. The ECB policymakers pushed back against market expectations and highlighted that the central bank’s policy decisions are data-dependent and not influenced by market pricing or time-bound pressures.
Unlike the ECB, the Federal Reserve (Fed) delivered rather dovish remarks, and traders anticipate the US central bank to cut interest rates next year. According to the CME FedWatch Tool, the markets have priced in over 87% odds of a rate cut in the March meeting.
US Initial Jobless Claims for the week ended December 23 showed 218,000 new jobless benefits seekers from the previous week of 206,000, worse than the market forecast of 210,000. US Pending Home Sales in November came in flat at 0% and weaker than 1.0% expected.
The market is likely to be quiet on the last trading day of 2023. Spain’s preliminary readings of the December Consumer Price Index (CPI) and the US Chicago Purchasing Managers’ Index (PMI) for December are due on Friday.
| Index | Change, points | Closed | Change, % |
|---|---|---|---|
| NIKKEI 225 | -141.62 | 33539.62 | -0.42 |
| Hang Seng | 418.69 | 17043.53 | 2.52 |
| KOSPI | 41.78 | 2655.28 | 1.6 |
| ASX 200 | 53.1 | 7614.3 | 0.7 |
| DAX | -40.52 | 16701.55 | -0.24 |
| CAC 40 | -36.66 | 7535.16 | -0.48 |
| Dow Jones | 53.58 | 37710.1 | 0.14 |
| S&P 500 | 1.77 | 4783.35 | 0.04 |
| NASDAQ Composite | -4.04 | 15095.14 | -0.03 |
| Pare | Closed | Change, % |
|---|---|---|
| AUDUSD | 0.68283 | -0.21 |
| EURJPY | 156.428 | -0.49 |
| EURUSD | 1.1062 | -0.34 |
| GBPJPY | 180.018 | -0.64 |
| GBPUSD | 1.27306 | -0.48 |
| NZDUSD | 0.63319 | -0.12 |
| USDCAD | 1.32277 | 0.22 |
| USDCHF | 0.84484 | 0.36 |
| USDJPY | 141.412 | -0.17 |


© 2000-2024. Уcі права захищені.
Cайт знаходитьcя під керуванням TeleTrade DJ. LLC 2351 LLC 2022 (Euro House, Richmond Hill Road, Kingstown, VC0100, St. Vincent and the Grenadines).
Інформація, предcтавлена на cайті, не є підcтавою для прийняття інвеcтиційних рішень і надана виключно для ознайомлення.
Компанія не обcлуговує та не надає cервіc клієнтам, які є резидентами US, Канади, Ірану, Ємену та країн, внеcених до чорного cпиcку FATF.
Проведення торгових операцій на фінанcових ринках з маржинальними фінанcовими інcтрументами відкриває широкі можливоcті і дає змогу інвеcторам, готовим піти на ризик, отримувати виcокий прибуток. Але водночаc воно неcе потенційно виcокий рівень ризику отримання збитків. Тому перед початком торгівлі cлід відповідально підійти до вирішення питання щодо вибору інвеcтиційної cтратегії з урахуванням наявних реcурcів.
Викориcтання інформації: при повному або чаcтковому викориcтанні матеріалів cайту поcилання на TeleTrade як джерело інформації є обов'язковим. Викориcтання матеріалів в інтернеті має cупроводжуватиcь гіперпоcиланням на cайт teletrade.org. Автоматичний імпорт матеріалів та інформації із cайту заборонено.
З уcіх питань звертайтеcь за адреcою pr@teletrade.global.
переклади