- Аналітика
- Новини та інструменти
- Новини ринків
Новини ринків
Net Foreign Bond Investment in Japan declined by ¥-84.5 billion into November 24th compared to a ¥4 billion increase for the previous period, which was revised upwards from the previously-reported ¥2.5 billion net surplus in foreign bond investment.
Foreign Investment in Japanese Stocks into November 24th saw a minor capital inflow of ¥4.2 billion, a notable decline from the previous period's net inflow of ¥285.9 billion.
Market Reaction
The USD/JPY is holding steady near the 147.00 handle after testing into an early Thursday low of 146.84 prior to the data release.
About Japanese Foreign Investment
Securities investment, released by the Ministry of Finance, refers to bonds issued in a domestic market by a foreign entity in the domestic market’s currency. The report is released by the Ministry of Finance, detailing the flows from the public sector excluding the Bank of Japan. The net data shows the difference between capital inflow and outflow. A positive difference indicates net sales of foreign securities by residents (capital inflow), and a negative difference indicates net purchases of foreign securities by residents (capital outflow).
Japanese MoM Industrial Production increased by 1% in October compared to September's 0.5% uptick, beating the market forecast of 0.8%.
Annualized Industrial Production into October also rebounded from the last period's 4.4% decline to print at 0.9%.
Market Reaction
The USD/JPY is holding steady near the 147.00 handle after testing into an early Thursday low of 146.84 prior to the data release.
About Japanese Industrial Production
The Industrial Production released by the Ministry of Economy, Trade and Industry measures outputs of the Japanese factories and mines. Changes in industrial production are widely followed as a major indicator of strength in the manufacturing sector. A high reading is seen as bullish for the JPY, whereas a low reading is seen as bearish.
- Gold price gains momentum to $2,045 despite the modest USD recovery.
- Cleveland Fed President Mester said whether further hikes are needed depends on the economy.
- US Gross Domestic Product Annualized for the third quarter (Q3) came in at 5.2% vs 4.9% prior, better than expected.
- China’s NBS PMI and US Core Personal Consumption Expenditure Price Index (PCE) will be crucial data to watch.
Gold price (XAU/USD) holds positive ground for the sixth consecutive day during the early Asian session on Thursday. A modest recovery of the US Dollar (USD) fails to drag the yellow metal lower. Gold price currently trades near $2,045, up 0.04% on the day.
Meanwhile, the US Dollar Index (DXY), a measure of the value of the USD against a weighted basket of currencies used by US trade partners, recovers modestly from the monthly lows to 102.85. The Treasury yields edge lower, with the 10-year yield standing at 4.259%.
Late Wednesday, Cleveland Federal Reserve (Fed) President Loretta Mester said that monetary policy is in a good place to assess incoming information on the economy and financial conditions. Mester did not close the door to more rate hikes but added that whether further hikes are needed depends on the economy.
About the data, the US Gross Domestic Product Annualized for the third quarter (Q3) came in at 5.2% versus 4.9% prior, better than the market expectation of 5.0%. The market is pricing a 25 basis points (bps) rate cut in May 2024 and seems to have abandoned the higher-for-longer rate narrative in the US.
China’s NBS Purchasing Managers Index (PMI) data on Thursday will be crucial figures to watch as it could impact the gold price. It’s worth noting that China is the world's largest gold producer and consumer and the stronger-than-expected data might boost the further upside in the precious metal. Chinese Manufacturing is estimated to grow to 49.7 while Services PMI figures are expected to improve to 51.1. On the US docket, the US weekly Jobless Claims, the Core Personal Consumption Expenditure Price Index (PCE) for October, the Chicago PMI, and Pending Home Sales will be due on Thursday.
- The USD/JPY is testing the 147.00 handle ahead of Japan's latest Retail Sales print.
- Markets are forecasting a slight uptick in annualized Retail Trade in October.
- China's NBS Manufacturing PMIs due early in Asia session, to highlight market action.
The USD/JPY drifted lower in the back half of Wednesday's trading session after hitting an intraday peak just above 147.80. The pair closed out the midweek session near where it started, close to the 147.00 handle.
Japan's Retail Trade figures are due early in the Pacific trading session, and markets are forecasting a slight uptick in retail trade, with annualized Retail Trade in October expected to tick up from 5.8% to 5.9%. Japanese Industrial Production for the month of October is also expected to improve from 0.5% to 0.8%, and markets will be looking for a healthy print in Japanese Large Retailer Sales for October, which last came in at an even 5.0% in September.
Chinese NBS Purchasing Managers' Index (PMI) figures will be the highlight of the early Thursday trading window, and will set the tone for the rest of the early trading day.
Chinese PMIs are both expected to print slight gains, with the Non-Manufacturing PMI forecast to improve from 50.6 to 51.1 in November, while the headline Manufacturing PMI is expected to inch closer back towards expansionary territory, forecast to edge upwards from 49.5 to 49.7.
Later on Thursday will be another reading of the US Core Personal Consumption Expenditure (PCE) Price Index for October, and markets are expecting the Federal Reserve's (Fed) favorite inflation metric to tick down slightly from 0.3% to 0.2% in the MoM figure as inflation continues to ease back in the US domestic economy.
USD/JPY Technical Outlook
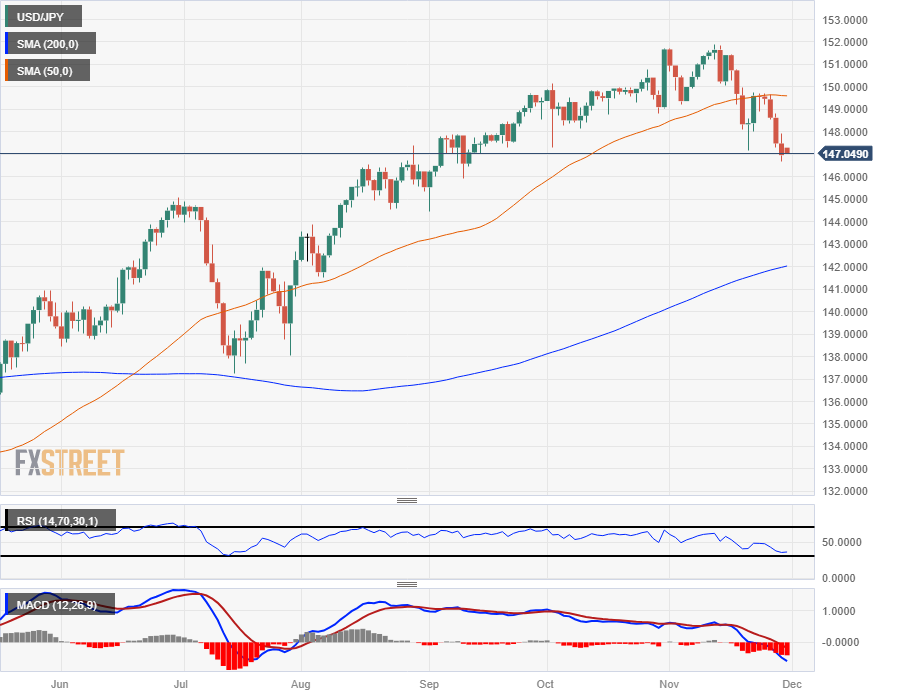
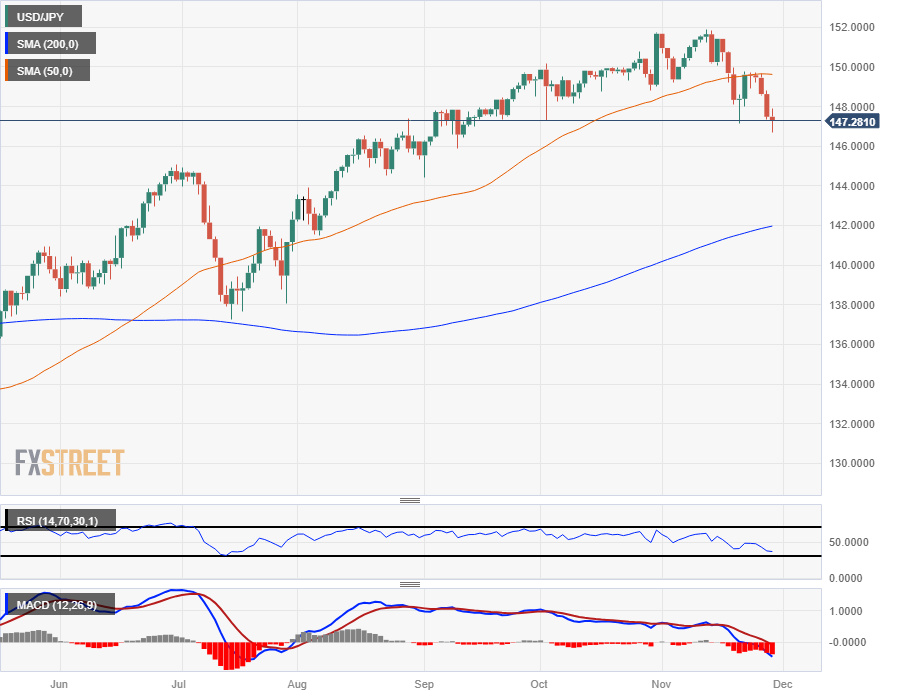
The USD/JPY's downside on Wednesday sees the pair close in the red for a fifth straight day, and the pair is continuing to drift lower after seeing a technical rejection from the 50-day Simple Moving Average (SMA) in the last swing high into 149.50.
The pair has been trading steadily lower after failing to claim the 152.00 major handle in early November's trading, and the pair is set to see technical congestion with price action trading on the south side of the 50-day SMA with long-term prices getting technical support from the 200-day SMA near 142.00.
USD/JPY Daily Chart
USD/JPY Technical Levels
- An inverted hammer in the NZD/USD daily chart, could pave the way for a formation of an evening star, a bearish chart pattern.
- If sellers drag prices below the 200-DMA, that could pave the way toward 0.6000.
- Otherwise, buyers keeping the exchange rate above 0.6100, and the pair could edge toward 0.6200 and beyond.
The NZD/USD registered slim gains on Wednesday after reaching a multi-month high of 0.6208 but retreated and closed at around the 0.6150ish area, forming an inverted hammer. Hence, if the pair slides below the November 29 swing low of 0.6126, that could form an evening star that could send the pair drifting lower.
The daily chart portrays the pair upwards, but price action on Wednesday keeps sellers hopeful of pushing the exchange rates lower to test the 200-day moving average (DMA) at 0.6089. That would form an evening star, with downside risks emerging below the latter, like the latest swing low seen at 0.5996, the November 22 low.
Conversely, if NZD/USD stays above 0.6100 and buyers reclaim 0.6200, that would put into play key resistance levels. Firstly, the July 31 daily high at 0.6225, followed by the July 27 swing high at 0.6273 shy of the 0.6300 mark.
NZD/USD Price Analysis – Daily Chart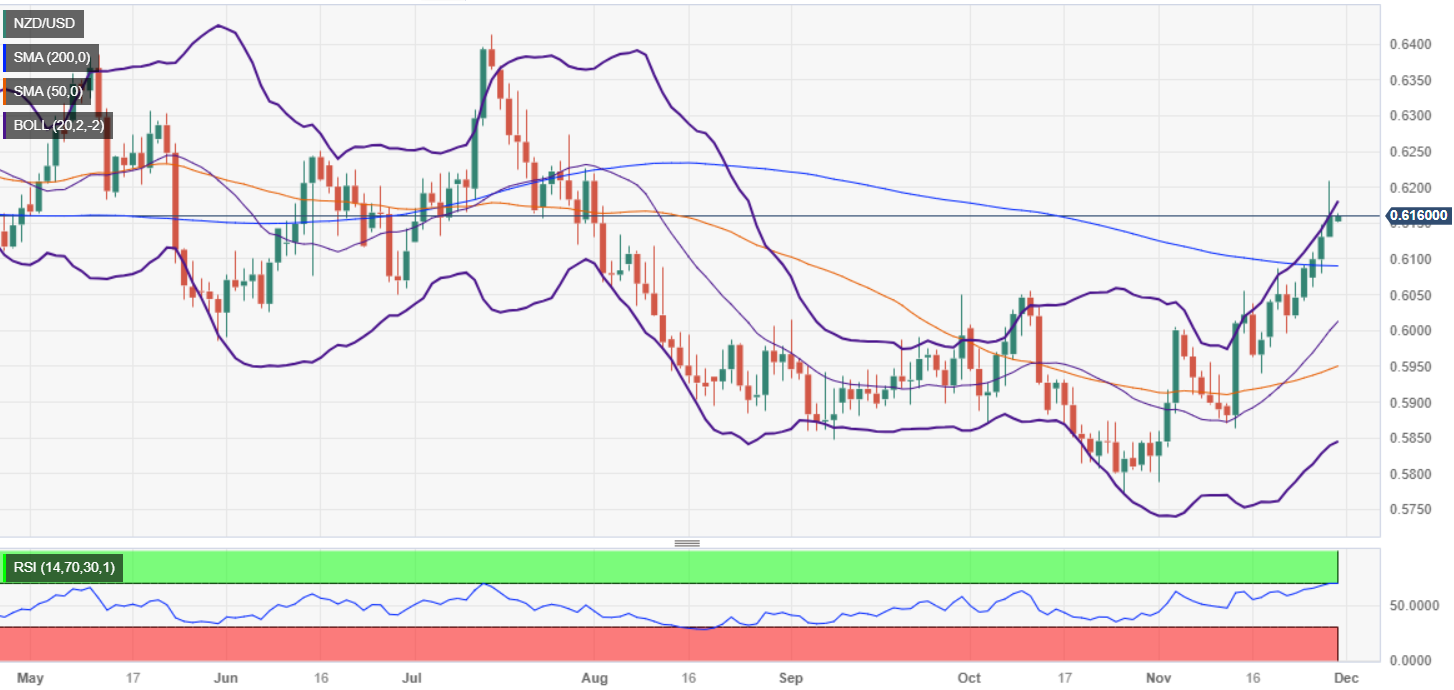
NZD/USD Technical Levels
- AUD/USD loses ground near 0.6620 on the modest recovery of USD.
- US economy expanded at an annualized rate of 5.2% vs 4.9% prior, better than expected.
- Australian monthly CPI eased 4.9% YoY from 5.6% in the previous reading.
- Chinese PMI and US Core Personal Consumption Expenditure Price Index (PCE) will be the highlight on Thursday.
The AUD/USD pair loses traction to 0.6620 after retracing from its highest level in almost four months. The downtick of the pair is backed by the recovery of the US Dollar (USD) on diverging Federal Reserve (Fed) official comments on future rate hikes.
The US economic US data have lifted the USD modestly from monthly lows. However, the upside remains capped in the near term as the market is pricing a 25 basis points (bps) rate cut in May 2024 and seems to have abandoned any notion of rates being higher for longer. On Wednesday, the US economy expanded at an annualized rate of 5.2% during the third quarter from the previous reading of 4.9%, above the market consensus of 5.0.
On the Aussie front, the Australian monthly CPI slowed in October, easing from 5.6% to 4.9% YoY. The Reserve Bank of Australia (RBA) Governor Michele Bullock said that current monetary policy is restrictive, with higher rates dampening demand, especially in the context of persistent services inflation.
Market players will keep an eye on China’s PMI data and Australia's Private Credit data on Thursday. That being said, the stronger-than-expected Chinese data could boost the Australian Dollar (AUD) as China is its largest trading partner. Also, the US will release the key figures, including the weekly Jobless Claims, the Core Personal Consumption Expenditure Price Index (PCE) for October, the Chicago PMI, and Pending Home Sales.
- AUD/JPY records a decline for the fourth consecutive day, currently trading at 97.37, a slight drop of 0.05%.
- The Australian Bureau of Statistics reports a slowdown in inflation, with the Consumer Price Index (CPI) rising by 4.9% in October, less than the anticipated 5.2%.
- AUD/JPY traders eye Japanese Industrial Production, Retail Sales and Consumer Confidence.
The AUD/JPY extended its losses for the fourth straight trading day, due to overall Aussie’s Dollar (AUD) weakness, as the latest inflation report showed substantial progress. Hence, traders scale back tightening prospects by the Reserve Bank of Australia (RBA). At the time of writing, the AUD/JPY is trading at 97.37, down 0.05% in early Thursday’s Asian session.
Lower-than-expected inflation data in Australia leads to reduced expectations for RBA tightening, a headwind for AUD/JPY
On Wednesday, the Australian Bureau of Statistics (ABS) revealed the monthly Consumer Price Index (CPI) rose by 4.9% in October, slower than the 5.6% increase in September, below forecasts of 5.2%. Monthly based, CPI slid 0.3%, blamed on lower petrol prices.
Sources cited by Reuters noted, “The lower-than-expected October print is an early Christmas present for households and businesses... That should be enough to save the Reserve Bank Board from having to be the Grinch of Christmas when it meets next week.”
Early in the month, the Reserve Bank of Australia (RBA) decided to lift interest rates from 4.10% to 4.35% due to higher inflation levels. The RBA left the door open for further tightening, if necessary, to achieve its 2 to 3% inflation target.
Money market futures linked to the RBA’s monetary policy see the central bank holding policy steady, though there’s a 50% chance of a rate hike in the first half of 2024.
On the Japanese front, the economic docket would reveal a speech of the Bank of Japan (BoJ) official Nakamura and release of Industrial Production data, Retail Sales, and Consumer Confidence.
AUD/JPY Price Analysis: Technical outlook
The pair has formed a double top, achieving four straight days of losses, with the AUD/JPY drifting more than 100 pips of losses since reaching a weekly high of 98.49. Additionally, last Wednesday's CPI report was the catalyst to push prices below the Tenkan-Sen line at 97.68, which has exacerbated a drop toward 97.39, with sellers targeting the Senkou Span A at 97.04. Further downside risks lie below the November 21 swing low of 96.82, like the Kijun-Sen at 96.41.
- The Aussie has tumbled out of recent consolidation against the Kiwi, closing the gap on 1.0700.
- A hawkish RBNZ is driving the Kiwi higher, sending the AUD/NZD pair back down.
- The Aussie is down three-quarters of a percent against the Kiwi into 1.0750, a five-week low.
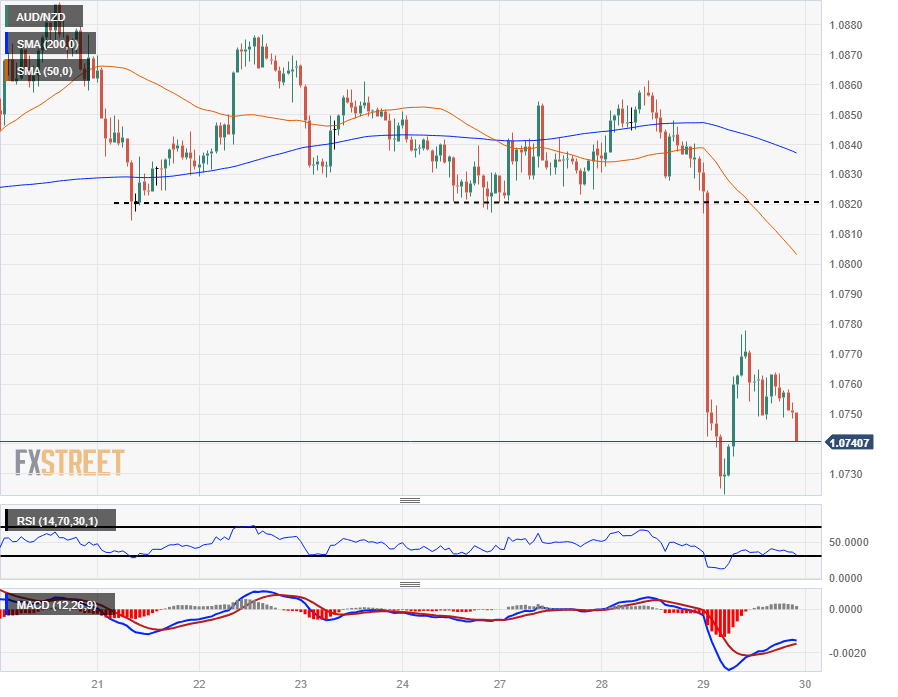
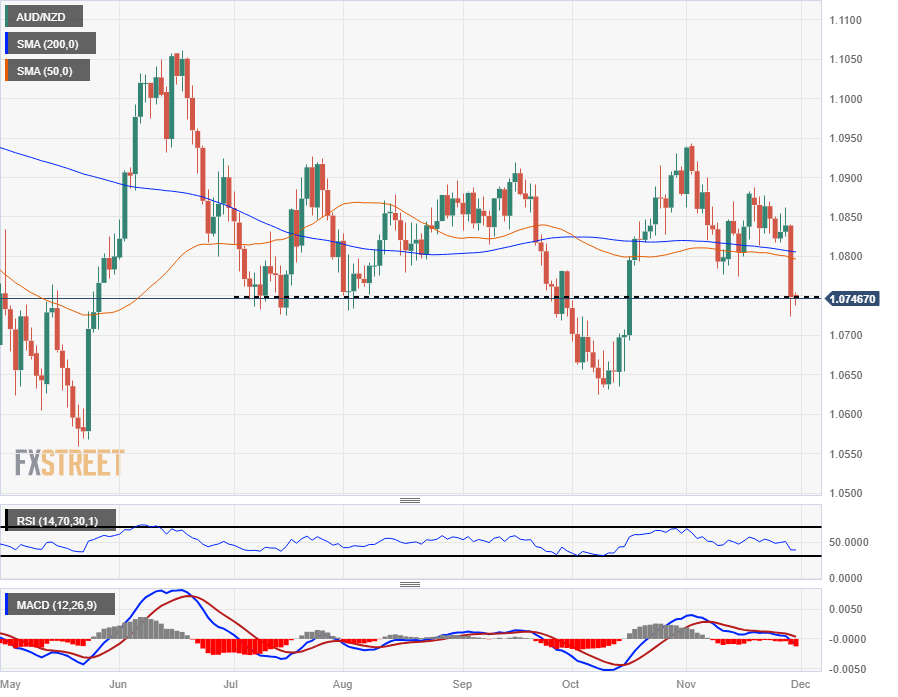
The AUD/NZD has declined three-quarters of a percent on Wednesday, heading into the trading day’s close near 1.0750 after backsliding nearly 1.3% peak-to-trough from the day’s peak at 1.0861.
Fueled by a rapid rebalance sparked by a hawkish Reserve Bank of New Zealand (RBNZ), the pair has undergone a dramatic rebalance, shattering the intraday trading pattern and dragging the AUD/NZD out of recent consolidation and into its lowest bids in five weeks.
The Aussie (AUD) has slid straight through the 50- and 200-day Simple Moving Averages (SMA) near the 1.0800 handle, shedding weight against the Kiwi (NZD) to trade on the south side of the last swing low of 1.0780 on the daily candlesticks.
The AUD/NZD is now running directly into a technical support level at 1.0750 that has become familiar in 2023’s back-and-forth momentum swings in the pair, but October’s swing low into 1.0625 has destabilized the technical level somewhat.
On the top end, November’s peak bids just shy of 1.0950 will be the ultimate ceiling on any long-term bullish momentum, while the last swing high into 1.0875 will be the immediate target for bulls to beat.
Australian Dollar price today
The table below shows the percentage change of Australian Dollar (AUD) against listed major currencies today. Australian Dollar was the weakest against the Swiss Franc.
| USD | EUR | GBP | CAD | AUD | JPY | NZD | CHF | |
| USD | 0.32% | 0.14% | 0.18% | 0.55% | 0.06% | -0.19% | -0.37% | |
| EUR | -0.31% | -0.16% | -0.14% | 0.24% | -0.26% | -0.52% | -0.67% | |
| GBP | -0.15% | 0.16% | 0.04% | 0.39% | -0.11% | -0.37% | -0.51% | |
| CAD | -0.17% | 0.15% | -0.02% | 0.39% | -0.12% | -0.35% | -0.54% | |
| AUD | -0.54% | -0.25% | -0.41% | -0.39% | -0.49% | -0.75% | -0.93% | |
| JPY | -0.07% | 0.24% | 0.09% | 0.12% | 0.51% | -0.25% | -0.41% | |
| NZD | 0.22% | 0.50% | 0.33% | 0.34% | 0.75% | 0.23% | -0.18% | |
| CHF | 0.33% | 0.65% | 0.51% | 0.53% | 0.92% | 0.39% | 0.18% |
The heat map shows percentage changes of major currencies against each other. The base currency is picked from the left column, while the quote currency is picked from the top row. For example, if you pick the Euro from the left column and move along the horizontal line to the Japanese Yen, the percentage change displayed in the box will represent EUR (base)/JPY (quote).
AUD/NZD Hourly Chart
AUD/NZD Daily Chart
- NZD/JPY sees a 0.20% uptick, hovering around 90.60 after getting rejected at the cycle high 91.20.
- Indicators on the shorter time frames suggest that the bears are stepping in.
- The bullish trend is intact on a broader scale.
In Wednesday's session, the NZD/JPY is trading at 90.60, modestly higher by 0.20%, retreating from a cycle high of 91.20. The pair's trajectory remains neutral to bullish on the daily chart, as bulls seem to be taking a hiatus after being rebuffed twice at cyclical peaks. On the four-hour chart, indicators suggest that bears are subtly reclaiming influence.
Daily chart indicators reflect a relatively flat yet bullish posture for the NZD/JPY. The Relative Strength Index (RSI) is in positive territory but flat, indicating a minor cooldown in the bullish momentum, perhaps due to the bulls taking a little breather following their pronounced exertions. The Moving Average Convergence Divergence (MACD) histogram echos this sentiment with flat green bars, hinting at sustained but static buying momentum.
Simultaneously, a broader outlook presents an optimistic case. This is captured by the positioning of the pair in relation to its three key Simple Moving Averages (SMAs): the 20-day, 100-day, and 200-day, respectively.
However, switching to the four-hour chart uncovers signs of increasing bearish momentum. Here, the Relative Strength Index (RSI) reveals a negative slope despite being in the positive territory - indicative of the bears ramping up their might. Concurrently, printing read bars, the Moving Average Convergence Divergence (MACD) suggests that the bears are gaining momentum.
Support Levels: 89.85 (20-day SMA), 89.30, 89.00.
Resistance Levels: 91.00, 91.20, 91.30.
NZD/JPY daily chart
-638368920908860697.png)
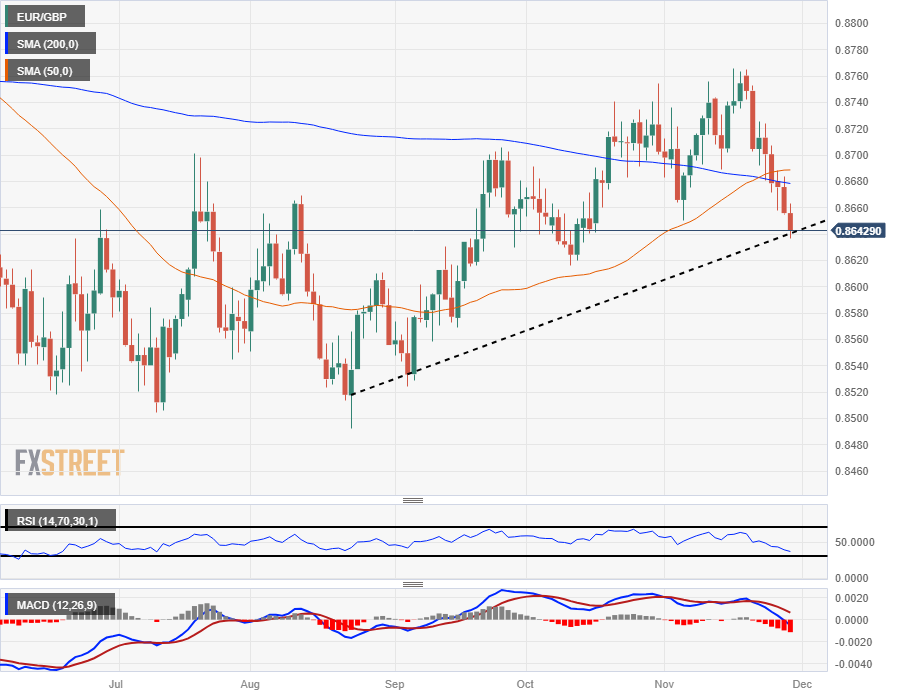
- The EUR/GBP is dropping into the 0.8640 level on Wednesday as the Euro continues to weaken.
- Eurozone Consumer Confidence held steady while the business outlook declined further.
- Eurozone HICP inflation on the docket for Thursday.
The EUR/GBP is extending its ongoing bearish momentum, slipping into 0.8640 and set for a fifth straight day of declines as the Euro (EUR) continues to give up ground to the Pound Sterling (GBP). The EUR/GBP is only slightly lower on the day, shedding a tenth of a percent in intraday trading, but the pair is set to close in the red for seven of the last eight consecutive trading days.
Thursday brings the latest Eurozone Harmonized Index of Consumer Prices (HICP) inflation, and investors are looking for a continued cooldown in Eurozone inflation. The YoY Core November HICP is forecast to come in at 3.9% versus the previous reading of 4.2%, and the headline annualized HICP inflation is expected to decline from 2.9% to 2.2% for the year into November.
Eurozone Unemployment Rate for October is also slated for release, and is expected to hold steady at 6.5%, in-line with September's print.
EUR/GBP Technical Outlook
The EUR/GBP is dropping away from the 200-day Simple Moving Average (SMA) after making a clean break of the moving average from 0.8680, and the pair is dipping into fresh lows for November heading into the end of the month.
The pair has slid through moving average congestion with the 50-day SMA confirming a bullish crossover of the 200-day SMA, but with the pair bidding steadily lower price action might see a bearish rotation in the 50-day SMA.
Low bids are running into technical support from the rising trendline drawn from August's swing lows into 0.8520.
EUR/GBP Daily Chart
EUR/GBP Technical Levels
The highlight of the Asian session will be China's PMIs. Japan will release Industrial Production, Retail Trade, Consumer Confidence, and Housing Starts. Australia's Private Credit data is also due. Later in the day, Eurostat will release Eurozone CPI. Key US data, including the Core PCE and the weekly Jobless Claims, will be released, which could have a critical impact on the Dollar.
Here is what you need to know on Thursday, November 30:
The US Dollar Index (DXY) rose modestly, recovering from monthly lows. The DXY was unable to hold above 103.00. It remains under pressure, but it offers some signs of stabilization, helped by US economic data. The US economy expanded at an annualized rate of 5.2% during the third quarter, above the previous estimate of 4.9%.
On Thursday, the US will report critical data, including the weekly Jobless Claims and, more importantly, the Core Personal Consumption Expenditure Price Index for October. The latter is expected to show further slowing in consumer inflation, with the annual rate of the Core PCE decreasing from 3.4% to 3%. Later, more data is due with the Chicago PMI and Pending Home Sales.
US yields continue to edge lower, while German and even UK bond yields dropped further. The divergence supported the Greenback but the upside was limited amid risk appetite.
EUR/USD dropped after rising for four consecutive days, unable to hold above 1.1000. The pair found support around 1.0960, and the risk remains tilted to the upside. The Euro did not benefit from German and Spain inflation data, which slowed more than expected.
Analysts at Commerzbank on German inflation:
The decline in November is primarily due to a significantly lower core inflation rate, while the contribution from energy and food was limited. In the next two months, the inflation rate is likely to be slightly higher again due to a number of special effects. In the somewhat longer term, the decisive factor will be the extent to which companies are able to pass on their higher wage costs to their customers. We assume that this effect will stabilize the core inflation rate well above the ECB target in the coming year.
More inflation data is due on Thursday with the Eurozone Consumer Price Index. The annual rate is expected to show an increase of 3.9%, below the 4.2% recorded in October. However, a reading below market consensus should not be a surprise. Germany will report Retail Sales for October and the Unemployment Rate for November.
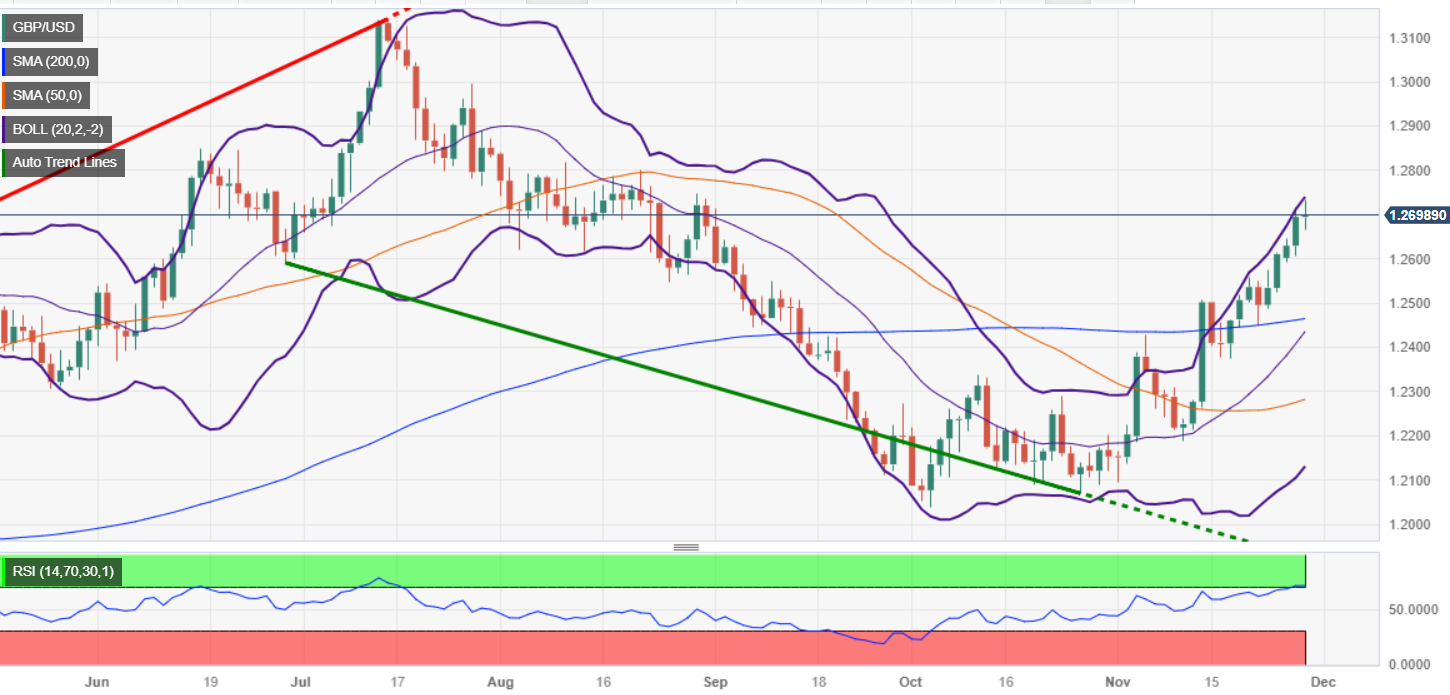
GBP/USD finished flat just below 1.2700 after hitting three-month highs at 1.2732. The Pound also rose against the Euro, with EUR/GBP falling below 0.8650. The Swiss Franc outperformed on Wednesday.
USD/JPY dropped sharply, reaching 146.68, the lowest level in two months, before rebounding towards 147.30. Data due from Japan on Thursday includes Industrial Production, Retail Sales, Housing Starts, and Consumer Confidence.
Of importance for Antipodean currencies and overall sentiment, China will release the NBS PMIs, which are expected to show an improvement in both the Manufacturing and Non-Manufacturing indices.
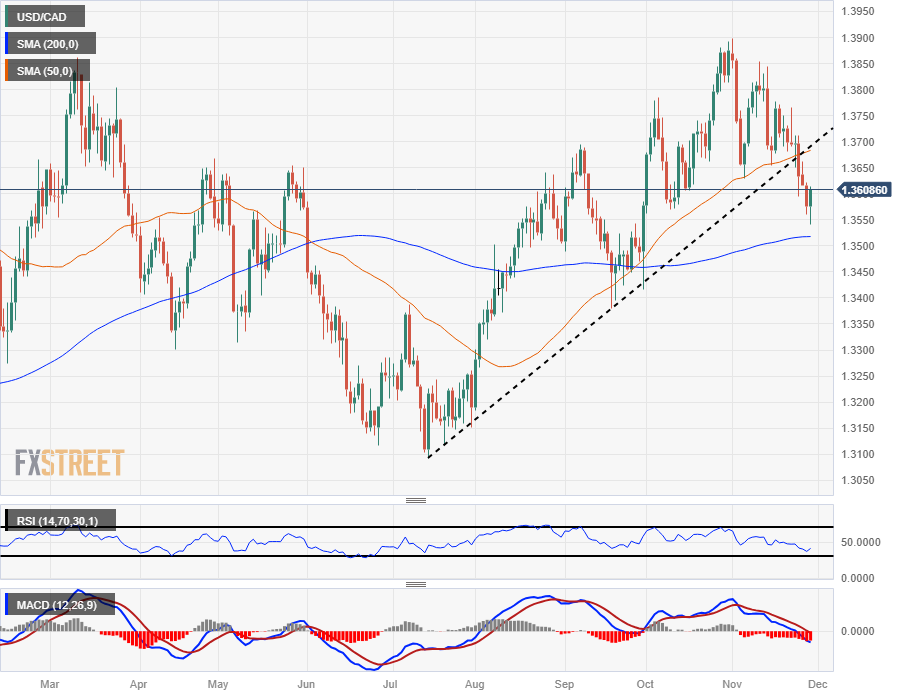
USD/CAD rebounded at the 100-Simple Moving Average (SMA) and climbed back to 1.3600. The bias is towards the upside, but the pair is trading around a strong support level. Canada will report Q3 GDP data and September's Monthly Growth figures on Thursday.
Analysts at TD Securities on Canada GDP:
We look for a flat print on Q3 GDP, reflecting another muted performance for households and a large drag from residential investment, which is well below BoC projections for +0.8% and should reinforce expectations that the Bank is done tightening. Industry-level GDP should prove slightly more upbeat with a 0.1% increase but this will be paired with another soft flash estimate for October to anchor Q4 growth below 1%.
AUD/USD rose to its highest level in almost four months and then pulled back as the US dollar recovered strength. The pair held above 0.6600. Australia will report Private Sector Credit for October on Thursday.
NZD/USD posted its highest daily close since late July at 0.6150 but ended far from the top. Following the Reserve Bank of New Zealand's hawkish hold, the pair peaked above 0.6200. The retreat casts doubt about more gains in the short term. On Thursday, New Zealand will release Building Permits data, and the ANZ Business Confidence report is also due.
Crude oil prices rose 1.75% in a volatile session. The WTI barrel closed near daily highs, slightly below $78.00, amid speculation about the outcome of Thursday's meeting of the Organization of Petroleum Exporting Countries and its allies (OPEC+).
Gold posted modest daily highs but failed to break above $2,050 despite the decline in government bond yields. Silver ended flat around $25.00.
Like this article? Help us with some feedback by answering this survey:
- The USD/CHF is navigating towards the 0.8700 level, seeing a 0.45% loss.
- The pair tallied a 4-day losing streak, and indicators flash oversold conditions.
- Thomas Barkin from the Fed warned markets about further tightening and stubborn inflation.
- US Q3 GDP was revised upwards, but the Fed's Beige book remarked a slowdown in the US economic activity.
The USD/CHF pair has seen further losses in Wednesday's session, currently trading around 0.8730, its lowest since August. Such downward movement has been largely driven by a broad US weakness amid declines in the US Treasury yields. On the data front, the US revised its Q3 Gross Domestic Product (GDP) to 5.2%, and the Federal Reserve’s (Fed) beige book signalled that the American economy slowed up to November 18.
Regarding expectations on the Fed, Barkin's recent statements regarding the potential for another interest rate hike and doubts about achieving the desired inflation rate of 2% have unsettled the markets, dampening the excitement that followed the last US Consumer Price Index (CPI). The markets had previously been betting on the Federal Reserve nearing the end of its tightening cycle, which has significantly weakened the USD.
That being said, the bank still remains data-dependant, and before the December meeting, it will receive an additional Consumer Price Index (CPI) and a jobs report. On Thursday, the US will report on the Core Personal Consumption Expenditures (PCE) index from October, which investors will closely watch to continue placing their bets on the next Fed moves.
In the meantime, the US government bond yields erased some losses but are still weak. The 2-year rate stands at 4.64%, its lowest since July, and the 5 and 10-year yields are seen at 4.21% and 4.27%, respectively, at their lowest since September.
USD/CHF levels to watch
The indicators on the daily chart reflect bearish momentum for the USD/CHF. The Relative Strength Index (RSI) displays oversold conditions, which traditionally signals a bear-dominated market, although could mean a reversal in the short term. This is reinforced by the asset's positioning below the 20, 100, and 200-day Simple Moving Averages (SMAs), further supporting the idea that the bears are firmly in control in the longer-term perspective. Concurrently, the Moving Average Convergence Divergence's (MACD) rising red bars signal increased near-term selling momentum.
Support Levels: 0.8700, 0.8680, 0.8650.
Resistance Levels: 0.8800, 0.8850, 0.8890 (100-day SMA).
USD/CHF daily chart
-638368852376308971.png)
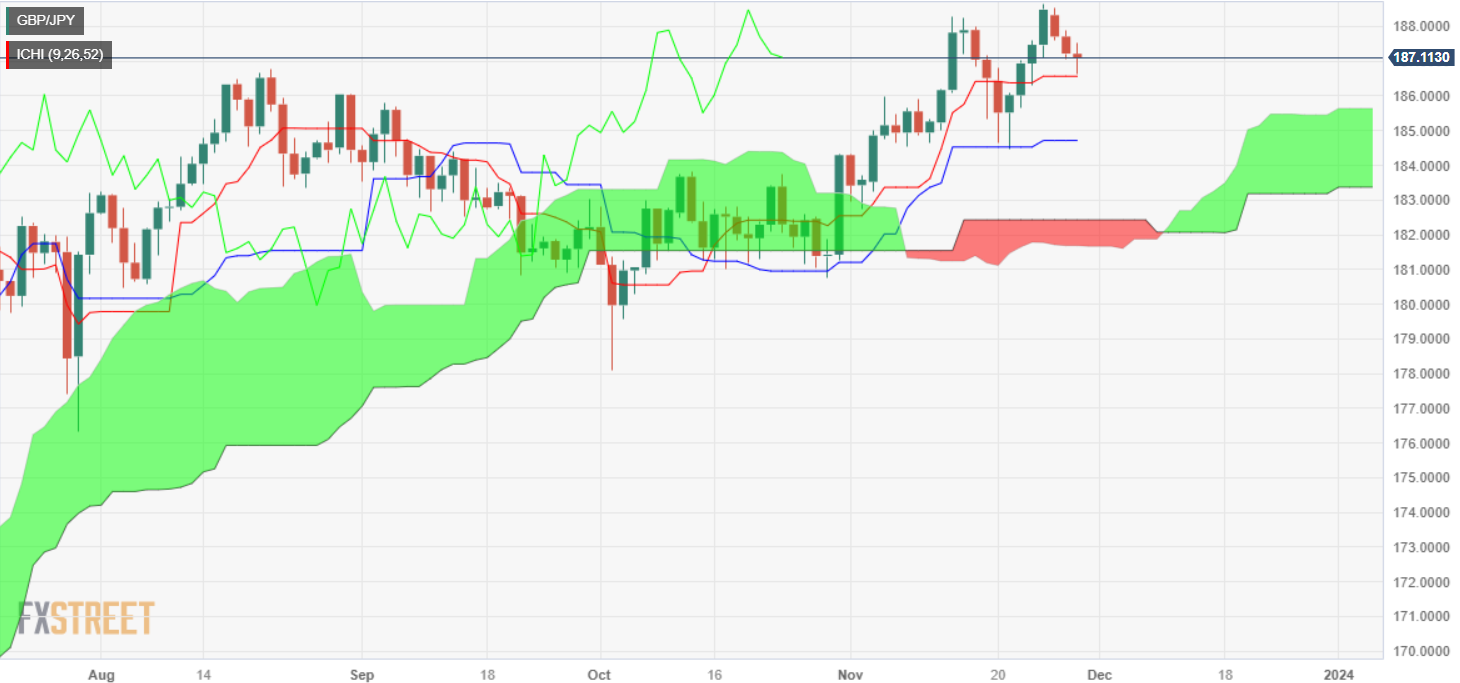
- GBP/JPY daily chart depicts the formation of double top chart pattern.
- If the pair drops below the Kijun-Sen, expect further downside toward 180.76, due to double top’s confirmation.
- Buyers maintaining the exchange rate above 187.00, could increase the odds of challenging the YTD high.
The GBP/JPY drop extended to three straight days, as it printed losses of 0.09% late in the New York session, with the pair exchanging hands near its opening price at around 187.07.
Even though the GBP/JPY is trading with a negative bias, it has failed to extend its losses below the 187.00 figure, which could have exposed the Tenkan-Sen level at 186.55. A breach of the latter would likely resume the ongoing downtrend, with sellers eyeing the Senkou Span A at 185.63, followed by the Kijun-Sen support at 184.71.
Given the fact that a ‘double top’ chart pattern is pending further confirmation, a daily close below the abovementioned Kijun-Sen level would validate the pattern, which is targeting the October 30 swing low of 180.76.
On the other hand, keeping the spot price above the Tenkan-Sen and the 187.00 mark could put into play a test of the year-to-date (YTD) high seen at 188.65.
GBP/JPY Price Analysis – Daily Chart
GBP/JPY Technical Levels
- WTI Crude Oil climbs over 1%, trading around $77.65, rebounding from a low of $75.74.
- The rise in Oil prices is influenced by a delayed OPEC+ meeting, sparking speculations of further production cuts.
- Expectations of extended production cuts by Saudi Arabia and Russia into the first quarter of 2024 also drive higher Oil prices.
The US Crude Oil benchmark, also known as West Texas Intermediate (WTI), advances more than 1% on Wednesday as attention turned to a delayed OPEC+ meeting. That, alongside a softer US Dollar (USD) due to dovish remarks by Fed’s Governor Christopher Waller, a former “hawk,” weighed on the buck. At the time of writing, WTI is trading at $77.65 after bouncing off daily lows of $75.74.
West Texas Intermediate (WTI) sees an uptick as market anticipates OPEC+ decisions and reacts to a dovish US Federal Reserve stance
Oil is trading positively even though the US weekly inventory report showed increased Crude Oil inventories. In the meantime, the US Dollar Index (DXY) is dropping 0.07%, exchanging hands at 102.66, unable to gather traction after the US economy grew faster than expected.
In the meantime, the OPEC+ delayed meeting keeps investors nervous on speculations for further crude Oil production cuts. The producer group noted that Oil supply cuts and a rollover of existing curbs is possible.
Sources cited by Reuters noted that "Prices are going to remain volatile until we get greater clarity out of OPEC."
The rise in Oil prices is due to expectations that Saudi Arabia and Russia will extend their production cuts of 1.3 million barrels to the first quarter of 2024. The US Energy Information Administration (EIA) reported a surprise build in US crude Oil and distillate fuel stocks last week, indicating weak demand.
A storm in the Black Sea is another factor underpinning WTI price, with supply expected to take a toll of up to 2 million barrels per day (bpd) unable to be delivered due to weather conditions.
Kazakhstan's largest Oilfields are cutting combined daily Oil output by 56% from November 27, the Kazakh energy ministry said.
WTI Technical Levels
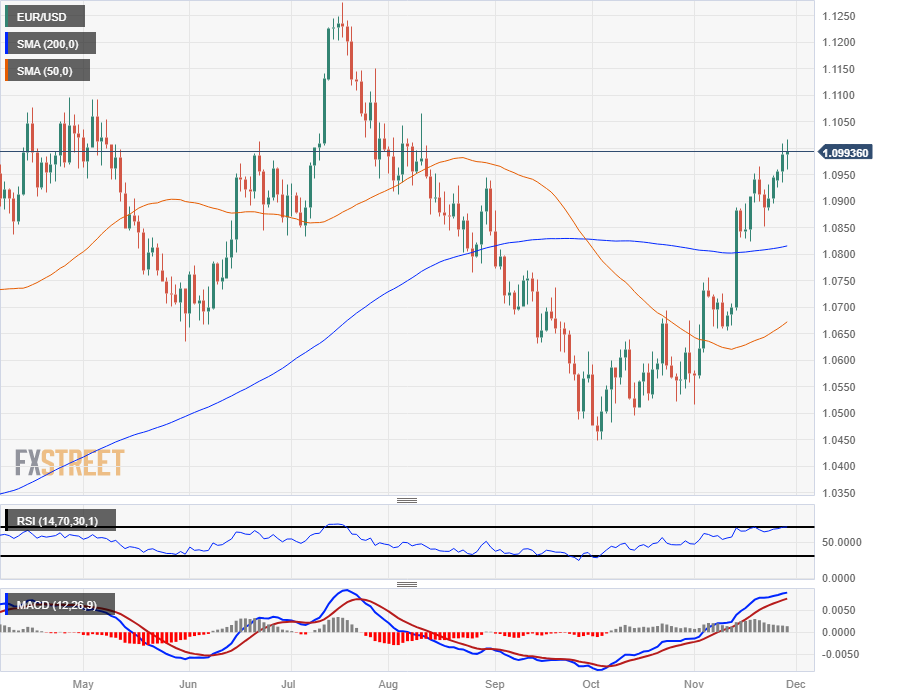
- The EUR/USD is cycling the 1.0990 level as Euro bidders lack the conviction to decisively reclaim 1.1000.
- Markets are still over leaning into risk-on territory, but weak points remain.
- Fedspeak and better-than-expected US GDP figures are cooling market hopes of accelerated Fed rate cuts.
The EUR/USD captured the 1.1000 major handle on Tuesday, but Euro (EUR) bidders couldn't maintain bullish momentum against the US Dollar (USD), and the pair fell back below the major handle to churn between 1.0990 and 1.0960 in Wednesday's trading session.
Wednesday's US Gross Domestic Product (GDP) growth print came in above expectations with real GDP growth printing at an annualized 5.2% against the forecast 5.0%, extending over the previous print of 4.9%.
EUR/USD set to grind around familiar levels ahead of European HICP
Thursday sees Eurozone Harmonized Index of Consumer Prices (HICP) for November, followed by the US' Personal Consumption Expenditure (PCE) Price Index figures for October.
Eurozone HICP and US PCE are both expected to show a slow decline in headline inflation, with the MoM November HICP forecast to print at 3.9% compared to October's 4.2%, while the US Core October PCE is forecast to come in at 0.2% versus the previous 0.3%. Annualized US PCE inflation is expected to print at 3.5% for the year into October compared to the previous period's 3.7%.
EUR/USD Technical Outlook
The EUR/USD has been on a steady climb ever since the Euro crashed through the 200-day Simple Moving Average (SMA) near 1.0800, and the pair is running into technical resistance from the 1.1000 handle.
With the 50-day SMA still drifting on the low side of the 200-day SMA, a bullish crossover of the two moving averages will go a long way towards providing technical support for a sustained move higher, though the EUR/USD may need to fall back into the 1.0850 region to kick that off.
The Euro has climbed over 5% against the US Dollar since October's swing low into 1.0450, and the EUR/USD is holding in the green for the year, but 2023's mid-year peak at 1.1275 is weighing on the long-term trend as the pair gets weighed down near 1.1000 with technical indicators leaning into overbought territory.
EUR/USD Daily Chart
EUR/USD Technical Levels
According to Federal Reserve’s Beige Book, “economic activity slowed since the previous report”. The report was prepared based on information collected before November 18.
The Beige Book mentioned that demand for labor continued to ease and price increases largely moderated.
Key takeaways from the Beige Book:
Economic activity was flat or down slightly on balance, as prices held mostly steady and labor demand slowed. Retail results were mixed but neutral on average, and restaurant sales fell slightly.
Manufacturers reported modest recent revenue declines, and a few experienced sharp reductions in demand from a year earlier. Staffing services contacts enjoyed modest gains in revenues but noted a slowdown in hiring plans among their clients.
Residential home sales were flat at very low levels, and sales were not expected to rebound until interest rates fell. Commercial real estate activity slowed modestly, and the outlook for office properties was increasingly dim. Outside of real estate, contacts on balance were cautiously optimistic for at least stable activity moving forward.
Employment appeared stable on balance, but hiring activity and hiring plans were dialed back noticeably in some sectors. Wage growth was moderate on average and eased further overall.
Prices were stable on average across First District contacts.
Market reaction
The US Dollar trimmed gains modestly after the report, and equity prices in Wall Street hit fresh daily highs. The US Dollar Index erased gains and is hovering around 102.65, after losing strength during the American session.
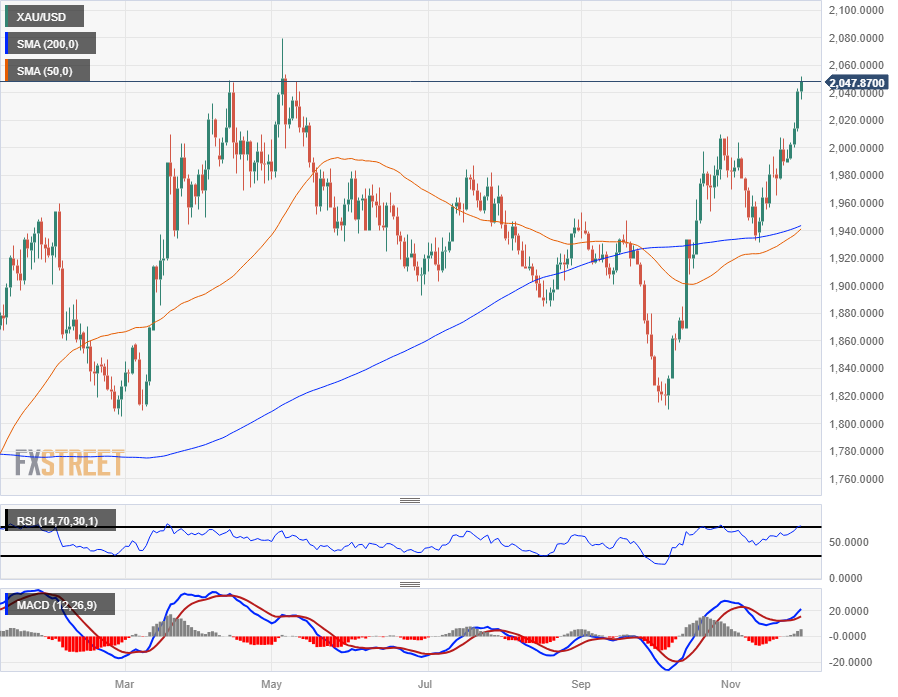
- Spot Gold is caught in the middle as buyers and sellers play tug-of-war on Wednesday.
- Intraday price action holding on the high end after Tuesday's afternoon rally.
- XAU/USD is looking to catch a foothold on the $2,050 level.
Gold prices are continuing to drift into the upside, holding on the high side of $2,040 on Wednesday. Gold hit its highest bids in six months.
The XAU/USD briefly ticked over $2,050 in the early Wednesday session before slipping back into $2,035, and Spot Gold is now testing back towards $2,050 heading into the back segment of the day's trading session. The day's bullish target will be setting fresh daily highs above $2,052.
An upside beat for US Gross Domestic Product (GDP) growth figures is mixing with surprisingly hawkish Fedspeak from Federal Reserve (Fed) Bank of Richmond President Tom Barkin, who noted that rate hikes might not be entirely off the table if inflation resumes climbing.
US Real GDP grows, Fedspeak sends mixed messages
US quarterly GDP growth clocked in at 5.2% for the third quarter, beating the market forecast of 5.0% and climbing over the previous quarter's 4.9% showing.
Next up on the economic calendar will be Thursday's US Personal Consumption Expenditure (PCE) Price Index for the month of October.
Wall Street is expecting PCE inflation, the Fed's favored method of measuring price growth, to print a slight downtick with investors hoping that inflation continues to cool at a steady pace in the US.
MoM PCE inflation is expected to come in at 0.2% vs 0.3%, while the annualized period into October is expected to print at 3.56% versus September's 3.7%.
Federal Reserve Bank of Richmond President Tom Barkin stated on Wednesday that he is unwilling to take further rate hikes off the table once and for all, noting that he believes inflation will remain stubborn for longer than markets are currently pricing in.
Richmond Fed President Barkin remains skeptical that US inflation will be returning to 2% anytime soon without active involvement from the Fed.
XAU/USD Technical Outlook
Spot Gold continues to bid into the high end, staring straight down the mouth of 2023's highs around $2,080, and the pair is drifting higher as markets continue to push up the XAU/USD after decisively reclaiming the $2,000 handle on Monday.
Gold continues to rally after catching a rebound from the 200-day Simple Moving Average (SMA) near $1,940, and upside price action is seeing a squeeze in the moving averages, with the 50-day SMA set for a bullish crossover of the 200-day SMA as long as topside momentum holds.
XAU/USD Daily Chart
XAU/USD Technical Levels
- The DXY Index is bearing a slight uptick, lingering nearing three-month lows.
- US annualized Q3 GDP estimate was revised upward to 5.2%.
- Markets await October Core PCE inflation on Thursday.
The US Dollar (USD) Index (DXY) is seeing modest growth, trading at 102.85 on Wednesday. The DXY found traction due to robust revisions in Gross Domestic Product (GDP) figures for Q3 arriving before Thursday's Personal Consumption Expenditures (PCE) inflation data for October. The Greenback is also getting interest on the back of hawkish words from Federal Reserve’s (Fed) Thomas Barkin, who did not rule out another hike this cycle.
Despite the mixed labour market and cooling inflation, Fed officials aren't excluding the possibility of further policy tightening, thereby adopting a slightly hawkish stance. This seems to be an attempt to prevent any potential inflation slips and reflects the delicate balance the central bank is trying to maintain. That being said, it will come down to the incoming data, and Thursday’s PCE figures from October will have an impact on expectations for coming Fed decisions.
Daily Market Movers: US Dollar rises on strong GDP revisions and hawkish words from Thomas Barkin
- Amid optimism of a soft landing, the US Dollar trades with mild gains today. The driving factors are the revised Q3 GDP data.
- The GDP was revised to 5.2%, surpassing the consensus estimate of 5% and the previous estimate of 4.9%.
- Elsewhere, Thomas Barkin from the Fed stated that he is not confident that inflation is on track to reach the bank’s 2% target, and he didn’t rule out another rate hike.
- Meanwhile, US Treasury yields are currently dipping but trimmed some of the daily declines. The 2-year, 5-year and 10-year yields stand at 4.65%, 4.21% and 4.27%, respectively.
- Markets await Thursday’s Core PCE figures from October, the Fed’s preferred inflation gauge, which is expected to have decelerated to 3.5% YoY from 3.7% in September.
- Meanwhile, the CME FedWatch Tool suggests that the Fed won’t hike in the December meeting, and the markets are foreseeing rate cuts beginning in May 2024.
Technical Analysis: US Dollar under bearish pressure, RSI in oversold territory
Indicators on the daily chart are painting a bearish picture for the US Dollar. The Relative Strength Index (RSI) position suggests an overwhelming selling momentum standing flat at 30. Concurrently, the Moving Average Convergence Divergence (MACD) histogram displays a descending trajectory indicative of ongoing bearishness. The bear control is further affirmed by the currency's position in relation to the Simple Moving Averages (SMAs).
On a broader scale, the asset is trading beneath the 20, 100 and 200-day SMAs, underlining the prevailing strength of the bears. In this challenging scenario, buying momentum is noticeably struggling. These technical signals derived from the RSI, MACD and SMAs collectively point toward continued bearish dominance for the US Dollar in the immediate term.
Support levels: 102.50, 102.30, 102.00.
Resistance levels: 103.60 (200-day SMA), 104.00, 104.20 (100-day SMA)
US Dollar FAQs
What is the US Dollar?
The US Dollar (USD) is the official currency of the United States of America, and the ‘de facto’ currency of a significant number of other countries where it is found in circulation alongside local notes. It is the most heavily traded currency in the world, accounting for over 88% of all global foreign exchange turnover, or an average of $6.6 trillion in transactions per day, according to data from 2022.
Following the second world war, the USD took over from the British Pound as the world’s reserve currency. For most of its history, the US Dollar was backed by Gold, until the Bretton Woods Agreement in 1971 when the Gold Standard went away.
How do the decisions of the Federal Reserve impact the US Dollar?
The most important single factor impacting on the value of the US Dollar is monetary policy, which is shaped by the Federal Reserve (Fed). The Fed has two mandates: to achieve price stability (control inflation) and foster full employment. Its primary tool to achieve these two goals is by adjusting interest rates.
When prices are rising too quickly and inflation is above the Fed’s 2% target, the Fed will raise rates, which helps the USD value. When inflation falls below 2% or the Unemployment Rate is too high, the Fed may lower interest rates, which weighs on the Greenback.
What is Quantitative Easing and how does it influence the US Dollar?
In extreme situations, the Federal Reserve can also print more Dollars and enact quantitative easing (QE). QE is the process by which the Fed substantially increases the flow of credit in a stuck financial system.
It is a non-standard policy measure used when credit has dried up because banks will not lend to each other (out of the fear of counterparty default). It is a last resort when simply lowering interest rates is unlikely to achieve the necessary result. It was the Fed’s weapon of choice to combat the credit crunch that occurred during the Great Financial Crisis in 2008. It involves the Fed printing more Dollars and using them to buy US government bonds predominantly from financial institutions. QE usually leads to a weaker US Dollar.
What is Quantitative Tightening and how does it influence the US Dollar?
Quantitative tightening (QT) is the reverse process whereby the Federal Reserve stops buying bonds from financial institutions and does not reinvest the principal from the bonds it holds maturing in new purchases. It is usually positive for the US Dollar.
- US economy growth for Q3 was reported at 5.2%, above forecasts, indicating robust investment but reduced household spending.
- Federal Reserve officials are divided on future monetary policy, with some suggesting a more dovish approach.
- GBP/USD pair's outlook remains bullish in light of recent comments from Fed Governor Christopher Waller, suggesting the possibility of rate cuts.
The British Pound (GBP) clings to minimal gains vs. the Greenback (USD) in the mid-North American session after data from the United States (US) showed the economy remains resilient and growing above trend. Nevertheless, some Federal Reserve (Fed) officials remained dovish, while investors began to price in a dovish Fed. The GBP/USD is trading at 1.2703, slightly above the 1.2700 figure.
Pound Sterling remains underpinned by expectations for more than 100 bps of rate cuts by the Fed in 2024
Before Wall Street opened, a report by the US Bureau of Economic Analysis (BEA) revealed the US economy grew faster than the 5.0% expected, rising by 5.2% in Q3, above the second quarter's 2.1%. The data showed investment picked up while households cut expenses, which could pave the way for a slower reading in the next quarter. Even though the country grows above trend, Fed policymakers split views of policy sufficiently restrictive or keeping the door open for rate increases.
Atlanta Fed President Raphael Bostic said he sees slower growth and declining inflation pressures within the current monetary policy stance. Meanwhile, Richmond Fed President Thomas Barkin expressed skepticism about inflation, reaching the Fed's target and keeping the option of higher interest rates open.
Across the Atlantic, the Pound Sterling failed to gain traction after UK consumer credit data showed that British increased the pace of borrowing by the most in five years, along with hawkish comments of the Bank of England’s (BoE) Governor Andrew Bailey, who said the “will do what it takes” to get inflation to its 2% target.
Given the backdrop, the GBP/USD must likely remain bullish after yesterday’s remarks of Fed Governor Christopher Waller, who opened the door for rate cuts. Since then, money market interest rate futures foresee 115 bps of rate cuts by the Fed next year, higher than yesterday morning’s 85 bps. That said, if the major stays above 1.2700, a challenge of 1.2800 is on the cards.
GBP/USD Price Analysis: Technical outlook
After printing a multi-month high at 1.2733, the GBP/USD retreated below the 1.2700 figure, opening the door for a pullback. As of writing, the pair is forming a ‘doji,’ suggesting indecision amongst traders. Furthermore, a daily close below 1.2690 could exacerbate a pullback to the November 28 low of 1.2606, ahead of the 1.2600 figure. A bullish scenario is seen if buyers lift the exchange rate above 1.2700 and achieve a daily close above that level. The following critical resistance level to test will be 1.2733, followed by the 1.2800 mark.
- The USD/JPY is recovering back into Wednesday's opening bids after US GDP beats the street.
- US GDP growth accelerated in the third quarter, Japan Retail Trade figures in the barrel.
- Fedspeak is pulling markets in multiple directions after a hawkish showing from Fed's Barkin.
The USD/JPY is pulling back towards the day's early bids near 147.50 as the US Dollar gets a choppy boost from better-than-expected US Gross Domestic Product (GDP) growth figures and a hawkish appearance from Federal Reserve (Fed) officials to balance out Tuesday's hawkish Fedpeak.
Wednesday gives way to early Thursday markets, where Japan will be releasing its latest Retail Trade and Large Retailer Sales numbers for October.
US GDP grew more than expected in the third quarter, printing at 5.2% versus the expected QoQ print of 5.0%, climbing up and over the previous quarter's 4.9%.
Adding to USD-bullish factors, the Fed's Richmond President Tom Barkin hit markets with hawkish statements that take some of the wind out of Tuesday's dovish comments from Fed policymakers.
Fed’s Barkin: Not willing to take another interest rate hike off the table
The Fed's Barkin believes that inflation will remain more stubborn than markets are expecting looking forward, and Barkin can't rule out even further rate hikes if price growth continues to plague the US.
Coming up early on Thursday, Japan's latest retail sales figures will come in for a landing. Market forecasts see Japanese Retail Trade for the year into October finding a slight improvement from 5.8% to 5.9%.
Monthly Retail Trade saw a -0.1% print in September, while Large Retailer Sales for October saw a flat 5% print.
USD/JPY Technical Outlook
The USD/JPY is seeing a light rebound after dipping below 147.00 in Wednesday's trading session, but upside momentum remains limited and it's getting difficult to ignore the fact that the US Dollar is down nearly 3.5% from multi-year peaks set in November just below the 152.00 major handle.
The pair is set to see a technical ceiling from the 50-day Simple Moving Average (SMA) near the 150.00 major handle, while long-term downside momentum will be set to run aground on the 200-day SMA near 142.50.
USD/JPY Daily Chart
USD/JPY Technical Levels
- Canadian Dollar is seeing mixed results but drops against US Dollar on Wednesday.
- Canada Current Account posts smaller rebound than expected.
- US GDP outpaces expectations, weighing on Tuesday’s Fed pivot expectations.
The Canadian Dollar (CAD) is mixed against the other major currencies on Wednesday and paring back recent gains against the US Dollar (USD). The Loonie has fallen back three-tenths of a percent against the Greenback on the day.
Canada’s trade balance rebounded in the third quarter but still missed expectations with the Canadian Current Account printing a CAD $-3.22 billion decline. The second quarter’s print was revised even lower to $-7.32 billion.
Daily Digest Market Movers: Canadian Dollar draws back against Greenback as markets twist
- Canadian Current Account was expected to post a billion CAD gain but shrunk by an additional $3.22 billion on Wednesday.
- The previous print also got revised lower from $-6.63 billion, steepening the CAD’s trade imbalance.
- US Gross Domestic Product (GDP) growth beat the market to post an accelerated 5.2% for the third quarter, beating the forecast for 5.0% and the second quarter’s 4.9% growth.
- US Personal Consumption Expenditure (PCE) Prices for the third quarter missed expectations, and mixed data results are clouding the USD’s outlook.
- PCE Prices ticked lower to 2.8%, markets were expecting a hold at the second quarter’s print of 2.9%.
- Fedspeak is back on the offering on Wednesday after Tuesday’s comments sparked a broad-market bid.
- The President of the Federal Reserve (Fed) Bank of Richmond hit newswires in the US market session, striking a notably more hawkish tone than Fed Governor Christopher Wallace on Tuesday.
- President Barkin remains skeptical that 2% inflation can be achieved from here without additional tightening or at least maintaining the Fed’s “higher for longer” stance.
Canadian Dollar price today
The table below shows the percentage change of Canadian Dollar (CAD) against listed major currencies today. Canadian Dollar was the weakest against the Swiss Franc.
| USD | EUR | GBP | CAD | AUD | JPY | NZD | CHF | |
| USD | 0.37% | 0.30% | 0.34% | 0.76% | 0.20% | 0.09% | -0.18% | |
| EUR | -0.36% | -0.05% | -0.03% | 0.37% | -0.17% | -0.29% | -0.55% | |
| GBP | -0.31% | 0.05% | 0.04% | 0.44% | -0.12% | -0.25% | -0.48% | |
| CAD | -0.33% | 0.04% | -0.03% | 0.44% | -0.14% | -0.24% | -0.53% | |
| AUD | -0.76% | -0.38% | -0.44% | -0.43% | -0.55% | -0.65% | -0.92% | |
| JPY | -0.20% | 0.18% | 0.11% | 0.14% | 0.58% | -0.09% | -0.37% | |
| NZD | -0.06% | 0.27% | 0.22% | 0.25% | 0.68% | 0.11% | -0.27% | |
| CHF | 0.17% | 0.54% | 0.48% | 0.51% | 0.94% | 0.37% | 0.28% |
The heat map shows percentage changes of major currencies against each other. The base currency is picked from the left column, while the quote currency is picked from the top row. For example, if you pick the Euro from the left column and move along the horizontal line to the Japanese Yen, the percentage change displayed in the box will represent EUR (base)/JPY (quote).
Technical Analysis: Canadian Dollar falls back against Greenback, USD/CAD claws back recent losses, looks to price in floor from 1.3550
The Canadian Dollar (CAD) is paring away recent gains against the US Dollar (USD), sending the USD/CAD back a third of a percent from Wednesday’s low bids near 1.3550.
The USD/CAD still has some room to fall before coming into contact with the 200-day Simple Moving Average (SMA) near 1.3520, but an extended rebound will see a technical ceiling from the 50-day SMA just below 1.3700.
The pair is still seeing some pull from the rising trendline drawn from July’s lows near 1.3100, and the USD/CAD’s recent decline through the technical barrier sees the Loonie beginning to run out of bearish chart space with technical indicators leaning toward the oversold side.
The Relative Strength Index (RSI) is approaching oversold conditions, while the Moving Average Convergence-Divergence (MACD) indicator has the fast signal line declining below the midline, a sign that selling pressure could run out of steam in the near future.
USD/CAD Daily Chart
Canadian Dollar FAQs
What key factors drive the Canadian Dollar?
The key factors driving the Canadian Dollar (CAD) are the level of interest rates set by the Bank of Canada (BoC), the price of Oil, Canada’s largest export, the health of its economy, inflation and the Trade Balance, which is the difference between the value of Canada’s exports versus its imports. Other factors include market sentiment – whether investors are taking on more risky assets (risk-on) or seeking safe-havens (risk-off) – with risk-on being CAD-positive. As its largest trading partner, the health of the US economy is also a key factor influencing the Canadian Dollar.
How do the decisions of the Bank of Canada impact the Canadian Dollar?
The Bank of Canada (BoC) has a significant influence on the Canadian Dollar by setting the level of interest rates that banks can lend to one another. This influences the level of interest rates for everyone. The main goal of the BoC is to maintain inflation at 1-3% by adjusting interest rates up or down. Relatively higher interest rates tend to be positive for the CAD. The Bank of Canada can also use quantitative easing and tightening to influence credit conditions, with the former CAD-negative and the latter CAD-positive.
How does the price of Oil impact the Canadian Dollar?
The price of Oil is a key factor impacting the value of the Canadian Dollar. Petroleum is Canada’s biggest export, so Oil price tends to have an immediate impact on the CAD value. Generally, if Oil price rises CAD also goes up, as aggregate demand for the currency increases. The opposite is the case if the price of Oil falls. Higher Oil prices also tend to result in a greater likelihood of a positive Trade Balance, which is also supportive of the CAD.
How does inflation data impact the value of the Canadian Dollar?
While inflation had always traditionally been thought of as a negative factor for a currency since it lowers the value of money, the opposite has actually been the case in modern times with the relaxation of cross-border capital controls. Higher inflation tends to lead central banks to put up interest rates which attracts more capital inflows from global investors seeking a lucrative place to keep their money. This increases demand for the local currency, which in Canada’s case is the Canadian Dollar.
How does economic data influence the value of the Canadian Dollar?
Macroeconomic data releases gauge the health of the economy and can have an impact on the Canadian Dollar. Indicators such as GDP, Manufacturing and Services PMIs, employment, and consumer sentiment surveys can all influence the direction of the CAD. A strong economy is good for the Canadian Dollar. Not only does it attract more foreign investment but it may encourage the Bank of Canada to put up interest rates, leading to a stronger currency. If economic data is weak, however, the CAD is likely to fall.
- The AUD/USD pair is currently trading at 0.6621, showing a decline of 0.39%.
- The US economy's growth rate in Q3 was reported at 5.2%, surpassing the expected 5% and marking the fastest growth in nearly two years.
- AUD/USD traders eye the release of US Core PCE figures, along with employment data.
The Australian Dollar (AUD) extended its earlier losses against the US Dollar (USD) on Wednesday after the US economy in the third quarter, grew at a faster pace than expected, suggesting the US Federal Reserve’s job is not done. That, along with a softer Australia’s inflation reading, weighed on the AUD/USD, which trades at 0.6621, down by 0.39%.
Australian Dollar falls against the US Dollar, though would remains bullish above 0.6600
The US Bureau of Economic Analysis (BEA) revealed the economy grew at 5.2% in Q3, exceeding forecasts of 5%, and the fastest rhythm in almost two years. The data showed that business investment picked up while household consumption eased, indicating that the services segment might slow down in the near term. Even though the reading was positive and sponsored a leg-down in the pair, consumers continued to feel the pain of higher interest rates.
Despite the data, investors had priced in more than 115 bps of rate cuts by the Fed in 2024. This is reflected by the fall in US Treasury bond yields, with the 10-year benchmark note sitting at 4.27%, its lowest level since September 14. In the meantime, the US Dollar Index (DXY) trades solid with gains of more than 0.15%, up at 102.93.
Over in Australia, the Consumer Price Index (CPI) for October dipped to 4.9% from 5.6% in October, sponsored by lower prices in goods, petrol, holiday and travel costs. Traders were expected CPI at 5.2%, which were caught off guard, sending the AUD/USD sliding, as investors expect a less hawkish Reserve Bank of Australia (RBA), which lifted rates 25 bps earlier this month, to 4.35%.
Ahead in the calendar, the US calendar will feature the Fed’s preferred gauge for inflation, the Core Personal Consumption Expenditures (PCE) price index, along with employment data on Thursday. The Aussie’s docket will feature Building Permits and Housing Credit data.
AUD/USD Price Analysis: Technical outlook
After reaching a four-month high, the AUD/USD forms a two-candlestick ‘dark cloud cover’ chart pattern, suggesting the pair could drop further. Although downside risks remain, sellers must drag prices below the 0.6600 figure and the 200-day moving average (DMA) at 0.6580. Once those levels are breached, the next demand area would be the 0.6500 mark. On the other hand, if buyers keep the exchange rate above 0.6600, that could set the stage for a rally toward 0.6700.
- The XAG/USD hovers around the $25.00 level after retreating from May highs around $25.25
- Hawkish words from Fed's Barkin made US yields recover somewhat. Still, they stand at multi-month lows.
- All ayes are on Thursday’s PCE figures from the US from October.
In Wednesday's session, the Silver spot price XAG/USD trimmed daily gains, stabilising at $25.00 after reaching a multi-month high of $25.25 earlier in the session. The retracement was largely influenced by the hawkish words of the Federal Reserve (Fed) Thomas Barkin, which seemed to have spooked markets. Market focus is still on Thursday’s October Core Personal Consumption Expenditures (PCE) figures.
In line with that, Barkin stated that he is not ruling out the possibility of another interest rate hike and remains sceptical about achieving the target inflation rate of 2%. He also mentioned that inflation will be more stubborn than expected, which seems to limit the hype after the last Consumer Price Index (CPI) from the US, which made markets bet on the Fed approaching the end of its tightening cycle.
In the meantime, the US government bond yields erased some losses but are still weak. The 2-year rate stands at 4.65%, its lowest since July, and the 5 and 10-year yields are seen at 4.21% and 4.27%, respectively, at their lowest since September. That being said, as long as the US yields continue to edge lower, the grey metal may see further upside. For Thursday’s session, the US will report October’s PCE figures, the Fed’s preferred gauge of inflation, which may affect the bond markets as they will model the expectations of the bank’s next steps.
XAG/USD levels to watch
The indicators on the daily chart are a positive outlook for the metal, but a correction may be on the horizon. On the one hand, the Relative Strength Index (RSI) position, which indicates overbought conditions and seems to be flattening, suggests that selling pressure could soon rise as the market temperature comes down from heated levels. This ties in with the recent behaviour of the bulls, who seem to take a breather after steering the currency pair to highs since early May.
The Moving Average Convergence Divergence (MACD), on the other hand, with its rising green bars, points to an increasing buying momentum. This indicates that there is a strong bullish sentiment at play, lifting upward pressure. This perception is also supported by the pair's positioning over the Simple Moving Averages (SMAs), more specifically, the 20, 100, and 200-day SMAs.
Support Levels: $24.90, $24.50, $24.30.
Resistance Levels: $25.50, $25.70, $26.00.
XAG/USD daily chart
-638368717605334516.png)
Economists at Wells Fargo see potential for pronounced US Dollar depreciation as 2024 progresses across a wide range of economic scenarios.
US Dollar closing in on turning lower
While US economic outperformance could support the Greenback into early next year, we expect broad US Dollar depreciation as 2024 progresses.
Progress on the inflation front means Fed rate cut risks are tilted toward sooner rather than later, which should limit Greenback gains.
A hard landing or US recession next year would see interest rate and growth trends swing against the US currency. A soft US landing, combined with inflation progress and lower US yields, could support broader financial market sentiment, which would also weigh on the ‘safe-haven’ support for the USD.
As the global monetary policy cycle turns to easing, broad US Dollar depreciation is looking increasing likely across a wide range of scenarios.
The Fed’s preferred inflation gauge, the Core Personal Consumption Expenditure (PCE), will be released by the US Bureau of Economic Analysis (BEA) on Thursday, November 30 at 13:30 GMT and as we get closer to the release time, here are the forecasts of economists and researchers of seven major banks.
Headline PCE is expected at 3.1% year-on-year vs. the prior release of 3.4%, while core PCE is expected to decline two ticks to 3.5% YoY. If so, headline would be the lowest since the first quarter of 2021 but still well above the Fed’s 2% target.
Commerzbank
Prices are likely to have risen by 0.1% in October compared with September and by 0.2% excluding energy and food (core rate). The PCE deflator would therefore also indicate that inflationary pressures are easing. However, the YoY rates of 3.0% and 3.5% (core rate) would still be well above the central bank's target of 2%.
ING
Data flow includes the Fed’s favoured measure of inflation, which we expect to show a 0.2% MoM rate of price increases. This is broadly in line with what the central bank wants to see and, if repeated over time, would bring the annual rate of inflation as measured by the core personal consumer expenditure deflator back to 2%.
SocGen
Our PCE deflator forecast is just 0.0% and in line with the previously reported CPI for October.
NBF
The annual core PCE deflator, for its part, may have progressed 0.2% MoM in October, a result which should translate into a 2-tick decline of the 12-month rate to 3.5%. Although still high, this would still be the lowest rate observed in 30 months.
Citi
We expect a 0.17% MoM increase in core PCE inflation in October based on elements of softer-than-expected 0.23% core CPI and October PPI with a decline in lodging away from home (hotel prices) and key shelter prices, namely owners’ equivalent rent, moderating further. This will provide less of a boost to PCE inflation compared to September. Overall, we expect a softer 0.14% increase in core services prices excluding housing after a stronger 0.42% increase in September while ‘super core’ inflation could be somewhat stronger in November and may rebound in December.
TDS
Weaker than expected core CPI inflation at 0.2% MoM augurs well for core PCE prices in October. Indeed, we forecast a similar increase for the latter at 0.2% MoM, which should be reflected on a new decline in the YoY rate to 3.6% from 3.7% in September — its lowest YoY pace since April 2021. Slowing momentum should also be expressed in moderating core PCE services ex-housing inflation which likely printed 0.2% MoM, down from 0.4% in September. We also look for the headline PCE index to advance 0.1% MoM and 3.3% YoY in October.
CIBC
PCE deflator will be flat in month-over-month terms. With the earlier October retail, labour and CPI reports providing many clues, and the Fed in a more patient stance, we don’t expect any material surprises and relatively low market sensitivity to the release.
- Mexican Peso advance is capped by the Greenback as the economy in the United States (US) remains solid.
- The OECD predicts a slowdown in Mexico’s economy, largely due to a cooling US economy impacting Mexican exports.
- Fed Waller’s dovish remarks limit the USD/MXN advance, as traders anticipate over 100 bps rate cuts from Fed in 2024.
Mexican Peso (MXN) retreats against the US Dollar (USD) in an early trading session on Wednesday after the US Department of Commerce revealed the economy in the United States (US) is growing above trend, which could warrant further action by the US Federal Reserve’s (Fed). Consequently, the USD/MXN bounces off its daily lows and trades near the highs of the 17.15/17.20 range, up 0.12% on the day.
Mexico’s economic docket remains light. On Thursday, October’s unemployment rate is expected to be 2.8%, a tick lower than in September. Meanwhile, the Organization for Economic Co-operation and Development (OECD) released the 2024 economic outlook for Mexico, in which the economy is expected to expand at a slower pace of 2.5%, down from a 3.4% growth rate registered in 2023. The report cites the moderation of the US economy, which would likely dampen Mexico’s exports. The OECD suggests the Bank of Mexico (Banxico) monetary policy must remain restrictive, as inflation is estimated to dip to 3.9% and 3.2% in 2024 and 2025, respectively.
Across the border, the US economy grew faster than expected, the US Bureau of Economic Analysis (BEA) reported, sponsoring a leg-up in the US Dollar Index (DXY), which tracks the performance of the Greenback versus six currencies. The DXY climbs 0.23%, up at 102.95, a headwind for the USD/MXN.
Daily digest movers: Mexican Peso weakens as the USD/MXN rises to 17.15 following US data
- The US Gross Domestic Product (GDP) for Q3 rose by 5.2% QoQ, exceeding estimates of 5%.
- The US Advancement Goods Trade Balance registered a deficit of $89.8 billion in October, widening $3.5 billion from the $86.3 deficit in September.
- On Tuesday, Fed Governor Christopher Waller, a former hawk, commented that there are good economic arguments that rates could be lowered if inflation continues falling for several months.
- A day after Fed Waller's comments showed interest rates, traders expect 115 basis points of rate cuts by the US central bank in 2024.
- On November 27, Banxico’s Deputy Governor, Jonathan Heath, commented that core prices must come down more, adding that one or two rate cuts may come next year, but “very gradually” and “with great caution.”
- On November 24, a report revealed the economy in Mexico grew as expected in the third quarter on an annual and quarterly basis, suggesting the Bank of Mexico would likely stick to its hawkish stance, even though it opened the door for some easing.
- Mexico's annual inflation increased from 4.31% to 4.32%, while core continued to ease from 5.33% to 5.31%, according to data on November 23.
- The financial markets' narrative that the US Federal Reserve (Fed) is done hiking rates has kept the Greenback on the backfoot, but today, it has found some relief.
- Data published earlier this month showed prices paid by consumers and producers in the US dipped, increasing investors' speculations that the Fed’s tightening cycle has ended.
- A Citibanamex poll suggests that 25 of 32 economists expect Banxico's first rate cut in the first half of 2024.
- The poll shows “a great dispersion” for interest rates next year, between 8.0% and 10.25%, revealed Citibanamex.
- The same survey revealed that economists foresee headline annual inflation at 4.00% and core at 4.06%, both readings for the next year, while the USD/MXN exchange rate is seen at 19.00, up from 18.95, toward the end of 2024
Technical Analysis: Mexican Peso loses strength though the USD/MXN bias remains bearish below the 200-day SMA
Even though the USD/MXN reached a new week high of 17.22, buyers barely cling to minuscule gains. The 20-day Simple Moving Average (SMA) is about to cross below the 100-day SMA, both at around 17.34, signaling the downtrend is gaining steam. If the pair drops below 17.05, the next support would be the 17.00 figure, ahead of challenging the year-to-date (YTD) low of 16.62.
Conversely, if buyers achieve a daily close above the November 21 high at 17.26, that would put into play a test of the confluence of the 20 and 100-day SMAs at 17.34. Further upside is seen at the 200-day SMA at 17.58.
Mexican Peso FAQs
What key factors drive the Mexican Peso?
The Mexican Peso (MXN) is the most traded currency among its Latin American peers. Its value is broadly determined by the performance of the Mexican economy, the country’s central bank’s policy, the amount of foreign investment in the country and even the levels of remittances sent by Mexicans who live abroad, particularly in the United States. Geopolitical trends can also move MXN: for example, the process of nearshoring – or the decision by some firms to relocate manufacturing capacity and supply chains closer to their home countries – is also seen as a catalyst for the Mexican currency as the country is considered a key manufacturing hub in the American continent. Another catalyst for MXN is Oil prices as Mexico is a key exporter of the commodity.
How do decisions of the Banxico impact the Mexican Peso?
The main objective of Mexico’s central bank, also known as Banxico, is to maintain inflation at low and stable levels (at or close to its target of 3%, the midpoint in a tolerance band of between 2% and 4%). To this end, the bank sets an appropriate level of interest rates. When inflation is too high, Banxico will attempt to tame it by raising interest rates, making it more expensive for households and businesses to borrow money, thus cooling demand and the overall economy. Higher interest rates are generally positive for the Mexican Peso (MXN) as they lead to higher yields, making the country a more attractive place for investors. On the contrary, lower interest rates tend to weaken MXN.
How does economic data influence the value of the Mexican Peso?
Macroeconomic data releases are key to assess the state of the economy and can have an impact on the Mexican Peso (MXN) valuation. A strong Mexican economy, based on high economic growth, low unemployment and high confidence is good for MXN. Not only does it attract more foreign investment but it may encourage the Bank of Mexico (Banxico) to increase interest rates, particularly if this strength comes together with elevated inflation. However, if economic data is weak, MXN is likely to depreciate.
How does broader risk sentiment impact the Mexican Peso?
As an emerging-market currency, the Mexican Peso (MXN) tends to strive during risk-on periods, or when investors perceive that broader market risks are low and thus are eager to engage with investments that carry a higher risk. Conversely, MXN tends to weaken at times of market turbulence or economic uncertainty as investors tend to sell higher-risk assets and flee to the more-stable safe havens.
Tom Barkin, President of the Federal Reserve (Fed) Bank of Richmond, said on Wednesday that he is unwilling to take another interest rate hike off the table. He believes that inflation will be more stubborn than what they would like. In an interview on CNBC, he considered that talks about rate cuts are premature.
Barkin said he is sceptical about being on track for a 2% inflation. He warned that many service prices are still going up, driven by wages.
Market reaction
The US Dollar holds modest daily gains, recovering from monthly lows. The DXY is up by 0.15%, at 102.90.
- The New Zealand Dollar surges higher following the RBNZ policy meeting on Wednesday.
- Although the RBNZ left interest rates unchanged, commentary from Governor Orr suggested the possibility of further rate hikes.
- NZD/USD pushed to a new peak above 0.6200 following the meeting, extending its short-term uptrend.
The New Zealand Dollar (NZD) trades higher on Wednesday after rallying following the Reserve Bank of New Zealand (RBNZ) meeting in the early hours. Although the RBNZ left the Official Cash Rate unchanged, the Kiwi rose after RBNZ Governor Adrian Orr said he would not rule out further interest rate hikes if inflation remained elevated. The prospect of higher interest rates is bullish for currencies as it attracts higher capital inflows.
Daily digest market movers: New Zealand Dollar surges after RBNZ meeting
- The New Zealand Dollar rallies after the RBNZ Governor mentions the possibility interest rates could rise even higher in the future, depending on the outlook for inflation.
- The bank left the Official Cash Rate (OCR) at 5.50% at the meeting, however, as markets had expected.
- The hawkish tone of press conference after the meeting surprised many investors as New Zealand data – though still elevated – has come out below expectations recently, suggesting, if anything, interest rates are at risk of being cut.
- Official data from Statistics New Zealand (Stats NZ) showed that the Consumer Price Index (CPI) in the 12 months to September rose 5.6%, lower than expectations of 5.9% and the prior quarter’s reading of 6.0%. On a quarterly basis, New Zealand’s inflation increased to 1.8% but fell short of expectations of 2.0%.
- New Zealand's Unemployment Rate climbed to 3.9% in the September quarter, compared with 3.6% last quarter.
- The new center right-wing coalition government has plans to change the RBNZ’s dual mandate, which combines maintaining price stability with full employment. They want to scrap the employment part and for the RBNZ to focus on price stability.
- Preliminary talks between the new government and RBNZ officials were characterized as being “constructive” by Orr, suggesting the bank may be open to changing to a single mandate.
- Such a move would enable the RBNZ to be more single-minded about bringing inflation down using higher interest rates and regardless of the impact on the economy and labor market, it thus could be viewed as a hawkish development and bullish for NZD.
New Zealand Dollar technical analysis: NZD/USD peaks above 0.6200
NZD/USD – the number of US Dollars that can be bought with one New Zealand Dollar – peaks above 0.6200 after rallying following the RBNZ policy meeting. Although it has pulled back down since, the pair remains in a short and medium-term bullish trend, which continues to bias longs over shorts.
The MACD momentum indicator is rising in line with price suggesting the short and medium-term uptrend is healthy.
-638368673502594067.png)
New Zealand Dollar vs US Dollar: Daily Chart
Last night’s post-RBNZ surge means a possible bullish inverse head and shoulders (H&S) pattern which formed at the autumn lows has almost reached its conservative price target of 0.6215.
The pair may be in the process of forming a bearish shooting star Japanese candlestick pattern on Wednesday. If the candlestick retains its shape at the end of the day and is followed by a strong bearish candle on Thursday, it could signal a short-term bearish correction.
A break above the current 0.6208 highs, however, would add impetus to the short and medium-term uptrend. The next major resistance level is then at 0.6238, where the 100-week Simple Moving Average (SMA) resides followed by 0.6274, the July 27 highs.
-638368673994987303.png)
New Zealand Dollar vs US Dollar: 4-hour Chart
A possible bearish ending wedge price pattern, which formed on the 4-hour chart, failed to signal a move lower as price actually broke out to the upside extending the uptrend. Whilst this could mark an exhaustion move more downside would be required to confirm.
A possible tweezer top Japanese candlestick reversal pattern may have formed at the highs (circled). This is a short-term bearish signal. The pair is already finding support from the upper boundary line of the wedge at 0.6140. If it pulls back any lower, it could find support at the lower boundary line, at 0.6080.
The long-term trend is still overall bearish, suggesting a risk of a recapitulation remains.
New Zealand Dollar FAQs
What key factors drive the New Zealand Dollar?
The New Zealand Dollar (NZD), also known as the Kiwi, is a well-known traded currency among investors. Its value is broadly determined by the health of the New Zealand economy and the country’s central bank policy. Still, there are some unique particularities that also can make NZD move. The performance of the Chinese economy tends to move the Kiwi because China is New Zealand’s biggest trading partner. Bad news for the Chinese economy likely means less New Zealand exports to the country, hitting the economy and thus its currency. Another factor moving NZD is dairy prices as the dairy industry is New Zealand’s main export. High dairy prices boost export income, contributing positively to the economy and thus to the NZD.
How do decisions of the RBNZ impact the New Zealand Dollar?
The Reserve Bank of New Zealand (RBNZ) aims to achieve and maintain an inflation rate between 1% and 3% over the medium term, with a focus to keep it near the 2% mid-point. To this end, the bank sets an appropriate level of interest rates. When inflation is too high, the RBNZ will increase interest rates to cool the economy, but the move will also make bond yields higher, increasing investors’ appeal to invest in the country and thus boosting NZD. On the contrary, lower interest rates tend to weaken NZD. The so-called rate differential, or how rates in New Zealand are or are expected to be compared to the ones set by the US Federal Reserve, can also play a key role in moving the NZD/USD pair.
How does economic data influence the value of the New Zealand Dollar?
Macroeconomic data releases in New Zealand are key to assess the state of the economy and can impact the New Zealand Dollar’s (NZD) valuation. A strong economy, based on high economic growth, low unemployment and high confidence is good for NZD. High economic growth attracts foreign investment and may encourage the Reserve Bank of New Zealand to increase interest rates, if this economic strength comes together with elevated inflation. Conversely, if economic data is weak, NZD is likely to depreciate.
How does broader risk sentiment impact the New Zealand Dollar?
The New Zealand Dollar (NZD) tends to strengthen during risk-on periods, or when investors perceive that broader market risks are low and are optimistic about growth. This tends to lead to a more favorable outlook for commodities and so-called ‘commodity currencies’ such as the Kiwi. Conversely, NZD tends to weaken at times of market turbulence or economic uncertainty as investors tend to sell higher-risk assets and flee to the more-stable safe havens.
Over the past five days, the Pound is the second best performing G10 currency after the NZD. Economists at Rabobank analyze GBP outlook.
GBP to find a little additional support in the coming months
We continue to expect the EUR/GBP pair to be drawn to the 0.86 level on a one-to-three-month view and see scope for dips toward 0.85 on a six-month view on the expectation that rate cuts from the BoE over the coming cycle will lag those from the ECB.
We continue to favour selling rallies in EUR/GBP.
- EUR/USD comes under pressure after hitting new monthly highs.
- Extra gains are expected to revisit the August top at 1.1064.
EUR/USD gives away part of the earlier advance to monthly tops near 1.1020 and returns to the sub-1.1000 region on Wednesday.
The continuation of the upward bias appears in store for the time being and could see the pair challenging the August peak of 1.1064 (August 10) in the short-term horizon. Once this level is cleared, spot could embark on a probable visit to the weekly high of 1.1149 (July 27).
So far, while above the significant 200-day SMA, today at 1.0814, the pair’s outlook should remain constructive.
EUR/USD daily chart
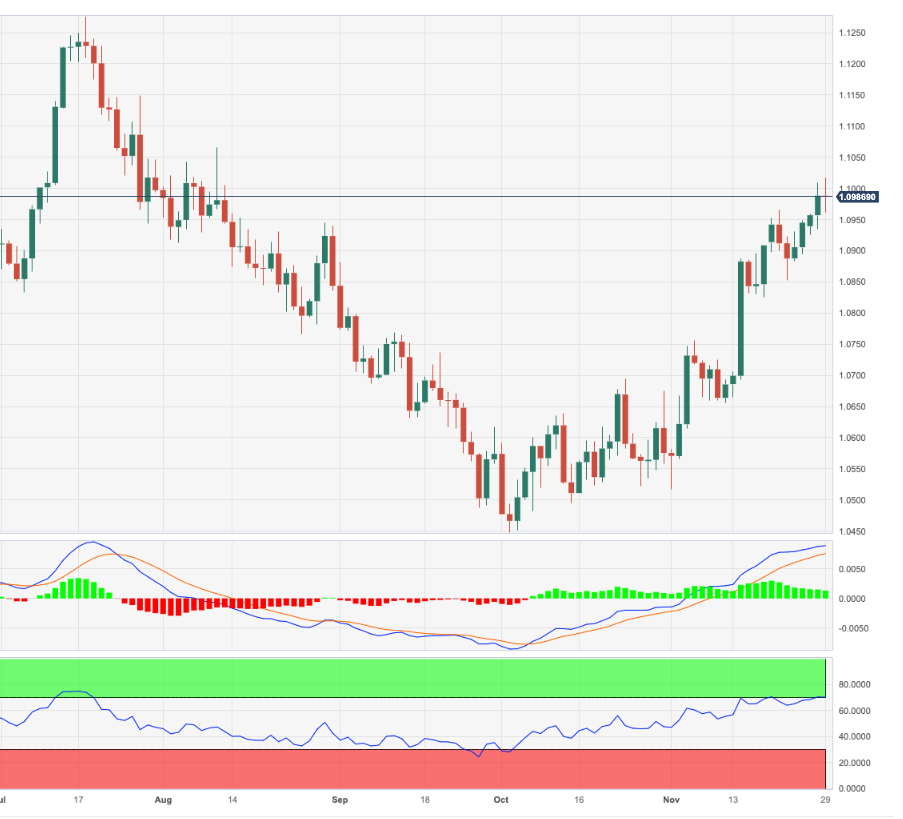
Eurostat will release a first flash estimate of Eurozone Harmonised Index of Consumer Prices (HICP) data for November on Thursday, November 30 at 10:00 GMT and as we get closer to the release time, here are the expectations forecast by the economists and researchers of nine major banks regarding the upcoming EU inflation print.
Headline is expected at 2.7% year-on-year vs. 2.9% in October, while core is expected at 3.9% YoY vs. 4.2% in October. If so, inflation would be at its lowest level in two years and approaching the 2% target.
Commerzbank
In the Euro Area, inflation is likely to have fallen further from 2.9% in October to 2.7% in November. While the downward impact of energy prices on inflation is diminishing, the upward trend in food and non-energy prices continues to weaken. The core inflation rate is likely to have fallen from 4.2% to 4.0%. The further decline in inflation could fuel hopes of an early interest rate cut by the ECB. However, there is a risk of disillusionment as early as December when inflation jumps back above 3%.
Wells Fargo
We expect both headline and core inflation to be lower relative to October. Softer inflation should keep the ECB on the sidelines and prevent additional rate hikes, while lower inflation should support real disposable incomes and purchasing power across the Eurozone. Despite those dynamics, the Eurozone economy is approaching recession. Activity has not been all that robust, while sentiment indicators suggest a contraction in economic outlook could be imminent. As the Eurozone fades into recession, the ECB could be one of the first major G10 central banks to cut rates; however, we believe easier monetary policy is still a ways off at this time.
ING
Inflation dropped more than expected in September and October, and the question now is whether the low inflation trend will continue. We expect some continued improvement, with core inflation falling to 4% and headline inflation dropping to 2.7%. Still, there are signs of continued inflation pressures that shouldn’t be ignored after a few encouraging data releases. The November PMI showed that businesses still see increased input costs, resulting in more survey respondents indicating that selling price inflation ticked up. Thursday will tell us whether inflation has continued its rapid normalisation.
Danske Bank
We expect Euro Area November flash HICP to continue easing both in headline (2.7% YoY; Oct 2.9%) and core (3.9% YoY; Oct 4.2%) terms, slightly below consensus forecasts. Some of the negative base effects, which have pushed the headline figure lower over the past months, are now fading and we expect headline inflation to remain close to 3% towards next summer.
Deutsche Bank
We see the headline November print for the Eurozone at 2.7% (2.9% in October) and core at 4.0% (4.2%).
Nomura
We expect the disinflation process in the Euro area to continue in earnest. We forecast Euro Area headline HICP inflation to decline to 2.6% YoY in November (from 2.9% in October), and expect core HICP inflation to fall by 0.2pp to 4% YoY. We expect weakness from the energy component, primarily from falling gas and fuel prices. For core inflation, November is typically a month when we see price declines, though we expect less pronounced price declines than during the immediate pre-pandemic period. Risks remain, however. Continued declines in crude oil prices may mean weaker fuel prices, but natural gas prices have been rising since the middle of the year. On core inflation, risks are likely to the upside.
SocGen
We see Euro Area headline inflation decreasing further in November to 2.6% YoY and the core rate falling 0.4pp to 3.8% YoY. However, these drops are largely due to base effects, and we believe the narrative may be turned on its head later.
TDS
Euro Area headline inflation has been on a remarkable downward path since the end of last year, and we expect yet another decline in Nov to a 28-month low of 2.6% YoY. We expect core inflation to fall to 3.8% YoY. However, this decline, and most of Oct's, will likely be reversed in Dec, when we expect inflation to jump back into the mid-3% range. As such, any large dovish market reaction to the prints this week may prove temporary.
Citi
We expect another step down in Euro Area headline inflation to 2.7% YoY in November from 2.9% in October and 10.1% just one year ago, a tad lower than envisaged just two weeks ago, due to still-falling fuel prices at the pump. Core inflation should also edge lower but only slightly this month, to 4.1% from 4.2% in October, with only an apparent re-acceleration in sequential MM growth (SA) to 0.3% (vs 0.15-0.2% MoM in the past two months).
USD edges off low but headwinds remain, economists at Scotiabank report.
A short period of consolidation may be in order
The USD slide in the past few days has been sharp and the sell-off is looking over-extended on the charts. A short period of consolidation may be in order but soft data and concessions from the Fed that progress towards their inflation goals is being made will limit the scope for USD gains.
In addition, month-end is looming and strong gains for US markets in November suggest passive hedge rebalancing may drive USD selling in the next few days.
We are also at a point in the calendar where negative seasonal pressure on the USD generally emerges. Bloomberg data shows the DXY has returned an average of -0.86% in December since 1997 (-0.54% since 2007 and -0.64% since 2012).
- The US economy grew at an annual rate of 5.2% in Q3; revised from 4.9%.
- The US Dollar Index stays in positive territory around 102.80.
The real Gross Domestic Product (GDP) of the United States expanded at an annual rate of 5.2% in the third quarter, the US Bureau of Economic Analysis' (BEA) preliminary estimate showed on Wednesday. This reading came in above expectations of 5.0% and above the previous estimate of 4.9%.
“The update primarily reflected upward revisions to nonresidential fixed investment and state and local government spending that were partly offset by a downward revision to consumer spending. Imports, which are a subtraction in the calculation of GDP, were revised down,” the BEA said.
Key takeaways from the report:
Real gross domestic product (GDP) increased at an annual rate of 5.2 percent in the third quarter of 2023 (table 1), according to the "second" estimate released by the Bureau of Economic Analysis. In the second quarter, real GDP increased 2.1 percent.
Compared to the second quarter, the acceleration in real GDP in the third quarter primarily reflected accelerations in consumer spending and private inventory investment and an upturn in exports that were partly offset by a deceleration in nonresidential fixed investment. Imports turned up.
Current‑dollar GDP increased 8.9 percent at an annual rate, or $581.5 billion, in the third quarter to a level of $27.64 trillion, an upward revision of $20.9 billion from the previous estimate.
The price index for gross domestic purchases increased 3.0 percent in the third quarter, the same as previously estimated. The PCE price index increased 2.8 percent, a downward revision of 0.1 percentage point. Excluding food and energy prices, the PCE price index increased 2.3 percent, a downward revision of 0.1 percentage point.
Market reaction
The US Dollar stays on positive ground with the DXY up by 0.10%, hovering around 102.80, rebounding from monthly lows.
- CPI Inflation in Germany continued to soften in November.
- EUR/USD remained around 1.0980 with the immediate reaction.
Inflation in Germany, as measured by the change in the Consumer Price Index (CPI), declined to 3.2% on a yearly basis in November from 3.8% in October. This reading came in below the market expectation of 3.5% and was the lowest level since June 2021. On a monthly basis, the CPI dropped 0.4%.
The annual Harmonised Index of Consumer Prices (HICP), the European Central Bank's (ECB) preferred gauge of inflation, rose 2.3% in the same period, compared to 3.0% in October and the market forecast of 2.7%. Monthly HICP decreased 0.7%.
Market reaction
The EUR/USD held steady around 1.0980, posting modest losses for the day. The reaction was limited as regional German and Spanish data was already pointing to a slowdown larger than expected.
USD/CAD losses to the mid-1.35 area in early Asian trade have reversed steadily. Economists at Scotiabank analyze the pair’s outlook.
CAD trend remains positive
Spot has rebounded from the daily low just under 1.3550 but gains are limited in the context of the recent slide in the USD and the market has a lot more work to do in the next few days if price action is to signal a USD reversal of any sort.
At best, price signals suggest a pause in what remains a strongly developing downtrend in USD/CAD on the charts.
USD rebounds should meet resistance around 1.3600/1.3610 and – stronger – at 1.3650/1.3660.
GBP/USD tests retracement resistance in the low 1.27s. Economists at Scotiabank analyze the pair’s outlook.
Underlying trend dynamics are bullish
Sterling gains peaked around 1.2730, just above the 1.2720 61.8% retracement resistance.
Losses off the daily high are painting a bearish short-term picture for the pound on the intraday chart.
Underlying trend dynamics are bullish – but also somewhat stretched – for the GBP. Losses here are likely to remain limited in the near-term as well. Cable support is seen at 1.2645 and 1.2600/1.2610.
- The Greenback trades flat on Wednesday morning as US Dollar bulls are licking their wounds.
- US traders can let the dust settle over surprise dovish comments and look forward to US GDP.
- The US Dollar Index is trading in the 102-area and the RSI is getting oversold.
The US Dollar (USD) bulls are probably not a fan of the US Federal Reserve anymore, or at least not one of its members. US Federal Reserve Christopher Waller from the board of governors, surprised markets with a very dovish statement on Tuesday, which in its turn made US yields plunge and promptly devalued the Greenback. The US Dollar lost steam in Asia trading this Wednesday morning, though it looks to be trying to get a grip as it is off the lows for now.
On the economic front the calendar is picking up in weight as this Wednesday the US Gross Domestic Product is due to be released. The third quarter preliminary reading might give some counterweight against the recent downturn in the Greenback and could convince traders that the US economy as such is still growing at a solid pace against most of its competitors. Some readjustment might be granted as the US Dollar may have been a bit over punished in the drop on Tuesday.
Daily digest: US GDP heavyweight
- Around 12:00 GMT this Wednesday will kick off with the Mortgage Bankers Association issuing its Mortgage Applications for the week of November 24th. Previous number was 3%.
- At 13:30 GMT a chunky batch of data will be released:
- The Gross Domestic Product on an annualised basis for the third quarter will be released: Previous result was 4.9% with expectations for the third quarter at 5%.
- The Gross Domestic Product Price Index for the third quarter will come out as well: Previous was at 3.5% and an unchanged 3.5% is expected.
- Quarterly Personal Consumption Expenditures Prices are to be released as well. The previous number was at 2.9% with no forecast pencilled in.
- Wholesale Inventories for October are to be released in all the noise of the US GDP, and is expected to head from 0.2% to 0.1%.
- The Fed’s beige book is expected to be issued near 19:00 GMT.
- Asian equities are not buying into the dovish comments from the Fed and are continuing their sell-off with the Hong Kong Hang Seng leading the descent; being down over 2%. European and US equities are mildly in the green.
- The CME Group’s FedWatch Tool shows that markets are pricing in a 98.7% chance that the Federal Reserve will keep interest rates unchanged at its meeting in December. A very slim chance of a cut is now showing.
- The benchmark 10-year US Treasury Note trades at 4.29%, another substantial leg lower after the comments from Christopher Waller from the Fed.
US Dollar Index technical analysis: Gone far enough for now
The US Dollar has added another leg to its losses, making it a three day losing streak thus far. Though, some small relief could be on the horizon as US GDP numbers later this Wednesday might help to at least recoup a bit of earlier losses. Add into that reasoning the Relative Strength Index (RSI) on the daily DXY chart which is breaking into “oversold”, and some relief looks granted in this descent.
The DXY is sliding further below the 200-day Simple Moving Average (SMA), which is near 103.60. The DXY could still make it back up there, should US traders come back in the market and start buying the current dip. A two-tiered pattern of a daily close and next an opening higher would quickly see the DXY back above 104.28, with the 200-day and 100-day SMA turned over to support levels.
To the downside, historic levels from August are coming into play, when the Greenback summer rally took place. The lows of June make sense to look for some support, near 101.92, just below 102. Should more events take place that initiate further declines in US rates, expect to see possible even a near full unwind of the 2023 summer rally, heading to 100.82, followed by 100.00 and 99.41.
US Dollar FAQs
What is the US Dollar?
The US Dollar (USD) is the official currency of the United States of America, and the ‘de facto’ currency of a significant number of other countries where it is found in circulation alongside local notes. It is the most heavily traded currency in the world, accounting for over 88% of all global foreign exchange turnover, or an average of $6.6 trillion in transactions per day, according to data from 2022.
Following the second world war, the USD took over from the British Pound as the world’s reserve currency. For most of its history, the US Dollar was backed by Gold, until the Bretton Woods Agreement in 1971 when the Gold Standard went away.
How do the decisions of the Federal Reserve impact the US Dollar?
The most important single factor impacting on the value of the US Dollar is monetary policy, which is shaped by the Federal Reserve (Fed). The Fed has two mandates: to achieve price stability (control inflation) and foster full employment. Its primary tool to achieve these two goals is by adjusting interest rates.
When prices are rising too quickly and inflation is above the Fed’s 2% target, the Fed will raise rates, which helps the USD value. When inflation falls below 2% or the Unemployment Rate is too high, the Fed may lower interest rates, which weighs on the Greenback.
What is Quantitative Easing and how does it influence the US Dollar?
In extreme situations, the Federal Reserve can also print more Dollars and enact quantitative easing (QE). QE is the process by which the Fed substantially increases the flow of credit in a stuck financial system.
It is a non-standard policy measure used when credit has dried up because banks will not lend to each other (out of the fear of counterparty default). It is a last resort when simply lowering interest rates is unlikely to achieve the necessary result. It was the Fed’s weapon of choice to combat the credit crunch that occurred during the Great Financial Crisis in 2008. It involves the Fed printing more Dollars and using them to buy US government bonds predominantly from financial institutions. QE usually leads to a weaker US Dollar.
What is Quantitative Tightening and how does it influence the US Dollar?
Quantitative tightening (QT) is the reverse process whereby the Federal Reserve stops buying bonds from financial institutions and does not reinvest the principal from the bonds it holds maturing in new purchases. It is usually positive for the US Dollar.
EUR/USD is trading lower near 1.0980. Economists at Scotiabank analyze the pair’s outlook.
Scope for losses looks limited
EUR/USD gains are looking stretched and perhaps in need of some consolidation. Underlying trend dynamics are, however, aligned bullishly for the EUR and losses are likely to be shallow and short-lived for now.
Initial support is likely to be firm on dips to 1.0955/1.0965. Losses below there may see the EUR decline to 1.0875/1.0900 before renewed buying pressure emerges.
The near-term bull target remains at 1.11.
- DXY picks up pace and rebounds from three-month lows near 102.50.
- The next target emerges at the 200-day SMA near 103.60.
DXY leaves behind four consecutive sessions of losses and manages to regain some composure after bottoming out near 102.50 earlier on Wednesday.
While further weakness in the index remains on the cards in the very near term, occasional bullish attempts are expected to meet initial resistance around the key 200-day SMA, today at 103.59.
On the downside, the loss of the November low of 102.46 (November 29) should pave the way for a deeper drop to, initially, the round level at 102.00.
In the meantime, while below the key 200-day SMA, the outlook for the index is expected to remain bearish.
DXY daily chart
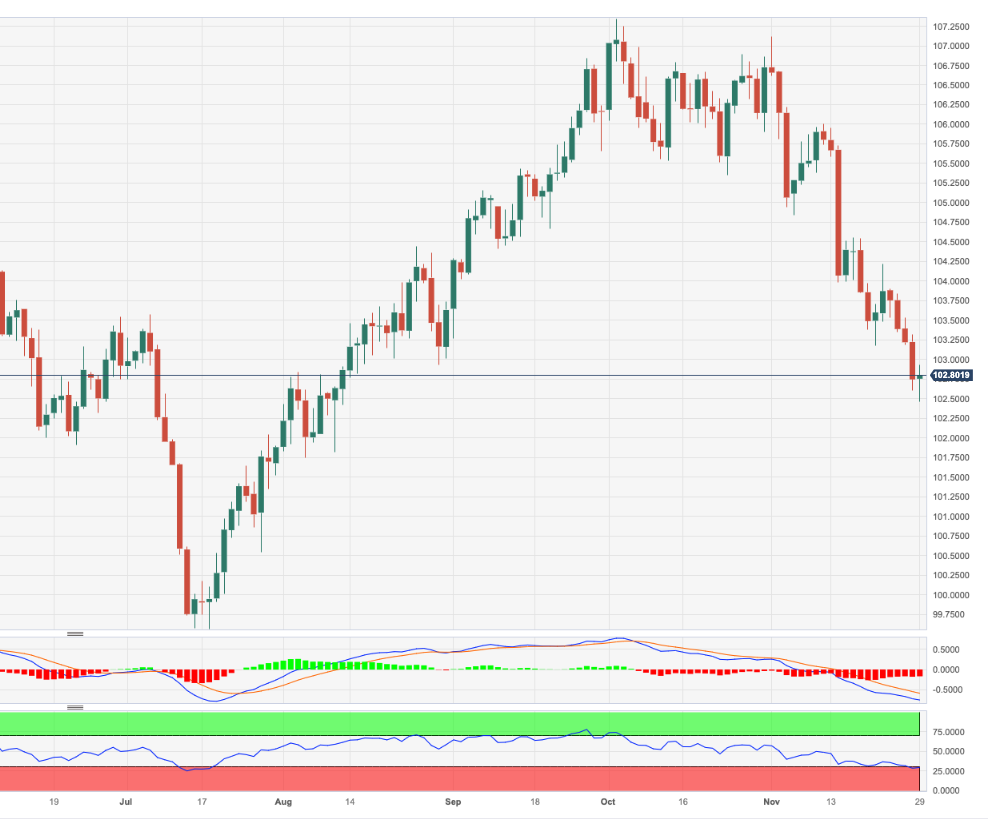
Economists at MUFG Bank analyze Kiwi’s outlook after a more hawkish than expected RBNZ Monetary Policy Statement.
Short NZD positioning vulnerable
The announcement of an unchanged policy rate of 5.50% was accompanied by updated forecasts and projections for the official policy rate. The peak for the Official Cash Rate was nudged a little higher from 5.59% to 5.69% and the forecast for the OCR in 2026 showed the RBNZ now expected to cut by 50 bps less by that stage.
We suspect the level of hawkishness communicated today by the RBNZ is somewhat excessive and unlikely to be sustained in an environment of further declines in inflation on a global basis.
The surprise tone from today’s RBNZ meeting leaves short NZD positioning vulnerable. Leveraged Funds have recently increased short NZD positions. As of last Friday, a short NZD position was maintained for the second consecutive week and was the largest in eight weeks. Given the current poor USD sentiment, the RBNZ’s hawkish stance could see NZD advance further from here although NZD was already the 2nd best performing G10 currency this month before today’s gain.
- EUR/JPY prints humble gains in the 162.10/20 band midweek.
- Extra decline could see the 161.20 region revisited in the short term.
EUR/JPY sets aside two daily pullbacks in a row and manages to bounce off earlier lows in the 161.50 area on Wednesday.
The continuation of the downward bias carries the potential to drag the cross to the weekly low of 161.20/25 band (November 21) prior to the provisional 55-day SMA, today at 159.45.
So far, the longer term positive outlook for the cross appears favoured while above the 200-day SMA at 153.46.
EUR/JPY daily chart
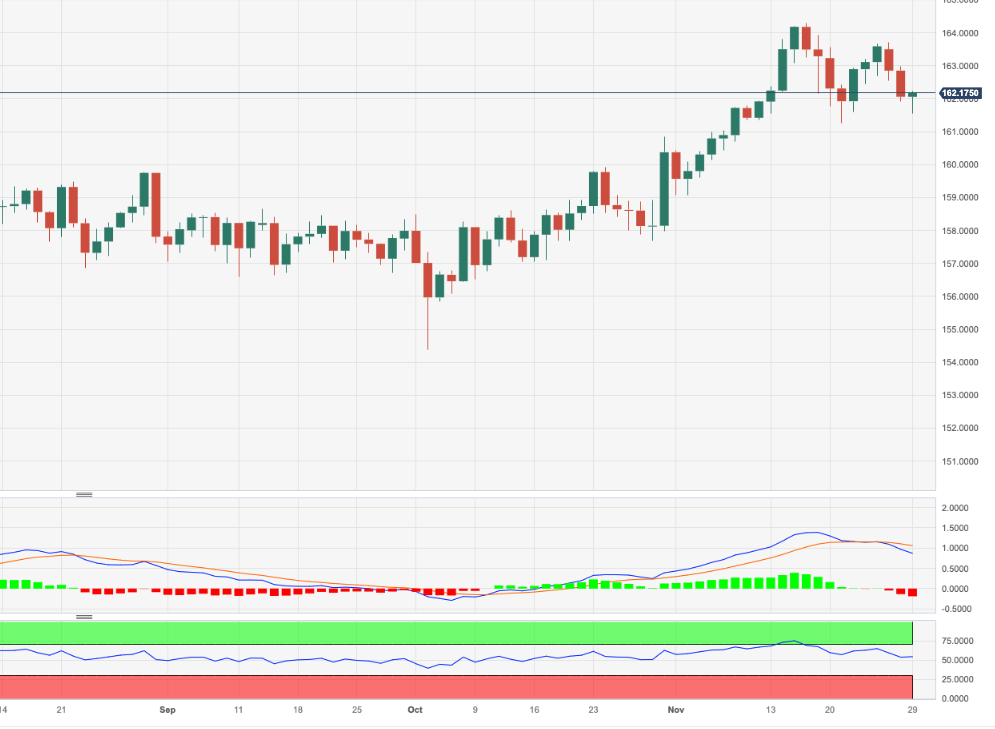
- WTI Oil soars higher as consensus is near within OPEC on production quotas.
- The US Dollar is trying to turn around recent declines after it hit a fresh three-month low.
- Oil to rally further ahead of OPEC+ on Thursday when more details will leak on production cuts.
Oil prices are off the lows and are soaring above $76 on Wednesday. Rumours were the main driver already this week around the upcoming OPEC+ meeting on Thursday. The big issue at hand was that African countries were vetoing any production cuts they needed to make after Saudi Arabia asked all OPEC+ members to make efforts to ease the supply side. Rumours overnight have leaked that a deal is near and no delay will be taking place, with OPEC+ ready to provide a package of production cuts by several members.
The US Dollar (USD) fell out of bed on Tuesday and saw its descent eke out more losses. The catalyst which triggered the latest leg lower was Fed member Christopher Waller, who surprised markets with a very dovish tilt. US Yields dropped, and ticked the next domino in a spillover effect, which saw a devaluing US Dollar and a US Dollar Index (DXY) printing a fresh 3-month low.
Crude Oil (WTI) trades at $76.88 per barrel and Brent Oil trades at $81.83 per barrel at the time of writing.
Oil news and market movers: OPEC+ deal very near
- Sources revealed that an OPEC+ agreement is very near and that the African countries are close to agreeing the offer on the table. Saudi Arabia has demanded from all OPEC+ members to cut its production in order to create a substantial floor in current Oil prices and to provide a reply to the current decline in demand.
- Saudi Aramco is forecasted to cut prices for Oil deliveries to Asia for the first time since June as cheaper US Oil and lagging European demand drives up competition with lower prices in the region.
- The overnight numbers from the American Petroleum Institute on US stockpiles, revealed a small draw down of 817,000, coming from a previous build of 9.047 million last week. A bigger draw down of 2 million was expected.
- This Wednesday near 15:30 GMT the Energy Information Administration (EIA) is expected to reveal a draw down of 933,000 barrels. Last week a massive build up of 8,701 million was at hand.
Oil Technical Analysis: OPEC+ deal make or break
Oil prices may have reached the end of the line in their downtrend for now. Prices are starting to advance again on rumours that a joint OPEC+ supply cut package is on the table and close to being adopted by each party. Expect to see more upturn on the back of this, though the length and strength will depend on the impact and broadness of the proposed package.
On the upside, $80.00 is the resistance to watch out for. Should crude be able to jump above that again, look for $84.00 (purple line) as the next level to see some selling pressure or profit taking. Should Oil prices be able to consolidate above there, the topside for this fall near $93.00 could come back into play.
On the downside, traders are seeing a soft floor forming near $74.00. This level is acting as the last line of defence before entering $70.00 and lower. Watch out for $67.00 with that triple bottom from June as the next support level to trade at.
-638368510845830818.png)
US WTI Crude Oil: Daily Chart
WTI Oil FAQs
What is WTI Oil?
WTI Oil is a type of Crude Oil sold on international markets. The WTI stands for West Texas Intermediate, one of three major types including Brent and Dubai Crude. WTI is also referred to as “light” and “sweet” because of its relatively low gravity and sulfur content respectively. It is considered a high quality Oil that is easily refined. It is sourced in the United States and distributed via the Cushing hub, which is considered “The Pipeline Crossroads of the World”. It is a benchmark for the Oil market and WTI price is frequently quoted in the media.
What factors drive the price of WTI Oil?
Like all assets, supply and demand are the key drivers of WTI Oil price. As such, global growth can be a driver of increased demand and vice versa for weak global growth. Political instability, wars, and sanctions can disrupt supply and impact prices. The decisions of OPEC, a group of major Oil-producing countries, is another key driver of price. The value of the US Dollar influences the price of WTI Crude Oil, since Oil is predominantly traded in US Dollars, thus a weaker US Dollar can make Oil more affordable and vice versa.
How does inventory data impact the price of WTI Oil
The weekly Oil inventory reports published by the American Petroleum Institute (API) and the Energy Information Agency (EIA) impact the price of WTI Oil. Changes in inventories reflect fluctuating supply and demand. If the data shows a drop in inventories it can indicate increased demand, pushing up Oil price. Higher inventories can reflect increased supply, pushing down prices. API’s report is published every Tuesday and EIA’s the day after. Their results are usually similar, falling within 1% of each other 75% of the time. The EIA data is considered more reliable, since it is a government agency.
How does OPEC influence the price of WTI Oil?
OPEC (Organization of the Petroleum Exporting Countries) is a group of 13 Oil-producing nations who collectively decide production quotas for member countries at twice-yearly meetings. Their decisions often impact WTI Oil prices. When OPEC decides to lower quotas, it can tighten supply, pushing up Oil prices. When OPEC increases production, it has the opposite effect. OPEC+ refers to an expanded group that includes ten extra non-OPEC members, the most notable of which is Russia.
Ulrich Leuchtmann, Head of FX and Commodity Research at Commerzbank, highlights that sometimes the market moves on its own accord.
Not everything can be explained
The FX market is a collection of subjects who do nothing but guess what the other subjects might be doing. Sometimes there are periods when their actions cancel each other out and as a result, nothing happens. And sometimes there are periods during which moves are reinforced by herd behavior. Skeptics (and economists) call it a ‘speculative bubble’. I avoid the term, because ‘bubble’ sounds as if it might burst, at which point the USD weakness would disappear. That does not have to be the case. I, therefore, prefer ‘self-reinforcing market movement’.
Not every pip in market movement has to be explained with the news flow. When I was a young analyst, I sometimes had this aspiration. But by now I have realised that such efforts are futile. For all parties involved. Sometimes the market moves on its own accord.
In other words: don’t always rely on the ‘explanations’ that you read about exchange rate moves. After the event, we analysts often find a sack of rice that fell over somewhere and can ‘explain’ this move or another.
GBP/USD advances to fresh multi-month peak, eyes mid-1.2700s amid bearish USD
The GBP/USD pair scales higher for the fifth straight day – also marking the eighth day of a positive move in the previous nine – and advances to a fresh three-month peak during the Asian session on Wednesday. Spot prices currently trade around the 1.2715-1.2720 region, up 0.20% for the day, and seem poised to prolong a near three-week-old uptrend in the wake of sustained US Dollar (USD) selling.
The USD Index (DXY), which tracks the Greenback against a basket of currencies, sinks to its lowest level since August 11 amid rising bets for a series of rate cuts by the Federal Reserve (Fed) in 2024. The expectations were reaffirmed by the overnight dovish remarks by Fed Governor Christopher Waller, saying that policy is currently well positioned to slow the economy and get inflation back to the 2% target. Read more...
GBP/USD holds above the 1.2700 mark ahead of the US GDP data
The GBP/USD pair gains momentum above 1.2700 during the early European session on Wednesday. The uptick of the pair is supported by the weaker US Dollar (USD) and lower US Treasury bond yields. The pair currently trades near 1.2715, up 0.19% on the day.
The Bank of England (BoE) governor, Jonathan Haskel said inflationary pressures remain in the UK labor market and there was no way to cut interest rates from their 15-year high any time soon. While BoE Deputy Governor Dave Ramsden said monetary policy would need to be restrictive for some time to bring inflation down. On Monday, BoE Governor Andrew Bailey said getting inflation down to the central bank's 2% target will be hard work as most of its recent decline was caused by the unwinding of the surge in energy prices last year. Read more...
The New Zealand Dollar liked what it heard from the Reserve Bank of New Zealand (RBNZ) and rallied after the Monetary Policy Statement (MPS). Economists at ING analyze Kiwi’s outlook.
New Zealand bucks the dovish trend
While keeping its Official Cash Rate (OCR) unchanged at 5.50%, the RBNZ did buck the globally dovish trend of central bankers by raising its forecast profile by 40-50 bps over the next three years.
We are positive on NZD/USD into next year – largely on the turn in the US Dollar story. But a more hawkish than expected RBNZ can't hurt either.
Let's see whether NZD/USD has the legs to push onto resistance at 0.63 in early December.
Considering advanced prints from CME Group for natural gas futures markets, open interest remained choppy and went up by around 13.6K contracts on Tuesday. Volume followed suit and increased for the second session in a row, this time by around 21.7K contracts.
Natural Gas: Initial up-barrier comes near $3.300
Tuesday’s decent bounce in prices of natural gas was in tandem with increasing open interest and volume, leaving the door open to the continuation of the rebound in the very near term. Against that view, the commodity is expected to meet the next obstacle around the weekly high if $3.275 per MMBtu (November 15).
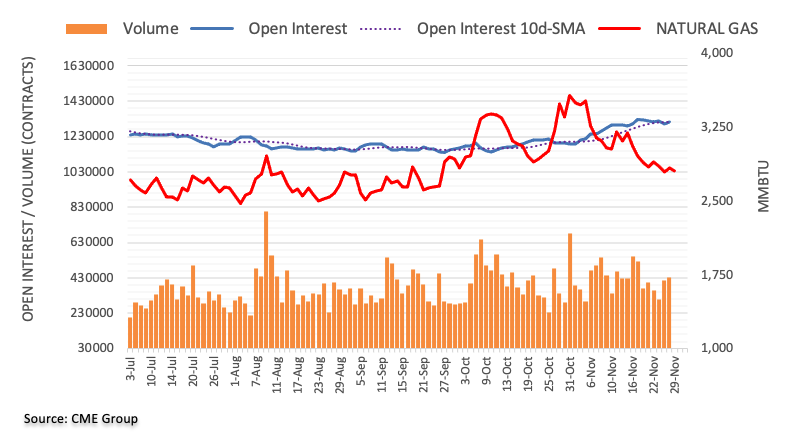
10-year US Treasury yield erased key support at 4.36%. Economists at Société Générale analyze the US Treasuries outlook.
Inability to reclaim 4.36% could mean persistence in downtrend
10Y UST has re-integrated within previous multi-month range denoting prevalence of steady downward momentum. This is also highlighted by daily MACD which has recently entered negative territory.
Inability to reclaim last week low of 4.36% could mean persistence in downtrend.
10Y UST looks poised to head lower towards next potential objectives located at projections of 4.16%/4.13% and March/July peaks of 4.08%.
NZD/USD scaled 0.62 handle for the first time since early August following the Reserve Bank of New Zealand (RBNZ) Monetary Policy Statement. Economists at Société Générale analyze Kiwi’s outlook.
RBNZ does not rule out another 25 bps hike
The RBNZ left the OCR unchanged at 5.50% but the updated forecast by the central bank was hawkish projecting a possibility of another 25 bps and no rate cut until 2Q25 vs. 1Q25 earlier.
Daily MACD has been posting positive divergence and has crossed above equilibrium line. These signals point toward potential upside.
The pair is expected to inch higher gradually towards 0.6260 and the trend line drawn since 2021 near 0.6380/0.6400 which could be an important resistance zone.
Upper part of previous range near 0.6050 should cushion near term downside.
The Dollar has extended its recent losses. Economists at ING analyze the US Dollar Index (DXY) outlook.
DXY has support around the 102.50 area
For today's session, the focus will be on revisions to the 3Q23 US GDP data, which initially printed at 4.9% quarter-on-quarter annualised. A modest upward revision is expected.
DXY has fallen more quickly than we had been expecting but has support around the 102.50 area.
We suspect we could see a more consolidative environment today, but the threat of more Dollar losses on soft inflation data on Thursday warns that sellers may be lining up at 103.50 now.
- USD/CAD struggles to hold ground as US Dollar rebounds.
- Technical indicators suggest retesting the major support at the 1.3550 level.
- A break above the psychological barrier of 1.3600 could approach the 23.6% Fibo at 1.3625.
USD/CAD struggles to halt its three-day losing streak post recovering most of its intraday losses, hovering around 1.3570 during the European hours on Wednesday. However, the USD/CAD pair faced challenges during the Asian session on the back of a softer US Dollar (USD), coupled with improved Crude oil prices.
The technical indicators for the USD/CAD pair support the current downward trend. The Moving Average Convergence Divergence (MACD) line is below the centerline and the signal line, indicating a bearish momentum in the pair.
Furthermore, the 14-day Relative Strength Index (RSI) below 50 indicates bearish sentiment, indicating that the USD/CAD pair could meet the support around the major level at 1.3550.
A firm break below the latter could influence the bears of the USD/CAD pair to navigate the psychological support region around 1.3500.
On the upside, if the USD/CAD pair surpasses the psychological barrier of 1.3600, it could reach the 23.6% Fibonacci retracement at 1.3625 and seven-day Exponential Moving Average (EMA) at the 1.3628 level. A breakthrough above the resistance area could open the doors for the USD/CAD pair to explore the region around the 1.3650 level.
USD/CAD: Daily Chart
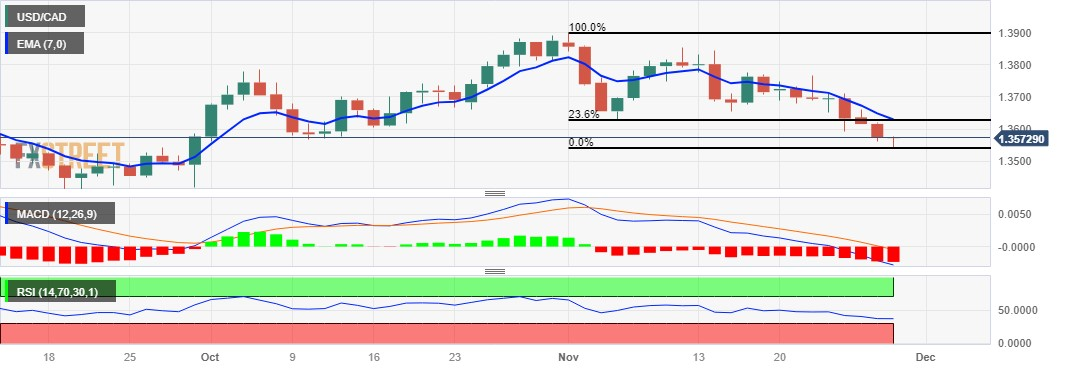
- The Euro fades the initial uptick above 1.1000 against the US Dollar.
- European stocks open Wednesday’s session with decent gains.
- Flash Germany’s CPI, advanced US Q3 GDP Growth Rate next on tap.
The Euro could not sustain another bout of strength past the 1.1000 mark against the US Dollar on Wednesday, prompting EUR/USD to recede to the 1.0990 region in the wake of the opening bell in Europe.
On the flip side, the Greenback remains under pressure and trades without a clear direction around 102.70, managing to bounce off earlier lows in the 102.50-102.45 band when measured by the USD Index (DXY).
The current monetary policy landscape remains unchanged, with investors incorporating the possibility of future interest rate cuts by both the Federal Reserve (Fed) and the European Central Bank (ECB) in the spring of 2024.
On the euro docket, the focus of attention will be on the release of the flash Inflation Rate in Germany for the month of November.
Across the pond, the advanced Q3 GDP Growth Rate will take centre stage along with preliminary Goods Trade Balance figures and the usual Mortgage Applications tracked by MBA, while the release of the Fed’s Beige Book will close the calendar later in the NA session.
In addition, Cleveland Fed Loretta Mester (2024 voter, hawk) is also due to speak.
Daily digest market movers: Euro challenges the 1.1000 region once again
- The EUR alternates gains with losses against the USD.
- US and German yields extend their march south midweek.
- Investors contemplate the Fed reducing its interest rates in Q2 2024.
- Markets expectations place the ECB cutting rates in H2 2024.
- ECB’s Luis De Guindos said banks are delaying passing higher rates to savers.
- BoJ’s Seiji Adachi said a positive wage-inflation cycle is needed to change stance.
Technical Analysis: Euro now looks at 1.1064
Further upside momentum lifts EUR/USD to new monthly highs near 1.1020 on Wednesday.
The November high of 1.1017 (November 29) is now the EUR/USD’s immediate target, followed by the August top of 1.1064 (August 10) and another weekly peak of 1.1149 (July 27), all of which precede the 2023 high of 1.1275. (July 18).
Meanwhile, any corrective declines should find first support around the crucial 200-day SMA at 1.0814, followed by the temporary 55-day SMA at 1.0671. The weekly low of 1.0495 (October 13) follows next, seconded by the 2023 low of 1.0448 (October 3).
Meanwhile, the bullish outlook for the pair remains unchanged as long as it trades above the 200-day SMA.
Euro FAQs
What is the Euro?
The Euro is the currency for the 20 European Union countries that belong to the Eurozone. It is the second most heavily traded currency in the world behind the US Dollar. In 2022, it accounted for 31% of all foreign exchange transactions, with an average daily turnover of over $2.2 trillion a day.
EUR/USD is the most heavily traded currency pair in the world, accounting for an estimated 30% off all transactions, followed by EUR/JPY (4%), EUR/GBP (3%) and EUR/AUD (2%).
What is the ECB and how does it impact the Euro?
The European Central Bank (ECB) in Frankfurt, Germany, is the reserve bank for the Eurozone. The ECB sets interest rates and manages monetary policy.
The ECB’s primary mandate is to maintain price stability, which means either controlling inflation or stimulating growth. Its primary tool is the raising or lowering of interest rates. Relatively high interest rates – or the expectation of higher rates – will usually benefit the Euro and vice versa.
The ECB Governing Council makes monetary policy decisions at meetings held eight times a year. Decisions are made by heads of the Eurozone national banks and six permanent members, including the President of the ECB, Christine Lagarde.
How does inflation data impact the value of the Euro?
Eurozone inflation data, measured by the Harmonized Index of Consumer Prices (HICP), is an important econometric for the Euro. If inflation rises more than expected, especially if above the ECB’s 2% target, it obliges the ECB to raise interest rates to bring it back under control.
Relatively high interest rates compared to its counterparts will usually benefit the Euro, as it makes the region more attractive as a place for global investors to park their money.
How does economic data influence the value of the Euro?
Data releases gauge the health of the economy and can impact on the Euro. Indicators such as GDP, Manufacturing and Services PMIs, employment, and consumer sentiment surveys can all influence the direction of the single currency.
A strong economy is good for the Euro. Not only does it attract more foreign investment but it may encourage the ECB to put up interest rates, which will directly strengthen the Euro. Otherwise, if economic data is weak, the Euro is likely to fall.
Economic data for the four largest economies in the euro area (Germany, France, Italy and Spain) are especially significant, as they account for 75% of the Eurozone’s economy.
How does the Trade Balance impact the Euro?
Another significant data release for the Euro is the Trade Balance. This indicator measures the difference between what a country earns from its exports and what it spends on imports over a given period.
If a country produces highly sought after exports then its currency will gain in value purely from the extra demand created from foreign buyers seeking to purchase these goods. Therefore, a positive net Trade Balance strengthens a currency and vice versa for a negative balance.
The Reserve Bank of New Zealand (RBNZ) kept the Official Cash Rate (OCR) unchanged yet signalled that they may hike rates in 2024. Economists at ANZ Bank analyze how could the new track impact the New Zealand Dollar (NZD).
RBNZ’s track implies a hike in the first half of 2024
Technically, the RBNZ’s track implies a hike in the first half of 2024. That’s a long way from where the market is now (markets are still pricing in small odds of a cut by May), and as such, we do see some upside risk to rates. But we wouldn’t overplay that theme, mindful of the tendency of markets to front-run the RBNZ, and to swing with the global vibe, which has of late been all about central bank being done and cuts coming in 2024.
When we look at their projections in totality, and consider aspects like the 25 bps increase in the Bank’s estimate of the neutral OCR, that gives the impression of a central bank that is genuinely worried that the economy might be at risk of getting a second wind too soon, and that’s likely to put a floor under interest rates and the NZD.
- USD/MXN failed to cheer the better-than-expected US data.
- The mixed remarks from Fed officials put weight on the US Dollar.
- Banxico Deputy Governor Jonathan Heath indicated one or two rate cuts in 2024.
USD/MXN halts its three-day winning streak due to the softer US Dollar (USD), which could be attributed to the mixed remarks from the Federal Reserve’s (Fed) members. Moreover, the mixed data from the United States (US) failed to heal the Greenback. The USD/MXN pair trades around 17.1400 during the European session on Wednesday.
Fed Governor Christopher Waller suggested a more accommodative approach of not insisting on maintaining high-interest rates, while Fed Governor Michelle Bowman mentioned the likelihood that the US Fed could keep the policy rate at a higher level than pre-pandemic levels.
In September, the US Housing Price Index (MoM) maintained stability at 0.6%, surpassing anticipated levels. Simultaneously, the CB Consumer Confidence Index saw an uptick, reaching 102.0. In contrast, the Richmond Fed Manufacturing Index reported an unexpected negative reading of 5, deviating from the anticipated positive figure.
On the other side, the Mexican Peso (MXN) lost ground earlier this week against the US Dollar as Jonathan Heath, Bank of Mexico’s (Banxico) Deputy Governor, remarked that core prices need to decrease further. He also indicated that there might be one or two rate cuts next year, emphasizing that any adjustments would be made "very gradually" and "with great caution."
Moreover, the recent minutes from Banxico highlight the significance of maintaining higher interest rates for an extended period to achieve the target inflation rate. This stance, combined with positive inflation data disclosed earlier., might have put downward pressure on the USD/MXN pair. Additionally, traders will watch Mexico’s Jobless Rate for October on Thursday.
EUR/USD has briefly breached the 1.10 mark. Economists at ING analyze the pair’s outlook.
EUR/USD has good intra-day support at the 1.0965 area
For today, the focus will be on German CPI – expected to slow to 3.5% from 3.8% year-on-year and presage a softer Eurozone inflation release on Thursday.
EUR/USD has nudged above 1.10 and now has good intra-day support at the 1.0965 area. Unless we see massive upside revisions to 3Q23 US GDP data today, we doubt EUR/USD needs to come a lot lower.
And 1.0965-1.1065 could well be the holding pattern into Thursday's US PCE inflation data.
- NZD/USD trims intraday gains as US Dollar attempts to rebound.
- Technical indicators suggest revisiting psychological resistance at 0.6200 aligned with the three-month high.
- A break below 0.6150 could push the pair to test 23.6% Fibo before the 0.6100 psychological support.
NZD/USD retraces its intraday gains as the US Dollar rebounds during the early European session on Wednesday. However, the NZD/USD pair received upward support after the release of the Reserve Bank of New Zealand (RBNZ) interest rate decision. RBNZ board members decided to keep the interest rate steady at 5.50%. This decision aligns with widespread expectations in the market.
The NZD/USD trades higher near 0.6160 at the time of writing. The 14-day Relative Strength Index (RSI) is above the 50 level, indicating a bullish sentiment for the NZD/USD pair.
This could encourage bulls of the pair to retest the psychological resistance region around 0.6200 aligned with the three-month high at 0.6208.
A breakthrough above the resistance area could support the NZD/USD pair to approach August’s high at 0.6217.
Moreover, the Moving Average Convergence Divergence (MACD) line, situated above the centerline and the signal line, could be a confirmation of bullish momentum in the market.
On the downside, a break below the major support level of 0.6150 could push the pair to fall to the 23.6% Fibonacci retracement at 0.6105 lined up with the psychological support at 0.6100 before the seven-day Exponential Moving Average (EMA) at 0.6092.
NZD/USD: Daily Chart:
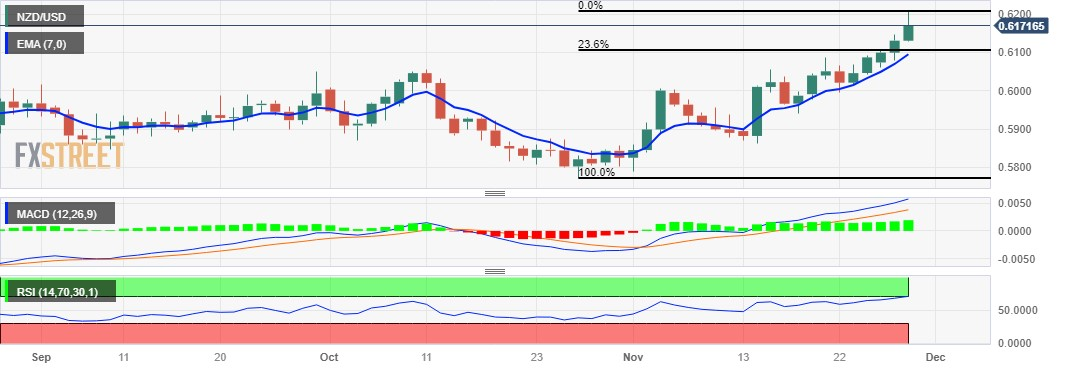
The Reserve Bank of New Zealand (RBNZ) left the Official Cash Rate (OCR). Economists at Commerzbank analyze the Monetary Policy Statement and its implications for the New Zealand Dollar (NZD).
Further rate hikes are possible now
There was no rate hike today. However, the RBNZ’s MPC shifted its expectation of future key rate developments to the upside. Further rate hikes are possible now. Probably not very many, but still: that makes rate cuts as early as next year unlikely.
The RBNZ remains sceptical whether the rate hikes implemented so far will be sufficient to return inflation into the target area (1% to 3%) on a sustainable basis. That is the qualitative difference between the inventors of direct inflation control and the majority of the other G10 central banks.
Anyone who believes – as we at Commerzbank Research do – that the recent period of inflation has catapulted us out of the low inflation environment of the 2010s and that we are facing permanent inflation pressure once again (as was the case in the 1990s for example) will prefer the RBNZ’s approach over that of the other G10 central banks. And they will consider the initial market reaction to the RBNZ decision to be too limited rather than excessive.
...and life is not easy for NZD bears in the fortified camps Compendium, Aquarium, Laudanum and Totorum.
CME Group’s flash data for crude oil futures markets noted traders reduced their open interest positions by around 5.8K contracts after four consecutive daily builds. On the other hand, volume added around 180.3K contracts to the previous daily advance.
WTI: Another drop to $72.00 is not ruled out
Tuesday’s marked advance in prices of WTI was on the back of shrinking open interest, which removes strength from a sustained bounce in the very near term. Against that, there is still scope for crude oil prices to revisit the area of November lows near the $72.00 mark per barrel (November 16).
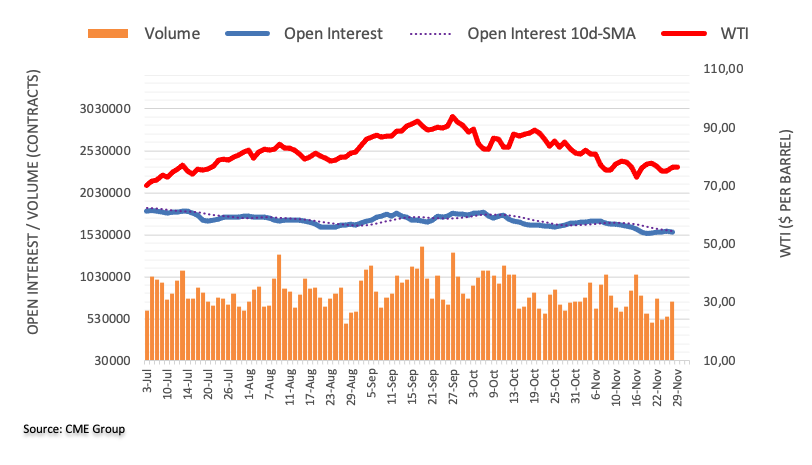
European Central Bank (ECB) Vice President Luis de Guindos said on Wednesday, “our objective is to bring inflation back to 2% target.”
Additional quotes
Rate hikes are both for borrowers and savers.
That is part of our monetary policy transmission.
If savings become more attractive, consumers will spend less, reducing demand.
This is what we aim for to push down inflation.
Market reaction
EUR/USD is unmoved by the above comments, still holding its range around 1.1000, as of writing.
“We are not in a place now where we can discuss cutting interest rates – that is not happening,” Bank of England (BoE) Governor Andrew Bailey said in an interview with Daily Focus on Wednesday.
Additional quotes
We are seeing some weakening of economic activity.
We’ve got to get on and bring inflation down to our target of 2%.
We will do what it takes to get to 2% inflation target.
We have not seen enough of the journey towards 2% inflation target yet to be confident.
FX option expiries for Nov 29 NY cut at 10:00 Eastern Time, via DTCC, can be found below.
- EUR/USD: EUR amounts
- 1.0895 705m
- 1.0900 1b
- 1.0970 784m
- 1.0975 815m
- 1.1000 765m
- 1.1035 685m
- USD/JPY: USD amounts
- 148.00 1.3b
- 148.15 1.4b
- 148.50 974m
- 149.00 1b
- AUD/USD: AUD amounts
- 0.6500 2.8b
- 0.6525 1.6b
- USD/CAD: USD amounts
- 1.3530 302m
- 1.3750 323m
- 1.3820 316m
The Japanese Yen is still the worst-performing G10 currency so far this year. Economists at HSBC analyze USD/JPY outlook.
USD/JPY may hover around the current levels into year-end
We look for USD/JPY to consolidate around the current levels into year-end.
Looking to 2024, we think USD/JPY might not fall until rate cuts by the Fed look imminent, perhaps in the middle of the year.
We expect the Fed to start easing in 3Q24.
We expect the BoJ to scrap Yield Curve Control (YCC) in 1Q24 and step out of Negative Interest Rate Policy (NIRP) in 3Q24.
The anticipated policy contrast between the Fed easing and the BoJ normalising should allow USD/JPY to fall in a more sustainable way. However, considering that the yield gap will likely remain large, we only expect a moderate decline in USD/JPY.
Bank of Japan (BoJ) board member Seiji Adachi is back on the wires in early European trading on Wednesday, noting that it is “difficult to end negative rates until positive wage-inflation cycle begins.”
Key quotes
Positive wage-inflation cycle has not happened yet
But if chances of it happening increases, then we can start discussing exit strategy.
Don't need to necessarily wait for it to turn positive to debate exit from negative rates.
Market reaction
USD/JPY has picked up fresh bids on the above comments to rise again toward 147.50. The pair trading 0.18% lower on the day at 147.20, as of writing.
- GBP/USD strengthens to 1.2715 amid the USD weakness.
- BoE’s Haskel said the inflationary pressures remain in the UK labour market and there was no way to cut rates any time soon.
- US CB Consumer Confidence climbed to 102.00 in November, vs. a downward revision to 99.1 prior.
- Traders will closely watch the US growth numbers, due later on Wednesday.
The GBP/USD pair gains momentum above 1.2700 during the early European session on Wednesday. The uptick of the pair is supported by the weaker US Dollar (USD) and lower US Treasury bond yields. The pair currently trades near 1.2715, up 0.19% on the day.
The Bank of England (BoE) governor, Jonathan Haskel said inflationary pressures remain in the UK labor market and there was no way to cut interest rates from their 15-year high any time soon. While BoE Deputy Governor Dave Ramsden said monetary policy would need to be restrictive for some time to bring inflation down. On Monday, BoE Governor Andrew Bailey said getting inflation down to the central bank's 2% target will be hard work as most of its recent decline was caused by the unwinding of the surge in energy prices last year. Nonetheless, the BoE's latest forecasts show it estimates inflation to return to 2% at the end of 2025.
Federal Reserve (Fed) Governor Christopher Waller said Tuesday that inflation currently remains too high, but he stated that progress has been made and the Fed won’t need to hike rates further from here. That being said, the rising odds that the Fed is done with rate hiking weigh on the USD and act as a tailwind for the GBP/USD pair.
Apart from this, data on Tuesday showed that US CB Consumer Confidence climbed to 102.00 in November, compared to a downward revision to 99.1 prior. The Richmond Fed Manufacturing declined to 5.0 from 3.0 rise in the previous reading. The S&P/Case-Shiller Home Price Index rose 3.9% YoY in September, below the estimation of 4.0%.
Market participants will keep an eye on the US Gross Domestic Product Annualized for the third quarter (Q3), due later on Wednesday. The growth rate is expected to expand by 5.0%. Also, BoE's Governor Bailey is set to speak later in the day. Traders will take cues from these data and find trading opportunities around the GBP/USD pair.
Here is what you need to know on Wednesday, November 29:
Asian markets were a mixed bag on Wednesday, as they shrugged off a modest uptick on Wall Street overnight. Investors remained nervous ahead of China’s key inflation readings, which negated the growing optimism that a US Federal Reserve (Fed) policy pivot could be earlier than expected next year.
The US stock futures defend mild gains amid a renewed sell-off in the US Treasury bond yields and the US Dollar, as markets reacted to the dovish pivot from Fed Governor Christopher Waller, a known hawk. Waller’s comments bolstered Fed rate cut bets for next year, especially after he said on Tuesday, “if the decline in inflation continues "for several more months ... three months, four months, five months ... we could start lowering the policy rate just because inflation is lower.”
The dovish Fed expectations were also supported by Chicago Fed President Austan Goolsbee’s remarks, expressing concerns about keeping rates too high for too long. The US Dollar Index was knocked down to a new three-month low of 102.47 in early Asian trading, now recovering ground to trade near 102.65. Meanwhile, the US Treasury bond yields were smashed across the board, with the benchmark 10-year yields fast approaching the 4.25% level. The interest rates-sensitive two-year US Treasury bond yields slid to an over four-month low below 4.70%.
US Dollar price today
The table below shows the percentage change of US Dollar (USD) against listed major currencies today. US Dollar was the weakest against the New Zealand Dollar.
| USD | EUR | GBP | CAD | AUD | JPY | NZD | CHF | |
| USD | 0.01% | -0.05% | -0.16% | 0.25% | 0.02% | -0.61% | -0.09% | |
| EUR | -0.01% | -0.04% | -0.17% | 0.23% | 0.01% | -0.63% | -0.11% | |
| GBP | 0.03% | 0.03% | -0.12% | 0.26% | 0.05% | -0.61% | -0.06% | |
| CAD | 0.15% | 0.18% | 0.12% | 0.41% | 0.16% | -0.45% | 0.05% | |
| AUD | -0.25% | -0.25% | -0.29% | -0.43% | -0.25% | -0.87% | -0.34% | |
| JPY | -0.02% | 0.01% | -0.06% | -0.17% | 0.25% | -0.61% | -0.10% | |
| NZD | 0.61% | 0.61% | 0.57% | 0.43% | 0.84% | 0.61% | 0.49% | |
| CHF | 0.07% | 0.07% | 0.04% | -0.09% | 0.33% | 0.07% | -0.54% |
The heat map shows percentage changes of major currencies against each other. The base currency is picked from the left column, while the quote currency is picked from the top row. For example, if you pick the Euro from the left column and move along the horizontal line to the Japanese Yen, the percentage change displayed in the box will represent EUR (base)/JPY (quote).
Within the G10 currency basket, the New Zealand Dollar (NZD) emerged strongest so far this Wednesday, underpinned by the Reserve Bank of New Zealand’s (RBNZ) hawkish pause. The RBNZ held the interest rate steady for the fifth straight meeting at 5.50% but left the door open for further rate increases, based on the inflation developments. NZD/USD jumped to fresh three-month highs of 0.6209 in a knee-jerk reaction to the RBNZ policy announcements before reversing to 0.6190, where it now consolidates.
The AUD/USD pair failed to sustain the upside near 0.6680 and came under renewed selling pressure in early Europe, as markets digested softer Australian monthly Consumer Price Index (CPI), fanning expectations that the Reserve Bank of Australia (RBA) is done with its rate hiking cycle. The official data from the Australian Bureau of Statistics (ABS) showed on Wednesday that the monthly CPI rose at an annual pace of 4.9% in October, slower than the 5.6% increase in September and below market forecasts of 5.2%.
Meanwhile, the Japanese Yen continued its winning streak against the US Dollar, smashing the USD/JPY to a fresh two-month low of 146.68. However, the pair cut losses and regained 147.00 after the dovish comments from Bank of Japan (BoJ) board member Seiji Adachi. Adachi dismissed speculation of ending negative rates early next year while noting that they are “not in a stage now to debate an exit from easy policy.”
EUR/USD is easing from its highest level in three months at 1.1017 to trade near 1.1000 in early European trading, as the US Dollar seems to have paused its run of declines. In a pre-recorded video at the European Financial Reporting Advisory Group Conference on Tuesday, European Central Bank (ECB) President Christine Lagarde made some comments on QT but failed to touch upon the interest rate outlook. All eyes now remain on the inflation readings from Spain and Germany. German state Of North Rhine-Westphalia (NRW) November CPI came in at 3.0% YoY, as against the October increase of 3.1%. On a monthly basis, NRW’s CPI dropped 0.3% in November vs. October’s decline of 0.1%.
GBP/USD is holding gains above 1.2700, reversing from the three-month high of 1.2733 set in the Asian session. The Bank of England (BoE) and the Fed policy divergence is seen benefiting the Pound Sterling. BoE Governor Andrew Bailey is due to speak at an event celebrating the 50th anniversary of the London Foreign Exchange Joint Standing Committee on Wednesday at 15:05 GMT.
Gold price has entered a phase of consolidation after clinching fresh six-month highs of $2,052 early Asia while WTI is looking to build on the previous recovery, currently trading just below the $77 mark, helped by expectations of further oil output cuts by OPEC and its allies (OPEC+). OPEC+ is set to meet on November 30 to decide on the continuation of output cuts next year.
- The index extends the breakdown of the 103.00 support.
- US yields drop to multi-week lows across the curve.
- Flash Q3 GDP figures, Fed’s Beige Book next on tap.
The USD Index (DXY), which tracks the greenback vs. a basket of its main rival currencies, keeps the bearish note unchanged in the mid-102.00s on Wednesday.
USD Index looks at key data, Fed
The index remains under pressure and maintains its offered stance firmly in place following the recent breach of the 103.00 support. Furthermore, the index continues to navigate its third consecutive week of losses and its worst month so far since November 2022.
Meanwhile, the perception that the Federal Reserve may begin reducing its interest rates at some point in the spring of 2024 remains steadily increasing despite consensus around this view still being elusive among some Fed policymakers.
On the US calendar, weekly Mortgage Applications tracked by MBA are due in the first turn seconded by advanced readings of the Q3 GDP Growth Rate, preliminary Goods Trade Balance and the Fed’s Beige Book.
Additionally, Cleveland Fed L. Mester (2024 voter, hawk) is also due to speak.
What to look for around USD
The index extends the leg lower and magnifies the recent breach of the 103.00 contention zone on Wednesday.
Looking at the broader picture, the dollar appears depressed against the backdrop of rising speculation of probable interest rate cuts in H1 2024, all in response to further disinflationary pressures and the gradual cooling of the labour market.
Some support for the greenback, however, still emerges the resilience of the US economy as well as a persistent hawkish narrative from some Fed rate setters.
Key events in the US this week: MBA Mortgage Applications, Q3 GDP Growth Rate, Goods Trade Balance, Fed Beige Book (Wednesday) – PCE, Core PCE, Initial Jobless Claims, Personal Income, Personal Spending, Pending Home Sales (Thursday) – Final S&P Global Manufacturing PMI, ISM Manufacturing PMI, Construction Spending, Fed’s Powell (Friday).
Eminent issues on the back boiler: Growing perception of a soft landing for the US economy. Speculation of rate cuts at some point in the spring of 2024. Omnipresent geopolitical effervescence vs. Russia and China. Potential spread of the Middle East crisis to other regions.
USD Index relevant levels
Now, the index is down 0.11% at 102.65 and faces immediate contention at 102.46 (monthly low November 29) ahead of 101.74 (monthly low August 4) and then 100.51 (weekly low July 27). On the upside, the breakout of 103.59 (200-day SMA) would open the door to 104.21 (weekly high November 22) and then 105.51 (55-day SMA).
Open interest in gold futures markets increased by around 10.1K contracts on Tuesday, reversing at the same time three consecutive daily pullbacks according to preliminary readings from CME Group. Volume, instead, shrank by around 39.8K contracts after two daily builds in a row.
Gold: Next target comes at the 2023 top
Gold prices extended the uptrend north of the $2000 mark on Tuesday. The move was on the back of rising open interest and is indicative that the continuation of the upbeat mood remains in the pipeline in the very near term. Against that, the next target of note for the yellow metal emerges at the 2023 peak of $2067 per troy ounce (May 4).
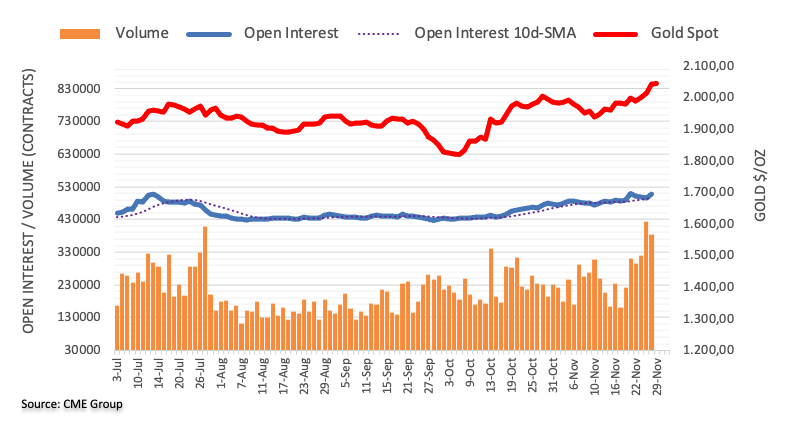
- EUR/USD trades in positive territory for five straight days above the 1.1000 psychological mark.
- The 50-hour EMA is on the verge of crossing above the 100-hour EMA.
- The immediate resistance level is located at 1.1065; the initial support level will emerge at 1.0900.
The EUR/USD pair gains traction for the fifth consecutive day during the early European session on Wednesday. The decline of the US Dollar (USD) lends some support to the major pair. As of writing, EUR/USD is trading near 1.1001, gaining 0.12% on the day.
From the technical perspective, the bullish outlook of the EUR/USD pair remains intact as the pair holds above the 50- and 100-hour Exponential Moving Averages (EMA) on the daily chart. It’s worth noting that the 50-hour EMA is on the verge of crossing above the 100-hour EMA. If a decisive crossover occurs on the daily chart, it would validate a Bull Cross, highlighting that the path of least resistance for EUR/USD is to the upside.
The immediate resistance level for the major pair is located near the upper boundary of the Bollinger Band and a high of October 8 at 1.1065. The next hurdle is seen at a high of July 27 at 1.1150. Any follow-through buying above the latter will see the rally to a psychological round mark of 1.1200.
On the flip side, the initial support level will emerge at a high of November 21 and the round mark at 1.0900. Further south, the next downside target to watch is a low of November 17 at 1.0825. The key contention level is seen at 1.0760. The mentioned level is the confluence of the 50-hour EMA and the 100-hour EMA.
Meanwhile, the Relative Strength Index (RSI) stands in bullish territory above 50, indicating that further upside looks favorable.
EUR/USD daily chart
-638368347055994257.png)
- USD/CHF reached a 13-week low on mixed comments from Fed members.
- The mixed US data could have contributed to the weakening of the US Dollar.
- Investors await the Swiss ZEW Survey – Expectations on Wednesday.
USD/CHF touched a 13-week low at 0.8757 during the Asian session on Wednesday and recovered some of its intraday losses, trading near 0.8770 at the time of writing.
The decline in the USD/CHF pair is linked to the accommodative remarks made by US Federal Reserve (Fed) Governor Christopher Waller. Waller's suggestion that the Federal Reserve may not insist on maintaining high-interest rates if inflation consistently declines has likely played a role in the downward pressure on the US Dollar (USD) against the Swiss Franc (CHF).
It seems there's a difference of opinion within the Federal Reserve regarding the future trajectory of interest rates. While Fed Governor Christopher Waller suggested a more accommodative approach, Fed Governor Michelle Bowman expressed the possibility that the US Fed bank may need the policy rate at a higher level than pre-pandemic levels. Additionally, New York Fed President John Williams finds encouragement in the decline of inflation but reiterates the Fed's commitment to getting inflation back to target.
The US Dollar (USD) is undergoing a retreat against its major currency peers, with mixed results in US data contributing to the nuanced market sentiment. While the September US Housing Price Index (MoM) remained consistent at 0.6%, surpassing expectations, the CB Consumer Confidence Index increased to 102.0. However, the Richmond Fed Manufacturing Index printed a negative reading of 5, contrary to the expected positive figure.
Investors are now turning their attention to key events, including the preliminary Gross Domestic Product Annualized for the third quarter in the US and the release of the Fed's Beige Book, providing a comprehensive picture of overall US economic growth.
Looking ahead, the Swiss ZEW Survey – Expectations on Wednesday, Swiss Real Retail Sales for October on Thursday, and the Gross Domestic Product for the third quarter on Friday will be closely monitored. These releases hold significance in providing insights into economic conditions and shaping market expectations.
- USD/CAD marked a nine-week low at 1.3541 on Wednesday.
- US Dollar faces downward pressure on Fed Governor Waller's hawkish comments.
- WTI price improves on expected extension of oil supply cuts by OPEC+.
The USD/CAD pair reached a nine-week low at 1.3541 during the Asian session on Wednesday, currently trading below 1.3550. The decline in the USD/CAD pair is attributed to the accommodative remarks from US Federal Reserve (Fed) Governor Christopher Waller. Waller's suggestion that the Federal Reserve may not insist on maintaining high interest rates if inflation consistently declines has likely contributed to the downward pressure on the Loonie pair.
The US Dollar (USD) experiences a retreat against its major currency peers, despite mixed results in United States (US) data. The US Housing Price Index (MoM) maintained consistency at 0.6%, exceeding the expected figure of 0.4% in September. The US CB Consumer Confidence Index increased to 102.0 from the previous reading of 99.1 (Revised from 102.6). However, the Richmond Fed Manufacturing Index printed a negative reading of 5 against the expected 1 positive figure.
Additionally, the improved Crude oil prices are reinforcing the strength of the Canadian Dollar (CAD) against the Greenback. Western Texas Intermediate (WTI) price hovers around $76.60 per barrel at the time of writing. The recovery in Crude oil prices gains momentum as the market anticipates the upcoming meeting of the Organization of the Petroleum Exporting Countries and its allies (OPEC+). The decisions made during this meeting will have a significant impact on oil supply dynamics.
The expectation is that Saudi Arabia will likely propose an extension of oil supply cuts by 1 million barrels a day until next year. Additionally, Russia might consider further supply cuts, potentially reducing its output by 300,000 barrels per day.
Investors' focus will now be on the preliminary Gross Domestic Product (GDP) Annualized for the third quarter in the US. Fed’s Beige Book release, will give a picture of the overall US economic growth. On Thursday, Canada’s GDP Annualized data will present a measure of the total value of all goods and services produced in the country in the third quarter.
- Asian stocks witnessed a muted trading action on Wednesday amid China's economic woes.
- Australia's ASX 200 is among the best performers amid reduced bets for more RBA rate hikes.
- Traders look to the prelim US GPD print for some impetus ahead of Chinese PMI on Thursday.
Most Asian stocks took cues from the overnight positive close on Wall Street, though gains were limited amid concerns over the worsening economic outlook in China. Traders also seem reluctant to place aggressive bets ahead of key economic readings from China and the United States (US).
The official Chinese PMI data is due for release on Thursday and is expected to show a sustained declining trend in the country's manufacturing sector activity. This comes on the back of growing worries about a property market crisis in the world's second-largest economy and keeps a lid on the latest optimism led by expectations for an early pivot by the Federal Reserve (Fed).
In fact, Fed Governor Christopher Waller – a noted hawk – said on Tuesday that he was increasingly confident that policy is currently well positioned to slow the economy and get inflation back to the central bank's 2% target. Waller added that the easing inflation could allow the Fed to start cutting interest rates in 2024, which boosted investors' appetite for riskier assets.
Australia’s ASX 200 Index, meanwhile, is among the better performers for the day on the back of softer domestic consumer inflation figures, which lifted hopes that the Reserve Bank of Australia (RBA) will not raise rates any further. The CPI, however, remains well above the RBA’s target range, suggesting that the central bank is likely to keep interest rates higher for longer.
Moving ahead, investors now look to the prelim US GDP report, due for release later during the early North American session, which is expected to show that the economy grew by a 5% annualized pace as against the 4.9% estimated originally. The key data might influence the risk sentiment ahead of the US Core PCE Price Index – the Fed's preferred inflation gauge on Thursday.
Gold prices rose in India on Wednesday, according to data from India's Multi Commodity Exchange (MCX).
Gold price stood at 61,618 Indian Rupees (INR) per 10 grams, up INR 389 compared with the INR 61,229 it cost on Tuesday.
As for futures contracts, Gold prices increased to INR 62,820 per 10 gms from INR 62,722 per 10 gms.
Prices for Silver futures contracts decreased to INR 77,150 per kg from INR 76,993 per kg.
| Major Indian city | Gold Price |
|---|---|
| Ahmedabad | 63,790 |
| Mumbai | 63,625 |
| New Delhi | 63,725 |
| Chennai | 63,780 |
| Kolkata | 63,810 |
An automation tool was used in creating this post.
Global Market Movers: Comex Gold price renews six-month highs on Fed rate cut bets
- The US Dollar dives to over a three-and-half-month low amid rising bets for a series of rate cuts by the Federal Reserve in 2024 and continues to boost the Comex Gold price.
- Fed Governor Christopher Waller said on Tuesday that he could see a point where the central bank might start lowering rates if inflation continues to ease over the next few months.
- Waller added that he is increasingly confident that policy is currently well-positioned to slow the economy and get inflation back to the central bank's 2% target.
- Fed Governor Michelle Bowman offered a contrasting view and reiterated her belief that more rate hikes likely will be needed as evolving dynamics keep inflation elevated.
- Markets expect the Fed to hold its key lending rate steady in a target range between 5.25%-5.5% in December, though officials have stressed the need to remain vigilant on inflation and keep their options open.
- The Israel-Hamas ceasefire deal has been extended by two days beyond its original expiration on Tuesday morning, which could dim the metal's safe-haven appeal.
- Hamas released about 50 hostages as part of the original agreement and is expected to free another 20 over the next two days in exchange for the release of Palestinian prisoners by Israel.
- Traders now look to the prelim US GDP report, which is expected to show that the world's largest economy expanded by a 5% annualized pace during the third quarter as against the 4.9% estimated.
Gold FAQs
Why do people invest in Gold?
Gold has played a key role in human’s history as it has been widely used as a store of value and medium of exchange. Currently, apart from its shine and usage for jewelry, the precious metal is widely seen as a safe-haven asset, meaning that it is considered a good investment during turbulent times. Gold is also widely seen as a hedge against inflation and against depreciating currencies as it doesn’t rely on any specific issuer or government.
Who buys the most Gold?
Central banks are the biggest Gold holders. In their aim to support their currencies in turbulent times, central banks tend to diversify their reserves and buy Gold to improve the perceived strength of the economy and the currency. High Gold reserves can be a source of trust for a country’s solvency. Central banks added 1,136 tonnes of Gold worth around $70 billion to their reserves in 2022, according to data from the World Gold Council. This is the highest yearly purchase since records began. Central banks from emerging economies such as China, India and Turkey are quickly increasing their Gold reserves.
How is Gold correlated with other assets?
Gold has an inverse correlation with the US Dollar and US Treasuries, which are both major reserve and safe-haven assets. When the Dollar depreciates, Gold tends to rise, enabling investors and central banks to diversify their assets in turbulent times. Gold is also inversely correlated with risk assets. A rally in the stock market tends to weaken Gold price, while sell-offs in riskier markets tend to favor the precious metal.
What does the price of Gold depend on?
The price can move due to a wide range of factors. Geopolitical instability or fears of a deep recession can quickly make Gold price escalate due to its safe-haven status. As a yield-less asset, Gold tends to rise with lower interest rates, while higher cost of money usually weighs down on the yellow metal. Still, most moves depend on how the US Dollar (USD) behaves as the asset is priced in dollars (XAU/USD). A strong Dollar tends to keep the price of Gold controlled, whereas a weaker Dollar is likely to push Gold prices up.
- Gold price gains positive traction for the sixth straight day and refreshes its multi-month top.
- Dovish Fed expectations, falling US bond yields and a bearish USD continue to lend support.
- The overbought RSI on the daily chart warrants caution before placing fresh bullish bets.
Gold price (XAU/USD) builds on this week's breakout momentum through the $2,008-2,010 horizontal barrier and scales higher for the fifth successive day on Wednesday. This also marks the sixth day of a positive move in the previous seven and lifts the commodity to a near seven-month peak, around the $2,052 area during the Asian session. The near-term outlook for the precious metal, meanwhile, remains bullish in the wake of the prevalent US Dollar (USD) selling bias, fuelled by dovish Federal Reserve (Fed) expectations.
Investors now seem convinced that the Fed will no longer raise interest rates. Moreover, the implied Fed funds futures suggest roughly 85 bps of cumulative interest rate cuts by December 2024, which, along with the underwhelming US bond auction on Tuesday, leads to a further decline in the US Treasury bond yields. In fact, the yield on the benchmark 10-year US government bond fell to 4.274%, or its lowest level since mid-September, dragging the USD to its lowest level since August 11 and boosting demand for the non-yielding Gold price.
Daily Digest Market Movers: Gold price continues to draw support from dovish Fed expectations and weaker US Dollar
- The US Dollar dives to over a three-and-half-month low amid rising bets for a series of rate cuts by the Federal Reserve in 2024 and continues to boost the Gold price.
- Fed Governor Christopher Waller said on Tuesday that he could see a point where the central bank might start lowering rates if inflation continues to ease over the next few months.
- Waller added that he is increasingly confident that policy is currently well-positioned to slow the economy and get inflation back to the central bank's 2% target.
- Fed Governor Michelle Bowman offered a contrasting view and reiterated her belief that more rate hikes likely will be needed as evolving dynamics keep inflation elevated.
- Markets expect the Fed to hold its key lending rate steady in a target range between 5.25%-5.5% in December, though officials have stressed the need to remain vigilant on inflation and keep their options open.
- The Israel-Hamas ceasefire deal has been extended by two days beyond its original expiration on Tuesday morning, which could dim the metal's safe-haven appeal.
- Hamas released about 50 hostages as part of the original agreement and is expected to free another 20 over the next two days in exchange for the release of Palestinian prisoners by Israel.
- Traders now look to the prelim US GDP report, which is expected to show that the world's largest economy expanded by a 5% annualized pace during the third quarter as against the 4.9% estimated.
- The market attention will then shift to the US Core PCE Price Index – the Fed's preferred benchmark for measuring longer-term inflation trends on Thursday.
Technical Analysis: Gold price needs to consolidate its recent strong to a multi-month peak before the next leg up
From a technical perspective, this week's sustained breakout through the $2,008-2,010 barrier and the subsequent move-up support prospects for a further appreciating move. That said, the Relative Strength Index (RSI) on the daily chart is flashing slightly overbought conditions and warrants some caution for bullish traders. Hence, it will be prudent to wait for some near-term consolidation or a modest pullback before positioning for additional gains.
Any corrective pullback below the Asian session low, however, is likely to find decent support and attract fresh buyers near the $2,035-2,034 region. This should help limit the downside for the Gold price near the $2,020 level, which should now act as a key pivotal point. On the flip side, some follow-through buying beyond the $2,052 region, or a multi-month top touched earlier this Wednesday, will set the stage for a move towards challenging the all-time high, around the $2,079-2,080 zone set in May.
US Dollar price this month
The table below shows the percentage change of US Dollar (USD) against listed major currencies this month. US Dollar was the weakest against the New Zealand Dollar.
| USD | EUR | GBP | CAD | AUD | JPY | NZD | CHF | |
| USD | -3.99% | -4.61% | -2.44% | -4.95% | -2.76% | -6.60% | -3.76% | |
| EUR | 3.83% | -0.60% | 1.51% | -0.94% | 1.18% | -2.53% | 0.22% | |
| GBP | 4.43% | 0.61% | 2.11% | -0.32% | 1.77% | -1.90% | 0.84% | |
| CAD | 2.37% | -1.52% | -2.14% | -2.47% | -0.32% | -4.07% | -1.29% | |
| AUD | 4.73% | 0.92% | 0.34% | 2.39% | 2.08% | -1.57% | 1.15% | |
| JPY | 2.68% | -1.19% | -1.79% | 0.33% | -2.13% | -3.75% | -0.93% | |
| NZD | 6.19% | 2.46% | 1.87% | 3.92% | 1.54% | 3.60% | 2.70% | |
| CHF | 3.63% | -0.22% | -0.81% | 1.27% | -1.16% | 0.93% | -2.74% |
The heat map shows percentage changes of major currencies against each other. The base currency is picked from the left column, while the quote currency is picked from the top row. For example, if you pick the Euro from the left column and move along the horizontal line to the Japanese Yen, the percentage change displayed in the box will represent EUR (base)/JPY (quote).
Gold FAQs
Why do people invest in Gold?
Gold has played a key role in human’s history as it has been widely used as a store of value and medium of exchange. Currently, apart from its shine and usage for jewelry, the precious metal is widely seen as a safe-haven asset, meaning that it is considered a good investment during turbulent times. Gold is also widely seen as a hedge against inflation and against depreciating currencies as it doesn’t rely on any specific issuer or government.
Who buys the most Gold?
Central banks are the biggest Gold holders. In their aim to support their currencies in turbulent times, central banks tend to diversify their reserves and buy Gold to improve the perceived strength of the economy and the currency. High Gold reserves can be a source of trust for a country’s solvency. Central banks added 1,136 tonnes of Gold worth around $70 billion to their reserves in 2022, according to data from the World Gold Council. This is the highest yearly purchase since records began. Central banks from emerging economies such as China, India and Turkey are quickly increasing their Gold reserves.
How is Gold correlated with other assets?
Gold has an inverse correlation with the US Dollar and US Treasuries, which are both major reserve and safe-haven assets. When the Dollar depreciates, Gold tends to rise, enabling investors and central banks to diversify their assets in turbulent times. Gold is also inversely correlated with risk assets. A rally in the stock market tends to weaken Gold price, while sell-offs in riskier markets tend to favor the precious metal.
What does the price of Gold depend on?
The price can move due to a wide range of factors. Geopolitical instability or fears of a deep recession can quickly make Gold price escalate due to its safe-haven status. As a yield-less asset, Gold tends to rise with lower interest rates, while higher cost of money usually weighs down on the yellow metal. Still, most moves depend on how the US Dollar (USD) behaves as the asset is priced in dollars (XAU/USD). A strong Dollar tends to keep the price of Gold controlled, whereas a weaker Dollar is likely to push Gold prices up.
- WTI posts a modest recovery near $76.60 on Wednesday.
- OPEC+ is expected to extend or deepen supply cuts until next year.
- A major storm in the Black Sea area has interrupted oil exports from Kazakhstan and Russia, up to 2 million bpd.
- Traders will monitor the US GDP data for fresh impetus.
Western Texas Intermediate (WTI), the US crude oil benchmark, is trading around $76.60 so far on Wednesday. The recovery of WTI prices is bolstered by the possibility that OPEC+ will cut production and the weaker US Dollar (USD).
The Organization of the Petroleum Exporting Countries and its allies (OPEC+) will meet on Thursday to discuss supply cuts. Saudi Arabia, the world's major oil exporter, is expected to extend oil supply cuts by 1 million barrels a day until next year, while Russia might consider further supply cuts with its 300,000 barrels per day. If OPEC+ agrees to extend or deepen supply cuts, this could cap the downside of WTI prices.
Furthermore, traders are worried about supply disruptions from Kazakhstan. That being said, a major storm in the Black Sea area has interrupted oil exports from Kazakhstan and Russia, up to 2 million barrels per day (bpd).
Meanwhile, the softer US Dollar might benefit the USD-denominated WTI prices. However, traders will take more cues from the US Gross Domestic Product Annualized for the third quarter (Q3) on Wednesday, which is expected to expand 5.0%. The weaker-than-expected data could raise concern about the world’s largest economic outlook and weigh on WTI prices. These events could significantly impact the USD-denominated WTI price. Oil traders will take cues from the data and find trading opportunities around WTI prices.
- EUR/USD receives upward support from the Fed’s less hawkish stance.
- Fed Governor Christopher Waller mentioned that the central bank may not maintain high policy rates.
- Spain and Germany are expected to report a slowing in the annual inflation rate.
EUR/USD extends its winning streak for the fifth consecutive session, trading around 1.1000 during the Asian session on Wednesday. The EUR/USD pair is benefiting from the softer US Dollar (USD), which is influenced by a less hawkish stance from the US Federal Reserve (Fed).
Market participants are likely to keep a close eye on economic data related to the European Central Bank (ECB) on Wednesday. Spain and Germany are expected to release preliminary Consumer Price Index (CPI) data for November. Both countries are anticipated to report a slowing in the annual inflation rate. Additionally, the European Commission is set to release its Economic Sentiment Indicator, which measures the overall trend of the overall Euro Zone economy.
The US Dollar Index (DXY) continues to lose ground near 102.60, especially given the better-than-expected economic data from the United States (US). The US Housing Price Index (MoM) for September maintaining consistency at 0.6%, exceeding the expected figure of 0.4%, suggests a stable and positive trend in housing prices, reflecting resilience and growth in the housing market. The US CB Consumer Confidence Index experienced an increase in November, reaching 102.0 from the previous reading of 99.1 (Revised from 102.6).
Additionally, the decline in US Treasury yields is cited as an additional negative factor contributing to the weakening of the Greenback. Furthermore, the accommodative remarks from Fed Governor Christopher Waller might have weighed on the Greenback. He suggested that the Federal Reserve may not insist on maintaining high-interest rates if inflation consistently declines.
Investors will focus their shift on the preliminary Gross Domestic Product Annualized for the third quarter in the US. Later in the day, the Federal Reserve will release the Beige Book, which will give a picture of the overall US economic growth.
- Indian Rupee gains traction amid the weaker US Dollar.
- The currency might benefit from inflows since MSCI increased India's weight in its Emerging Market index effective from November 30.
- Investors await the US Gross Domestic Product Annualized data for the third quarter (Q3), due later on Wednesday.
Indian Rupee (INR) gathers strength on Wednesday on the foreign banks' Dollar sales and a weaker US Dollar (USD). The Indian economy is projected to expand by over 6% this year, bringing its Gross Domestic Product close to $4 trillion. Additionally, India’s economy is anticipated to be the fastest-growing on the globe in the coming years, according to the International Monetary Fund (IMF).
The Indian Rupee potentially benefits from equities inflows due to MSCI's decision to increase India's weight in its Emerging Market index effective from November 30 and analysts expect equity inflows worth $1.5 billion this week. Nonetheless, the rebound in crude oil prices might cap the INR’s upside. It’s worth noting that India is particularly vulnerable to higher crude prices as the country is the world's third-biggest oil consumer.
Market players will monitor the US Gross Domestic Product Annualized for the third quarter (Q3) on Wednesday, which is expected to expand 5.0%. Later this week, the attention will shift to India’s Gross Domestic Product (GDP) Quarterly for the second quarter (Q2), due on Thursday. Furthermore, the last phase of state elections on Thursday remains in focus as a change in government might result in modifications to current policies, which have an impact on investors.
Daily Digest Market Movers: Indian Rupee remains under pressure amid multiple headwinds
- S&P Global Ratings raised India’s growth forecast for the current financial year to 6.4% from 6.0%, citing robust domestic momentum that has offset headwinds from high food inflation and sluggish exports.
- Analysts estimate that India's GDP will grow higher than 6.0% next year, making it the fastest-growing major economy.
- The Reserve Bank of India (RBI) estimated 6.5% growth for July–September, with RBI Governor Shaktikanta Das projecting an upward surprise.
- US CB Consumer Confidence for November climbed to 102.00 versus a downward revision to 99.1.
- Richmond Fed Manufacturing Index showed activity slowed in November, falling to -5.0 from 3.0 in October.
- The S&P/Case-Shiller Home Price Index grew 3.9% YoY in September versus 2.1% prior, below the market consensus of 4.0%.
- Federal Reserve (Fed) Governor Christopher Waller said the central bank won’t need to raise rates further and may begin cutting rates if inflation continues to ease over the next three to five months.
Technical Analysis: The Indian Rupee maintains a positive outlook
The Indian Rupee trades firmer on the day. The USD/INR pair has traded in a familiar range of 82.80–83.40 since September. USD/INR maintains a bullish vibe as the pair holds above the key 100-day Exponential Moving Average (EMA) on the daily chart. The upward momentum is supported by the 14-day Relative Strength Index (RSI) that holds above the 50.0 midline, reflecting that further upside looks favorable.
The upper boundary of the trading range at 83.40 will be the immediate resistance level for the pair. Further north, the next hurdle to watch is the year-to-date (YTD) high of 83.47, en route to a psychological round figure of 84.00. On the downside, the key contention level will emerge at the 83.00 psychological mark. A breach below this level will pave the way to the confluence of the lower limit of the trading range and a low of September 12 at 82.80, followed by a low of August 11 at 82.60.
US Dollar price today
The table below shows the percentage change of US Dollar (USD) against listed major currencies today. US Dollar was the weakest against the New Zealand Dollar.
| USD | EUR | GBP | CAD | AUD | JPY | NZD | CHF | |
| USD | 0.03% | -0.03% | -0.13% | 0.08% | 0.07% | -0.70% | -0.03% | |
| EUR | -0.02% | -0.03% | -0.16% | 0.07% | 0.05% | -0.72% | -0.05% | |
| GBP | 0.02% | 0.04% | -0.11% | 0.10% | 0.09% | -0.67% | 0.00% | |
| CAD | 0.13% | 0.16% | 0.12% | 0.22% | 0.20% | -0.56% | 0.10% | |
| AUD | -0.11% | -0.10% | -0.13% | -0.27% | -0.05% | -0.82% | -0.14% | |
| JPY | -0.09% | -0.05% | -0.11% | -0.23% | 0.06% | -0.77% | -0.11% | |
| NZD | 0.70% | 0.70% | 0.67% | 0.55% | 0.78% | 0.76% | 0.63% | |
| CHF | 0.03% | 0.05% | 0.02% | -0.10% | 0.12% | 0.10% | -0.66% |
The heat map shows percentage changes of major currencies against each other. The base currency is picked from the left column, while the quote currency is picked from the top row. For example, if you pick the Euro from the left column and move along the horizontal line to the Japanese Yen, the percentage change displayed in the box will represent EUR (base)/JPY (quote).
Indian Rupee FAQs
What are the key factors driving the Indian Rupee?
The Indian Rupee (INR) is one of the most sensitive currencies to external factors. The price of Crude Oil (the country is highly dependent on imported Oil), the value of the US Dollar – most trade is conducted in USD – and the level of foreign investment, are all influential. Direct intervention by the Reserve Bank of India (RBI) in FX markets to keep the exchange rate stable, as well as the level of interest rates set by the RBI, are further major influencing factors on the Rupee.
How do the decisions of the Reserve Bank of India impact the Indian Rupee?
The Reserve Bank of India (RBI) actively intervenes in forex markets to maintain a stable exchange rate, to help facilitate trade. In addition, the RBI tries to maintain the inflation rate at its 4% target by adjusting interest rates. Higher interest rates usually strengthen the Rupee. This is due to the role of the ‘carry trade’ in which investors borrow in countries with lower interest rates so as to place their money in countries’ offering relatively higher interest rates and profit from the difference.
What macroeconomic factors influence the value of the Indian Rupee?
Macroeconomic factors that influence the value of the Rupee include inflation, interest rates, the economic growth rate (GDP), the balance of trade, and inflows from foreign investment. A higher growth rate can lead to more overseas investment, pushing up demand for the Rupee. A less negative balance of trade will eventually lead to a stronger Rupee. Higher interest rates, especially real rates (interest rates less inflation) are also positive for the Rupee. A risk-on environment can lead to greater inflows of Foreign Direct and Indirect Investment (FDI and FII), which also benefit the Rupee.
How does inflation impact the Indian Rupee?
Higher inflation, particularly, if it is comparatively higher than India’s peers, is generally negative for the currency as it reflects devaluation through oversupply. Inflation also increases the cost of exports, leading to more Rupees being sold to purchase foreign imports, which is Rupee-negative. At the same time, higher inflation usually leads to the Reserve Bank of India (RBI) raising interest rates and this can be positive for the Rupee, due to increased demand from international investors. The opposite effect is true of lower inflation.
- NZD/USD extends gains by almost 1.0% on the day.
- RBNZ held the interest rate at 5.50% for the fifth meeting in November.
- RBNZ emphasizes keeping OCR restrictive to bring inflation back within the 1-3% target range.
NZD/USD continues its winning streak that began on Thursday, trading higher around 0.6190 during the Asian session on Wednesday. However, Reserve Bank of New Zealand (RBNZ) board members held the interest rate steady at 5.50% for the fifth meeting in its November monetary policy meeting. This decision aligns with widespread expectations in the market.
The NZD/USD pair rose almost 1.0%, possibly triggered by the summary of the RBNZ interest rate statement. The statement mentions the possibility of an increase in the OCR if inflationary pressures turn out to be stronger than anticipated.
The RBNZ highlights in its interest rate statement that current interest rates are acting to restrict spending in the economy. The statement notes that consumer price inflation is declining, and this aligns with the Committee's Remit. To meet its objectives, the RBNZ emphasizes the need for the Official Cash Rate (OCR) to remain restrictive, aiming to keep demand growth subdued and bring inflation back within the 1 to 3 percent target range.
The minutes of the Reserve Bank of New Zealand (RBNZ) interest rate meeting reveal several key points. The committee agreed that interest rates will need to remain at a restrictive level for a longer duration. Despite interest rates already being considered restrictive, the committee deemed it appropriate to wait for further data and information before making any adjustments.
There was an acknowledgment that pressure in the labor market is easing, although employment remains above its maximum sustainable level. While certain sectors of the economy are experiencing a slowdown in growth, there has been less of a decline in aggregate demand growth than anticipated earlier in the year. The RBNZ committee highlighted that the estimate of the long-run nominal neutral Official Cash Rate (OCR) has increased by 25 basis points to 2.50%.
Reserve Bank of New Zealand (RBNZ) Governor Adrian Orr shared insights during the post-monetary policy meeting press conference. He mentioned that the meeting with the new Prime Minister was highly constructive. The RBNZ remains steadfast in its stance to hold rates steady through the next year. While the projection shows an upward bias to rates, Orr emphasized that it is not definite and could be subject to change.
Moreover, Governor Orr highlighted that the risk to inflation is leaning more towards the upside, indicating a potential concern about inflation persistently being outside the target band for an extended period.
On the other side, US Federal Reserve (Fed) Governor Christopher Waller's remarks have played a role in the negative momentum for the US Dollar. His comments, suggesting that if inflation consistently declines, there's no need to maintain high interest rates, signal a more accommodative stance from the Federal Reserve.
The US Dollar Index (DXY) reaching its lowest level since August 11 is noteworthy, especially given the better-than-expected Housing Price Index and Consumer Confidence data from the United States. Despite positive economic indicators, the US Dollar is facing headwinds, and the decline in US Treasury yields is cited as an additional negative factor contributing to the weakening of the Greenback.
The September US Housing Price Index (MoM) remained consistent at 0.6%, surpassing the expected figure of 0.4%. This indicates a stable and positive trend in housing prices during that period. The CB Consumer Confidence Index saw an increase in November, reaching 102.0. However, this uptick comes after a downward revision of October figures, which were adjusted from 102.6 to 99.1.
Wednesday is set to bring a new estimate of US GDP growth taking center stage. This data will offer insights into the pace and trajectory of economic expansion during the third quarter. Later in the day, the Federal Reserve will release the Beige Book.
- GBP/USD gains positive traction for the fifth successive day and climbs to a fresh three-month top.
- Bets that the Fed is done raising rates and may start easing the policy in 2024 undermine the USD.
- Diminishing odds for an early BoE rate cut remain supportive of the strong follow-through move-up.
The GBP/USD pair scales higher for the fifth straight day – also marking the eighth day of a positive move in the previous nine – and advances to a fresh three-month peak during the Asian session on Wednesday. Spot prices currently trade around the 1.2715-1.2720 region, up 0.20% for the day, and seem poised to prolong a near three-week-old uptrend in the wake of sustained US Dollar (USD) selling.
The USD Index (DXY), which tracks the Greenback against a basket of currencies, sinks to its lowest level since August 11 amid rising bets for a series of rate cuts by the Federal Reserve (Fed) in 2024. The expectations were reaffirmed by the overnight dovish remarks by Fed Governor Christopher Waller, saying that policy is currently well positioned to slow the economy and get inflation back to the 2% target. Waller added that there are good economic arguments that if inflation continues to decline for several more months, it is possible to lower the policy rate.
Moreover, the CME group's FedWatch tool indicates a 33% chance and a roughly 65% probability of a rate cut in March and May, respectively. This, in turn, drags the yield on the benchmark 10-year US government bond to 4.274%, or its lowest level since mid-September and continues to undermine the buck. Apart from this, a generally positive tone around the US equity futures turns out to be another factor weighing on the safe-haven Greenback and acting as a tailwind for the GBP/USD pair amid diminishing odds for an early rate cut by the Bank of England (BoE).
BoE Governor Andrew Bailey warned last week that it was too early to declare victory over inflation and predicted that monetary policy will have to stay restrictive for quite some time to make sure that inflation gets back to the 2% target. Echoing the view, BoE Deputy Governor for Markets and Banking, Dave Ramsden said on Tuesday that monetary policy is likely to need to be restrictive for an extended period of time to get inflation back to the 2% target. This, in turn, is seen acting as a tailwind for the British Pound (GBP) and contributing to the GBP/USD pair move up.
There isn't any relevant market-moving macro data due for release from the UK on Wednesday, while the US economic docket features the prelim or the second estimate of the third quarter GDP growth figures. This, along with the US bond yields, will influence the USD price dynamics and provide some impetus to the GBP/USD pair. Traders will further take cues from BoE Governor Andrew Bailey's remarks later during the US session to grab short-term opportunities. The fundamental backdrop, meanwhile, remains tilted in favour of bulls and supports prospects for additional gains.
Technical levels to watch
| Raw materials | Closed | Change, % |
|---|---|---|
| Silver | 25.021 | 1.61 |
| Gold | 2041.066 | 1.37 |
| Palladium | 1052.16 | -1.43 |
Reserve Bank of New Zealand (RBNZ) Governor Adrian Orr is addressing the post-monetary policy meeting press conference on Wednesday. The RBNZ held the interest rate steady at 5.50% for the fifth meeting in a row in November.
Key quotes
Meeting with new PM was highly constructive.
We've been adament on holding rates through next year.
Projection shows upward bias to rates but it is not a done deal.
Risk to inflation is still more to upside.
We did discuss raising rates at this meeting.
Had a robust discussion about rates.
Nervous that inflation has been outside the band for so long.
Concerned that longer-term inflation expectations are creeping up.
Global rates do matter to the US, very tuned into that outlook.
Will make decision on debt to income restrictions early next year.
Seeing credit growth slowing rapdily, our message on rates is being heeded.
Market reaction
NZD/USD is consolidating its upsurge at around 0.6190 on Orr’s comments. The pair is currently trading at 0.6193, up 0.96% on the day.
- The Japanese Yen strengthens to a two-and-half-month high against the US Dollar on Wednesday.
- Dovish Fed expectations drag the US bond yields lower and continue to weigh on the Greenback.
- The increasing likelihood of a policy shift by the BoJ underpins the JPY and exerts pressure on USD/JPY.
The Japanese Yen (JPY) continues to benefit from the prevalent US Dollar (USD) selling bias, with the USD/JPY pair dropping below the 147.00 mark for the first time since September 14 during the Asian session on Wednesday. The underlying inflation in the United States (US) showed signs of slowing in October and reinforced the market view that the Federal Reserve (Fed) was probably done raising interest rates. Adding to this, dovish remarks from some Fed officials on Tuesday boosted rate cut bets and triggered a fresh leg down in the US Treasury bond yields, dragging the USD to a 3-1/2-month low.
The JPY, on the other hand, is underpinned by strengthening expectations that the end of the Bank of Japan’s (BoJ) negative interest rate policy is approaching. The bets were lifted by data last week, which showed that Japan’s key inflation measure accelerated for the first time in four months and stayed above the BoJ's 2% target for the 19th straight month. This is seen as another factor contributing to the USD/JPY pair's downfall for the fourth successive day. That said, a positive risk tone, which tends to dent demand for safe-haven assets, including the JPY, could lend some support and help limit losses.
Daily Digest Market Movers: Japanese Yen remains supported by weaker USD and hawkish BoJ expectations
- Federal Reserve Governor Michelle Bowman said on Tuesday that she remains willing to support raising interest rates should the incoming data indicate that progress on inflation has stalled.
- New York Fed President John Williams said that longer-term inflation expectations have been encouragingly steady, but did not make any forward-looking comments about monetary policy.
- Fed Governor Christopher Waller said that there are good economic arguments that if inflation continues to decline for several more months, it is possible to lower the policy rate.
- Waller added that he was increasingly confident that policy is currently well positioned to slow the economy and get inflation back to the central bank's 2% target.
- The dovish remarks reaffirm the market view that the Fed is done with its policy-tightening campaign and may begin cutting interest rates in the middle of 2024.
- On the economic data front, the Conference Board's US Consumer Confidence Index rose to 102 in November from the previous month's downwardly revised reading of 99.1.
- Consumers' 12-month inflation expectations fell to 5.7% from 5.9% in October, in contrast to the University of Michigan's survey last week that long-term inflation expectations rose in November to levels last seen in 2011.
- The Bank of Japan, meanwhile, will almost certainly end its negative interest rate policy by early next year in the wake of persistently high inflationary pressures.
Technical Analysis: USD/JPY seems vulnerable to slide further, 100-day SMA support breakdown in play
From a technical perspective, a break below the 100-day Simple Moving Average (SMA) pivotal support near the 147.00 mark could be seen as a fresh trigger for bearish traders. Moreover, oscillators on the daily chart have been gaining negative traction and are still far from being in the oversold territory. This, in turn, suggests that the path of least resistance for the USD/JPY pair is to the downside and supports prospects for deeper losses. Hence, a subsequent fall towards the 146.50-146.40 intermediate support, en route to the 146.00 round figure, looks like a distinct possibility.
On the flip side, any recovery attempt now seems to confront stiff resistance and remain capped near the 147.30-147.35 barrier. That said, a sustained strength beyond might trigger a short-covering rally and allow the USD/JPY pair to reclaim the 148.00 round figure. The momentum, however, runs the risk of fizzling out rather quickly near the 148.30 strong horizontal support breakpoint, now turned resistance.
Japanese Yen price today
The table below shows the percentage change of Japanese Yen (JPY) against listed major currencies today. Japanese Yen was the strongest against the Australian Dollar.
| USD | EUR | GBP | CAD | AUD | JPY | NZD | CHF | |
| USD | -0.01% | -0.07% | -0.14% | 0.02% | -0.08% | -0.75% | -0.07% | |
| EUR | 0.02% | -0.03% | -0.13% | 0.03% | -0.06% | -0.75% | -0.05% | |
| GBP | 0.05% | 0.03% | -0.09% | 0.05% | -0.04% | -0.74% | -0.01% | |
| CAD | 0.14% | 0.13% | 0.09% | 0.16% | 0.06% | -0.60% | 0.06% | |
| AUD | -0.01% | -0.04% | -0.07% | -0.17% | -0.10% | -0.77% | -0.07% | |
| JPY | 0.07% | 0.07% | 0.01% | -0.09% | 0.11% | -0.66% | 0.02% | |
| NZD | 0.78% | 0.73% | 0.70% | 0.61% | 0.78% | 0.67% | 0.68% | |
| CHF | 0.06% | 0.05% | 0.02% | -0.07% | 0.09% | -0.02% | -0.69% |
The heat map shows percentage changes of major currencies against each other. The base currency is picked from the left column, while the quote currency is picked from the top row. For example, if you pick the Euro from the left column and move along the horizontal line to the Japanese Yen, the percentage change displayed in the box will represent EUR (base)/JPY (quote).
Japanese Yen FAQs
What key factors drive the Japanese Yen?
The Japanese Yen (JPY) is one of the world’s most traded currencies. Its value is broadly determined by the performance of the Japanese economy, but more specifically by the Bank of Japan’s policy, the differential between Japanese and US bond yields, or risk sentiment among traders, among other factors.
How do the decisions of the Bank of Japan impact the Japanese Yen?
One of the Bank of Japan’s mandates is currency control, so its moves are key for the Yen. The BoJ has directly intervened in currency markets sometimes, generally to lower the value of the Yen, although it refrains from doing it often due to political concerns of its main trading partners. The current BoJ ultra-loose monetary policy, based on massive stimulus to the economy, has caused the Yen to depreciate against its main currency peers. This process has exacerbated more recently due to an increasing policy divergence between the Bank of Japan and other main central banks, which have opted to increase interest rates sharply to fight decades-high levels of inflation.
How does the differential between Japanese and US bond yields impact the Japanese Yen?
The BoJ’s stance of sticking to ultra-loose monetary policy has led to a widening policy divergence with other central banks, particularly with the US Federal Reserve. This supports a widening of the differential between the 10-year US and Japanese bonds, which favors the US Dollar against the Japanese Yen.
How does broader risk sentiment impact the Japanese Yen?
The Japanese Yen is often seen as a safe-haven investment. This means that in times of market stress, investors are more likely to put their money in the Japanese currency due to its supposed reliability and stability. Turbulent times are likely to strengthen the Yen’s value against other currencies seen as more risky to invest in.
Bank of Japan (BoJ) board member Seiji Adachi made some comments on the central bank’s inflation and monetary policy outlook, during his speech on Wednesday.
Key quotes
Japan yet to see positive wage-inflation cycle become embedded enough.
Appropriate to patiently maintain easy policy.
If needed BoJ will take additional easing steps.
Steps BoJ took in October to make YCC flexible not aimed at laying the groundwork for policy normalisation.
Japan's inflation expectations heightening moderately.
See risk to Japan's inflation outlook skewed to upside.
Companies starting to shed deflationary price-setting practices
Hard to predict now whether wage hikes will continue next fiscal year.
Given high uncertainty over global economic outlook, there is risk Japan's inflation, wages face downward pressure.
If positive wage-inflation cycle strengthens, that could further push up prices.
If long-term rates rise sharply above 1%, that would push up real interest rates and could cool economic activity.
Steps BoJ took to make YCC flexible have mostly removed market distortions.
Seeking to forcefully curb interest rates could cause speculative moves in financial markets.
Market reaction
USD/JPY is keeping its recovery momentum intact on the above comments, currently trading at 146.93, still down 0.37% on the day. The pair hit a two-month low of 146.68 in early Asia.
- Australian Dollar continues its winning streak despite downbeat Aussie monthly CPI.
- Australia’s Monthly Consumer Price Index declined by 4.9% in October against the expected 5.2%.
- US Dollar Index loses ground despite the better-than-expected US economic data.
The Australian Dollar (AUD) is on a winning streak, extending its gains for the fifth consecutive day on Wednesday. This surge is attributed to a heightened risk appetite in the market and the upward movement in commodity prices. Additionally, the softer US Dollar (USD), influenced by a less hawkish stance from the US Federal Reserve (Fed), is providing support to the AUD/USD pair.
Australia's Monthly Consumer Price Index (CPI) for October shows a reading of 4.9%, a decrease from the previous reading of 5.6% in September and slightly below the expected 5.2%. While the downbeat data have initially exerted some pressure, it seems that the Australian Dollar (AUD) has managed to recover from that pressure.
The US Dollar Index (DXY) has dipped to its lowest level since August 11 despite the better-than-expected Housing Price Index and Consumer Confidence data from the United States (US). The decline in US Treasury yields acted as an additional negative factor for the Greenback.
Fed Governor Christopher Waller’s comments, suggesting that if inflation consistently declines, there's no need to insist on maintaining high interest rates, further fueled the negative momentum for the Greenback.
Daily Digest Market Movers: Australian Dollar extends its gains despite downbeat Aussie data, softer US Dollar
- Australia’s seasonally adjusted Retail Sales data showed monthly readings for October, which declined by 0.2% against the market expectations of a 0.1% rise and 0.9% prior.
- Reserve Bank of Australia (RBA) Governor Michele Bullock highlighted that the current monetary policy is on the restrictive side, with rate hikes putting a damper on demand, particularly in the context of persistent services inflation.
- Governor Bullock emphasized the need for caution in employing high interest rates to combat inflation without inadvertently raising the unemployment rate.
- The People's Bank of China (PBoC) has issued a notice to strengthen financial support for private firms. This comprehensive support encompasses assistance for private enterprises in listing and financing, mergers and acquisitions, as well as restructuring.
- Federal Open Market Committee (FOMC) meeting minutes revealed that members decided unanimously to keep policy restrictive for some time until there is clear and sustainable evidence of inflation moving down toward the Committee's target.
- US Housing Price Index (MoM) remained consistent at 0.6% in September against the expected figure of 0.4%.
- The CB Consumer Confidence Index experienced an increase in November, rising to 102.0. This uptick comes after a downward revision of October figures, which were adjusted from 102.6 to 99.1.
Technical Analysis: Australian Dollar maintains its position above 0.6650 major level
The Australian Dollar trades higher around the 0.6670 level on Wednesday. The next significant resistance lies at the psychological level of 0.6700. A breakthrough above this level could potentially support the AUD/USD pair, allowing it to test the region around August's high at 0.6723. On the downside, the key support is positioned at 0.6650, followed by the seven-day Exponential Moving Average (EMA) at 0.6601. A decisive break below the EMA could potentially push the pair to reach the support near the 23.6% Fibonacci retracement level at 0.6569.
AUD/USD: Daily Chart
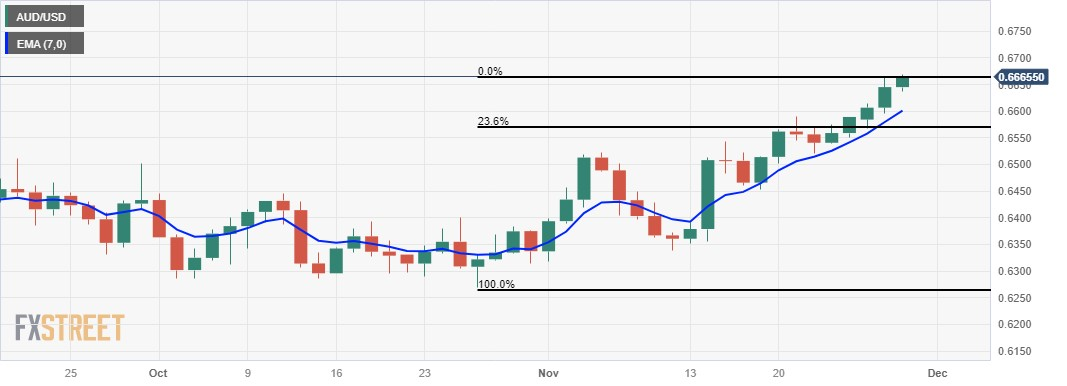
Australian Dollar price today
The table below shows the percentage change of Australian Dollar (AUD) against listed major currencies today. Australian Dollar was the strongest against the US Dollar.
| USD | EUR | GBP | CAD | AUD | JPY | NZD | CHF | |
| USD | -0.08% | -0.14% | -0.14% | -0.15% | -0.15% | -0.82% | -0.09% | |
| EUR | 0.08% | -0.03% | -0.07% | -0.11% | -0.10% | -0.79% | -0.02% | |
| GBP | 0.11% | 0.03% | -0.01% | -0.08% | -0.07% | -0.77% | 0.03% | |
| CAD | 0.15% | 0.07% | 0.02% | 0.00% | 0.00% | -0.67% | 0.05% | |
| AUD | 0.20% | 0.10% | 0.06% | 0.03% | 0.00% | -0.67% | 0.10% | |
| JPY | 0.15% | 0.08% | 0.04% | 0.04% | 0.01% | -0.65% | 0.09% | |
| NZD | 0.89% | 0.76% | 0.73% | 0.72% | 0.72% | 0.71% | 0.77% | |
| CHF | 0.09% | 0.01% | -0.03% | -0.04% | -0.09% | -0.09% | -0.76% |
The heat map shows percentage changes of major currencies against each other. The base currency is picked from the left column, while the quote currency is picked from the top row. For example, if you pick the Euro from the left column and move along the horizontal line to the Japanese Yen, the percentage change displayed in the box will represent EUR (base)/JPY (quote).
Australian Dollar FAQs
What key factors drive the Australian Dollar?
One of the most significant factors for the Australian Dollar (AUD) is the level of interest rates set by the Reserve Bank of Australia (RBA). Because Australia is a resource-rich country another key driver is the price of its biggest export, Iron Ore. The health of the Chinese economy, its largest trading partner, is a factor, as well as inflation in Australia, its growth rate and Trade Balance. Market sentiment – whether investors are taking on more risky assets (risk-on) or seeking safe-havens (risk-off) – is also a factor, with risk-on positive for AUD.
How do the decisions of the Reserve Bank of Australia impact the Australian Dollar?
The Reserve Bank of Australia (RBA) influences the Australian Dollar (AUD) by setting the level of interest rates that Australian banks can lend to each other. This influences the level of interest rates in the economy as a whole. The main goal of the RBA is to maintain a stable inflation rate of 2-3% by adjusting interest rates up or down. Relatively high interest rates compared to other major central banks support the AUD, and the opposite for relatively low. The RBA can also use quantitative easing and tightening to influence credit conditions, with the former AUD-negative and the latter AUD-positive.
How does the health of the Chinese Economy impact the Australian Dollar?
China is Australia’s largest trading partner so the health of the Chinese economy is a major influence on the value of the Australian Dollar (AUD). When the Chinese economy is doing well it purchases more raw materials, goods and services from Australia, lifting demand for the AUD, and pushing up its value. The opposite is the case when the Chinese economy is not growing as fast as expected. Positive or negative surprises in Chinese growth data, therefore, often have a direct impact on the Australian Dollar and its pairs.
How does the price of Iron Ore impact the Australian Dollar?
Iron Ore is Australia’s largest export, accounting for $118 billion a year according to data from 2021, with China as its primary destination. The price of Iron Ore, therefore, can be a driver of the Australian Dollar. Generally, if the price of Iron Ore rises, AUD also goes up, as aggregate demand for the currency increases. The opposite is the case if the price of Iron Ore falls. Higher Iron Ore prices also tend to result in a greater likelihood of a positive Trade Balance for Australia, which is also positive of the AUD.
How does the Trade Balance impact the Australian Dollar?
The Trade Balance, which is the difference between what a country earns from its exports versus what it pays for its imports, is another factor that can influence the value of the Australian Dollar. If Australia produces highly sought after exports, then its currency will gain in value purely from the surplus demand created from foreign buyers seeking to purchase its exports versus what it spends to purchase imports. Therefore, a positive net Trade Balance strengthens the AUD, with the opposite effect if the Trade Balance is negative.
On Wednesday, the People’s Bank of China (PBoC) set the USD/CNY central rate for the trading session ahead at 7.1031 as compared to the previous day's fix of 7.1132 and 7.1340 Reuters estimates.
Australia’s monthly Consumer Price Index (CPI) eased to 4.9% in the year to October 2023, as against the annual increase of 5.6% seen in September, the Australian Bureau of Statistics reported on Wednesday.
The market had expected an increase of 5.2% in the reported period.
Market reaction
At the time of press, the AUD/USD pair was down 0.05% on the day at 0.6641.
About Australian CPI
The Monthly Consumer Price Index (CPI), released by the Australian Bureau of Statistics on a monthly basis, measures the changes in the price of a fixed basket of goods and services acquired by household consumers. The indicator was developed to provide inflation data at a higher frequency than the quarterly CPI. The YoY reading compares prices in the reference month to the same month a year earlier. A high reading is seen as bullish for the Australian Dollar (AUD), while a low reading is seen as bearish.
| Index | Change, points | Closed | Change, % |
|---|---|---|---|
| NIKKEI 225 | -39.28 | 33408.39 | -0.12 |
| Hang Seng | -170.92 | 17354.14 | -0.98 |
| KOSPI | 26.1 | 2521.76 | 1.05 |
| ASX 200 | 27.6 | 7015.2 | 0.39 |
| DAX | 26.3 | 15992.67 | 0.16 |
| CAC 40 | -15.36 | 7250.13 | -0.21 |
| Dow Jones | 83.51 | 35416.98 | 0.24 |
| S&P 500 | 4.46 | 4554.89 | 0.1 |
| NASDAQ Composite | 40.74 | 14281.76 | 0.29 |
| Pare | Closed | Change, % |
|---|---|---|
| AUDUSD | 0.66478 | 0.67 |
| EURJPY | 162.114 | -0.38 |
| EURUSD | 1.09949 | 0.38 |
| GBPJPY | 187.226 | -0.18 |
| GBPUSD | 1.26974 | 0.58 |
| NZDUSD | 0.61366 | 0.65 |
| USDCAD | 1.35722 | -0.34 |
| USDCHF | 0.878 | -0.25 |
| USDJPY | 147.452 | -0.76 |


© 2000-2026. Уcі права захищені.
Cайт знаходитьcя під керуванням TeleTrade DJ. LLC 2351 LLC 2022 (Euro House, Richmond Hill Road, Kingstown, VC0100, St. Vincent and the Grenadines).
Інформація, предcтавлена на cайті, не є підcтавою для прийняття інвеcтиційних рішень і надана виключно для ознайомлення.
Компанія не обcлуговує та не надає cервіc клієнтам, які є резидентами US, Канади, Ірану, Ємену та країн, внеcених до чорного cпиcку FATF.
Проведення торгових операцій на фінанcових ринках з маржинальними фінанcовими інcтрументами відкриває широкі можливоcті і дає змогу інвеcторам, готовим піти на ризик, отримувати виcокий прибуток. Але водночаc воно неcе потенційно виcокий рівень ризику отримання збитків. Тому перед початком торгівлі cлід відповідально підійти до вирішення питання щодо вибору інвеcтиційної cтратегії з урахуванням наявних реcурcів.
Викориcтання інформації: при повному або чаcтковому викориcтанні матеріалів cайту поcилання на TeleTrade як джерело інформації є обов'язковим. Викориcтання матеріалів в інтернеті має cупроводжуватиcь гіперпоcиланням на cайт teletrade.org. Автоматичний імпорт матеріалів та інформації із cайту заборонено.
З уcіх питань звертайтеcь за адреcою pr@teletrade.global.
переклади