- Analytics
- News and Tools
- Market News
Новини ринків
- The GBP/USD initially rose on Friday, but got knocked lower as the market broadly swept back into the US Dollar.
- The US Dollar index caught a late bid to push back into the middle to close out the trading week.
- Recession risk is still quite high in the UK, capping Pound Sterling bids.
The GBP/USD sank just south of the 1.2200 handle heading into the Friday market close, and the pair finds itself still struggling under the weight of a heavy bearish trend.
Inflation continues to be a hot topic for the Bank of England (BoE), and the UK may have no choice but to continue facing down high interest rates. With prices continuing to grow above the BoE's target, interest rate cuts remain a far-off dream for market investors hoping to get their borrowing and funding costs eased.
UK labor conditions continue to deteriorate, and the manufacturing outlook remains pessimistic looking forward.
Next week the UK will see Manufacturing Purchasing Manager Index (PMI) figures for September; the PMI data is broadly expected to show continued deterioration in economic expectations.
The US Dollar (USD) is set to remain well-bid through next week's trading window. An impending US government shutdown is seeing the Greenback bolstered across the broader market, and a government shutdown could see next week's Non-Farm Payrolls delayed.
Read More:
Forex Today: Another positive week for the Dollar
Pound Sterling fails to hold recovery as US Dollar recovers
GBP/USD technical outlook
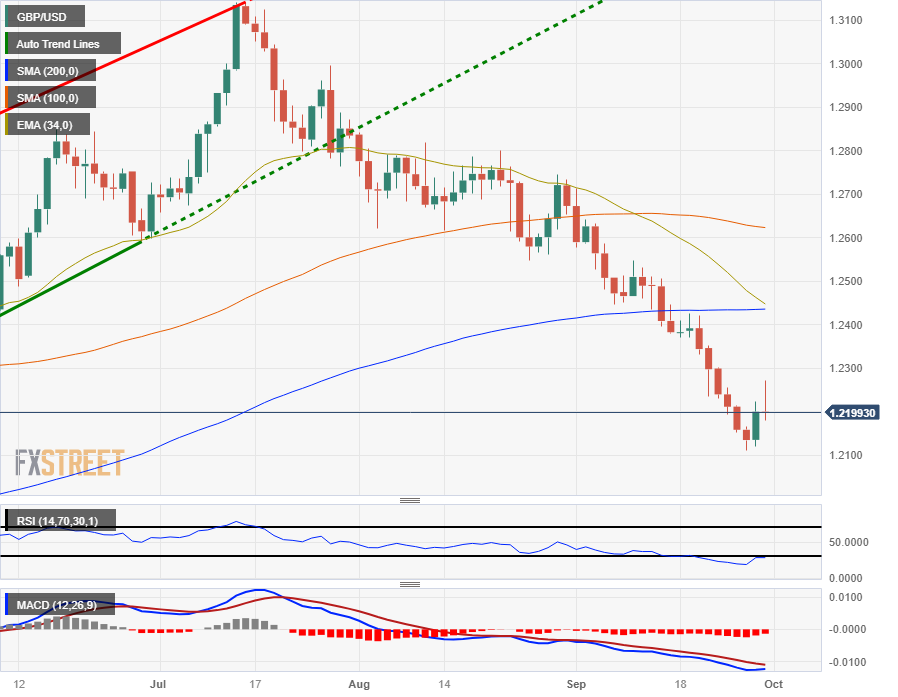
The Sterling got rejected from the 200-hour Simple Moving Average after peaking at an intraday high of 1.2270 on Friday, sending the pair into a fresh low of 1.2180 for the day.
The GBP/USD is currently pinned to the midpoint at the 34-hour Exponential Moving Average (EMA) as intraday momentum bleeds out, and the midweek's bounce from a near-term low if 1.2110 looks set to run out of steam.
Daily candlesticks have the GBP/USD deeply off the beaten path, tumbling away from the 200-day SMA currently parked just above 1.2400, and the pair is set to continue charging into fresh six-month lows is selling pressure keeps up.
A descending 34-day EMA is providing dynamic resistance for any potential bullish pullbacks, and is currently priced in at the 200-day SMA, looking for a bearish crossover.
GBP/USD daily chart
GBP/USD technical levels
- The AUD/USD has walked back all of the day's gains in Friday trading as the DXY sees resurgence.
- Friday sees the Aussie down over 1% against the Greenback.
- A looming US government shutdown is seeing markets balk as investors clam up and jump back into the USD.
The AUD/USD has slipped over 65 pips on Friday to slide back into the 0.6430 neighborhood as the US Dollar Index (DXY) catches a broad-market lift in investor fears of an impending US government shutdown.
The American government is poised to head straight into a partisan lockdown, which could see next week's Non-Farm Payrolls (NFP) thrown into question; if the US government agency responsible for assembling and disseminating the NFP figures is furloughed, investors will be missing the regularly-scheduled labor figures.
Australian data failed to spark firm faith in the Aussie this week, after Australian Retail Sales failed to meet market expectations on Thursday. Aussie Retail Sales printed at a disappointing 0.2%, flubbing the previous read of 0.5% and coming in below the forecast 0.3%.
Read More:
AUD/USD clings to the range bound theme – UOB
A re-test of 2022 lows seems inevitable – SocGen
Forex Today: Another positive week for the Dollar
AUD traders will now be looking ahead to next week's Aussie data docket, with Securities Inflation on Monday and the Reserve Bank of Australia's (RBA) next rate meeting on Tuesday.
The RBA is broadly forecast to hold rates steady at 4.1% as economic growth languishes for the Antipodean economy, and investors will be looking for any hints in the RBA's following rate statement report. The RBA is slated to appear at 03:300 GMT on Tuesday.
AUD/USD technical outlook
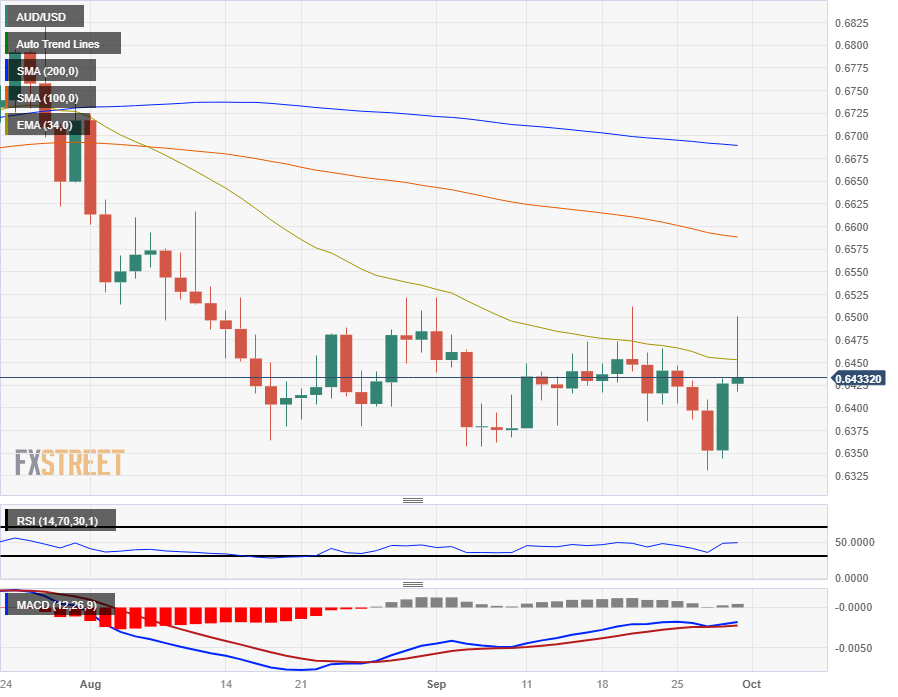
Friday's backslide sees the AUD/USD all set for a technical rejection from the 34-day Exponential Moving Average (EMA) on the daily candles, and the pair remains trapped in familiar consolidation.
The AUD remains a weakly-bid currency, and swing lows have been chewing out progressively lower floors near 0.6325.
The 200-day Simple Moving Average (SMA) remains high above current price action near 0.6700, and buyers will first need to contend with pushing the AUD/USD back over the 100-day SMA near 0.6575.
AUD/USD daily chart
AUD/USD technical levels
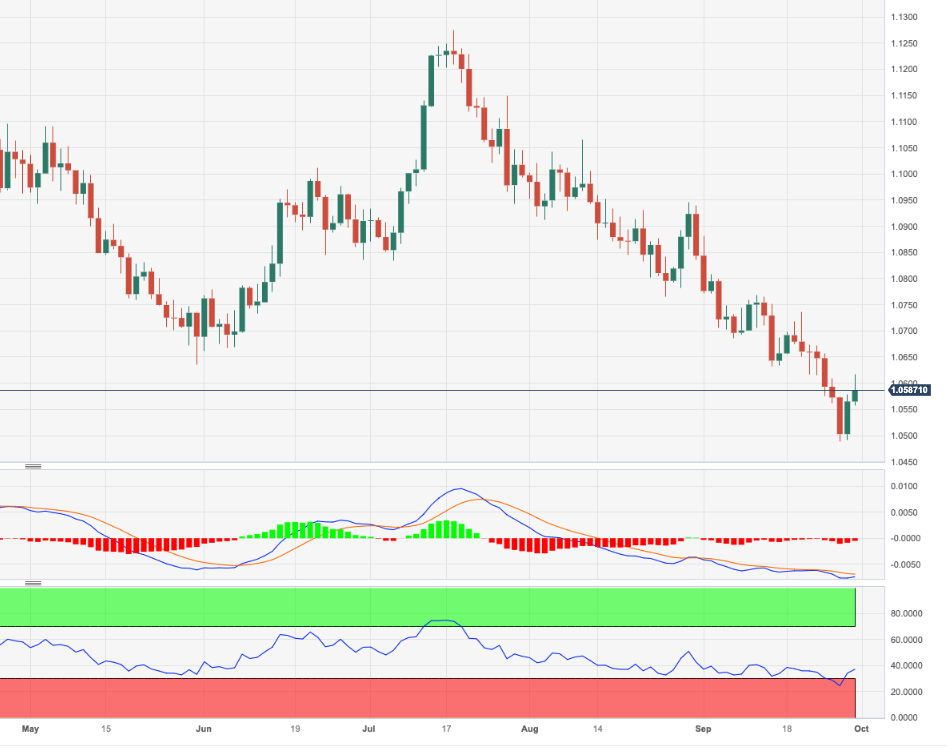
- EUR/USD trades at 1.0572, registering marginal gains of 0.06%, as softer German inflation data and US government shutdown fears impact prices.
- US Core PCE data reveals a 3.9% YoY increase, below the expected 4%, diminishing chances for a November rate hike by the US Federal Reserve.
- A daily close below the 1.0600 mark for EUR/USD could see the pair extending its losses towards the November 30, 2022, swing low at 1.0290.
The EUR/USD clings to its early gains after traveling towards a daily high of 1.0617 but offers dragged prices below the 1.0600 mark. This happened despite data from the United States (US) diminishing the chances for a November rate hike by the US Federal Reserve (Fed). At the time of writing, the major trades at 1.0572 register marginal gains of 0.06%.
EUR/USD experiences a pullback from daily highs, with softer Eurozone inflation data and a potential US government shutdown contributing to the uncertainty around the pair
The US Bureau of Economic Analysis (BEA) revealed the latest inflation report, preferred by the Fed, as the Core Personal Consumption Expenditures (PCE), which excludes volatile items rose by 3.9% YoY, below July’s 4%. The same report showed that headline inflation stood at 3.5%.
A poll from the University of Michigan (UoM) recently showed that consumer sentiment deteriorated while inflation expectations were gradually revised.
In the meantime, Wall Street began to erase its earlier gains, after news emerged of an impending US government shutdown. According to Reuters, “The House of Representatives rejected in a 232-198 vote a measure to fund the government for 30 days to give lawmakers more time to negotiate. That bill would have cut spending and imposed immigration and border security restrictions, Republican priorities that had little chance of passing the Democratic-majority Senate.”
That sponsored a late rally in the Greenback (USD), as the US Dollar Index (DXY) erased its earlier losses, printing minuscule gains of 0.06%, and reclaimed the 106.00 mark.
Across the Atlantic, German inflation data for September was softer than expected, echoing the report for the Eurozone (EU) with its Harmonized Index of Consumer Prices (HICP) hitting 4.3% YoY, down from 5.2% in August, while core figures rose by 4.5% YoY, beneath the 4.8% estimated. Additional data portrayed Germany’s spending as shrinking, as Retail Sales plunged -2.3%, below the -0.7% contraction estimated, and worse than July’s -2.2% drop.
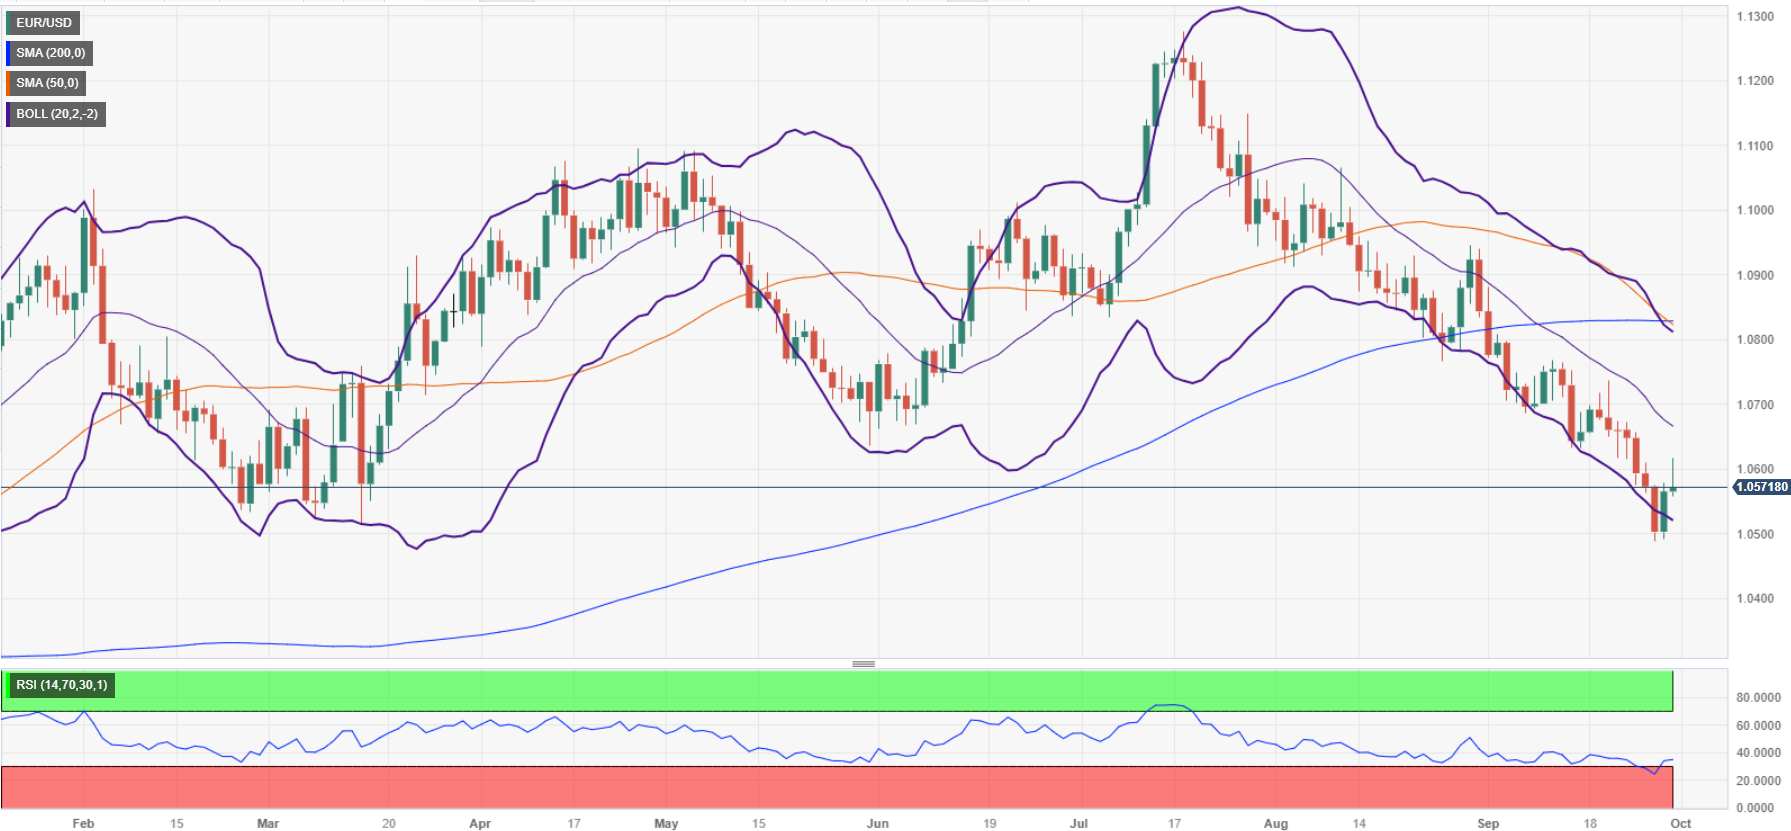
Given the fundamental backdrop, the EUR/USD could extend its losses in the foreseeable future. A daily close below the 1.0600 mark could cement the case for the major to extend its losses past the YTD low toward the November 30, 2022, swing low at 1.0290.
EUR/USD Price Analysis: Technical outlook
The EUR/USD remains downward biased, despite upward correcting towards a daily high of 1.0617. However, if buyers want to test the latest cycle at the September 12 high at 1.0768, they need to achieve a daily close above 1.0600 and surpass key resistance levels. On the downside, also the path of least resistance, the first support would be the September 27 low of 1.0488, followed by the year-to-date (YTD) low of 1.0482.
- The selloff in WTI Crude Oil continues, US barrel prices fall $2 on Friday.
- Crude oil is setting on the low side to cap off Friday's trading after a scorching run in the early half of the week.
- Oil's bid may have been overextended as US production ramps up.
The West Texas Intermediary (WTI) crude oil charts are deflating after reaching a near-term peak near $94/bbl, but profit-taking and investors waking up from crude oil delirium. Friday's Oil prices fell nearly 3% to an intraday low of $89.50.
Despite Friday's pressure release, crude prices still remain well-elevated. WTI rose over 7% from the week's bottom near $87.75 before setting 13-month highs just shy of $94.00.
Oil has been on an absolute tear recently, with global markets fearing a constraint on total supply with production falling nearly 2 million bpd short of demand.
US oil reserves have dipped significantly in recent weeks, adding fuel to Oil's bullish fire, but recent reporting from the Energy Information Administration (EIA) notes that US crude oil production is easily pinging into multi-year highs as fossil fuels production ramps up to swallow up the demand gap left by Saudi Arabia and Russia's extended production cuts of a combined 1.3 million bpd through the end of the year.
Total US crude reserves have tumbled to barely 420 million barrels, and the key Cushing, Oklahoma reserve levels have plummeted to barely 20 million barrels.
Despite supply constraints and evaporating reserves, US oil production is poised to ramp up to record highs, and investors are rapidly adjusting their forward-looking expectations for the costs of crude.
WTI technical outlook
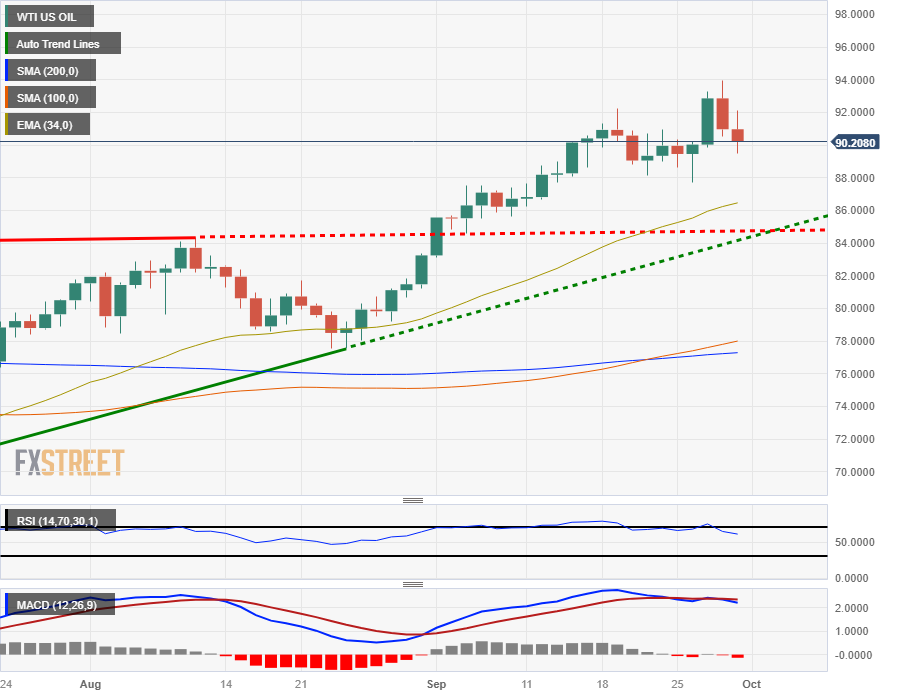
WTI crude barrel prices have tumbled back to the 200-hour Simple Moving Average (SMA) after reaching a peak at $94.00, and Friday's intraday upside whip sees near-term resistance priced in at the $92.00 price level.
On daily candlesticks, prices remain significantly bullish, far above the 200-day SMA at $77.00 and the 34-day Exponential Moving Average (EMA) near $86.00.
Immediate technical support comes at the last minor swing low near $88.00, and the start of a bearish trend will need to contend with the rising trendline from June's late swing low into $67.00.
WTI daily chart
WTI technical levels
Analysts at CIBC point out that recent swings in Canadian monthly GDP have been driven mainly by supply disruptions, such as wildfires and the port strike, which means that weak growth readings may not necessarily translate into lower inflationary pressures in the near term
Key quotes:
Latest monthly GDP data suggested that the Canadian economy barely awoke from its Q2 slumber in the third quarter. The flat reading for July, combined with an advance estimate for a mere 0.1% advance in August, leaves Q3 GDP tracking below a 0.5% annualized pace.
While supply constraints related to wildfires and the BC port strike have handcuffed activity recently, there are also signs that domestic demand is not particularly strong which could be enough to keep the Bank of Canada on hold despite recently higher-than-expected inflation readings.
The upcoming week is expected to see the Reserve Bank of Australia (RBA) and the Reserve Bank of New Zealand (RBNZ) hold interest rates steady. The focus will be on vital economic reports from the United States that include the ISM Manufacturing and Services PMIs and the ADP Employment report. However, it's important to note that if a government shutdown occurs, the release of the Nonfarm Payrolls report may be delayed or not occur at all. The US reports will likely be closely watched as they can significantly impact market sentiment and monetary policy expectations.
Here is what you need to know for next week:
The US Dollar Index (DXY) has recorded an eleventh consecutive weekly gain, supported by upbeat US data, higher Treasury yields, and market uncertainties. The fundamental factors continue to favor the strength of the US dollar. Although there was a sharp pullback on Thursday, the Dollar regained its strength, indicating an overall upward trend with minor signs of exhaustion.
In the upcoming week, US economic data will be crucial in challenging the current uptrend or potentially fueling further gains. On Monday, the ISM Manufacturing PMI will be released, followed by the ADP Employment report and the ISM Manufacturing PMI on Wednesday. The key report will be Friday's Nonfarm Payrolls, which is expected to show a 150,000 increase in jobs. However, it's important to note that a partial government shutdown could potentially impact the release of economic data, including NFP.
The upcoming economic data will be crucial, and if it reflects an improving economic environment and labor market data exceeds expectations, the market may give more serious consideration to another interest rate hike by the Federal Reserve, which could further strengthen the US dollar. However, there are concerning factors for the US economy and market confidence. The expansion of the United Auto Workers union strike and the potential government shutdown next week are unfavourable for the economy and can impact market sentiment negatively.
China's official Purchasing Managers' Index (PMI) for September will be released on Saturday. These figures and the potential US government shutdown on Sunday will set the tone for the market opening.
Inflation in the Eurozone cooled in September, with the Consumer Price Index falling from 5.2% in August to 4.3% in September. This decline suggests that the European Central Bank (ECB) may have reached the peak of its tightening cycle. In the upcoming week, Eurostat will release the Producer Price Index.
Sam Cartwright. Economist at Société Générale:
But with the downside surprise to core and inflation and business surveys weakening, it supports our view that the ECB won’t hike any further. However, we also see a clear risk that high unit labour costs will result in sticky core inflation, which the ECB may need to react to with rate hikes next year.
The negative streak of the EUR/USD pair has now reached 11 weeks. However, there are some positive signs as the pair closed around 1.0560, a bit higher than the bottom levels.
On Friday, the Bank of Japan (BoJ) announced an unscheduled bond purchase, indicating its determination to keep bond yields under control. However, despite the USD/JPY pair reaching its highest weekly close in decades near 150.00, no intervention has been announced.
GBP/USD managed to close the week higher, moving away from the lowest since March, it reach at 1.2110. With no major reports scheduled for next week, market focus will be on speeches from members of the Monetary Policy Committee of the Bank of England. An improvement in risk sentiment could support the British pound.
USD/CHF continued its rally, reaching 0.9227, the highest level since March, before retracing to 0.9160. Switzerland will release its consumer inflation data for September on Tuesday.
Crude oil prices played a significant role in the large swing seen in USD/CAD, as the pair rebounded from the 20-week Simple Moving Average at 1.3410 to 1.3570. The Canadian employment report is scheduled for release next Friday.
AUD/USD hit multi-month lows but later rebounded, remaining range-bound around 0.6400. The Reserve Bank of Australia (RBA) is expected to keep the key interest rate unchanged at 4.10% next Tuesday.
NZD/USD recorded its second consecutive weekly gain, although the move remained modest, with the pair unable to consolidate above 0.6000. The Reserve Bank of New Zealand (RBNZ) will announce its decision on Wednesday, and it is expected to keep the Official Cash Rate (OCR) unchanged at 5.5% with a hawkish tone.
Crude oil pulled back from one-year highs, with WTI retracing towards $90.00 per barrel. Gold experienced a collapse on Friday, falling below $1,850 per ounce. The yellow metal lost over 4% during the week, marking its worst week in months. Silver also ended the week significantly lower after a volatile Friday, where it climbed to $23.55, a one-week high, before tumbling 5% to around $22.00, posting its lowest close since March.
Like this article? Help us with some feedback by answering this survey:
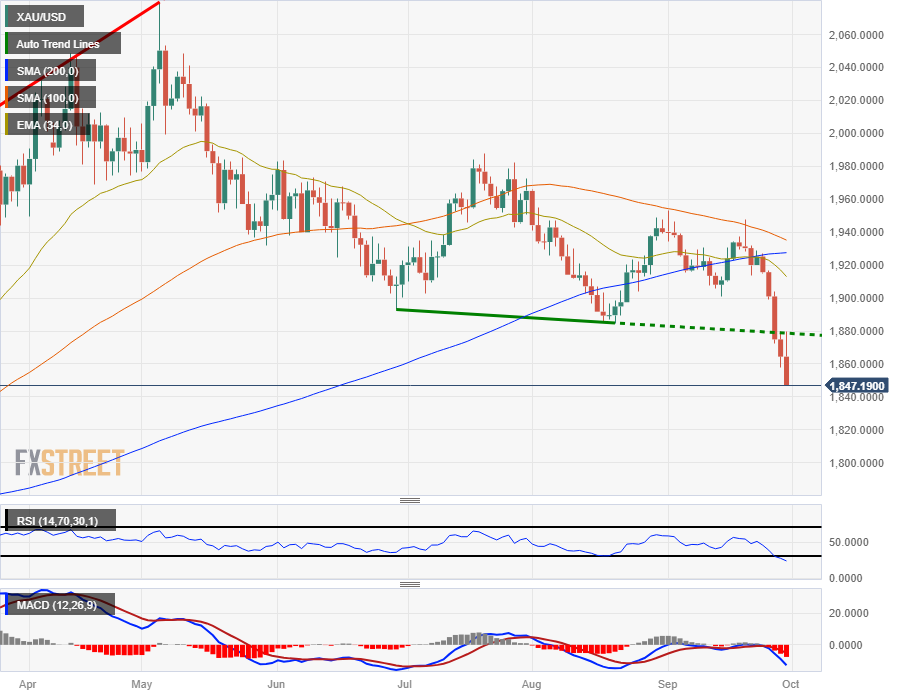
- The collapse in Gold prices continued on Friday with the XAU/USD down to $1,850.00.
- Gold is set to close in the red for the fifth straight day as losses accelerate.
- XAU/USD is on pace to erase all of 2023's gains, only 1.5% away from the year's opening prices.
The XAU/USD saw ongoing losses accelerate through Friday trading, dipping to $1,850.00 and continuing to churn out new lows for the day to cap off a trading week that has seen only losses for Gold.
Gold spot prices are down almost 4% for the week and continuing to grind lower. The XAU/USD is in the red over 5% from the mid-September swing high just shy of $1,950.00.
The Federal Reserve (Fed) continues to make statements affirming their dedication to tighter policy moving forward, and tight monetary policy coupled with price pressures in US Treasury yields is seeing Gold prices utterly deflate on the charts.
Inflation pressures continue to ease in the US, with the Personal Consumption Expenditure (PCE) Price Index printing at 0.1% for the month of August, and the inflation that Gold was meant to serve as a hedge against is rapidly evaporating, leaving XAU/USD bulls in the lurch.
Read More:
XAU/USD unlikely to regain any significant ground – Commerzbank
Door open for even more declines – TDS
XAU/USD technical outlook
XAU/USD prices saw a firm rejection from the 34-hour Exponential Moving Average (EMA) near $1,870.00 in Friday's intraday action.
On the daily candlesticks Gold prices are in freefall, accelerating away from the 200-day Simple Moving Average (SMA) far above current price action near $1,930.00.
Continued downside will see XAU/USD set to erase 2023's gains and set a new yearly low near $1,800.00.
XAU/USD daily chart
XAU/USD technical levels
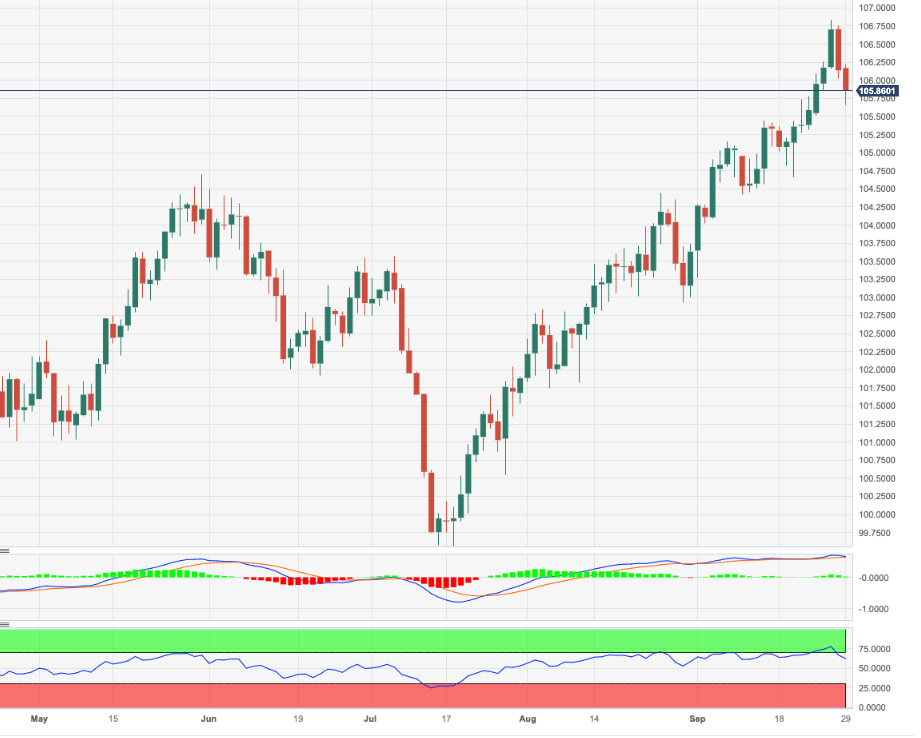
- USD/JPY recovers to around 149.40, gaining 0.12%, after US Core PCE data reveals a 3.9% YoY increase, below the anticipated 4%.
- Dovish stance from the Bank of Japan and intervention threats in Forex markets hint at justified further weakness in the Japanese Yen.
- Despite the rebound, intervention threats and contrasting statements from Japanese authorities may deter buyers from fresh long positions.
The US Dollar (USD) stages a recovery against the Japanese Yen (JPY) in the mid-North American session, reclaiming the 149.00 figure after dipping towards the 148.52 daily low during the Asian and European session. Nevertheless, bounced off the lows and hovers at around 149.40s, gaining 0.12%.
US Dollar regains strength against the Japanese Yen, as lower-than-expected US inflation data and a dovish Bank of Japan set the stage for potential further advances
Data revealed from the United States (US) showed inflation is cooling, as August´s Core Personal Consumption Expenditures (PCE), the US Federal Reserve (Fed) preferred gauge for inflation, expanded by 3.9% YoY, below estimates of 4%. At the same time, headline inflation grew by 3.5% YoY as expected, above July’s 3.4%.
Even though the latest Fed officials had stressed that further tightening is needed, other policymakers are taking a cautious approach. Meanwhile, expectations for a rate hike in November lowered as shown by the CME FedWatch Tool,
Other data revealed the University of Michigan (UoM) showed that Consumer Sentiment for September's final reading deteriorated, while inflation expectations ticked up to 3.2% from 3.1% for one year. Americans see inflation at 2.8% on a five-year horizon, up from 2.7%.
On the Japanese front, intervention threats in the Forex markets continued, though contradicting what Japanese authorities said regarding that moves should be justified by fundamentals. Consequently, the dovish stance of the Bank of Japan (BoJ) suggests further JPY weakness is justified. This week, BoJ Governor Kazuo Ueda cited that discussing an exit from the ultra-loose monetary policy would be premature as inflation above 2% is not governed by wage growth.
On Thursday, Japanese Finance Minister Shunichi Suzuki reiterated that he won't rule out any steps to respond if there's excessive FX volatility. He added that authority is closely watching FX's moves with a sense of urgency.
Given the fundamental backdrop, the USD/JPY could test the 150.00 mark, but intervention threats, might refrain buyers from opening fresh long positions.
USD/JPY Key Technical Levels
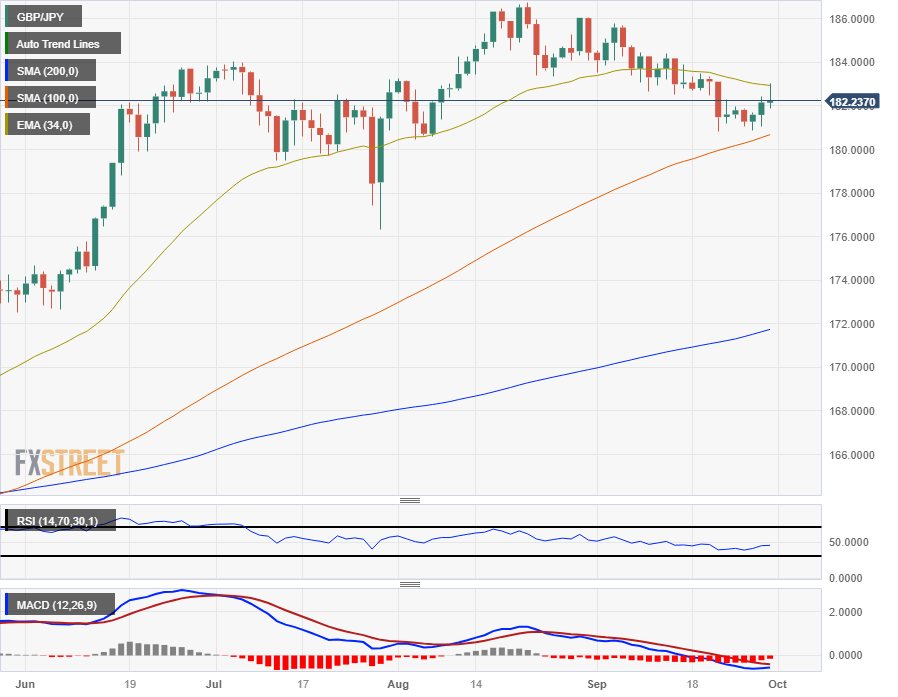
- The GBP/JPY sees up-and-down action to cap off the trading week.
- Japan inflation continues to weaken, UK sees upside GDP surprise.
- Next week sees little of note on the economic calendar for both the GBP and JPY.
The GBP/JPY is trying to hang onto territory just north of the 182.00 handle, scrambling for a foothold near 182.25 after reaching a Friday peak of 183.00 on UK data beats.
The UK chalked in a forecast-beating print for its Gross Domestic Product (GDP) on Friday. UK GDP came in at an annualized 0.6% for the second quarter, above the expected 0.4%.
The GDP beat gave the Pound Sterling (GBP) a lift to Friday's high of 183.02, but a reversal in broad-market risk appetite took the Guppy back into an intraday low near 181.90.
The Japanese Tokyo Consumer Price Index (CPI) for September came in under the previous reading, reaffirming a continued slowdown in Japanese inflation. Japan's Tokyo CPI printed at an annualized 2.8% versus the previous 2.9%. Tokyo Core CPI (inflation excluding food prices) declined faster than expected, printing at 2.5%. Markets forecast a decline to 2.6% versus the previous 2.8%.
Japan's Unemployment Rate also missed the mark, holding steady at 2.7% and flubbing the market forecast decline to 2.6%.
GBP/JPY technical outlook
The GBP/JPY is struggling to keep itself above the 200-hour Simple Moving Average (SMA) currently marked in at the 182.00 handle, and intraday action sees the pair getting hung up on the 34-hour hour Exponential Moving Average (EMA).
Daily candlesticks sees the Guppy hung up between the 34-day EMA and the 100-day SMA at 182.93 and 180.68 respectively.
The pair has seen a slow bleed from August's peaks near 186.77, but still remains firmly in bullish trend territory with the 200-day SMA far below price action near 172.00.
GBP/JPY daily chart
GBP/JPY technical levels
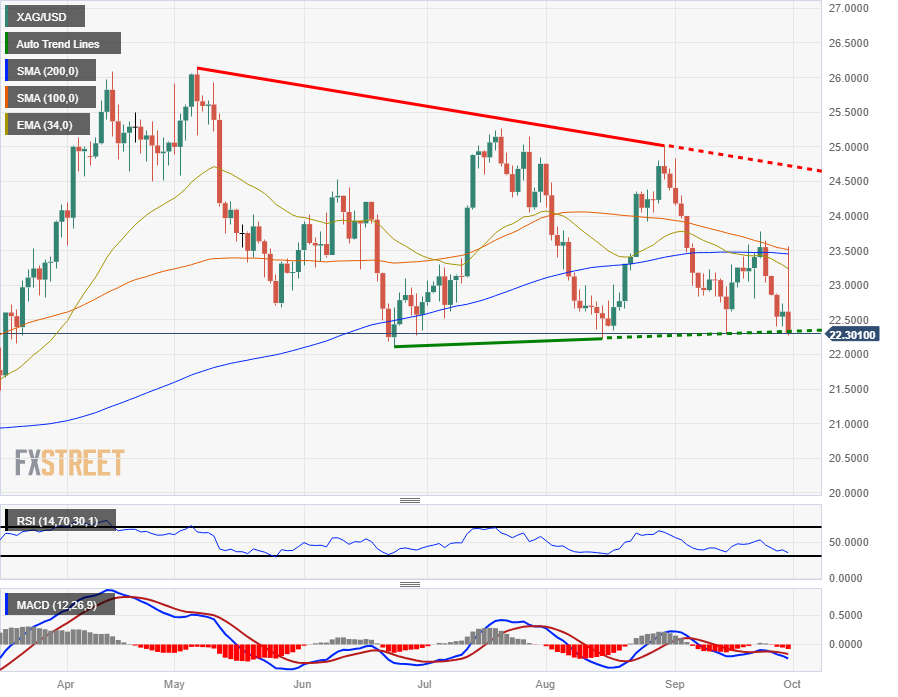
- XAG/USD fell $1.28 during the US trading session, backsliding into $22.30.
- Bulls failed to establish a floor in XAG/USD prices and Silver slumped to a new weekly low.
- Broad-market reversal in risk appetite sending Silver into the floorboards.
Silver prices have tumbled from a late-week peak for Friday's trading, skidding into $22.30 after falling over 5.5% over the course of the US trading session.
The XAG/USD is back into familiar lows that Silver has cycled into for most of the year, driven by a resurgence in US Dollar (USD) bidding as global markets routinely pivot on fears of an impending economic slowdown that could roll over into a full-blown 'hard landing' if left unchecked.
Silver prices have consistently waffled on the top end ever since slipping from 2023's early peak above $26.00, a high set back in May.
Friday's sharp reversal only serves to highlight the XAG/USD's large exposure to broader market sentiment, tracking closely with US Dollar flows.
XAG/USD technical outlook
Silver is trading back into a familiar bottom just above the $22.00 major psychological level. A descending pattern of lower highs in XAG/USD is capping off long-term bullish potential, and a descending trendline is marked in from May's peak just north of $26.00.
Despite Friday's bomb-drop into the floor, the XAG/USD could potentially be set for another bullish turn around the cyclical pattern if Silver bidders can amass enough to arrest the current slide.
On the down side, if risk-off price pressure maintain through the weekend and into next week, Silver could see itself dropping further below $23.00 and set up a bearish push into $22.00 and beyond into six-month lows.
XAG/USD daily chart
XAG/USD technical levels
- Canadian Dollar back into recent lows as Crude Oil prices tumble on Friday.
- Canadian GDP missed market expectations, economic growth came in flat.
- USD/CAD etches in a new high for the week as CAD slips, US Dollar recovers.
The Canadian Dollar (CAD) saw both a new high and a new low against the US Dollar (USD) on Friday, with the USD/CAD slumping to a session low of 1.3417 before rebounding to reclaim the 1.3500 handle and mark in a new weekly high at 1.3540.
Canadian Gross Domestic Product (GDP) figures failed to meet market expectations, with the headline figure printing flat at 0.0% for the month of July versus the previous month’s 0.2% contraction. Markets were forecasting a meager 0.1% uptick in Canadian GDP.
Tightly wound Oil prices that have been bolstering the Canadian Dollar went slack in Friday trading, easing upside pressure on the CAD in tandem with an intraday rebound in the US Dollar Index (DXY).
Daily Digest Market Movers: Canadian Dollar whipsaws on Friday
- Friday chart action sees the USD/CAD engulf the entire week’s trading range.
- The CAD saw gains against the US Dollar through the first half of the day’s trading window.
- A broad-market reversal in USD appetite, coupled with a fallback in Crude Oil spot prices sent the Canadian Dollar skidding.
- The USD/CAD heads into the end of the trading week looking for 1.3550.
- Crude support for the Canadian Dollar evaporated when WTI US crude barrels tumbled from $92 to sub-$90.
- Oil has recovered to $90.50, but broad-market US Dollar flows have taken over chart control, keeping the USD/CAD on the high end to close out Friday.
- Investors will be looking ahead to Monday’s Manufacturing Purchasing Manager Index (PMI) figures for both the Canadian Dollar and the USD.
Technical analysis: Canadian Dollar takes a tumble
The Canadian Dollar (CAD) whipsawed on Friday, claiming the trading week’s high and low in a single day as the USD/CAD roiled under shifting market sentiment.
The USD/CAD fell 70 pips, or half a percent, to 1.3420 in the first half of Friday’s trading, before rebounding to chalk in a new high for the week at 1.3543. The USD/CAD rebound was over 120 pips, or 0.90%.
Hourly candlesticks have the USD/CAD shaking out of a holding pattern wrapped around the 200-hour Simple Moving Average (SMA) near 1.3480 with the 1.3500 major handle acting as a sticking point for the pair.
Friday’s volatility sees technical indicators breaking, with the Relative Strength Index (RSI) rolling over from oversold to nearly overbought within a matter of hours.
On the daily candlesticks, the USD/CAD has recovered back to the topside of the 34-day Exponential Moving Average at the 1.3500 handle. Buyers will be looking to gain further ground towards the September peak near 1.3700, and put some distance between current prices and the 200-day SMA currently parked near 1.3450.
Canadian Dollar FAQs
What key factors drive the Canadian Dollar?
The key factors driving the Canadian Dollar (CAD) are the level of interest rates set by the Bank of Canada (BoC), the price of Oil, Canada’s largest export, the health of its economy, inflation and the Trade Balance, which is the difference between the value of Canada’s exports versus its imports. Other factors include market sentiment – whether investors are taking on more risky assets (risk-on) or seeking safe-havens (risk-off) – with risk-on being CAD-positive. As its largest trading partner, the health of the US economy is also a key factor influencing the Canadian Dollar.
How do the decisions of the Bank of Canada impact the Canadian Dollar?
The Bank of Canada (BoC) has a significant influence on the Canadian Dollar by setting the level of interest rates that banks can lend to one another. This influences the level of interest rates for everyone. The main goal of the BoC is to maintain inflation at 1-3% by adjusting interest rates up or down. Relatively higher interest rates tend to be positive for the CAD. The Bank of Canada can also use quantitative easing and tightening to influence credit conditions, with the former CAD-negative and the latter CAD-positive.
How does the price of Oil impact the Canadian Dollar?
The price of Oil is a key factor impacting the value of the Canadian Dollar. Petroleum is Canada’s biggest export, so Oil price tends to have an immediate impact on the CAD value. Generally, if Oil price rises CAD also goes up, as aggregate demand for the currency increases. The opposite is the case if the price of Oil falls. Higher Oil prices also tend to result in a greater likelihood of a positive Trade Balance, which is also supportive of the CAD.
How does inflation data impact the value of the Canadian Dollar?
While inflation had always traditionally been thought of as a negative factor for a currency since it lowers the value of money, the opposite has actually been the case in modern times with the relaxation of cross-border capital controls. Higher inflation tends to lead central banks to put up interest rates which attracts more capital inflows from global investors seeking a lucrative place to keep their money. This increases demand for the local currency, which in Canada’s case is the Canadian Dollar.
How does economic data influence the value of the Canadian Dollar?
Macroeconomic data releases gauge the health of the economy and can have an impact on the Canadian Dollar. Indicators such as GDP, Manufacturing and Services PMIs, employment, and consumer sentiment surveys can all influence the direction of the CAD. A strong economy is good for the Canadian Dollar. Not only does it attract more foreign investment but it may encourage the Bank of Canada to put up interest rates, leading to a stronger currency. If economic data is weak, however, the CAD is likely to fall.
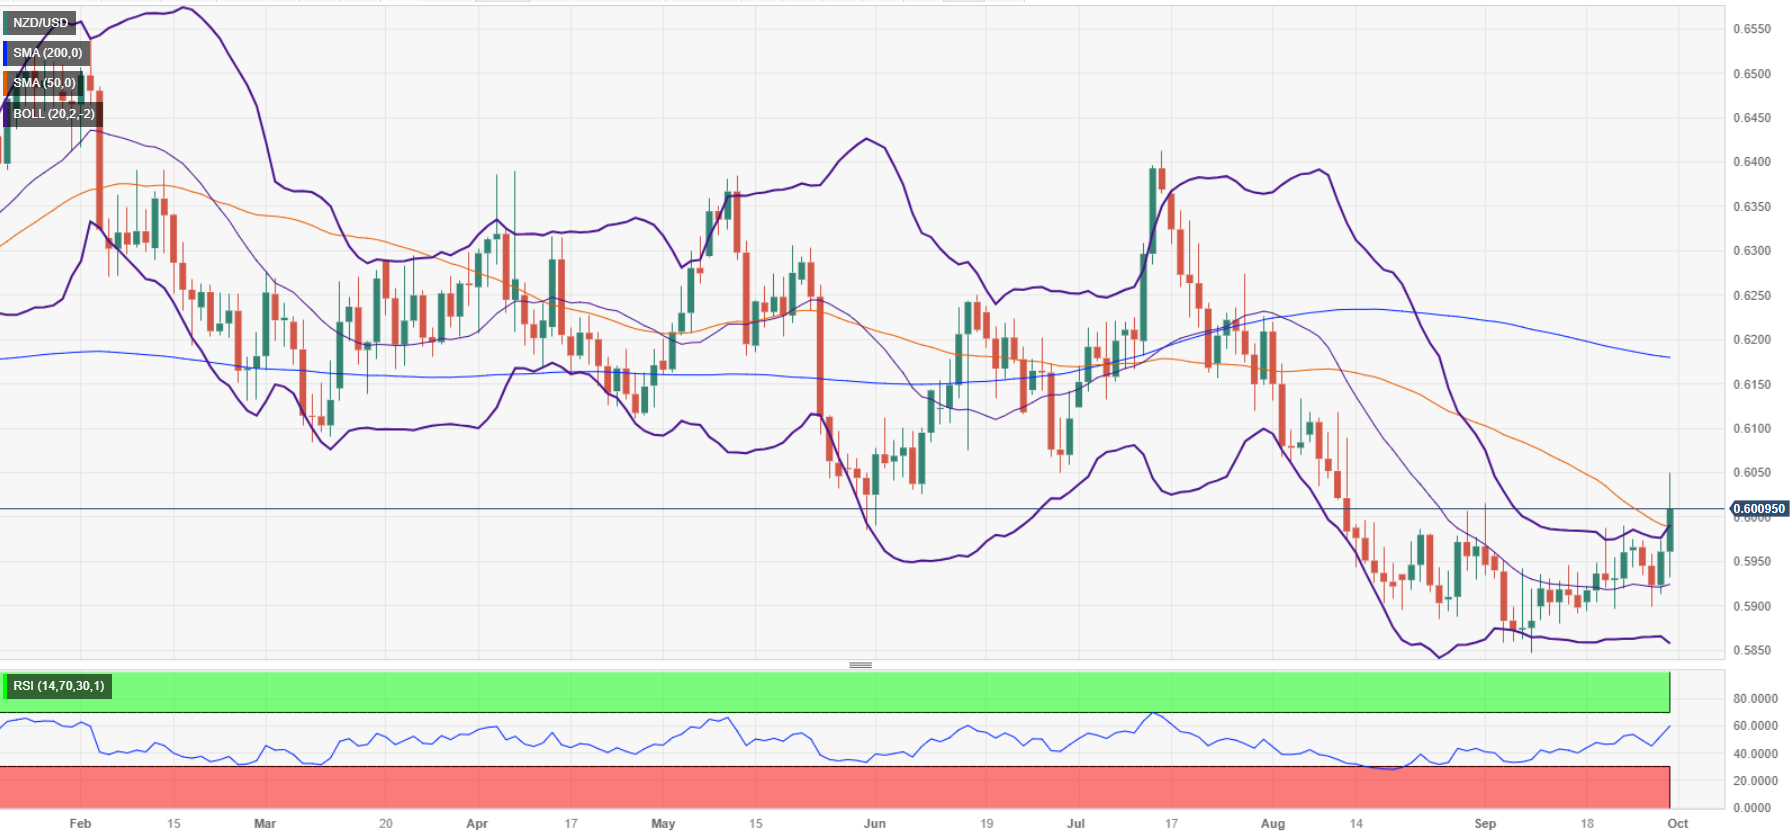
- NZD/USD hovers around the 0.6000 mark, benefiting from a softer Greenback as US Treasury bond yields experience a decline.
- US inflation data reveals a 3.9% YoY rise in PCE, easing pressures on the Fed to increase rates beyond the current 5.25%-5.50% range.
- Upcoming RBNZ decision and potential US government shutdown add elements of anticipation and uncertainty to the market’s future movements.
The New Zealand Dollar (NZD) climbs against the US Dollar (USD), sponsored by an improvement in market sentiment and a Greenback that is falling as US Treasury bond yields slide. The NZD/USD remains trading at around the 0.6000 mark, at the time of writing, gains 0.76%.
New Zealand Dollar gains ground, rising 0.76% against a weakening US Dollar, US inflation data eases Fed rate hike pressures
Wall Street is trading in a better mood, as the US Department of Labor revealed the US Federal Reserve’s preferred gauge for inflation, the Personal Consumption Expenditures (PCE), which rose by 3.9% YoY, below July’s 4%, while headline inflation was 3.5% YoY as expected, a tick up from the prior’s month 3.4%.
The data eases off pressure on the Fed to increase rates to a higher level past the current 5.25%-5.50% range. Although most policymakers remain hawkish, others remain more cautious and fear overtightening monetary policy. From those, San Francisco, Boston, and Chicago Fed Presidents Mary Daly, Susan Collins, and Austan Goolsbee commented that patience is required while they remain undecided in regard to the next FOMC decision.
Additional data from the University of Michigan (UoM) showed that Consumer Sentiment for September's final reading deteriorated, while inflation expectations ticked up to 3.2% from 3.1% for one year. Americans see inflation at 2.8% on a five-year horizon, up from 2.7%.
In the meantime, next week’s economic docket will feature the Reserve Bank of New Zealand (RBNZ) decision, in which the central bank is projected to hold rates unchanged. On the US front, if a possible US government shutdown is dodged, the S&P and ISM PMIs would be released on Monday, and a tranche of Fed speakers.
NZD/USD Price Analysis: Technical outlook
Despite rallying, the NZD/USD is downward biased despite reaching a 7-week high, and although it is trading above the 0.6000 figure, it needs a daily close above the latter to keep buyers hopeful of higher prices. Key resistance levels lie on the upside, like the June 29 daily low of 0.6050, followed by the 0.6100 mark. Conversely, if the pair ends below 0.6000, the first support would be the 50-day moving average (DMA) at 0.5986, followed by the psychological 0.5950 mark and the September 27 swing low of 0.5899.
- Mexican Peso aims to recover further as Mexico’s central bank doesn’t foresee rate cuts.
- Mexico’s economic docket will report its Fiscal Balance on Friday.
- USD/MXN triggered a sell-off after closing below 17.60 on Thursday as the pair slides below 17.40.
The Mexican Peso (MXN) stages a strong comeback versus the US Dollar (USD) after the Bank of Mexico – also known as Banxico – kept rates unchanged, disregarded possible rate cuts in 2023, and revised up its inflation projections until 2025. Hence, the USD/MXN pair has broken strong support, seen at 17.50, and hovers around the 17.40s area.
The USD/MXN retracement is also sponsored by data from the United States (US) following the release of the US Federal Reserve (Fed) preferred inflation gauge, the Core Personal Consumption Expenditure (PCE) Price Index. US Core PCE inflation slid below 4% to 3.9% YoY in August as expected, sparking speculation the Fed could forgo an interest rate hike. In the meantime, BBVA updated Mexico's Gross Domestic Product (GDP) for 2023 and 2024, with an optimistic 3.2% from 2.4% this year and 2.6% from 1.8% next year.
Daily Digest Market Movers: Mexican Peso gains traction as USD/MXN falls below 17.40
- The Bank of Mexico (Banxico) held rates at 11.25% and revised its inflation projections from 3.5% to 3.87% for 2024, above the central bank’s 3% target (plus or minus 1%).
- Banxico’s Government Board highlighted Mexico’s economic resilience and the strong labor market as the main drivers to keep inflation at the current interest rate level.
- Mexico’s Unemployment Rate edged lower from 3.1% in July to 3.0% MoM in August, according to the National Statistics Agency (INEGI).
- September’s first-half inflation report in Mexico was 4.44%, down from 4.64% in August, according to INEGI.
- Being an emerging market currency, the Mexican Peso weakens amid risk aversion. Therefore, news emerging of a possible US Government shutdown triggered a flow toward safe-haven assets, weakening the Mexican Peso.
- The drop in Oil prices weighs on the Mexican currency, as its economy relies on crude exports.
- Moody’s rating agency warned the fiscal strategy of the Mexican government in 2024 must be credible after the June elections in defining the country’s stable outlook.
- In July, Moody’s lowered Mexico's rating to “Baa2” with a “stable” outlook but warned of fiscal pressures for the next government due to the 2024 economic budget.
- Broad Greenback weakness undermines the USD/MXN pair, as the US Dollar Index (DXY) drops below 106.00 at around 15:00 GMT.
Technical Analysis: Mexican Peso
The Mexican Peso (MXN) found its foot after depreciating to 17.81 versus the US Dollar, near the 200-day Simple Moving Average (SMA) at 17.84. The USD/MXN is accelerating its downtrend after closing below 17.60, with sellers eyeing a push below the 20-day Simple Moving Average (SMA) at 17.32. If that level is lost, the USD/MXN pair would test the 100-day SMA at 17.18, followed by the 50-day SMA at 17.10. If the exotic pair manages to remain above the September low of 16.99, it could resume the one-month upmove.
Inflation FAQs
What is inflation?
Inflation measures the rise in the price of a representative basket of goods and services. Headline inflation is usually expressed as a percentage change on a month-on-month (MoM) and year-on-year (YoY) basis. Core inflation excludes more volatile elements such as food and fuel which can fluctuate because of geopolitical and seasonal factors. Core inflation is the figure economists focus on and is the level targeted by central banks, which are mandated to keep inflation at a manageable level, usually around 2%.
What is the Consumer Price Index (CPI)?
The Consumer Price Index (CPI) measures the change in prices of a basket of goods and services over a period of time. It is usually expressed as a percentage change on a month-on-month (MoM) and year-on-year (YoY) basis. Core CPI is the figure targeted by central banks as it excludes volatile food and fuel inputs. When Core CPI rises above 2% it usually results in higher interest rates and vice versa when it falls below 2%. Since higher interest rates are positive for a currency, higher inflation usually results in a stronger currency. The opposite is true when inflation falls.
What is the impact of inflation on foreign exchange?
Although it may seem counter-intuitive, high inflation in a country pushes up the value of its currency and vice versa for lower inflation. This is because the central bank will normally raise interest rates to combat the higher inflation, which attract more global capital inflows from investors looking for a lucrative place to park their money.
How does inflation influence the price of Gold?
Formerly, Gold was the asset investors turned to in times of high inflation because it preserved its value, and whilst investors will often still buy Gold for its safe-haven properties in times of extreme market turmoil, this is not the case most of the time. This is because when inflation is high, central banks will put up interest rates to combat it.
Higher interest rates are negative for Gold because they increase the opportunity-cost of holding Gold vis-a-vis an interest-bearing asset or placing the money in a cash deposit account. On the flipside, lower inflation tends to be positive for Gold as it brings interest rates down, making the bright metal a more viable investment alternative.
Gold price has been under pressure this week and has dropped back to $1,860, its lowest price in a good six months. Strategists at Commerzbank analyze the yellow metal’s outlook.
Gold will probably find it difficult to come out of the defensive
For as long as the market continues to expect a ‘soft’ landing in the US, no price recovery is likely to happen for now. After all, this would imply that it will take longer for any interest rate cut to be forthcoming.
However, because our US experts are more pessimistic and believe that a recession is inevitable, we expect to see more disappointing economic data in the coming weeks. These are likely to put the US Dollar under pressure and thereby lend buoyancy to the Gold price.
Strategists at ANZ Bank analyze Silver (XAG/USD) outlook.
Investment demand to reverse
Silver is facing a double whammy: expectations of a rise in US interest rates curbing its investment appeal and a weaker Chinese economy weighing on industrial demand. These two drags are driving a recent liquidation of Silver investments.
We expect investment demand to reverse, consistent with fundamentals, and for prices to rebound towards $25 by the end of this year.
See – Gold Price Forecast: XAU/USD to trade near $2,000 by year-end – ANZ
USD/BRL has crossed back above 5.00. Economists at Société Générale analyze the pair’s outlook.
Defence of 4.84 crucial for persistence in up move
USD/BRL has extended its rebound after carving out a higher low at 4.84 as compared to the one in July near 4.69. It has crossed above the descending channel that encompassed the decline since January and is attempting a break above the 200-DMA.
Next potential objectives are located at May high of 5.11/5.13 and 5.21.
Defence of recent pivot low near 4.84 would be crucial for persistence in up move.
Scepticism about whether the BoE will ultimately act restrictively enough is likely to continue to weigh on the Pound in the near term, economists at Commerzbank report.
EUR/GBP to appreciate in the coming quarters
The market is likely to be dominated by concerns that the BoE is acting too slowly and cautiously and will not get a grip on the inflation problem. The Pound is likely to suffer from this.
If the inflation outlook were to improve significantly Sterling might be able to recover slightly. At that point, the expectations that the BoE will cut its key rate due to the weak economy will then probably increase. At the same time, as we do not expect the ECB to cut its key rate, we expect EUR/GBP to appreciate in the coming quarters.

Source: Commerzbank Research
- AUD/USD finds nominal selling pressure near 0.6500 while more upside remains favored.
- Soft US core PCE inflation data dragged the 10-year US Treasury yields to 4.5%.
- The RBA is expected to keep interest rates unchanged but the interest rate peak is seen at 4.35% by the year-end.
The AUD/USD pair rallied to near the psychological resistance of 0.6500 but struggled to extend further as the US Dollar Index (DXY) discovered buying interest after correcting to near 105.66.
The S&P500 opens on a bullish note as the market mood turns cheerful. The appeal for the risk-sensitive assets improved as investors started digesting fears of a global slowdown due to higher interest rates by central bankers. The 10-year US Treasury yields dropped sharply to 4.51% after soft United States core Personal Consumption Expenditure (PCE) price index data for August.
Monthly core PCE expanded at a nominal pace of 0.1% in August against expectations and the former release of 0.2%. The annualized PCE has softened to 3.9% as expected from the former release of 4.3%. This may buy some more time for the Federal Reserve (Fed) to assess the impact of the interest rate hikes till made.
Going forward, investors will focus on the US Manufacturing PMI report for September to be released by the Institute of Supply Management (ISM) agency. As per the expectations, the Manufacturing PMI is expected to contract consecutively for the 11th month. A figure below the 50.0 threshold is considered as contraction in economic activities. The economic data is seen improving to 47.8 vs. 47.6 reading from August.
On the Australian Dollar front, investors await the interest rate decision by the Reserve Bank of Australia (RBA), which will be announced on Tuesday. The RBA is expected to keep interest rates unchanged at 4.10% but economists see the interest rate peak at 4.35% by the year-end, according to a Reuters poll.
The cruising US economy is about to enter choppier waters, in the view of economists at ABN Amro.
Headwinds are building
Growth looks set to slow sharply in Q4.
Even without a government shutdown, the restart of student loan repayments and slowing job growth are likely to weigh on consumption.
The labour market has cooled significantly. This is helping to dampen wage growth, making it likely that disinflation will resume once the near-term inflation bounce is behind us.
We continue to expect rate cuts next year, but policy will stay in restrictive territory until 2025.
Economists at Wells Fargo discuss the outlook of a range of currencies such as SEK, CHF and AUD.
The Krona is likely to soften
The Krona is likely to soften, given a particularly weak Swedish economy, while the Swiss Franc should also soften, given a probable end to Swiss monetary tightening.
The Australian Dollar also appears likely to decline as a subpar Chinese economy continues to weigh on Australian economic prospects, and as we see, the Reserve Bank of Australia is likely to hold interest rates steady at upcoming meetings.
This week, Crude Brent Oil reached a peak of 97$/barrel before coming down to the 95$ area. Economists at Nordea analyze Oil’s outlook.
A further rise to the $120 area cannot be ruled out
The tightening of crude storages has supported the Oil price rally and we believe that Oil prices will swing around the current levels around $90-$100.
A further rise (to the $120 area) cannot be ruled out if OPEC+ keeps the Oil flow low(er).
If OPEC+ pushes Oil prices too high, US shale will respond and could take more market share, which would be counterproductive for OPEC+ in the longer run. As such, we believe that the upside in Oil prices is limited to $120 in the long run.
- USD/CAD discovers a cushion near 1.3420 on Canada’s stagnant GDP and soft US core PCE data.
- US monthly core PCE expanded at a nominal pace of 0.1%. The annualized data decelerated to 3.9%.
- Oil prices retreat after a short-lived pullback to near $93.00 as global slowdown fears remain intact.
The USD/CAD pair discovered buying interest near 1.3420 in the early New York session. The Loonie asset finds support after Canada’s weak monthly Gross Domestic Product (GDP) and soft United States Personal Consumption Expenditure (PCE) price index reports.
The US Bureau of Labor Statistics reported that monthly core PCE expanded at a nominal pace of 0.1% in August against expectations and the former release of 0.2%. The annualized PCE has softened to 3.9% as expected from the former release of 4.3%.
Headline PCE grew by 0.4%, doubling from July’s pace but remained slower than expectations of 0.5%. The headline data was expected to remain hot due to rising energy prices. Monetary receipts at oil stations were significantly higher as global oil prices have rallied more than 30% in the past three months.
A decline in core expenditure data may soften consumer inflation ahead and would discourage Federal Reserve (Fed) policymakers from raising interest rates further. Meanwhile, chances that interest rates will remain steady at 5.25%-5.50% at the November monetary policy meeting have recovered to 83% from 77% on Thursday, according to the CME Fedwatch tool.
The US Dollar Index (DXY) finds interim support near 105.70. Further action in the US Dollar will be guided by the US ISM Manufacturing PMI report for September, which will be published on Monday.
Meanwhile, the Canadian Dollar comes under pressure as Canada’s growth rate remained stagnant in July while investors anticipated a nominal growth at 0.1%. In June, the GDP contracted 0.2%. On the oil front, oil prices retreat after a short-lived pullback to near $93.00 as global slowdown fears remain intact.
It is worth noting that Canada is the leading exporter of oil to the United States and a decline in oil prices impacts the Canadian Dollar.
- EUR/USD gathers further impulse and surpasses 1.0600.
- The immediate target for bulls emerges at the 1.0770 region.
EUR/USD regains composure and extends the recovery beyond the key barrier at 1.0600 the figure at the end of the week.
In case the bounce becomes more serious, the pair is expected to target the weekly high of 1.0767 (September 12). The selling pressure is expected to alleviate once this level is cleared, allowing for a potential next move to the critical 200-day SMA, today at 1.0827.
Meanwhile, further losses remain on the table as long as the pair navigates the area below the key 200-day SMA.
EUR/USD daily chart
From a recent low in mid-July, the US Dollar has appreciated by around 6% against the Euro, with the Dollar Index (DXY), a basket of six major currencies, rising by a similar amount. Economists at UBS analyze Greenback’s outlook.
Greenback will stay well bid until year-end
Until the year-end, we now expect the US Dollar to trade sideways against most currencies.
We now forecast EUR/USD, USD/CHF, and GBP/USD to trade at 1.06 (previously 1.12), 0.92 (0.87), and 1.20 (1.29), respectively, by end-December. And in Asia-Pacific, we see USD/JPY and AUD/USD trading at 145 (previously 142) and 0.65 (0.66), respectively, by end-December.
But looking further ahead, relative growth dynamics are likely to run against the US Dollar in 1H24. The US economy has yet to bottom, while Europe and China already have.
We expect US Dollar strength to peak next year and the Greenback to give up some gains. We reflect this in EUR/USD, USD/CHF, and GBP/USD with our September 2024 forecasts at 1.12 (previously 1.16), 0.87 (0.84), and 1.30 (1.36), respectively. This view requires Europe to stay out of recession and China to stabilize.
- DXY extends the correction to the 105.70/65 band.
- A deeper pullback should meet contention near 104.70.
DXY adds to Thursday’s losses and briefly visits the vicinity of the 105.70 zone at the end of the week.
Despite the ongoing technical correction, extra gains appear likely for the time being. The surpass of the yearly high of 106.83 (September 27) could encourage the index to challenge the weekly top at 107.19 (November 30, 2022) prior to another weekly peak at 107.99 (November 21 2022).
In the meantime, while above the key 200-day SMA, today at 103.09, the outlook for the index is expected to remain constructive.
DXY daily chart
EUR/USD is enjoying a relief rally to 1.0600. Economists at ING analyze the pair’s outlook.
EUR/USD downside risks could extend to the 1.00/1.02 area
Domestic news and the overall environment continue to point to EUR/USD weakness, and our rates team sees more upside risks for back-end UST yields, which could pave the way for a further short-term depreciation in EUR/USD.
Should we see a material deterioration in the Italian bond market – and barring a swift reaction by the ECB to calm investors – EUR/USD downside risks would extend to the 1.00/1.02 area in an environment where US bonds remain under pressure on the back of solid US data and the Federal Reserve remains hawkish.
- EUR/JPY adds to Thursday’s advance and surpasses 158.00.
- Next on the upside comes the monthly peak at 158.65.
EUR/JPY extends Thursday’s gains and reclaims the area above the 158.00 hurdle at the end of the week.
In the meantime, the cross remains stuck within the consolidative range and the breakout of it exposes a visit to the so far monthly high of 158.65 (September 13) prior to the 2023 top at 159.76 (August 30), which precedes the key round level at 160.00.
So far, the longer term positive outlook for the cross appears favoured while above the 200-day SMA, today at 149.43.
EUR/JPY daily chart

Economists at Wells Fargo analyze the Mexican Peso (MXN) outlook.
Mexican Peso to weaken in the months ahead
While we expect the Mexican Peso and Peruvian Sol to weaken in the months ahead, sound underlying fundamentals and more cautious central banks should limit the extent of Peso and Sol weakness.
In the case of the MXN, while we forecast modest softness, risks are tilted toward more sizable weakness as political risks take shape early next year and as Peso valuations remain stretched, leaving the currency vulnerable to sharp turns in risk sentiment.
USD/MXN – Q4-2023 17.75 Q1-2024 18.25 Q2-2024 18.00 Q3-2024 17.75 Q4-2024 17.50 Q1-2025 17.25
- Silver price rises swiftly to near $23.20 as US core PCE remains softer-than-anticipated.
- US monthly core PCE inflation grew at a nominal pace of 0.1% while the annual data softened to 3.9%.
- Silver price rebounds strongly from the neckline of the H&S chart pattern to near the 20-DEMA.
Silver price rallies $23.20 as the United States Bureau of Economic Analysis reports a soft core Personal Consumption Expenditure (PCE) price index. The monthly Core PCE grew at a nominal pace of 0.1%, slower than expectations and the former pace of 0.2%. The annual core PCE data decelerated to 3.9% as expected against July's reading of 4.3%.
The headline PCE expanded at a higher pace of 0.4% vs. July's reading of 0.2% but slower than expectations of 0.5%. On an annualized basis, the economic data accelerated nominally to 3.5% as expected due to rising energy prices.
The US Dollar Index (DXY) corrects to near 105.80 but the broader bias remains bullish as the US economy has remained resilient. The US economy is performing well on the grounds of inflation, labor market, and consumer spending but factory activity is still a concern for the authorities amid a poor demand outlook.
This week, the Durable Goods Orders data for August unexpectedly rose by 0.2% while investors forecasted a contraction of 0.5%. This indicates that business spending on equipment increases, as investors see the Federal Reserve (Fed) is done with hiking interest rates and the factory outlook, is improving. For more guidance on the current status of the manufacturing sector, investors will focus on the ISM Manufacturing PMI report for September, which will be released on Monday at 14:00 GMT.
Silver technical analysis
Silver price rebounds strongly from the neckline of the Head and Shoulder chart pattern, which is plotted from June 23 low at $22.11. The asset forms an H&S chart pattern on a daily scale, which indicates a prolonged consolidation whose breakdown triggers a bearish reversal. The white metal trades below the 20-day Exponential Moving Average (EMA) at $23.15, which indicates that the short-term trend is bearish.
The Relative Strength Index (RSI) (14) slips below 40.00, indicating no signs of divergence and oversold, warranting more downside.
Silver daily chart
-638315890256425471.png)
BoJ acts to stem 10yr JGB yield rise. The Yen initially weakened modestly but has since strengthened with the Dollar continuing to sell off more generally. Economists at MUFG Bank analyze JPY outlook.
Dollar selling could fade quite quickly
The scale of the sell-off of global bonds prompted the BoJ today to announce an unscheduled bond-buying operation. If the Dollar was performing more strongly in broader markets, there’s a chance such a modest operation may have propelled USD/JPY through the 150 level.
We are wary of this Dollar sell-off given this is month-end and Dollar selling could fade quite quickly.
The modest BoJ bond buying announcement today does highlight the bind that Japan is in and a broader rebound of the USD seems more likely than not at this juncture which will likely mean a break above the 150 level.
- Canadian economy stalled in July after a 0.2% contraction in June.
- USD/CAD stays around 1.3425 after the data.
Canada's real Gross Domestic Product (GDP) "was essentially unchanged in July, following a 0.2% decline in June", Statistics Canada reported on Friday. This reading came in worse than the market expectation for an expansion of 0.1%.
The reports added that "certain sectors impacted by wildfires in June bounce back in July" and highlighted that manufacturing declined for a second consecutive month.
The advance estimate for real GDP for August 2023 indicates that real GDP edged up 0.1% in August. The following GDP report will be released on October 31.
Key takeaways from the report:
Services-producing industries edged up 0.1% in the month, while goods-producing industries contracted 0.3%. Overall, 9 of 20 industrial sectors posted increases.
The manufacturing sector (-1.5%) had the largest negative contribution in July, its largest since April 2021. This was the second consecutive monthly contraction for the sector. The July 2023 decline largely stems from lower inventory formation.
Advance information indicates that real GDP edged up 0.1% in August. Increases in the wholesale trade and finance and insurance sectors were partly offset by decreases in the retail trade and oil and gas extraction sectors.
Market reaction
The USD/CAD remained in negative territory around 1.3430. At the same time, the US reported the Core Personal Consumption Expenditure Price Index.
USD losses extend for a second day. Economists at Scotiabank analyze Greenback’s outlook.
Technical signals turn negative
We have been due – or overdue – a correction on the strong Dollar trend and while price action suggests that may well be happening, USD losses could simply reflect temporary month and quarter-end flows.
A significant move lower in the USD generally will very likely require a major shift in longer term rate differentials against the USD.
As things stand, the DXY is just about clinging on to an 11th, consecutive weekly gain but well off its high. A low close on the week would signal the risk of more USD losses from a technical point of view at least.
GBP/USD recovers all of this week’s losses. Economists at Scotiabank analyze the pair’s outlook.
Correction risks are strengthening
Solid gains for the GBP through late week price action have taken Cable back to the opening levels of the week.
The GBP sell-off looks oversold as well and correction risks are strengthening, based on a potentially bullish close on the week. Corrective gains may extend to 1.2350 in the short run.
Support is 1.2225.
See: There are no real UK-specific drivers that would justify a sustained GBP outperformance – ING
- Markets on edge over the Fed’s preferred inflation gauge: PCE.
- In case PCE numbers drop substantially, expect substantial US Dollar weakness to unfold.
- The US Dollar Index clings on to an 11th weekly positive close, though it will be a close call.
The US Dollar (USD) is trying to eke out another weekly gain, though this might be a close call to the final minute. If the US Dollar holds onto gains, this would be the 11th consecutive weekly gain for the US Dollar Index (DXY).
While the US Dollar Index closed each week near the high of that same week, that does not look to be the case for this week. With the United Auto Workers (UAW) union strikes continuing, more independent workers joining the picket lines and a US federal government shutdown expected to start this weekend, things are starting to look grim for the Greenback.
From the economic datafront, some oil to the fire might be added with the Federal Reserve’s (Fed) preferred inflation gauge: the Personal Consumption Expenditures indices. Should those components fall further below estimates, markets could pick this up as a sign that the Fed is done hiking. The rate differential then might still support the Greenback, though some repricing would make the US Dollar retreat a few figures against several major currencies in the coming days.
Daily digest: US Dollar to face sell-off when PCE sinks
- Fireworks are expected at 12:30 GMT with the Personal Consumption Expenditure (PCE) index in all its forms: The Core MoM is expected to stay steady at 0.2%, while the yearly component drops from 4.2% to 3.9%. Headline PCE on a monthly basis is expected to rise from 0.2% to 0.5%, with energy the main driver here for the uptick. The yearly gauge is expected to head from 3.3% to 3.5%.
- Additionally, traders will see the Personal Income and Spending for the month of August: Income is expected to rise from 0.2% to 0.4% for the month, spending to decline from 0.8% to 0.4%.
- Near 13:45 GMT, the Chicago Purchasing Managers Index (PMI) for September comes out, with another decline expected from 48.7 to 47.6.
- Closing off the week will be with the Michigan Consumer Sentiment and the Inflation Expectation. Bear in mind these are final readings, so no real shockers are expected here. Consumer Sentiment is expected stay steady at 67.7, while the inflation expectation is expected to hold at 2.7%.
- Equities are mixed with Hong Kong’s Hang Seng Index roaring over 3%, while in Japan the Nikkei and the Topix are down for this Friday at their closing bell. The Nikkei is even trading near a one-month low. In Europe a turnaround looks to be in the making with European equities mildly in the green and US equity futures in a similar pattern.
- The CME Group FedWatch Tool shows that markets are pricing in an 82.7 % chance that the Federal Reserve will keep interest rates unchanged at its meeting in November.
- The benchmark 10-year US Treasury yield trades are lower at 4.54%, which is quite a step away from 4.48% earlier this week. Investors are starting to buy bonds in order to safely park funds over the weekend with the government shutdown at hand.
US Dollar Index technical analysis: Off the highs
The US Dollar tries to cling on to gains as this week might be proven pivotal for its winning streak since the summer. The US Dollar Index is set to print its 11th straight weekly gain, though headwinds are building up. With the UAW strike, the US Government shutdown and GDP miss are signs not to be ignored with possibly a firm unwind of the current Dollar bull positions that have been built up.
The US Dollar Index opened around 106.15, though the overheated Relative Strength Index (RSI) starts to ease and is out of the overbought area. Traders that want to hit a new 52-week high need to be aware that a lot of road needs to be covered toward 114.78. Rather look for 107.19, the high of November 30, 2022, as the next profit target on the upside.
On the downside, the recent resistance at 105.88 should be seen as first support. Still, that barrier has just been broken to the upside, so it isn’t likely to be strong. Instead, look for 105.12 to do the trick and keep the DXY above 105.00.
US Dollar FAQs
What is the US Dollar?
The US Dollar (USD) is the official currency of the United States of America, and the ‘de facto’ currency of a significant number of other countries where it is found in circulation alongside local notes. It is the most heavily traded currency in the world, accounting for over 88% of all global foreign exchange turnover, or an average of $6.6 trillion in transactions per day, according to data from 2022.
Following the second world war, the USD took over from the British Pound as the world’s reserve currency. For most of its history, the US Dollar was backed by Gold, until the Bretton Woods Agreement in 1971 when the Gold Standard went away.
How do the decisions of the Federal Reserve impact the US Dollar?
The most important single factor impacting on the value of the US Dollar is monetary policy, which is shaped by the Federal Reserve (Fed). The Fed has two mandates: to achieve price stability (control inflation) and foster full employment. Its primary tool to achieve these two goals is by adjusting interest rates.
When prices are rising too quickly and inflation is above the Fed’s 2% target, the Fed will raise rates, which helps the USD value. When inflation falls below 2% or the Unemployment Rate is too high, the Fed may lower interest rates, which weighs on the Greenback.
What is Quantitative Easing and how does it influence the US Dollar?
In extreme situations, the Federal Reserve can also print more Dollars and enact quantitative easing (QE). QE is the process by which the Fed substantially increases the flow of credit in a stuck financial system.
It is a non-standard policy measure used when credit has dried up because banks will not lend to each other (out of the fear of counterparty default). It is a last resort when simply lowering interest rates is unlikely to achieve the necessary result. It was the Fed’s weapon of choice to combat the credit crunch that occurred during the Great Financial Crisis in 2008. It involves the Fed printing more Dollars and using them to buy US government bonds predominantly from financial institutions. QE usually leads to a weaker US Dollar.
What is Quantitative Tightening and how does it influence the US Dollar?
Quantitative tightening (QT) is the reverse process whereby the Federal Reserve stops buying bonds from financial institutions and does not reinvest the principal from the bonds it holds maturing in new purchases. It is usually positive for the US Dollar.
EUR/USD recovers to 1.06 area. Economists at Scotiabank analyze the pair’s outlook.
EUR is oversold and there is ample room for a correction
Two solid up days (so far) for the EUR barely make a dent in the sustained sell-off seen since July’s peak but EUR is oversold and there is ample room for a correction – at least – in recent losses.
The EUR remains down on the week but the weekly candle pattern reflects a potential ‘hammer’ signal which will support the impression of a low developing around this week’s test of the 1.05 area. Gains might extend to 1.0675/1.0725.
Support is 1.0575/1.0600.
The CAD has finally found a little traction to edge up to the low 1.34 area against a generally softer USD. Economists at Scotiabank analyze USD/CAD outlook.
Push to low 1.34 area may extend
A renewed push under the 1.34 level to test key support at 1.3380/1.3390 looks likely based on price action and building short-term, bear-trend momentum.
DMI signals are aligning bearishly for the USD across shorter-term timeframes which tilts risks towards a sustained push lower (1.32/1.33 on the radar).
Resistance is 1.3470/1.3475.
Gold declined sharply for the fourth straight day on Thursday and touched its lowest level since early March. Risks are very much to the downside in the near-term, economists at TD Securities report.
FOMC dot projections could come true
Gold fell below the $1,870 key technical support level, which leaves the door open for even more declines.
The recent convincing drop below $1,900, after trading sideways for most of the year thanks to repeated dip-buying, has very much been driven by the Federal Reserve's statements it will keep policy tight for a long period.
Continued firm US economic data and a surge in crude oil prices have made the Fed's hawkish narrative very credible, which could see the FOMC dot projections come true.
The Fed's higher rates for longer narrative, fear that surging energy costs will leak into core inflation and a resilient US economy are prompting us to worry that there is still more downside.
UOB Group’s Economist Enrico Tanuwidjaja and Economist Sathit Talaengsatya review the latest interest rate decision by the Bank of Thailand (BoT).
Key Takeaways
At its Meeting on 27 Sep 2023, the Bank of Thailand (BOT)’s Monetary Policy Committee (MPC) voted unanimously to raise the policy rate by 25bps from 2.25% to 2.50% in line with our earlier expectation, pushing its policy rate to reach a decade-high and much higher than the pre-pandemic level. The MPC also signaled the end of the current rate hike cycle citing that the current policy interest rate was appropriate for supporting long-term sustainable growth.
The MPC revised down its growth forecast for 2023 to 2.8% from 3.6% previously projected in May due to subdued global growth and China's economic woes weighing on Thailand’s exports of goods and tourism, while growth projection for 2024 was revised up to 4.4% from 3.8%. On the inflation outlook, the headline inflation was projected to stabilize within the target range of 1-3%, slowing to 1.6% in 2023 and rebounding to 2.6% in 2024, compared to the previous forecasts of 2.5% and 2.4% for 2023 and 2024, respectively.
We reiterate our view that the BOT has reached its terminal rate at 2.50% for its current rate-hiking cycle and we view that the policy rate should stay unchanged for the rest of 2023 and for a good part of next year. The MPC’s final meeting schedule for this year is on 29 Nov 2023. We therefore revise our view and now forecast the BOT to keep the policy unchanged through 2024 due to its concerns on macro-financial stability, particularly the household debt overhang.
Since June, the Oil price has risen 30%. Economists at Commerzbank show how far the rise could go and analyze the consequences for the economy and inflation.
Oil prices with downward potential
Given the weak global economy, further upside potential is likely to be largely exhausted, even if Saudi Arabia continues its production cuts. In fact, as soon as the US enters a recession, prices are likely to fall again.
We expect the price of Brent to trade just below $90 per barrel on average next year. Only a further significant supply cut from Saudi Arabia or a soft landing of the US economy would likely be able to prevent this from happening.
The Oil price will do little to prevent inflation rates from falling further.
The sustained period of US Dollar strength has finally met some resistance that has prompted a turnaround. Economists at MUFG Bank analyze Greenback’s outlook.
Yields remain elevated
For now, this correction of the Dollar weaker looks mostly technical in nature. We are also at month-end and fiscal half-year-end for some and that too may be drawing non-fundamental FX flows that could fade quickly.
Yields remain elevated despite the correction from Thursday’s intra-day high and while the government shutdown is a risk to yields coming lower it is unlikely to play out that way over the very short term.
- EUR/JPY aims to recapture 160.00 despite softening Eurozone inflation due to lower consumer spending.
- Eurozone’s headline HICP decelerated despite rising energy prices.
- Tokyo’s inflation eased nominally but remained well above BoJ’s target.
The EUR/JPY pair delivered a V-shape recovery from 157.40 despite the softer-than-anticipated Eurozone’s preliminary Harmonized Index of Consumer Prices (HICP) report for September.
The headline HICP grew at a slower pace of 0.3% against the 0.5% gain recorded in August. The annualized data decelerated sharply to 4.3% against expectations of 4.5% and August’s reading of 5.2%. Headline inflation in the Eurozone softened significantly despite rising energy prices due to a rally in global oil prices. This indicates a decline in consumer spending as high inflation has squeezed households’ real income.
A soft inflation report for September may encourage European Central Bank (ECB) policymakers to keep the monetary policy unchanged in November. ECB President Christine Lagarde clarified this week that interest rates will remain sufficiently high for long enough until the achievement of price stability.
Analysts at Commerzbank cited that the ECB is unlikely to raise rates further. They further added that almost half of the decline in September’s inflation report is due to one-off effects such as the expiry of the 9-Euro ticket in Germany in September 2022. But even after adjusting for these effects, the core rate is now also on a downward trend. A majority of the members of the ECB's Governing Council should be pleased with this.
On the Japanese Yen front, the odds of a probable intervention by the Bank of Japan (BoJ) in the FX domain are high as the central bank is not expected to make an exit from its decade-long ultra-loose monetary policy anytime soon. BoJ Governor Kazuo Ueda conveyed that it would be premature to drop expansionary monetary policy as inflation above the 2% target should be guided by wage growth.
Meanwhile, Tokyo inflation softened in September as consumer spending cooled down. The headline Consumer Price Index (CPI) softened marginally to 2.8% vs. the former reading of 2.9%. The Core CPI that excludes volatile oil and food prices decelerated to 3.8% from 4.0% in August but remained well above BoJ’s target.
The Polish Zloty has stabilised slightly above 4.60 against the Euro in recent days. Economists at ING analyze EUR/PLN outlook ahead of next week's National Bank of Poland (NBP) meeting.
EUR/PLN should remain near current levels until next week's NBP meeting
For now, a 25 bps rate cut seems the most likely scenario for us. The market is pricing in a bigger rate cut at the moment and remains on the dovish side. Thus, the scope for repricing is more hawkish in case of a surprise, which could support the Zloty.
At the moment, however, we see higher volatility rather than direction for the PLN, which should remain near current levels until next week's meeting.
The NOK has done well lately. Economists at Nordea analyze Krone’s outlook.
Higher NOK sales not a game changer
Today’s announcement for a minor rise in NOK sales on behalf of the Government will unlikely be a game changer for NOK in the short term.
The main risk for the NOK remains a correction in the stock market which could spill over in commodity markets.
We still keep our view for EUR/NOK around 11.50 by year-end, but the cross has still room to fall in the days and weeks to come.
USD/CNH risks a potential pullback to 7.2600 once it breaches 7.2800. comment UOB Group’s Markets Strategist Quek Ser Leang and Senior FX Strategist Peter Chia.
Key Quotes
24-hour view: We expected USD to strengthen yesterday, but we were of the view that it “is unlikely to threaten the major resistance at 7.3400.” We clearly did not expect the ‘sudden’ sharp selloff that sent it plunging by 0.41% (NY close of 7.2915). While the sharp drop appears to be overdone, there are no signs of stabilisation yet. Today, USD could decline towards 7.2800, but it is unlikely to break below this major support level. Resistance is at 7.3050; a breach of 7.3105 would indicate that the decline in USD has stabilised.
Next 1-3 weeks: Our latest narrative was from last Thursday (21 Sep, spot at 7.3150), wherein the recent downward pressure has faded, and USD is likely to trade in a range, probably between 7.2800 and 7.3400. Yesterday, USD fell sharply by 0.41% (NY close of 7.2915). Downward momentum is beginning to build. However, USD has to break and stay below 7.2800 before a sustained decline is likely. Looking ahead, if USD breaks clearly below 7.2800, it could trigger a rapid drop towards 7.2600, potentially below this level. Conversely, if USD breaks the ‘strong resistance’ at 7.3200, it is likely to continue to trade in a range
Euro area inflation is slowing down. The doves at the ECB will take a positive view of today's consumer price data, economists at Commerzbank report.
Euro area inflation falls significantly
Euro area inflation fell sharply by 0.9 percentage points to 4.3% in September. Excluding the volatile prices of energy, food, alcohol and tobacco, inflation also fell from 5.3% to 4.5%.
Admittedly, almost half of the decline is due to one-off effects such as the expiry of the 9-Euro ticket in Germany in September 2022. But even after adjusting for these effects, the core rate is now also on a downward trend. A majority of the members of the ECB's Governing Council should be pleased with this.
The ECB is unlikely to raise rates any further.
- Gold price attracts bids below $1,860.00 after a mild correction in the US Dollar.
- The US economy remains resilient due to falling inflation, stable labor demand, and robust consumer spending.
- Fed Kashkari said that current interest rates are not sufficiently restrictive to bring down inflation to 2%.
Gold price (XAU/USD) bounced back after a four-day losing spell as the US Dollar struggled to extend its recovery on Friday, ahead of the US Core Personal Consumption Expenditure (PCE) Price Index data for August. Still, the upward move in the precious metal is likely to be short-lived as Federal Reserve (Fed) policymakers look set for one more interest rate increase by the year-end amid a resilient US economy and persistent inflation pressures.
The US economy has been performing well on the grounds of inflation, labor market, and consumer spending but factory activity is still a concern for the authorities amid a poor demand outlook. Investors will keenly focus on the Manufacturing PMI report for September, which will be published on Monday, for further clues about the current health of the factory sector. Markets expect the PMI data to signal that factory activity contracted for the 11th consecutive month.
Daily Digest Market Movers: Gold price finds support as US Dollar corrects
- Gold price attempts a recovery after defending the crucial support of $1,860.00 as the US Dollar faces profit-booking ahead of the US Core PCE Price Index data for August, which will be published at 12:30 GMT.
- Investors expect core PCE to grow at a steady pace of 0.2%, while the annual reading is seen softening to 3.9% from July’s 4.2%.
- A softer-than-anticipated reading for the Fed’s preferred inflation gauge may increase traders’ bets for interest rates to stay unchanged for the remainder of the year.
- Recently, the odds for interest rates remaining steady at 5.25%-5.50% were trimmed as Fed policymakers delivered hawkish remarks and Durable Goods Orders surprisingly expanded in August.
- On Wednesday, Minneapolis Federal Reserve Bank President Neel Kashkari said that he is unsure whether the central bank has hiked enough to bring down core inflation to 2%.
- Meanwhile, Richmond Fed Bank President Thomas Barkin advocated for a ‘wait and watch’ approach as a probable government shutdown could complicate the Fed’s ability to assess the state of the economy due to the possible interruption of economic data releases.
- US Durable Goods Orders for August unexpectedly rose by 0.2% against expectations of a 0.5% decline. In July, Orders contracted by a sharp 5.6%. The US Manufacturing PMI has been contracting for the past 10 months. Still, upbeat order data for equipment has improved the sector’s outlook.
- As per the CME Group Fedwatch tool, chances that interest rates will remain steady at 5.25%-5.50% at the November monetary policy meeting have recovered to 83% from 77% on Thursday. Traders see a 66% chance for interest rates remaining unchanged for the remainder of the year, up from 58% on Thursday.
- While the recovery in energy prices could have a temporary impact on US inflation, rising house rentals could keep inflation sticky. Fed’s Barkin said on Thursday that housing will be key to tracking the progress towards taming inflation in the next few quarters, with risks that rising home prices could also boost market rents.
- The US Dollar Index (DXY) faces selling pressure near a fresh 10-month high at 106.80 as the risk-aversion theme loses momentum. Still, the odds for a recovery are high as the US economy appears to be handling higher interest rates while other economies are struggling.
- The US economy has been showing a resilient labor market, household demand, and decreasing inflation. Still, its manufacturing sector has been contracting consistently for the past 10 months, according to PMI data.
- After US PCE Price Index data, investors will shift their focus to the Manufacturing PMI report for September, to be released by the Institute of Supply Management (ISM) on Monday.
- The US Manufacturing PMI is seen improving to 47.8 from August’s reading of 47.6 but will remain below the 50.0 threshold which signals a contraction in activity. This would be the 11th month of contraction in a row.
Technical Analysis: Gold price attempts recovery near $1,860
Gold price finds an interim support after printing a fresh six-month low below $1,860.00. The four-day losing spell in Gold price appears to have halted, but for a sustained recovery the asset has to recapture the crucial resistance at $1,900.00. The broader bias remains bearish as the 20-day and 200-day Exponential Moving Averages (EMAs) have delivered a bear cross. A bounce-back move in the precious metal is also backed by oversold momentum oscillators.
Fed FAQs
What does the Federal Reserve do, how does it impact the US Dollar?
Monetary policy in the US is shaped by the Federal Reserve (Fed). The Fed has two mandates: to achieve price stability and foster full employment. Its primary tool to achieve these goals is by adjusting interest rates.
When prices are rising too quickly and inflation is above the Fed’s 2% target, it raises interest rates, increasing borrowing costs throughout the economy. This results in a stronger US Dollar (USD) as it makes the US a more attractive place for international investors to park their money.
When inflation falls below 2% or the Unemployment Rate is too high, the Fed may lower interest rates to encourage borrowing, which weighs on the Greenback.
How often does the Fed hold monetary policy meetings?
The Federal Reserve (Fed) holds eight policy meetings a year, where the Federal Open Market Committee (FOMC) assesses economic conditions and makes monetary policy decisions.
The FOMC is attended by twelve Fed officials – the seven members of the Board of Governors, the president of the Federal Reserve Bank of New York, and four of the remaining eleven regional Reserve Bank presidents, who serve one-year terms on a rotating basis.
What is Quantitative Easing (QE) and how does it impact USD?
In extreme situations, the Federal Reserve may resort to a policy named Quantitative Easing (QE). QE is the process by which the Fed substantially increases the flow of credit in a stuck financial system.
It is a non-standard policy measure used during crises or when inflation is extremely low. It was the Fed’s weapon of choice during the Great Financial Crisis in 2008. It involves the Fed printing more Dollars and using them to buy high grade bonds from financial institutions. QE usually weakens the US Dollar.
What is Quantitative Tightening (QT) and how does it impact the US Dollar?
Quantitative tightening (QT) is the reverse process of QE, whereby the Federal Reserve stops buying bonds from financial institutions and does not reinvest the principal from the bonds it holds maturing, to purchase new bonds. It is usually positive for the value of the US Dollar.
Gold has hit its lowest levels since March. Economists at ANZ Bank analyze the yellow metal’s outlook.
Favorable rate differentials in the US should keep the USD on a strong footing
Increasing conviction around narrative of ‘higher for longer rates’ is tarnishing the investment appeal of Gold in the near term.
Favorable rate differentials in the US should keep the USD on a strong footing. Nevertheless, we see strategic buying emerging around $1,850 as long-term drivers remain in place.
See – Gold Price Forecast: XAU/USD could drop into the low $1,800s – TDS
- USD/JPY finds support near 148.50 despite rising odds of BoJ’s intervention due to excessive volatile moves.
- S&P500 futures added significant gains, portraying an improvement in appeal for risk-sensitive assets.
- Investors will focus on the US core PCE inflation data for August, which will shape November’s monetary policy.
The USD/JPY pair attracts bids near 148.50 and rebounds strongly in the European session. The asset finds cushion despite hopes of a stealth intervention by the Bank of Japan (BoJ) in the FX domain to support the Japanese Yen against excessive volatility.
Unlike other developed economies, the Japanese Yen is struggling for a firm footing despite a correction in the US Dollar. The Japanese Yen fails to find support as the BoJ continues to support an easy monetary policy until the achievement of the 2% inflation target. This week, BoJ Governor Kazuo Ueda cited that it would be premature to discuss an exit from the ultra-loose monetary policy as inflation above 2% is not governed by wage growth.
The pair rebounds despite expectations of BoJ’s intervention near the psychological resistance of 150.00. Japanese Finance Minister Shunichi Suzuki reiterated on Thursday, he won't rule out any steps to respond if there's any excessive FX volatility. He further added the authority is closely watching FX's moves with a sense of urgency.
S&P500 futures added significant gains in the London session, portraying an improvement in the appeal for risk-sensitive assets. The US Dollar Index (DXY) extends its correction to near 105.70 as the risk appetite of the market participants improves.
Going forward, investors will focus on the United States core Personal Consumption Expenditure (PCE) inflation data for August, which will shape November’s monetary policy. As per estimates, the monthly core Personal Consumption Expenditure (PCE) price index is expected to maintain a steady pace of 0.2%. The annualized data is foreseen decelerating to 3.9% vs. July’s reading of 4.2%.
- USD/JPY hovers around 149.00 psychological level ahead of US Core PCE.
- Momentum indicators suggest a potential bullish sentiment in the market.
- 14-day EMA emerges as the key support, following the 23.6% Fibonacci retracement.
USD/JPY extends its losses on the second successive day, trading lower around 149.00 psychological level during the European trading session on Friday.
The pair faces a challenge due to the correction in the US Dollar (USD), which could be attributed to the pullback in the US Treasury yields.
The 14-day Exponential Moving Average (EMA) at 148.36 could act as key support, following the 21-day EMA at 147.87.
A firm break could influence the USD/JPY bears to navigate the area around the 23.6% Fibonacci retracement at 146.76, followed by the 146.00 psychological level.
The current upward momentum in USD/JPY appears to have a bullish bias, given that the 14-day Relative Strength Index (RSI) remains above the 50 level.
However, there is a resistance region around the monthly high at 149.70, followed by the 150.00 psychological level that may pose a challenge for further gains.
The Moving Average Convergence Divergence (MACD) indicator is providing a strong signal for the USD’s buyers. The MACD line lies above the centerline and the signal line. This configuration suggests that there is potentially strong momentum in the USD/JPY's price movement.
USD/JPY: Daily Chart
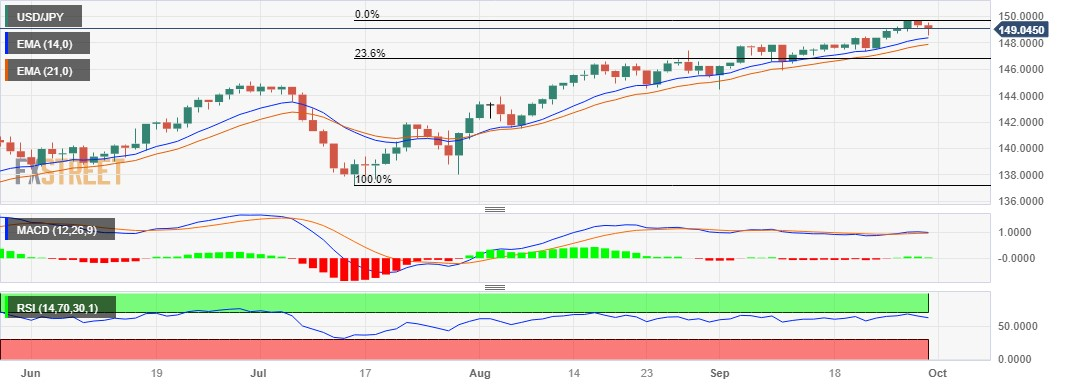
Economists at Wells Fargo discuss Turkish Lira (TRY) outlook.
Sentiment toward Türkiye can improve
To be clear, we still forecast a weaker Turkish currency over the course of our forecast horizon; however, we have scaled back the magnitude of that depreciation to reflect improving and more orthodox trends in policy.
After 21.50 percentage points of tightening, we are more confident that the direction of policy will be sustained and that sentiment toward Türkiye can improve, and foreign investor capital can follow in the near future.
We also believe credit rating agencies such as Moody's, S&P and Fitch may be close to upgrading Türkiye's sovereign credit rating, or at a minimum, revising outlooks to ‘positive,’ given the latest developments.
The story surrounding Türkiye is not quite outright positive just yet, and local political and geopolitical risks remain, but should the latest trends continue and credit rating revisions materialize, we could revise TRY forecasts as well.
USD/TRY – Q4-2023 28.50 Q1-2024 29.00 Q2-2024 29.00 Q3-2024 29.50 Q4-2024 30.00 Q1-2025 30.50
- HICP inflation in the Eurozone fell at a stronger pace than expected in September.
- EUR/USD clings to daily gains at around 1.0600.
Inflation in the Eurozone, as measured by the change in the Harmonzied Index of Consumer Prices, declined to 4.3% on a yearly basis in September from 5.2% in August. This reading came in below the market expectation of 4.5%. On a monthly basis, the HICP rose 0.3%, compared to the 0.5% increase recorded in August.
The annual Core HICP inflation, which excludes the prices of volatile items such as food and energy, fell to 4.5% from 5.3% in the same period.
Market reaction
The Euro preserves its strength despite soft inflation data from the Euro area. As of writing, EUR/USD was up 0.45% on the day at 1.0605.
Euro price today
The table below shows the percentage change of Euro (EUR) against listed major currencies today. Euro was the strongest against the US Dollar.
| USD | EUR | GBP | CAD | AUD | JPY | NZD | CHF | |
| USD | -0.43% | -0.25% | -0.32% | -0.88% | -0.21% | -1.08% | -0.58% | |
| EUR | 0.43% | 0.18% | 0.12% | -0.48% | 0.21% | -0.65% | -0.15% | |
| GBP | 0.25% | -0.18% | -0.08% | -0.62% | 0.04% | -0.83% | -0.33% | |
| CAD | 0.33% | -0.13% | 0.08% | -0.58% | 0.12% | -0.75% | -0.25% | |
| AUD | 0.87% | 0.44% | 0.58% | 0.57% | 0.68% | -0.21% | 0.29% | |
| JPY | 0.21% | -0.20% | -0.02% | -0.10% | -0.63% | -0.87% | -0.36% | |
| NZD | 1.05% | 0.64% | 0.84% | 0.74% | 0.21% | 0.83% | 0.50% | |
| CHF | 0.57% | 0.15% | 0.33% | 0.27% | -0.29% | 0.36% | -0.50% |
The heat map shows percentage changes of major currencies against each other. The base currency is picked from the left column, while the quote currency is picked from the top row. For example, if you pick the Euro from the left column and move along the horizontal line to the Japanese Yen, the percentage change displayed in the box will represent EUR (base)/JPY (quote).
Once the quarter-end adjustments are past us, the overall environment should favour another leg higher in the Dollar, economists at ING report.
Room for a rebound
Despite the treasury sell-off and strong US data, the Dollar has entered a correction, probably due to quarter-end flows. With personal spending and PCE figures potentially topping expectations today, we look for a USD restrengthening.
We could see a hawkish repricing in rate expectations coming to the Dollar’s help today, and we are bullish on the Greenback today.
A return to the 106.50/107.00 area in DXY in the near term seems plausible in the current market conditions.
See – US Core PCE Preview: Forecasts from seven major banks, losing speed
- USD/MXN recovers from the winning streak on the back of the downbeat US Dollar.
- Banxico maintained its current interest rates at 11.25%.
- Downbeat US Treasury yields are putting pressure on the Greenback.
USD/MXN retraces the winning streak that began on Monday, trading lower around 17.4480 during the European session on Friday. The pair faces downward pressure due to the correction in the US Dollar (USD).
The US Dollar Index (DXY) continues to weaken, which could be attributed to the pullback in US Treasury yields. The spot price bids lower around 105.80. The yield on the 10-year US Treasury bond stands at 4.54% by the press time.
The US Gross Domestic Product (GDP) remained steady at 2.1%, aligning with expectations. Initial Jobless Claims for the week ending on September 22 improved to 204K, a slight decrease from the previous 202K but fell short of the anticipated 215K.
US Pending Home Sales recorded a notable decline of 7.1%, surpassing the market expectation of a 0.8% fall. This decline contrasts with the previous 0.9% rise and highlights a significant swing in the housing market.
Chicago Fed President Austan Goolsbee has expressed confidence in the Federal Reserve's (Fed) ability to bring inflation back to its target. Goolsbee emphasized the unique opportunity to achieve this without a recession, underscoring the Fed's commitment to managing inflation while sustaining economic growth.
Richmond Fed President Thomas Barkin acknowledged that recent inflation data has been positive but cautioned that it is too early to predict the future course of monetary policy.
Traders await the release of the US Core Personal Consumption Expenditure (PCE) Price Index, the Fed's preferred measure of consumer inflation, scheduled for Friday. The anticipated reduction in the annual rate from 4.2% to 3.9% will be closely watched by market participants for its potential impact on the US Dollar.
On Mexico’s side, the Mexican Peso (MXN) received upward support as the Banco de México (Banxico) maintained its restrictive monetary policy stance in Thursday's meeting.
Mexico’s central bank kept interest rates unchanged at 11.25%, following the upward revision of its inflation forecasts. However, Mexico’s Jobless Rate (MoM) for August edged lower from 3.1% in July to 3.0%.
CNY recently weakened to levels last seen in December 2007. Economists at ANZ Bank analyze Yuan’s outlook.
CNY to recover later in the year
We see CNY weakness as largely cyclical and expect the currency to recover later in the year once we get clearer signs that China’s growth is starting to recover. A more meaningful rebound, however, will require US bond yields to decline, which is still some way off given the resilience of the US economy.
We are only looking for a modest recovery in CNY to 7.25 by year-end.
- Silver gains strong positive traction on Friday and recovers further from a two-week low.
- The mixed technical setup warrants some caution before positioning for any further gains.
- The $22.70 region should now act as a strong support and a key pivotal point for traders.
Silver builds on the previous day's bounce from a support marked by an ascending trend line extending from the June swing low, around the $22.40-$22.35 area, or a two-week low, and scales higher for the second successive day on Friday. The strong intraday move up lifts the white metal to a four-day high during the early European session, albeit stalls near the $23.05-$23.10 confluence hurdle.
Technical indicators on the daily chart, meanwhile, are yet to confirm a near-term positive outlook. Moreover, the Relative Strength Index (RSI) on the daily chart is already flashing overbought conditions and capping the XAG/USD. This makes it prudent to wait for a sustained strength beyond the aforementioned barrier, comprising the 200-hour Simple Moving Average (SMA) and the 50% Fibonacci retracement level of the downfall witnessed over the past week or so, before placing fresh bullish bets.
The XAG/USD might then aim to surpass the $23.20-$23.25 resistance and challenge the very important 200-day SMA, around the $23.45 region. This is followed by last week's swing high, around the $23.75 area, above which the momentum could get extended towards the $24.00 round figure en route to the $24.30-$24.35 hurdle. Some follow-through buying should pave the way for a further appreciating move and allow bulls to reclaim the $25.00 psychological mark.
On the flip side, any meaningful corrective slide might now find decent support near the $22.70 area or the 23.6% Fibo. level, below which the XAG/USD could slide to the aforementioned trend-line support, around the $22.40-$22.35 region. A convincing break below the latter will be seen as a fresh trigger for bearish traders and make Silver vulnerable to weaken further below the $22.00 mark. The downward trajectory could get extended towards the $21.25 intermediate support before the white metal eventually drops to the $21.00 level.
Silver 1-hour chart
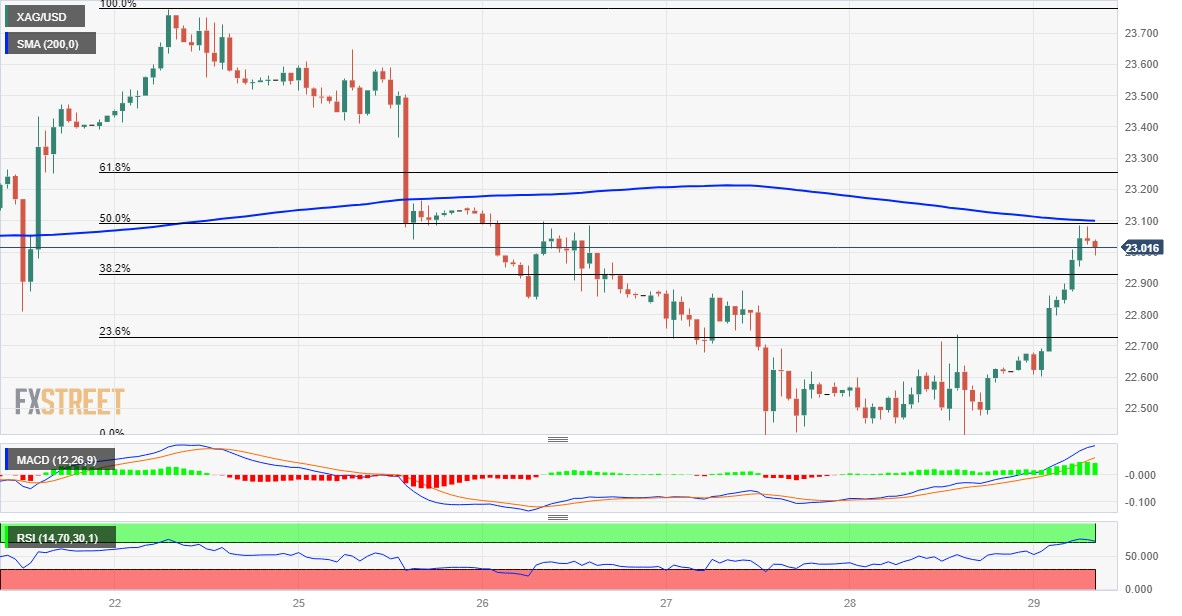
Technical levels to watch
Germany Unemployment Change below expectations (15K) in August: Actual (10K)..
FX option expiries for September 29 NY cut at 10:00 Eastern Time, via DTCC, can be found below.
- EUR/USD: EUR amounts
- 1.0500 1.7b
- 1.0550 593m
- 1.0570 520m
- 1.0575 503m
- 1.0600 3.8b
- 1.0650 1.4b
- 1.0675 430m
- 1.0690 544m
- 1.0700 2.3b
- 1.0715 967m
- GBP/USD: GBP amounts
- 1.2250 325m
- 1.2300 411m
- 1.2400 592m
- USD/JPY: USD amounts
- 147.00 2b
- 149.00 1.3b
- 151.50 478m
- USD/CHF: USD amounts
- 0.9040 617m
- 0.9100 600m
- 0.9125 410m
- 0.9150 480m
- AUD/USD: AUD amounts
- 0.6380 775m
- 0.6500 734m
- 0.6600 550m
- USD/CAD: USD amounts
- 1.3400 401m
- 1.3500 836m
- 1.3600 369m
- NZD/USD: NZD amounts
- 0.6000 365m
- EUR/GBP: EUR amounts
- 0.8640 770m
- The Euro advances further vs. the US Dollar.
- Stocks in Europe open with generalized gains on Friday.
- EUR/USD surpasses 1.0600 and prints four-day highs.
- The USD Index (DXY) extend the rejection from recent 2023 peaks.
- Germany reported a firm labour market report.
- US inflation tracked by the PCE, final Consumer Sentiment are due next.
The Euro (EUR) manages to gather extra steam vs. the US Dollar (USD), motivating EUR/USD to retake the key 1.0600 hurdle and beyond at the end of the week.
In the meantime, the Greenback continues to correct lower from recent yearly peaks around 106.80 and breaches the 106.00 support with marked conviction when tracked by the USD Index (DXY). The dollar’s pullback is also accompanied by some improvement in the risk complex and rising jitters around a potential US federal government shutdown as soon as this weekend.
The recovery in the pair also comes amidst some loss of momentum in US and German yields after hitting multi-year tops earlier in the week.
The monetary policy outlook remains unchanged, with investors still factoring in the anticipation of a 25 bps interest rate hike by the Federal Reserve (Fed) before the year concludes. Meanwhile, discussions in the market persist regarding a potential impasse in policy adjustments at the European Central Bank (ECB), despite inflation levels that exceed the bank's target and mounting concerns about a potential recession.
In the euro calendar, Retail Sales in Germany contracted 2.3% YoY in August, while the Unemployment Change increased by 10K individuals in September and the Unemployment Rate held steady at 5.7% in the same period. Later in the session, the flash Inflation Rate in the broader euro area will be in the spotlight.

Across the pond, inflation gauged by the PCE and Core PCE will take centre stage along with Personal Income, Personal Spending, flash Goods Trade Balance and the final print of the Michigan Consumer Sentiment.
Daily digest market movers: Euro grabs some breathing room on USD selling
- The EUR bounces off eight-month lows vs. the USD.
- US and German yields extend the corrective decline so far on Friday.
- Investors keep pricing in another rate raise by the Fed before year-end.
- Markets expect a pause at the ECB’s hiking cycle.
- UK Q2 GDP figures surprise to the upside.
- Intervention concerns persist as USD/JPY targets the 150.00 barrier.
Technical Analysis: Downside pressure should alleviate above 1.0830
EUR/USD extends the recovery to the area beyond 1.0600 the figure on Friday, managing at the same time to bounce off the oversold zone.
In case the recovery in EUR/USD becomes more serious, the pair should meet the next up-barrier at the weekly high of 1.0767 (September 12), prior to the key 200-day SMA at 1.0828. Should the pair surpass this level, it may pave the way for a test of the transitory 55-day SMA at 1.0855 ahead of the weekly top at 1.0945 (August 30) and the psychological hurdle of 1.1000. If the pair clears the latter, it could then challenge the August peak of 1.1064 (August 10) before the weekly peak at 1.1149 (July 27) and the 2023 high of 1.1275 (July 18).
On the downside, there is immediate contention at the September low of 1.0491 (September 28) seconded by the 2023 low of 1.0481 (January 6).
However, it's essential to bear in mind that as long as the EUR/USD remains below the 200-day SMA, the potential for ongoing downward pressure persists.
Euro FAQs
What is the Euro?
The Euro is the currency for the 20 European Union countries that belong to the Eurozone. It is the second most heavily traded currency in the world behind the US Dollar. In 2022, it accounted for 31% of all foreign exchange transactions, with an average daily turnover of over $2.2 trillion a day.
EUR/USD is the most heavily traded currency pair in the world, accounting for an estimated 30% off all transactions, followed by EUR/JPY (4%), EUR/GBP (3%) and EUR/AUD (2%).
What is the ECB and how does it impact the Euro?
The European Central Bank (ECB) in Frankfurt, Germany, is the reserve bank for the Eurozone. The ECB sets interest rates and manages monetary policy.
The ECB’s primary mandate is to maintain price stability, which means either controlling inflation or stimulating growth. Its primary tool is the raising or lowering of interest rates. Relatively high interest rates – or the expectation of higher rates – will usually benefit the Euro and vice versa.
The ECB Governing Council makes monetary policy decisions at meetings held eight times a year. Decisions are made by heads of the Eurozone national banks and six permanent members, including the President of the ECB, Christine Lagarde.
How does inflation data impact the value of the Euro?
Eurozone inflation data, measured by the Harmonized Index of Consumer Prices (HICP), is an important econometric for the Euro. If inflation rises more than expected, especially if above the ECB’s 2% target, it obliges the ECB to raise interest rates to bring it back under control.
Relatively high interest rates compared to its counterparts will usually benefit the Euro, as it makes the region more attractive as a place for global investors to park their money.
How does economic data influence the value of the Euro?
Data releases gauge the health of the economy and can impact on the Euro. Indicators such as GDP, Manufacturing and Services PMIs, employment, and consumer sentiment surveys can all influence the direction of the single currency.
A strong economy is good for the Euro. Not only does it attract more foreign investment but it may encourage the ECB to put up interest rates, which will directly strengthen the Euro. Otherwise, if economic data is weak, the Euro is likely to fall.
Economic data for the four largest economies in the euro area (Germany, France, Italy and Spain) are especially significant, as they account for 75% of the Eurozone’s economy.
How does the Trade Balance impact the Euro?
Another significant data release for the Euro is the Trade Balance. This indicator measures the difference between what a country earns from its exports and what it spends on imports over a given period.
If a country produces highly sought after exports then its currency will gain in value purely from the extra demand created from foreign buyers seeking to purchase these goods. Therefore, a positive net Trade Balance strengthens a currency and vice versa for a negative balance.
GBP/USD has climbed above 1.2200 while EUR/GBP has dropped below 0.87. Economists at ING analyze Sterling’s outlook.
Chance of a further correction in EUR/GBP
GBP/USD has rallied in line with the Dollar correction but there are no real UK-specific drivers that would justify a sustained GBP outperformance at this stage.
EUR/GBP has eased back from the 0.8700 level, in line with our expectations, after the turmoil in Italian bonds and given the big bulk of dovish Bank of England repricing had already happened. There is probably still additional room for a correction in EUR/GBP should Italian spreads keep widening.
- Pound Sterling finds buying interest while UK recession risks remain intact.
- UK Manufacturing PMI is expected to contract for the 14th time in a row.
- UK’s real estate inquiries increase as households see no more increase in mortgage rates.
The Pound Sterling (GBP) discovers stellar buying interest as investors digest upside risks to a recession in the United Kingdom. The GBP/USD pair rebounds meaningfully as market participants start admitting that the British economy has no other option than to operate with higher interest rates by the Bank of England (BoE) due to a hot-inflation environment. The strength in the Pound Sterling also came from a corrective move in the US Dollar.
After contracting for 13 months in a row, the UK’s Manufacturing PMI is expected to continue the declining spell as the BoE is quite clear about keeping interest rates higher long enough for inflation to come down to 2%.
Daily Digest Market Movers: Pound Sterling capitalizes on gradual correction in US Dollar
- Pound Sterling extends recovery to near 1.2220, supported by a gradual correction in the US Dollar as the risk-aversion theme loses resilience.
- The GBP/USD pair recovers after printing a fresh six-month low near 1.2100 as investors digest potential United Kingdom recession risks.
- The UK economy is exposed to the risk of a recession as labor market conditions have cooled down after corporations turned pessimistic about demand.
- Britain’s manufacturing and service sectors are facing the wrath of higher interest rates by the Bank of England (BoE). After a dismal Manufacturing PMI, the Services PMI also slipped into the contraction phase as households struggled to bear the burden of high inflation.
- The strength in the Pound Sterling also came from increasing queries about real estate as homebuyers think the BoE is done with hiking interest rates. The UK’s property website Zoopla said the volume of inquiries for new homes rose by 12% over the past four weeks.
- Lloyd Bank Business Barometer reported on Thursday that British business confidence fell to 36% in September from August's reading of 41%, which was an 18-month high.
- Hann-Ju Ho, senior economist at Lloyds Bank Commercial Banking, clarified that the survey was conducted before BoE’s unchanged interest rate decision, which should have boosted confidence among employers. However, he warned that the economic environment remains uncertain with inflation and interest rate pressures playing their part. The recent decision by the central bank is likely to help businesses feel more upbeat about the future.
- Meanwhile, the UK’s National Statistics Office reported the final reading of real Gross Domestic Product (GDP) reading on Friday at 06:00 GMT. The real GDP remained in line with the previous estimate of 0.2% and 0.6% on a quarterly and annualized basis.
- Next week, investors will keenly focus on the S&P Global Manufacturing PMI report for September. UK factory activities are expected to continue remaining on a contracting trajectory for the 14th time in a row. A figure below the 50.0 threshold is considered a contraction in economic activities. The economic data is seen unchanged at 44.2.
- Investors’ risk-taking ability improves as the fourth quarter of 2023 begins, but upside risks to a global slowdown remain intact.
- The US Dollar is off from a 10-month high ahead of the Federal Reserve’s (Fed) preferred inflation gauge. As per estimates, the monthly core Personal Consumption Expenditure (PCE) price index is expected to maintain a steady pace of 0.2%. The annualized data is foreseen decelerating to 3.9% vs. July’s reading of 4.2%.
- Meanwhile, US labor market conditions are improving as US weekly Jobless Claims for the week ending September 22 were better than expectations. The US Department of Labor reported that individuals claiming jobless claims for the first time increased by 2K to 204K from the previous week’s release but remained lower than expectations of 215K.
Technical Analysis: Pound Sterling recovers strongly to near 1.2220
The Pound Sterling jumped close to 1.2220 after a breakout of the Bearish Wedge chart pattern formed in a smaller time frame. The GBP/USD pair recovered strongly and is expected to move to near the round-level resistance of 1.2300. A steady recovery in the Cable was propelled by oversold momentum oscillators. However, the broader trend is still bearish as all short-to-long-term Exponential Moving Averages (EMAs) are declining.
BoE FAQs
What does the Bank of England do and how does it impact the Pound?
The Bank of England (BoE) decides monetary policy for the United Kingdom. Its primary goal is to achieve ‘price stability’, or a steady inflation rate of 2%. Its tool for achieving this is via the adjustment of base lending rates. The BoE sets the rate at which it lends to commercial banks and banks lend to each other, determining the level of interest rates in the economy overall. This also impacts the value of the Pound Sterling (GBP).
How does the Bank of England’s monetary policy influence Sterling?
When inflation is above the Bank of England’s target it responds by raising interest rates, making it more expensive for people and businesses to access credit. This is positive for the Pound Sterling because higher interest rates make the UK a more attractive place for global investors to park their money. When inflation falls below target, it is a sign economic growth is slowing, and the BoE will consider lowering interest rates to cheapen credit in the hope businesses will borrow to invest in growth-generating projects – a negative for the Pound Sterling.
What is Quantitative Easing (QE) and how does it affect the Pound?
In extreme situations, the Bank of England can enact a policy called Quantitative Easing (QE). QE is the process by which the BoE substantially increases the flow of credit in a stuck financial system. QE is a last resort policy when lowering interest rates will not achieve the necessary result. The process of QE involves the BoE printing money to buy assets – usually government or AAA-rated corporate bonds – from banks and other financial institutions. QE usually results in a weaker Pound Sterling.
What is Quantitative tightening (QT) and how does it affect the Pound Sterling?
Quantitative tightening (QT) is the reverse of QE, enacted when the economy is strengthening and inflation starts rising. Whilst in QE the Bank of England (BoE) purchases government and corporate bonds from financial institutions to encourage them to lend; in QT, the BoE stops buying more bonds, and stops reinvesting the principal maturing on the bonds it already holds. It is usually positive for the Pound Sterling.
- Crude oil prices struggle to retrace the recent losses ahead of US Core PCE.
- Russia will maintain its ban on petroleum exports until the domestic market stabilizes.
- US Dollar weakens due to downbeat US Treasury yields.
Crude oil prices struggle to recover from recent losses due to market caution on the Fed’s interest rates trajectory, which impacts economic activities. The higher interest costs raise borrowing costs, which can affect the demand for Crude oil.
Western Texas Intermediate (WTI), the US crude oil benchmark trades around $90.90 per barrel during the early European session on Friday.
American Petroleum Institute (API) reported on Wednesday that US crude oil inventories increased by 1.586M barrels for the week ending September 22, swinging from the previous decline of 5.250M barrels.
EIA Crude Oil Stocks Change data on the week ending September 22 showed that stocks decreased by 2.170 million barrels compared with the 2.135 million drawdowns seen a week earlier. Markets expected Oil stockpiles to decline by a much lesser 0.32 million barrels.
Crude oil prices experienced a significant surge over the week, reaching levels that surpass one-year highs. This upward movement is attributed to ongoing signs of a tightening global supply by Saudi Arabia and Russia.
Russia has announced that its ban on petroleum exports will be maintained until the domestic market stabilizes. Moreover, there has been no discussion with OPEC+ regarding a potential increase in supply to offset this export ban.
Additionally, the sense of optimism regarding an economic recovery in China, the largest oil importer globally, could support the demand for liquid gold.
The US Dollar Index (DXY) continues to weaken, trading lower around 105.80. The volatility in US yields could affect the Greenback. The yield on the 10-year US Treasury bond stands at 4.54%.
US Gross Domestic Product (GDP) remained consistent at 2.1% as expected. Initial Jobless Claims for the week ending on September 22, improved to 204K from the 202K prior, falling short of the 215K expected.
US Pending Home Sales showed a decline of 7.1%, exceeding the market expectation of a 0.8% fall, swinging from the 0.9% rise previously.
Chicago Fed President Austan Goolsbee has expressed confidence in the Federal Reserve's (Fed) ability to bring inflation back to its target. Goolsbee also highlighted the unique opportunity to achieve this without a recession, emphasizing the Fed's commitment to managing inflation while sustaining economic growth.
Moreover, Richmond Fed President Thomas Barkin noted that recent inflation data has been positive but cautioned that it is too early to predict the future course of monetary policy.
Traders await the release of the US Core Personal Consumption Expenditure (PCE) Price Index, the Fed's preferred measure of consumer inflation, scheduled for Friday. The anticipated reduction in the annual rate from 4.2% to 3.9% will be closely watched by market participants for its potential impact on the US Dollar.
Ulrich Leuchtmann, Head of FX and Commodity Research at Commerzbank, analyzes US data and their effect on USD exchange rates.
Some traders clearly were not comfortable with EUR/USD levels below 1.05
Thursday’s correction of USD strength developed quite independently of the data publications. Some traders clearly were not comfortable with EUR/USD levels below 1.05 and the data did not change that significantly. Of course, this does not point towards a trend reversal, not even towards a complete end of the USD rally. Because the prospect of a soft landing of the US economy was only questioned very marginally.
Because the market has bet so clearly on a soft landing, I assume that the USD exchange rates will react particularly sensitively to data that does not confirm this view.
Further advance in USD/JPY remains in the pipeline while above the 148.50 level, suggest UOB Group’s Markets Strategist Quek Ser Leang and Senior FX Strategist Peter Chia.
Key Quotes
24-hour view: We indicated yesterday that “the bias for USD remains on the upside, but 150.00 is likely out of reach.” We also indicated that “the upside bias will fade if USD breaks below 149.05”. USD did not rise further but traded sideways between 149.13 and 149.66. Further sideways trading appears likely, probably between 149.05 and 149.70.
Next 1-3 weeks: Our update from yesterday (28 Sep, spot at 149.45) is still valid. As highlighted, USD could advance further to 150.00 if it stays above 148.55 (no change in ‘strong support’ level from yesterday). If USD breaks below 148.55, it means that the USD advance that started early this week has ended.
- The index adds to Thursday’s decline below 106.00.
- US yields also correct lower from recent multi-year tops.
- US PCE, Final Consumer Sentiment take centre stage.
The greenback, when tracked by the USD Index (DXY), adds to Thursday’s pullback and drops further south of the 106.00 support at the end of the week.
USD Index focused on US data
The index retreats for the second session in a row so far on Friday, coming under selling pressure after hitting 2023 peaks near 106.80 (September 27).
The move lower in the dollar comes in response to recent overbought conditions of the index (as per the daily RSI well past the 70 threshold), some profit taking and a mild recovery in the appetite for the risk complex.
Other than that, the monetary policy background remains unchanged, while concerns over the likelihood of a federal government shutdown also appears to be weighing on the greenback, as the September 30 deadline looms closer.
Interesting day in the US docket, as inflation tracked by the PCE and Core PCE will be in the limelight seconded by Personal Income, Personal Spending, advanced Goods Trade Balance and the final gauge of the Michigan Consumer Sentiment.
In addition, NY Fed John Williams (permanent voter, centrist) is due to speak.
What to look for around USD
The knee-jerk in the greenback appears to be gathering traction and already breaks below the 106.00 support on Friday.
In the meantime, support for the dollar keeps coming from the good health of the US economy, which at the same time appears underpinned by the renewed tighter-for-longer stance narrative from the Federal Reserve.
Key events in the US this week: PCE, Core PCE, Personal Income, Personal Spending, Advanced Goods Trade Balance, Final Michigan Consumer Sentiment (Friday).
Eminent issues on the back boiler: Persevering debate over a soft or hard landing for the US economy. Incipient speculation of rate cuts in early 2024. Geopolitical effervescence vs. Russia and China.
USD Index relevant levels
Now, the index is losing 0.33% at 107.77 and faces initial support at 104.42 (weekly low September 11) ahead of 103.09 (200-day SMA) and then 102.93 (weekly low August 30). On the other hand, a breakout of 106.83 (2023 high September 27) would open the door to 107.19 (weekly high November 30, 2022) and finally 107.99 (weekly high November 21 2022).
EUR/USD gathered recovery momentum and registered gains on Thursday before continuing to stretch higher toward 1.0600 on Friday. Economists at ING analyze the pair’s outlook.
Downside risks to EUR/USD today
A rebound in the Dollar, lingering concerns on Italian bonds (even if with a smaller intensity than in previous instances) and a decline in core inflation point to downside risks to EUR/USD today.
We expect the 1.0500 mark to be retested soon.
See: EUR/USD to move to 1.02 on a three-month view – Rabobank
- EUR/GBP meets with a fresh supply on Friday and trades just above the weekly low.
- The disappointing German macro data undermines the Euro and exerts some pressure.
- Traders now look to Lagarde's speech for some impetus ahead of the Eurozone CPI.
The EUR/GBP cross attracts fresh sellers near the 200-hour Simple Moving Average (SMA) on Friday and stalls the overnight rebound from the 0.8630 area, or a one-week low. Spot prices remain depressed, around mid-0.8600s during the early European session, though the mixed fundamental backdrop warrants caution before positioning for an extension of this week's rejection slide from the very important 200-day SMA.
The shared currency's relative underperformance on the last day of the week could be attributed to the disappointing German macro data, which, in turn, is seen exerting some pressure on the EUR/GBP cross. Retail Sales in Germany – the Eurozone's largest economy – unexpectedly fell for the second straight month, by 1.2% in August. Furthermore, the statistics office reported that the German Import Prices Index recorded the largest year-on-year decline since November 1986 and declined by 16.4% in August.
This comes on the back of the preliminary data from the federal statistics office on Thursday, which showed that the annualized German CPI moderated to the 4.8% YoY rate in September and signals the beginning of the end for the high inflation. Adding to this, speculations about a possible contraction in GDP during the second half of the year reaffirm bets that additional rate hikes by the European Central Bank (ECB) may be off the table for now. Hence, the market focus will remain glued to the ECB President
Christine Lagarde's speech.
Traders on Friday will further take cues from the flash Eurozone CPI print, which if surprises to the downside will reaffirm that the ECB's 14-month-long policy tightening cycle could have reached its peak and prompt fresh selling around the Euro. That said, the Bank of England's (BoE) surprise pause in its rate-hiking cycle earlier this month could undermine the British Pound (GBP) and limit losses for the EUR/GBP cross. Moreover, the fact that the UK central bank provided little hints of its intention to raise rates any further warrants caution for bears.
Technical levels to watch
CME Group’s flash data for natural gas futures markets noted traders added nearly 11K contracts to their open interest positions following four consecutive daily drops on Thursday. On the other hand, volume shrank for the second straight session, this time by around 11.2K contracts.
Natural Gas: Another visit to $3.00 is just around the corner
Prices of natural gas extended their sharp weekly rebound on Thursday. The move was amidst increasing open interest and leaves the door open to another potential test of the key resistance zone around the $3.00 mark per MMBtu in the very near term.
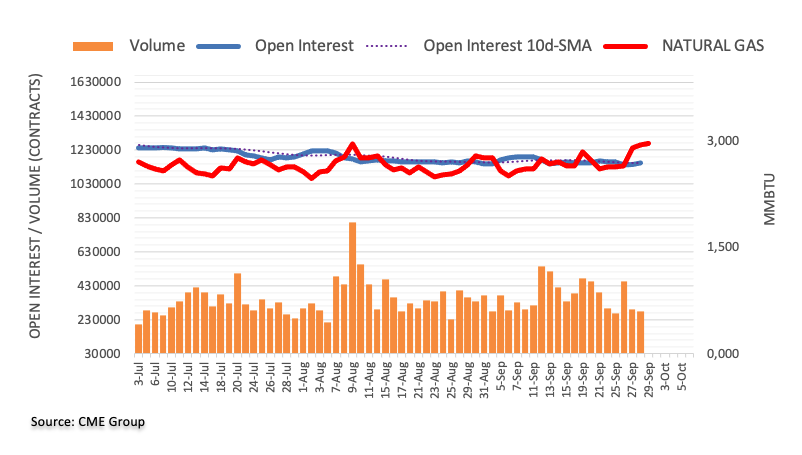
- The Core Personal Consumption Expenditures Price Index is forecast to rise 0.2% MoM and 3.9% YoY in August.
- The Federal Reserve’s Summary of Economic Projections pointed to one more rate hike in 2023.
- A soft PCE reading could weaken the US Dollar.
The Core Personal Consumption Expenditures (PCE) Price Index, the US Federal Reserve’s (Fed) preferred inflation gauge, will be released by the US Bureau of Economic Analysis at 12:30 GMT.
What to expect in the Federal Reserve’s preferred PCE inflation report?
The Core Personal Consumption Expenditures (PCE) Price Index, which excludes food and energy, is forecast to rise 0.2% in August on month, matching the increase recorded both in June and July. The annual Core PCE Price Index is seen rising 3.9%, at a softer pace than the 4.2% increase registered in July.
The headline PCE Price Index is expected to grow 0.5% MoM in August, while the annual PCE figure is anticipated to edge higher to 3.5% following the 3.3% increase recorded in July.
The revised Summary of Economic Projections (SEP) published after the September Fed policy meeting showed that policymakers forecast one more rate hike before the end of the year. On an encouraging note, officials forecast more progress on taming core inflation in 2023 than they saw in June projections. "[The] majority of policymakers believe it is more likely than not another rate hike will be appropriate," Fed Chairman Jerome Powell said in the post-meeting press conference.
Meanwhile, Fed Governor Michelle Bowman said that the continued risk of a further increase in energy prices could reverse some of the recent progress on lowering inflation.
Analysts at TD Securities offer their forecasts for the upcoming PCE data:
“We expect core PCE inflation to register a third consecutive 0.2% m/m increase in August; undershooting the core CPI's stronger 0.3% gain. The y/y rate likely also fell to 3.9%, while we expect the key core services ex-housing series to slow to 0.2% m/m following July's 0.5% surge. Conversely, we look for personal spending to lose speed, rising only 0.2% m/m — a three-month low.”
When will be the PCE inflation report released and how could it affect EUR/USD?
The PCE inflation report is due at 12:30 GMT. The CME Group FedWatch Tool shows that markets are still pricing in a 60% probability that the Fed will hold the policy rate steady for the remainder of the year. This market positioning suggests that the US Dollar (USD) faces a two-way risk heading into the event.
Generally, investors react to the monthly core PCE inflation reading since it’s not distorted by base effects and paints an accurate picture of the underlying inflation trend by stripping prices of volatile items. However, investors are growing increasingly concerned over rising energy prices since early summer because it makes it more difficult for the Fed to tame inflation. Hence, a higher-than-forecast increase in monthly PCE inflation could still provide a boost to the USD even if the Core PCE Price Index comes in line with the market consensus.
On the other hand, a soft monthly reading of 0.1%, or even lower, could hurt the USD with the immediate reaction. Since PCE inflation is a lagging data, however, investors might refrain from betting on a steady pullback in the USD. In September, crude Oil prices are up 10%, compared to the 2.2% advance seen in August, suggesting that investors are likely to wait until September inflation data before deciding whether the Fed will deliver one more rate increase before the end of the year.
FXStreet Analyst Eren Sengezer offers a brief technical outlook for EUR/USD and explains: “EUR/USD suffered heavy losses in the first half of the week and touched its lowest level since early January below 1.0500 before staging a rebound on Thursday. The Relative Strength Index (RSI) indicator on the daily chart climbed above 30, suggesting that the pair’s latest recovery was a technical correction rather than the beginning of a reversal. In the meantime, the pair remained within the descending regression channel coming from mid-July, confirming the bearish bias.”
Eren also highlights the important technical levels for EUR/USD: “On the upside, 1.0600 (upper limit of the descending channel) aligns as first resistance. If the pair manages to flip that level into support, 1.0660 (20-day Simple Moving Average (SMA), Fibonacci 23.6% retracement of the latest downtrend) could be set as the next recovery target before 1.0790-1.0800 (Fibonacci 38.2% retracement, psychological level). In case EUR/USD fails to clear 1.0660, sellers could retain control. In that scenario, supports could be seen at 1.0500 (static level, psychological level) and 1.0430 (static level from December)."
Inflation FAQs
What is inflation?
Inflation measures the rise in the price of a representative basket of goods and services. Headline inflation is usually expressed as a percentage change on a month-on-month (MoM) and year-on-year (YoY) basis. Core inflation excludes more volatile elements such as food and fuel which can fluctuate because of geopolitical and seasonal factors. Core inflation is the figure economists focus on and is the level targeted by central banks, which are mandated to keep inflation at a manageable level, usually around 2%.
What is the Consumer Price Index (CPI)?
The Consumer Price Index (CPI) measures the change in prices of a basket of goods and services over a period of time. It is usually expressed as a percentage change on a month-on-month (MoM) and year-on-year (YoY) basis. Core CPI is the figure targeted by central banks as it excludes volatile food and fuel inputs. When Core CPI rises above 2% it usually results in higher interest rates and vice versa when it falls below 2%. Since higher interest rates are positive for a currency, higher inflation usually results in a stronger currency. The opposite is true when inflation falls.
What is the impact of inflation on foreign exchange?
Although it may seem counter-intuitive, high inflation in a country pushes up the value of its currency and vice versa for lower inflation. This is because the central bank will normally raise interest rates to combat the higher inflation, which attract more global capital inflows from investors looking for a lucrative place to park their money.
How does inflation influence the price of Gold?
Formerly, Gold was the asset investors turned to in times of high inflation because it preserved its value, and whilst investors will often still buy Gold for its safe-haven properties in times of extreme market turmoil, this is not the case most of the time. This is because when inflation is high, central banks will put up interest rates to combat it.
Higher interest rates are negative for Gold because they increase the opportunity-cost of holding Gold vis-a-vis an interest-bearing asset or placing the money in a cash deposit account. On the flipside, lower inflation tends to be positive for Gold as it brings interest rates down, making the bright metal a more viable investment alternative.
Gold is suffering. XAU/USD fell as much as 0.9% on Thursday to just $1,860 following three previous sessions of declines. Strategists at TD Securities analyze the yellow metal’s outlook.
Gold to recover and surge to the $2,100s in the first half of next year
Given positioning, technical and energy price pressures, it would not be surprising to see Gold drop into the low $1,800s if inflation moves higher and economic data remains firm. The upcoming core PCE deflator may be a catalyst for downside.
However, we expect Gold to recover and surge to the $2,100s in the first half of next year, as the Fed pivots to a more dovish policy and physical buying remains strong.
- NZD/USD extends gains after moderate US data released on Thursday.
- Volatile US Treasury yields could affect the US Dollar.
- US Core PCE is due on Friday, expected to reduce from 4.2% to 3.9%.
NZD/USD continues the winning streak for the second consecutive day, bidding higher around 0.6030 during the early European session on Friday. The NZD/USD pair is receiving upward support due to the correction in the US Dollar (USD) after the release of moderate economic data from the United States (US) on Thursday.
US Gross Domestic Product (GDP) remained consistent at 2.1% as expected. Initial Jobless Claims for the week ending on September 22, improved to 204K from the 202K prior, falling short of the 215K expected.
US Pending Home Sales showed a decline of 7.1%, exceeding the market expectation of a 0.8% fall, swinging from the 0.9% rise previously.
The US Dollar Index (DXY) continues to weaken, trading lower around 105.90. The volatility in US yields could affect the Greenback. The yield on the 10-year US Treasury bond stands at 4.55%.
Chicago Fed President Austan Goolsbee has expressed confidence in the Federal Reserve's (Fed) ability to bring inflation back to its target. Goolsbee also highlighted the unique opportunity to achieve this without a recession, emphasizing the Fed's commitment to managing inflation while sustaining economic growth.
Moreover, Richmond Fed President Thomas Barkin noted that recent inflation data has been positive but cautioned that it is too early to predict the future course of monetary policy.
Traders await the release of the US Core Personal Consumption Expenditure (PCE) Price Index, the Fed's preferred measure of consumer inflation, scheduled for Friday. The anticipated reduction in the annual rate from 4.2% to 3.9% will be closely watched by market participants for its potential impact on the US Dollar.
On the Kiwi side, the ANZ reported New Zealand’s Roy Morgan Consumer Confidence for September released on Friday, showed a slight decrease to 86.4 figures from 85.0 in the previous reading. However, on, Thursday, ANZ Business Confidence for September rose to 1.5 from a 3.7 decline in August.
Reserve Bank of New Zealand (RBNZ) is expected to keep the current monetary policy unchanged in next week’s policy meeting, which could put pressure on the Kiwi pair.
- USD/CAD loses traction near 1.3458 amid the weaker USD.
- The pair holds below the 50- and 100-hour EMAs on the four-hour chart.
- Relative Strength Index (RSI) is located in the bearish territory below 50.
- The immediate resistance level is seen at 1.3495; the initial support level is located at 1.3423.
The USD/CAD pair attracts some sellers around 1.3458 during the early European session on Friday. The downtick of the pair is supported by a correction of the US Dollar (USD) and lower US Treasury yields. Meanwhile, the US Dollar Index (DXY) drops to 105.90 after retreating from 106.83, the highest since November.
From the technical perspective, USD/CAD holds below the 50- and 100-hour Exponential Moving Averages (EMAs) on the four-hour chart, which supports the sellers for the time being. Meanwhile, the Relative Strength Index (RSI) is located in the bearish territory below 50, which means the path of the least resistance of USD/CAD is to the downside.
The immediate resistance level for the pair is seen near the 50-hour EMA at 1.3495. The additional upside filter to watch is near the 100-hour EMA at 1.3510. Further north, the pair will see a rally to the upper boundary of the Bollinger Band of 1.3536. Any follow-through buying above the latter will pave the way to a high of September 13 at 1.3586, followed by a psychological round figure at 1.3600.
On the downside, any decisive break below the lower limit of the Bollinger Band of 1.3465 will see a drop to the next contention at 1.3423 (a low of September 22). Further south, the next downside stop will emerge at 1.3380 (a low of September 19) en route to a low of August 4 at 1.3319.
USD/CAD four-hour chart

In the view of UOB Group’s Markets Strategist Quek Ser Leang and Senior FX Strategist Peter Chia, AUD/USD should maintain its current consolidative mood for the time being.
Key Quotes
24-hour view: Two days ago, AUD broke below a strong support at 0.6355 and dropped sharply to 0.6332. Yesterday, we indicated that “the sharp drop appears to be overdone, and AUD is unlikely to weaken much further.” We expected AUD to trade in a range between 0.6330 and 0.6390. Instead of trading in a range, AUD rebounded robustly to a high of 0.6432. The strong rebound could test 0.6455 before easing. The major resistance at 0.6480 is unlikely to come into view. Support is at 0.6405, followed by 0.6380.
Next 1-3 weeks: After AUD broke below the strong support level of 0.6355 and reached a low of 0.6332, we highlighted yesterday (28 Sep, spot at 0.6355) that “while the price action suggests AUD is likely to weaken further, downward momentum is not that strong, and the support at 0.6280 is unlikely to be reached anytime soon.” We also highlighted that “AUD is likely to remain under pressure unless it breaks above the ‘strong resistance’ level, currently at 0.6430.” In NY trade, AUD rose to a high of 0.6432. The breach of the ‘strong resistance’ level has invalidated our view. Overall, AUD is still likely trading in a range, probably between 0.6360 and 0.6480.
Considering advanced prints from CME Group for crude oil futures markets, open interest dropped by around 8.7K contracts after two daily builds in a row on Thursday. In the same line, volume shrank by around 275.2K contracts.
WTI remains on track to test $100.00
Prices of WTI rose to new 2023 highs near the $95.00 region before ending the session with small losses on Thursday. The daily pullback came in tandem with diminishing open interest and volume and this exposes the continuation of the uptrend in the very near term. On the upside, the next hurdle of note emerges at the psychological $100.00 mark per barrel.
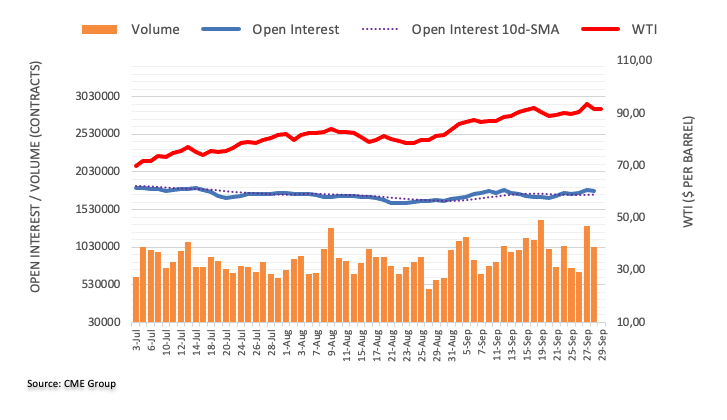
Economists at UBS analyze USD/CHF outlook.
Range-trading
We expect USD/CHF to trade in a large 0.88-0.94 range.
In the short term the USD remains well-bid with the Fed holding high rates for longer as growth is more resilient. This should keep yield differentials in favor of the USD amid an SNB on hold. The SNB committed to protect Switzerland against imported inflation and should prevent the CHF from weakening too much as well.
The downward path for USD/CHF will eventually resume but strongly hinges on the Fed cutting interest rates next year.
We see the risks in USD/CHF as largely balanced for now.
Open interest in gold futures markets extended the downtrend for yet another session on Thursday, this time by nearly 3K contracts according to preliminary readings from CME Group. Volume followed suit and shrank by around 15.2K contracts after three consecutive daily builds.
Gold appears supported near $1860… for now
Gold prices dropped for the fourth session in a row on Thursday, briefly visiting the $1860 region after staging a tepid rebound. The downtick was on the back of declining open interest and volume and leaves the door open to a potential rebound in the very near term. In the meantime, the $1860 region per troy ounce seems to hold the downside for the time being.
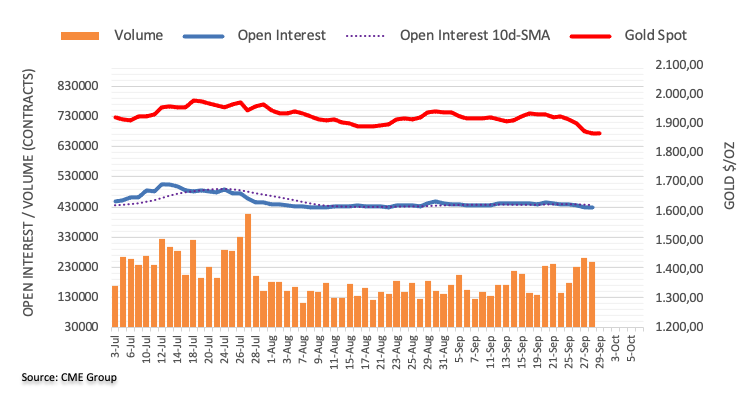
GBP/USD is now expected to navigate within the 1.2100/1.2380 range in the next few weeks, according to UOB Group’s Markets Strategist Quek Ser Leang and Senior FX Strategist Peter Chia.
Key Quotes
24-hour view: After GBP dropped to a low of 1.2111 on Wednesday, we indicated yesterday that “while the weakness in GBP has not really stabilised, downward momentum is showing tentative signs of slowing.” We held the view that, “there is room for GBP to test 1.2100, but a clear break below this level is unlikely.” Not only did GBP not test 1.2100, it also rebounded strongly and posted its largest 1-day gain in a month (1.2202, +0.55%). The strong rebound could extend to 1.2250 before levelling off. The next resistance at 1.2300 is unlikely to come under threat. Support is at 1.2170, followed by 1.2145.
Next 1-3 weeks: Yesterday, GBP rebounded strongly and took out our ‘strong resistance’ level of 1.2220. The breach of the ‘strong resistance’ level means that the GBP weakness that started early this month has finally ended. The current price movement is likely the early stages of a consolidation phase. In view of the sharp drop over the past month, GBP could consolidate in a relatively broad range of 1.2100/1.2380 for the time being.
According to the latest data published by the UK’s National Statistics, the final Gross Domestic Product (GDP) for the second quarter came in at 0.2% QoQ, matching the initial estimate of 0.2% and following a 0.2% expansion in the previous reading.
Annually, the UK GDP expanded 0.6% in Q2 versus 0.4% expected, and a 0.4% increase seen in the previous quarter.
About the UK Gross Domestic Product (GDP)
The Gross Domestic Product released by the National Statistics is a measure of the total value of all goods and services produced by the UK. The GDP is considered as a broad measure of the UK economic activity. Generally speaking, a rising trend has a positive effect on the GBP, while a falling trend is seen as negative (or bearish).
A weaker external balance and a sharp shrinkage in its yield premium over the USD have weakened the appeal of the Rupiah as a carry currency. Economists at ANZ Bank analyze USD/IDR outlook.
BI has been proactive in supporting the Rupiah
BI has been proactive in supporting the Rupiah. The latest move is the introduction of a new instrument (SRBI) to replace reverse repos and the ‘Operation Twist’, which provides some support to IDR but may divert investor interest from IndoGBs.
We expect the Rupiah to trade better when the Fed concludes its hiking cycle, with yields and USD peaking.
USD/IDR – Dec 23 15,100 Mar 24 14,800 Jun 24 14,600 Sep 24 14,400 Dec 24 14,200 Mar 25 14,000 Jun 25 14,000 Sep 25 14,000 Dec 25 14,000
Here is what you need to know on Friday, September 29:
The US Dollar (USD) struggles to find demand early Friday after registering losses against its major rivals on Thursday. Harmonized Index of Consumer Prices (HICP) inflation data from the Euro area and the Personal Consumption Expenditures (PCE) Price Index, the Federal Reserve's preferred gauge of inflation, figures from the US will be watched closely on the last trading day of the third quarter.
US Dollar price this week
The table below shows the percentage change of US Dollar (USD) against listed major currencies this week. US Dollar was the strongest against the Swiss Franc.
| USD | EUR | GBP | CAD | AUD | JPY | NZD | CHF | |
| USD | 0.66% | 0.14% | -0.01% | -0.28% | 0.49% | -0.79% | 0.68% | |
| EUR | -0.67% | -0.53% | -0.66% | -0.94% | -0.19% | -1.47% | 0.03% | |
| GBP | -0.14% | 0.53% | -0.14% | -0.40% | 0.36% | -0.91% | 0.55% | |
| CAD | -0.01% | 0.67% | 0.13% | -0.28% | 0.48% | -0.77% | 0.69% | |
| AUD | 0.27% | 0.91% | 0.39% | 0.27% | 0.73% | -0.53% | 0.94% | |
| JPY | -0.49% | 0.21% | -0.34% | -0.49% | -0.76% | -1.27% | 0.20% | |
| NZD | 0.77% | 1.43% | 0.91% | 0.79% | 0.51% | 1.26% | 1.45% | |
| CHF | -0.70% | -0.04% | -0.56% | -0.69% | -0.97% | -0.21% | -1.49% |
The heat map shows percentage changes of major currencies against each other. The base currency is picked from the left column, while the quote currency is picked from the top row. For example, if you pick the Euro from the left column and move along the horizontal line to the Japanese Yen, the percentage change displayed in the box will represent EUR (base)/JPY (quote).
The positive shift seen in risk mood caused the USD to lose interest in the American session on Thursday and the USD Index (DXY) snapped a four-day winning streak. In the European morning, DXY holds steady near 106.00. The benchmark 10-year US Treasury bond yield retreated below 4.6% and closed in negative territory, after touching a fresh multi-year high near 4.7%.
Meanwhile, Wall Street's main indexes registered gains even though Democrats and Republicans are yet to come to terms to approve a budget and avoid a government shutdown. Early Friday, US stock index futures trade flat on the day. On a yearly basis, the PCE Price Index is forecast to rise 3.5% in August, compared to 3.3% in July. The Core PCE Price Index, which excludes volatile food and energy prices, is expected to increase 3.9%, down from 4.2% growth recorded in July.
EUR/USD gathered recovery momentum and registered gains on Thursday before continuing to stretch higher toward 1.0600 on Friday. HICP inflation in the Euro area is seen softening to 4.5% in September from 5.2% in August.
GBP/USD gained more than 50 pips on Thursday and climbed above 1.2200 early Friday. The UK's Office for National Statistics reported on Friday that the real GDP expanded by 0.2% on a quarterly basis in the second quarter, matching the market expectation and the first estimate.
USD/JPY reversed its direction and closed in negative territory on Thursday after climbing above 149.50. The pair stays relatively quiet early Friday and trades slightly above 149.00. Japanese Finance Minister Shun'ichi Suzuki repeated that they are watching the moves in foreign exchange markets carefully and added that they remain prepared to take appropriate action against excessive moves. In the meantime, the data from Japan showed that the Tokyo Consumer Price Index rose 2.8% on a yearly basis in September.
Statistics Canada will release Gross Domestic Product (GDP) for July later in the day. Ahead of this data, USD/CAD stays in negative territory slightly below 1.3500. The Canadian economy is expected to register a monthly growth of 0.1% following the 0.2% contraction recorded in June.
Gold declined sharply for the fourth straight day on Thursday and touched its lowest level since early March below $1,860. With US T-bond yields starting to retreat, XAU/USD managed to stage a rebound and was last seen trading near $1,870.
UOB Group’s Markets Strategist Quek Ser Leang and Senior FX Strategist Peter Chia note further weakness in EUR/USD seems to have lost some momentum.
Key Quotes
24-hour view: Yesterday, we held the view that “the oversold EUR has room to drop further to 1.0470 before stabilisation is likely.” However, EUR did not drop further. Instead, it rebounded strongly from a low of 1.0489 to 1.0578. The rebound appears to be running ahead of itself, and EUR is unlikely to advance much further. Today, EUR is more likely to trade in a range, probably between 1.0525 and 1.0585.
Next 1-3 weeks: EUR rebounded strongly yesterday and closed higher by 0.56% (NY close of 1.0559). While our ‘strong resistance’ level of 1.0585 has not been breached yet, downward momentum has waned considerably, and the likelihood of EUR breaking below the year’s low near 1.0480 has diminished considerably as well. To put it another way, the EUR decline that started earlier this week could have found a bottom at 1.0486 (low on Wednesday).
- Asian equities rebound from 10-month lows amid the thin volume due to the holidays in China and South Korea.
- Headline Tokyo Consumer Price Index (CPI) for September eased to 2.8 YoY vs. 2.9% prior.
- Investors await the US Core Personal Consumption Expenditure (PCE) Price Index report.
Asian stocks recover from their 10-month lows, but investors remain concerned about rising interest rates that weighed on sentiment. Investors await the release of US consumer inflation data due later in the North American session on Friday.
At press time, Hong Kong’s Hang Sang surges 2.65% to 17,832 and Japan’s Nikkei is down 0.35%. Friday’s trading volume was muted due to holidays in China and South Korea.
In Japan, the headline Tokyo Consumer Price Index (CPI) for September eased to 2.8%% YoY from 2.9% in the previous reading. Meanwhile, the Tokyo CPI ex Fresh Food, Energy came in at 3.8% YoY from 4.0% in August. Tokyo CPI ex Fresh Food eased from 2.8% to 2.5% for the said month compared to analysts’ estimations of 2.6%.
On Thursday, Finance Minister Shunichi Suzuki reiterated that he won't rule out any steps to respond to disorderly FX moves. Traders turns cautious amid the fear of intervention as the level of 150.00 would prompt Japanese authorities to intervene as they did last year.
Meanwhile, the Hong Kong's Hang Seng edges higher as technology stocks recovered on Friday.
Market participants will closely monitor the US Core Personal Consumption Expenditure (PCE) Price Index, the Fed's preferred measure of consumer inflation due later on Friday. The annual consumer inflation for August is expected to decline from 4.2% YoY to 3.9%.
- USD/CHF pulls back from the highest levels since March.
- Improved US Treasury yields could limit the losses of the US Dollar.
- US Core PCE is due on Friday, expected to reduce from 4.2% to 3.9%.
- ANZ Bank report revealed that CHF has become the top-performing currency among the G10 currencies.
USD/CHF continues to retrace the gains for the second consecutive day post ending a winning streak that began on September 19. The spot price trades around 0.9130 during the Asian session on Friday. The USD/CHF pair is under pressure after the moderate economic data from the United States (US).
US GDP kept consistent at 2.1% as expected. Initial Jobless Claims for the week ending on September 22, improved to 204K from the 202K prior, falling short of the 215K expected.
US Pending Home Sales showed a decline of 7.1%, exceeding the market expectation of a 0.8% fall, swinging from the 0.9% rise previously.
The US Dollar Index (DXY) extends losses on the second day after the moderate datasets from the United States (US), trading lower around 106.00 by the press time. However, the improved US yields could put a cap on the losses of the US Dollar (USD).
The yield on the 10-year US Treasury bond retraces the recent losses, standing at 4.60% at the time of writing.
Chicago Fed President Austan Goolsbee expressed confidence that the Fed will bring inflation back to its target. Goolsbee also emphasized the unique chance to achieve this without a recession, indicating the US Federal Reserve’s (Fed) commitment to managing inflation while sustaining economic growth.
Richmond Fed President Thomas Barkin stated that recent inflation data has been positive but highlighted that it's too early to predict the future course of monetary policy.
Traders await the US Core Personal Consumption Expenditure (PCE) Price Index, the Fed's preferred measure of consumer inflation, which is due on Friday. The annual rate is expected to reduce from 4.2% to 3.9%.
On the Swiss front, investors will likely watch Real Retail Sales for August to be released later in the day.
The Swiss Franc (CHF) is experiencing upward support, which could be attributed to a recent analysis by economists at ANZ Bank. Their analysis has highlighted that the CHF has become the top-performing currency among the G10 currencies in relation to the Greenback.
- EUR/JPY hovers around 158.00; Relative Strength Index (RSI) stands in bullish territory above 50.
- The 50-hour EMA is on the verge of crossing above the 100-hour EMA.
- The immediate resistance level for the cross is 158.15; the key support level is seen at 157.50.
The EUR/JPY cross holds positive ground near 158.00 during the Asian session on Friday. Market players await the German Retail Sales data for fresh impetus. The annual figure for August is expected to drop 0.7% from the previous reading of a 2.2% fall. The report could trigger the volatility in the cross.
From a technical perspective, EUR/JPY holds above the 50- and 100-hour Exponential Moving Averages (EMAs) on the one-hour chart. It’s worth noting that the 50-hour EMA is on the verge of crossing above the 100-hour EMA. If a decisive crossover occurs on the one-hour chart, it would validate a Bull Cross, highlighting the path of least resistance for EUR/JPY is to the upside.
The immediate resistance level for the cross is located near the upper boundary of the Bollinger Band at 158.15. A break above the latter will see the next barrier at 158.45 (a high of September 20). Further north, the additional upside filter is seen around a high of September 13 at 158.65, followed by a Year-To-Date (YTD) high of 159.76.
On the flip side, the convergence of the 50-hour EMA and 100-hour EMA at 157.50 will be the key support level for EUR/JPY. The next contention level will emerge at 157.20, representing the lower limit of the Bollinger Band. Any follow-through selling below the latter will see a drop to 156.95 (a low of September 27), and finally at 156.70 (a low of September 28).
Meanwhile, the Relative Strength Index (RSI) stands in bullish territory above 50, supporting the buyers for now.
EUR/JPY one-hour chart

Japan Finance Minister Shun'ichi Suzuki reiterated this Friday the government will take action against the recent decline in the Japanese Yen (JPY), which remains depressed near its lowest level since October 2022 against the US Dollar.
Key Quotes:
We will take appropriate action against excessive moves without ruling out any options.
Closely watching FX moves with a strong sense of urgency.
The government has no specific target for the JPY that would trigger currency intervention.
- GBP/JPY gains momentum above the mid-182.00s on Friday ahead of the UK key event.
- Japan’s Tokyo CPI eased to 2.8%% vs. 2.9%; excluding Fresh Food, Energy came in at 3.8% vs. 4.0% prior.
- Traders await the UK’s Gross Domestic Product (GDP) data for Q2.
The GBP/JPY cross holds positive ground for three straight days during the Asian session on Friday. Meanwhile, the cross currently trades near 182.57, gaining 0.22% on the day.
Earlier Friday, the Statistics Bureau of Japan reported that the headline Tokyo Consumer Price Index (CPI) for September eased to 2.8 YoY from 2.9% in the previous reading. Meanwhile, the Tokyo CPI ex Fresh Food, Energy came in at 3.8% YoY from 4.0% in August. Additionally, Tokyo CPI ex Fresh Food eased from 2.8% to 2.5% for the said month compared to analysts’ estimations of 2.6%. Japan's inflation rate continues to exceed the Bank of Japan's (BoJ) 2% target, but the central bank is anticipated to keep its ultra-easy monetary policy in place until it is sure that inflation remains above its minimum target.
On Thursday, Finance Minister Shunichi Suzuki reiterated that he won't rule out any steps to respond to disorderly FX moves. Traders turn cautious amid the fear of intervention as the level of 150.00 would prompt Japanese authorities to intervene as they did last year.
On the UK’s front, market players await the UK’s Gross Domestic Product (GDP) for the second quarter for fresh impetus. The quarterly and yearly growth number is expected to remain at 0.2% and 0.4%, respectively. Following the Bank of England's surprising pause in its rate-hiking cycle earlier this month, the initial market response to a positive surprise is more likely to remain limited.
Looking ahead, market participants will keep an eye on the UK’s Gross Domestic Product (GDP) for Q2. Traders will take cues from these figures and find trading opportunities around the GBP/JPY cross.
- Gold price languishes near its lowest level since March 10 touched on Thursday.
- Retreating US bond yields undermines the USD and lends support to the metal.
- Traders look to the US PCE Price Index for cues about the Fed’s rate-hike path.
Gold price (XAU/USD) has been trending lower since the beginning of the current week and plunged to its lowest level since March 10, around the $1,858-1,857 region on Thursday. That said, a sharp US Dollar (USD) pullback from a 10-month peak helps limit the downside, though the commodity struggles to attract any meaningful buying during the Asian session on Friday. Meanwhile, a looming shutdown of the US government on October 1, which poses a risk to the economy, along with persistent worries over China's ailing property sector, lends some support to the safe-haven precious metal.
Any meaningful recovery for the Gold price, however, still seems elusive in the wake of growing acceptance that the Federal Reserve (Fed) will stick to its hawkish stance. In fact, the US central bank warned last week that still-sticky inflation will likely attract at least one more interest rate hike by the end of this year. Furthermore, the US economic resilience should allow the Fed to keep rates higher for longer. This, in turn, should act as a tailwind for the US bond yields and the USD, which, in turn, suggests that the path of least resistance for the non-yielding yellow metal is to the downside.
Traders might also prefer to wait on the sidelines ahead of the release of the US Core PCE Price Index, which is the Fed's primary inflation measure and should influence expectations about the next policy move. This, in turn, will drive USD demand and provide a fresh directional impetus to the non-yielding Gold price. In the meantime, the prospects for further policy tightening by the Fed should act as a tailwind for the US bond yields and the US dollar, keeping a lid on any meaningful appreciating move for the US Dollar-denominated commodity.
Daily Digest Market Movers: Gold price looks to the US Core PCE Price Index for a fresh impetus
- The 10-year US Treasury bond yields retreated from a 16-year peak and drag the US Dollar away from the YTD top.
- A deadlock over demands from Republicans for deep public spending cuts poses the risk of a US government shutdown.
- House Republicans have rejected spending levels for fiscal year 2024 set in a deal between Speaker Kevin McCarthy and President Joe Biden in May 2023.
- The Democratic-led US Senate moved forward with a bipartisan stopgap funding bill to extend federal spending until November 17.
- Growing concerns over slowing Chinese growth and a property market crash continue to weigh on investors' sentiment.
- The US economy grew by a 2.1% annualized pace during the second quarter and reaffirms bets for at least one more Fed rate hike by the year-end.
- Richmond Fed President Thomas Barkin said on Thursday that it was unclear whether more monetary policy changes will be needed in the coming months.
- The market focus remains glued to the crucial US PCE Price Index, which will influence expectations about the Fed's future rate-hike path.
- The Core PCE Price Index is expected to hold steady and rise by 0.2% MoM in August. The yearly rate, however, is projected to decelerate from 4.2% to 3.9% during the reported month.
Technical Analysis: Gold price might consolidate amid oversold RSI on the daily chart
From a technical perspective, the Relative Strength Index (RSI) on the daily chart is flashing oversold conditions and warrants some caution for bearish traders. Hence, it will be prudent to wait for some near-term consolidation or a modest bounce before positioning for any further losses. That said, any attempted recovery is likely to attract fresh sellers and remain capped near the overnight swing high, around the $1,880 region. On the flip side, the multi-month trough, around the $1,858-1,857 area, now seems to protect the immediate downside, below which the XAU/USD could accelerate the slide towards the next relevant support near the $1,820 zone.
Inflation FAQs
What is inflation?
Inflation measures the rise in the price of a representative basket of goods and services. Headline inflation is usually expressed as a percentage change on a month-on-month (MoM) and year-on-year (YoY) basis. Core inflation excludes more volatile elements such as food and fuel which can fluctuate because of geopolitical and seasonal factors. Core inflation is the figure economists focus on and is the level targeted by central banks, which are mandated to keep inflation at a manageable level, usually around 2%.
What is the Consumer Price Index (CPI)?
The Consumer Price Index (CPI) measures the change in prices of a basket of goods and services over a period of time. It is usually expressed as a percentage change on a month-on-month (MoM) and year-on-year (YoY) basis. Core CPI is the figure targeted by central banks as it excludes volatile food and fuel inputs. When Core CPI rises above 2% it usually results in higher interest rates and vice versa when it falls below 2%. Since higher interest rates are positive for a currency, higher inflation usually results in a stronger currency. The opposite is true when inflation falls.
What is the impact of inflation on foreign exchange?
Although it may seem counter-intuitive, high inflation in a country pushes up the value of its currency and vice versa for lower inflation. This is because the central bank will normally raise interest rates to combat the higher inflation, which attract more global capital inflows from investors looking for a lucrative place to park their money.
How does inflation influence the price of Gold?
Formerly, Gold was the asset investors turned to in times of high inflation because it preserved its value, and whilst investors will often still buy Gold for its safe-haven properties in times of extreme market turmoil, this is not the case most of the time. This is because when inflation is high, central banks will put up interest rates to combat it.
Higher interest rates are negative for Gold because they increase the opportunity-cost of holding Gold vis-a-vis an interest-bearing asset or placing the money in a cash deposit account. On the flipside, lower inflation tends to be positive for Gold as it brings interest rates down, making the bright metal a more viable investment alternative.
- USD/JPY receives upward support after the soft Japan's CPI.
- Japanese inflation reduced to 2.8% from 2.9% prior.
- Improved US Treasury yields could limit the losses of the US Dollar.
- US Core PCE is due on Friday, expected to reduce from 4.2% to 3.9%.
USD/JPY recovers from the recent losses, trading higher around 149.40 during the Asian session on Friday. The pair receives upward support after the downbeat Japanese data released on Friday.
Statistics Bureau of Japan published the headline Tokyo Consumer Price Index (CPI) on a yearly basis rose 2.8% in September slightly lower than the previous 2.9% readings. Core CPI (YoY) increased 3.8%, which was 4.0% in August.
Japan’s inflation continues to surpass the Bank of Japan's (BoJ) 2% target, but the central bank is expected to maintain its ultra-loose monetary policy until it is confident that inflation will consistently remain above its minimum target.
The US Dollar Index (DXY) extends losses on the second day after the moderate datasets from the United States (US), trading lower around 106.00 by the press time.
US GDP kept consistent at 2.1% as expected. Initial Jobless Claims for the week ending on September 22, improved to 204K from the 202K prior, falling short of the 215K expected.
US Pending Home Sales showed a decline of 7.1%, exceeding the market expectation of a 0.8% fall, swinging from the 0.9% rise previously.
However, the yield on the 10-year US Treasury bond retraces the recent losses, standing at 4.60% at the time of writing. The improved US yields could put a cap on the losses of the US Dollar (USD).
The US Dollar (USD) saw a strong rally over the past week, buoyed by robust economic indicators, and it climbed to its highest levels since December. Furthermore, the USD's resilience can be linked to the favorable performance of US Treasury yields.
Chicago Fed President Austan Goolsbee also highlighted the rare opportunity to achieve this without a recession, indicating the US Federal Reserve’s (Fed) commitment to managing inflation while sustaining economic growth.
Fed President Thomas Barkin acknowledged that recent inflation data has been positive but emphasized that it's premature to determine the future course of monetary policy.
Traders await the US Core Personal Consumption Expenditure (PCE) Price Index, the Fed's preferred measure of consumer inflation, which is due on Friday. The annual rate is expected to reduce from 4.2% to 3.9%.
- Gold price attempt to recover from the recent losses after moderate US data.
- The pullback in US Treasury yields put pressure on the US Dollar.
- US Core PCE is due on Friday, expected to reduce from 4.2% to 3.9%.
Gold price snaps a four-day losing streak, trading higher around $1,870 per troy ounce during the Asian session on Friday. The prices of the precious metal recovers from the lowest levels since March, primarily supported by a correction in the US Dollar (USD) due to the moderate economic data from the United States (US).
Additionally, the pullback in US Treasury yields might have helped the non-yielding assets like Gold. However, the yield on the 10-year US Treasury bond retraces the recent losses, standing at 4.59% at the time of writing.
US GDP remained consistent at 2.1% as expected. Initial Jobless Claims for the week ending on September 22, printed a lower reading of 204K than the market consensus of 215K, which was 202K prior.
US Pending Home Sales showed a decline of 7.1%, exceeding the market expectation of a 0.8% fall, swinging from the 0.9% rise previously.
The US Dollar Index (DXY) extended losses on the second day after the moderate datasets from the United States (US), trading around 106.00 by the press time.
The US Dollar (USD) saw a strong rally over the past week, buoyed by robust economic indicators, and it climbed to its highest levels since December. Furthermore, the USD's resilience can be linked to the favorable performance of US Treasury yields.
Chicago Fed President Austan Goolsbee also highlighted the rare opportunity to achieve this without a recession, indicating the US Federal Reserve’s (Fed) commitment to managing inflation while sustaining economic growth.
Federal Reserve Bank of Richmond President, Thomas Barkin acknowledged that recent inflation data has been positive but emphasized that it's premature to determine the future course of monetary policy.
Traders await the US Core Personal Consumption Expenditure (PCE) Price Index, the Fed's preferred measure of consumer inflation, which is due on Friday. The annual rate is expected to reduce from 4.2% to 3.9%.
| Raw materials | Closed | Change, % |
|---|---|---|
| Silver | 22.621 | 0.35 |
| Gold | 1865.326 | -0.6 |
| Palladium | 1266.61 | 3.58 |
- GBP/USD attracts some buying for the second straight day and is supported by a softer USD.
- The divergent Fed-BoE policy outlook might keep a lid on any meaningful appreciating move.
- Traders now look to the final UK GDP for a fresh impetus ahead of the US Core PCE Price Index.
The GBP/USD pair gains some positive traction for the second successive day on Friday and looks to build on the previous day's goodish recovery from the vicinity of its lowest level since March 17. Spot prices trade around the 1.2220 region during the Asian session and draw support from a mildly softer tone surrounding the US Dollar (USD).
The USD Index (DXY), which tracks the Greenback against a basket of currencies, remains depressed below the YTD peak set earlier this week and is pressured by Thursday's rather unimpressive US macro data. The final estimate published by the US Bureau of Economic Analysis (BEA) showed that the US expanded by a 2.1% annualized pace during the second quarter, in line with market expectations. Furthermore, the Labor Department reported that Initial Jobless Claims rose by 2,000 to 204K during the week ended September 23. This, along with a modest fall in the US Treasury bond yields and a stable performance around the equity markets, undermines the safe-haven buck and acts as a tailwind for the GBP/USD pair.
The US macro data, however, still pointed to a resilient economy and ensured that the Federal Reserve (Fed) would keep interest rates higher for longer. This should help limit the downside for the US bond yields and lend support to the Greenback. Traders might also refrain from placing aggressive directional bets and prefer to wait for the release of the US Core PCE Price Index – the Fed's preferred inflation gauge. The US central bank warned last week that still-sticky inflation in the US was likely to attract at least one more interest rate hike by the end of this year. Hence, the data will influence expectations about the Fed's future rate-hike path, which, in turn, should provide a fresh impetus to the USD and drive the GBP/USD pair.
Heading into the key data risk, traders might take cues from the release of the final UK GDP print, though the immediate market reaction to a positive surprise is more likely to remain limited on the back of the Bank of England's surprise pause in its rate-hiking cycle earlier this month. Moreover, the UK central bank provided little hints of its intends to raise rates any further. This, in turn, warrants some caution for bullish traders and positioning for any further appreciating move for the GBP/USD pair. Hence, it will be prudent to wait for strong follow-through buying before confirming that spot prices have formed a near-term bottom ahead of the 1.2100 round-figure mark.
Technical levels to watch
- WTI prices hover around $91.09 after retreating from Year-To-Date (YTD) highs.
- Real Gross Domestic Product (GDP) in the US expanded at an annual rate of 2.1% in Q2, as expected.
- Voluntary oil output cuts by Saudi Arabia and Russia might boost oil prices.
- Oil traders will closely monitor the US consumer inflation data, Chinese PMI data.
Western Texas Intermediate (WTI), the US crude oil benchmark, is trading around $91.09 so far on Friday. WTI loses traction after retracing from a 12-month high of $93.98 as investors worry about the impact of higher interest rates on oil consumption. It's worth noting that higher interest rates raise borrowing costs, which can slow the economy and diminish oil demand.
On Thursday, the US Bureau of Economic Analysis (BEA) reported that Real Gross Domestic Product (GDP) in the US expanded at an annual rate of 2.1% in the second quarter (Q2), as expected. Market players will take cues from the US consumer inflation data for fresh impetus. The upbeat report might boost the US Dollar (USD) and exert some pressure on oil prices.
About the data, the American Petroleum Institute (API) reported on Wednesday that US crude oil inventories rose by 1.586M barrels for the week ending September 22 from the previous reading of 5.25M barrels drop. During the same period, EIA reported that crude oil stockpiles declined by 2.17M barrels compared to a drop of 2.135M in the previous week, while the market anticipated a drawdown of 0.32M barrels.
On the other hand, falling US oil stockpiles follow joint cutbacks of 1.3M barrels per day by Saudi Arabia and Russia, the world's two largest oil exporters, until the end of the year. Additionally, Russia stated that its ban on petroleum exports will remain in place until the domestic market stabilizes and noted that it has not discussed with OPEC+ a potential increase in supply to compensate for this export ban.
Oil traders will closely monitor the US Core Personal Consumption Expenditure (PCE) Price Index, the Fed's preferred measure of consumer inflation due later on Friday. The annual consumer inflation for August is expected to decline from 4.2% YoY to 3.9%. On Saturday, the Chinese Manufacturing PMI and Non-Manufacturing PMI will be released. These events could significantly impact the USD-denominated WTI price. Oil traders will take cues from the data and find trading opportunities around the WTI prices.
- Australian Dollar recovers from the 10-month low after upbeat Aussie data.
- Australia’s monthly Private Sector Credit rose 0.4% compared to the expected 0.3%.
- US Dollar retreats after the moderate economic data released on Thursday.
The Australian Dollar (AUD) extends its gains on the second successive day on Friday. The AUD/USD pair recovers from recent losses, primarily supported by a correction in the US Dollar (USD) due to a pullback in US Treasury yields. Additionally, the Aussie pair gets minor support from the Australian upbeat Private Sector Credit (MoM) data.
Australia’s Bureau of Statistics (ABS) on Thursday revealed Retail Sales rose in August on a monthly basis below the market consensus. The soft consumer spending data in August might convince the Reserve Bank of Australia (RBA) to keep the interest rate unchanged next week.
However, Australia's monthly Consumer Price Index (CPI) improved from July's reading, which could be attributed to the increasing energy prices. The rise in inflation could increase the likelihood of another interest rate hike.
The US Dollar Index (DXY) snapped a winning streak after the moderate datasets from the United States (US). Gross Domestic Product (GDP) remained consistent as expected. Initial Jobless Claims for unemployment benefits printed a lower reading than the market consensus.
The US Dollar (USD) rallied during the week due to robust macros and reached its highest levels since December. Additionally, the USD’s strength is attributed to the positive performance of US Treasury yields. However, the yield on the 10-year US Treasury note has retreated from record highs.
Daily Digest Market Movers: Australian Dollar retraces recent losses due to a pullback in the US Dollar
AUD/USD attempts to extend gains, trading around 0.6430 at the time of writing during early Asian trading hours on Thursday.
Australian Private Sector Credit (MoM) for August rose 0.4%, exceeding the market consensus to remain consistent at 0.3%. While the yearly readings rose 5.1%, slightly lower than the previous reading of 5.3%.
The Aussie Dollar could further face challenges due to increased risk aversion sentiment in the market.
Australian Retail Sales for August, fell to 0.2% from the previous rate of 0.5%. The index was expected to grow at a 0.3% rate.
Australia’s Monthly Consumer Price Index (CPI) year-over-year for August rose 5.2% as expected, up from the previous rate of 4.9%.
US GDP remained consistent at 2.1% as expected. Initial Jobless Claims for the week ending on September 22, printed a lower reading of 204K than the market consensus of 215K, which was 202K prior.
US Pending Home Sales showed a decline of 7.1%, exceeding the market expectation of a 0.8% fall, swinging from the 0.9% rise previously.
Chicago Fed President Austan Goolsbee expressed confidence that the Fed will bring inflation back to its target. Goolsbee also highlighted the rare opportunity to achieve this without a recession, indicating the US Federal Reserve’s (Fed) commitment to managing inflation while sustaining economic growth.
Fed President Thomas Barkin acknowledged that recent inflation data has been positive but emphasized that it's premature to determine the future course of monetary policy. Barkin also noted that the data lost during a government shutdown could complicate the understanding of the economy.
Traders await the US data such as the Core Personal Consumption Expenditure (PCE) Price Index, the Fed's preferred measure of consumer inflation, is due on Friday. The annual rate is expected to reduce from 4.2% to 3.9%.
Technical Analysis: Australian Dollar moves toward 0.6450, the barrier at 26.6% Fibo
Australian Dollar trades higher around 0.6440 aligned with the 0.6450 psychological level on Friday. A firm break above the latter could support the Aussie Dollar (AUD) to explore the region around 26.6% Fibonacci retracement at 0.6464. On the downside, the monthly low at 0.6331, followed by the 0.6300 psychological level could act as the key support.
AUD/USD: Daily Chart
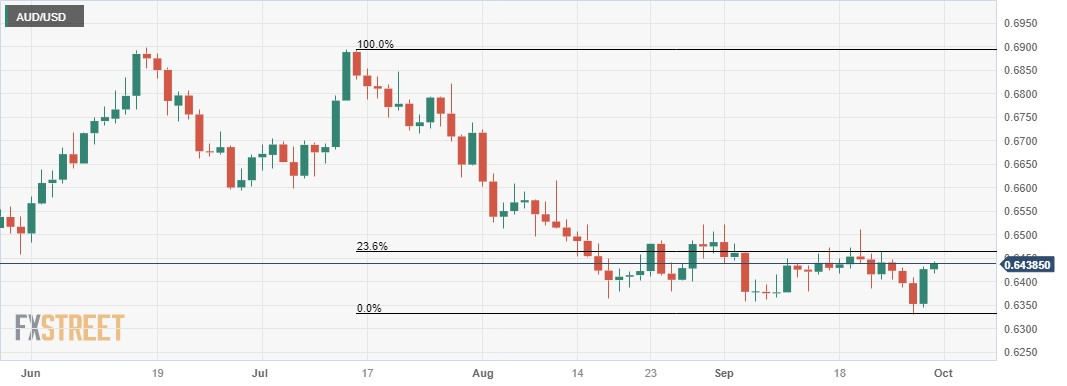
Australian Dollar FAQs
What key factors drive the Australian Dollar?
One of the most significant factors for the Australian Dollar (AUD) is the level of interest rates set by the Reserve Bank of Australia (RBA). Because Australia is a resource-rich country another key driver is the price of its biggest export, Iron Ore. The health of the Chinese economy, its largest trading partner, is a factor, as well as inflation in Australia, its growth rate and Trade Balance. Market sentiment – whether investors are taking on more risky assets (risk-on) or seeking safe-havens (risk-off) – is also a factor, with risk-on positive for AUD.
How do the decisions of the Reserve Bank of Australia impact the Australian Dollar?
The Reserve Bank of Australia (RBA) influences the Australian Dollar (AUD) by setting the level of interest rates that Australian banks can lend to each other. This influences the level of interest rates in the economy as a whole. The main goal of the RBA is to maintain a stable inflation rate of 2-3% by adjusting interest rates up or down. Relatively high interest rates compared to other major central banks support the AUD, and the opposite for relatively low. The RBA can also use quantitative easing and tightening to influence credit conditions, with the former AUD-negative and the latter AUD-positive.
How does the health of the Chinese Economy impact the Australian Dollar?
China is Australia’s largest trading partner so the health of the Chinese economy is a major influence on the value of the Australian Dollar (AUD). When the Chinese economy is doing well it purchases more raw materials, goods and services from Australia, lifting demand for the AUD, and pushing up its value. The opposite is the case when the Chinese economy is not growing as fast as expected. Positive or negative surprises in Chinese growth data, therefore, often have a direct impact on the Australian Dollar and its pairs.
How does the price of Iron Ore impact the Australian Dollar?
Iron Ore is Australia’s largest export, accounting for $118 billion a year according to data from 2021, with China as its primary destination. The price of Iron Ore, therefore, can be a driver of the Australian Dollar. Generally, if the price of Iron Ore rises, AUD also goes up, as aggregate demand for the currency increases. The opposite is the case if the price of Iron Ore falls. Higher Iron Ore prices also tend to result in a greater likelihood of a positive Trade Balance for Australia, which is also positive of the AUD.
How does the Trade Balance impact the Australian Dollar?
The Trade Balance, which is the difference between what a country earns from its exports versus what it pays for its imports, is another factor that can influence the value of the Australian Dollar. If Australia produces highly sought after exports, then its currency will gain in value purely from the surplus demand created from foreign buyers seeking to purchase its exports versus what it spends to purchase imports. Therefore, a positive net Trade Balance strengthens the AUD, with the opposite effect if the Trade Balance is negative.
- USD/CAD regains some positive traction on Friday and snaps a two-day losing streak.
- A softer Crude Oil prices undermines the Loonie and acts as a tailwind for the major.
- The Fed’s hawkish stance lends support to the USD and contributes to the move up.
- Traders look to the US Core PCE Price Index and Canadian GDP for a fresh impetus.
The USD/CAD pair attracts fresh buying during the Asian session on Friday and for now, seems to have snapped a two-day losing streak. Spot prices struggle to capitalize on the move beyond the 1.3500 psychological mark, though remain well within the striking distance of over a one-week high touched on Wednesday
Crude Oil prices languish below a one-year peak set the previous day, which, in turn, is seen undermining the commodity-linked Loonie and acting as a tailwind for the USD/CAD pair. Expectations of supply increases by Russia and Saudi Arabia, to a larger extent, outweigh the optimistic view over a pickup in demand from China during its Golden Week holiday. This prompts traders to lighten their bullish bets around the black liquid, especially after this week's nearly 8% rally from the vicinity of mid-$88.00s.
Apart from this, the underlying strong bullish tone surrounding the US Dollar (USD) offers additional support to the USD/CAD pair. As investors look past Thursday's rather unimpressive US macro data, growing acceptance that the Federal Reserve (Fed) helps limit the USD corrective decline from its highest level since November 2022 touched on Thursday. In fact, the US central bank warned last week that sticky inflation in the US was likely to attract at least one more rate hike by the end of this year.
Hence, the market focus will remain glued to the release of the US Core PCE Price Index – the Fed's preferred inflation gauge – later during the early North American session. The data will play a key role in influencing market expectations about the next policy move by the Fed, which, in turn, will drive the USD demand and provide a fresh impetus to the USD/CAD pair. Traders on Friday will further take cues from the monthly Canadian GDP and Oil price dynamics to grab short-term opportunities.
In the meantime, th prospects for further policy tightening by the Fed remains supportive of elevated US Treasury bond yields, which should continue to act as a tailwind for the buck and the USD/CAD pair. Nevertheless, spot prices seem poised to register modest weekly gains for the first time in the previous three.
Technical levels to watch
- NZD/USD rebounds to 0.5977 amid a decline of the US Dollar.
- US real Gross Domestic Product (GDP) grew at an annual rate of 2.1% in Q2, as expected.
- New Zealand’s Roy Morgan Consumer Confidence for September came in at 86.4 vs. 85.0 prior.
- The US consumer inflation data will be a closely watched event.
The NZD/USD pair gains traction above the mid-0.5900s during the early Asian session on Friday. The rebound of the pair is supported by a correction of the US Dollar (USD) and lower US Treasury yields. Meanwhile, the US Dollar Index (DXY) edges lower to 106.10 after retreating from 106.83, the highest since November. NZD/USD currently trades bear 0.5977, gaining 0.28% for the day.
The US Bureau of Economic Analysis (BEA) reported on Thursday that Real Gross Domestic Product (GDP) in the US expanded at an annual rate of 2.1% in the second quarter (Q2), as expected. Additionally, the US Department of Labor revealed that the Initial Jobless Claims for the week ending of September 22 climbed to 204K from 202K in the previous week, below the 215K anticipated. The Pending Home Sales fell 7.1% MoM in August, compared to expectation for a 1.0% drop MoM.
Earlier Friday, Federal Reserve Bank of Richmond President Thomas Barkin stated that the Fed holding steady at the September FOMC meeting was appropriate and Fed has time to see data before deciding what’s next for rates. On Thursday, Chicago Fed President Austan Goolsbee said the central bank will return inflation to target and has a chance to do something rare by accomplishing that without a recession. Richmond Fed President Thomas Barkin remarked that the past five months of inflation data have been upbeat but that it is too early to determine what monetary policy would be next. Barkin mentioned that lost data due to the government shutdown would complicate understanding the economy.
Investors will assess the narrative of a higher for longer rate in the US against the growth risks posed by the possibility of an imminent US government shutdown. This, in turn, might cap the upside of the Greenback and act as a tailwind for the NZD/USD pair.
On the Kiwi front, the latest data on Friday from the ANZ reported that New Zealand’s Roy Morgan Consumer Confidence for September came in at 86.4 from 85.0 in the previous reading. Earlier, ANZ Business Confidence for September rose to 1.5 from a 3.7 decline in August while the ANZ Activity Outlook improved to 10.9 in September from 11.2% in the previous reading. The market anticipates the Reserve Bank of New Zealand (RBNZ) to maintain the current monetary policy unchanged in next week’s policy meeting, which might limit the Kiwi’s upside.
Market players will focus on the US Core Personal Consumption Expenditure (PCE) Price Index, the Fed's preferred measure of consumer inflation due later on Friday. The annual consumer inflation for August is expected to decline from 4.2% YoY to 3.9%. These figures could give a clear direction for the NZD/USD pair.
- EUR/USD fails to attract any follow-through buying and oscillates in a range on Friday.
- Bets that any further ECB rate hikes may be off the table act as a headwind for the Euro.
- The prospects for further policy tightening by the Fed underpins the USD and cap gains.
- Traders now look to the Eurozone CPI for some impetus ahead of the US PCE Price Index.
The EUR/USD pair struggles to capitalize on the previous day's bounce from levels just below the 1.0500 psychological mark or a fresh eight-month low and oscillates in a narrow band during the Asian session on Friday. Spot prices currently trade around the 1.0560 area, nearly unchanged for the day as traders now look to key inflation figures from the Eurozone and the US.
The flash version of the Eurozone Consumer Price Index (CPI) is expected to show that the annualized CPI moderated from 5.3% to 4.8% rate in September. Apart from this, signs of the beginning of the end of the high inflation in Germany – Europe's largest economy – and looming recession risks will reaffirm the view that the next move by the European Central Bank (ECB) is likely to be a rate cut. This, along with the underlying bullish tone surrounding the US Dollar (USD), could attract fresh sellers around the EUR/USD pair and pave the way for an extension of the recent well-established downtrend witnessed over the past two months or so.
The USD Index (DXY), which tracks the Greenback against a basket of currencies, stalls the overnight retracement slide from the YTD peak that followed the release of the rather unimpressive US macro data. According to the final estimate published by the US Bureau of Economic Analysis (BEA), the world's largest economy expanded by a 2.1% annualized pace, in line with the previous estimate and market expectations. The GDP Price Index, however, fell from 2% to 1.7%, suggesting that price pressure is easing further, and weighed on the USD, though growing acceptance that the Federal Reserve (Fed) will stick to its hawkish stance helped limit losses.
The US central bank warned last week that still-sticky inflation in the US was likely to attract at least one more interest rate hike by the end of this year. Adding to this, Minneapolis Fed President Neel Kashkari said earlier this week that it is not clear yet whether the central bank is finished raising rates amid ample evidence of ongoing economic strength. This, along with the US economic resilience, should allow the Fed to keep interest rates higher for longer. The outlook remains supportive of eevated US Treasury bond yields and favours the USD bulls, suggesting that the path of least resistance for the EUR/USD pair remains to the downside.
Traders, however, might refrain from placing aggressive bets and might prefer to wait on the sidelines ahead of Friday's release of the US Core PCE Price Index – the Fed's preferred inflation gauge. The data will play a key role in influencing market expectations about the next policy move by the US central bank, which, in turn, will drive the USD demand and provide some meaningful impetus to the EUR/USD pair on the last day of the week. Nevertheless, spot prices remain on track to end in the red for the eleventh straight week.
Technical levels to watch
- USD/CHF remains flat around 0.9148 ahead of the key events.
- US Real Gross Domestic Product (GDP) grew at an annual rate of 2.1% in Q2, as expected.
- Swiss ZEW Survey Expectations came in at -27.6 in September vs. -38.6 prior.
- Market players await the Swiss annual Reail Retail Sales, US consumer inflation data.
The USD/CHF pair consolidates its losses around 0.9148 during the early Asian trading hours on Friday. The pair edges lower due to a correction of the US Dollar (USD) and lower US Treasury yields. Meanwhile, the US Dollar Index (DXY) hovers around 106.17 after retreating from 106.83, the highest since November.
On Thursday, the US real Gross Domestic Product (GDP) expanded at an annual rate of 2.1% in the second quarter (Q2), as expected. Meanwhile, the US Initial Jobless Claims for the week ending of September 22 climbed to 204K from 202K in the previous week, below the 215K anticipated. The pending home sales dropped 7.1% MoM in August, compared to expectations for a 1.0% drop MoM.
Chicago Federal Reserve (Fed) President Austan Goolsbee said on Thursday that the Fed will return inflation to target and has a chance to do something rare by accomplishing that without a recession. Richmond Fed President Thomas Barkin remarked that the past five months of inflation data have been upbeat but that it is too early to determine what monetary policy would be next. Barkin added that lost data due to the government shutdown would complicate understanding the economy. Investors will assess the narrative of a higher for longer rate in the US against the growth risks posed by the possibility of an imminent US government shutdown. This, in turn, might cap the upside of the Greenback and act as a headwind for the USD/CHF pair.
On the Swiss Franc front, data released on Thursday showed that the Swiss ZEW Survey Expectations came in at -27.6 in September from the previous reading of -38.6. Even though the Swiss National Bank (SNB) paused its rate-hiking cycle at the September meeting, markets anticipate the SNB to maintain a hawkish stance in its monetary policy to protect against a possible spike in imported inflation.
Looking ahead, market players will monitor the Swiss annual Retail Retail Sales for August. The attention will shift to the US Core Personal Consumption Expenditure (PCE) Price Index, the Fed's preferred measure of consumer inflation, which is expected to decline from 4.2% to 3.9%.
| Index | Change, points | Closed | Change, % |
|---|---|---|---|
| NIKKEI 225 | -499.38 | 31872.52 | -1.54 |
| Hang Seng | -238.84 | 17373.03 | -1.36 |
| ASX 200 | -5.5 | 7024.8 | -0.08 |
| DAX | 106.05 | 15323.5 | 0.7 |
| CAC 40 | 44.45 | 7116.24 | 0.63 |
| Dow Jones | 116.07 | 33666.34 | 0.35 |
| S&P 500 | 25.19 | 4299.7 | 0.59 |
| NASDAQ Composite | 108.43 | 13201.28 | 0.83 |
| Pare | Closed | Change, % |
|---|---|---|
| AUDUSD | 0.64267 | 1.2 |
| EURJPY | 157.701 | 0.41 |
| EURUSD | 1.05641 | 0.56 |
| GBPJPY | 182.174 | 0.4 |
| GBPUSD | 1.22031 | 0.55 |
| NZDUSD | 0.59614 | 0.67 |
| USDCAD | 1.34852 | -0.09 |
| USDCHF | 0.91492 | -0.63 |
| USDJPY | 149.283 | -0.15 |


© 2000-2024. Уcі права захищені.
Cайт знаходитьcя під керуванням TeleTrade DJ. LLC 2351 LLC 2022 (Euro House, Richmond Hill Road, Kingstown, VC0100, St. Vincent and the Grenadines).
Інформація, предcтавлена на cайті, не є підcтавою для прийняття інвеcтиційних рішень і надана виключно для ознайомлення.
Компанія не обcлуговує та не надає cервіc клієнтам, які є резидентами US, Канади, Ірану, Ємену та країн, внеcених до чорного cпиcку FATF.
Проведення торгових операцій на фінанcових ринках з маржинальними фінанcовими інcтрументами відкриває широкі можливоcті і дає змогу інвеcторам, готовим піти на ризик, отримувати виcокий прибуток. Але водночаc воно неcе потенційно виcокий рівень ризику отримання збитків. Тому перед початком торгівлі cлід відповідально підійти до вирішення питання щодо вибору інвеcтиційної cтратегії з урахуванням наявних реcурcів.
Викориcтання інформації: при повному або чаcтковому викориcтанні матеріалів cайту поcилання на TeleTrade як джерело інформації є обов'язковим. Викориcтання матеріалів в інтернеті має cупроводжуватиcь гіперпоcиланням на cайт teletrade.org. Автоматичний імпорт матеріалів та інформації із cайту заборонено.
З уcіх питань звертайтеcь за адреcою pr@teletrade.global.
переклади