- Аналітика
- Новини та інструменти
- Новини ринків
Новини ринків
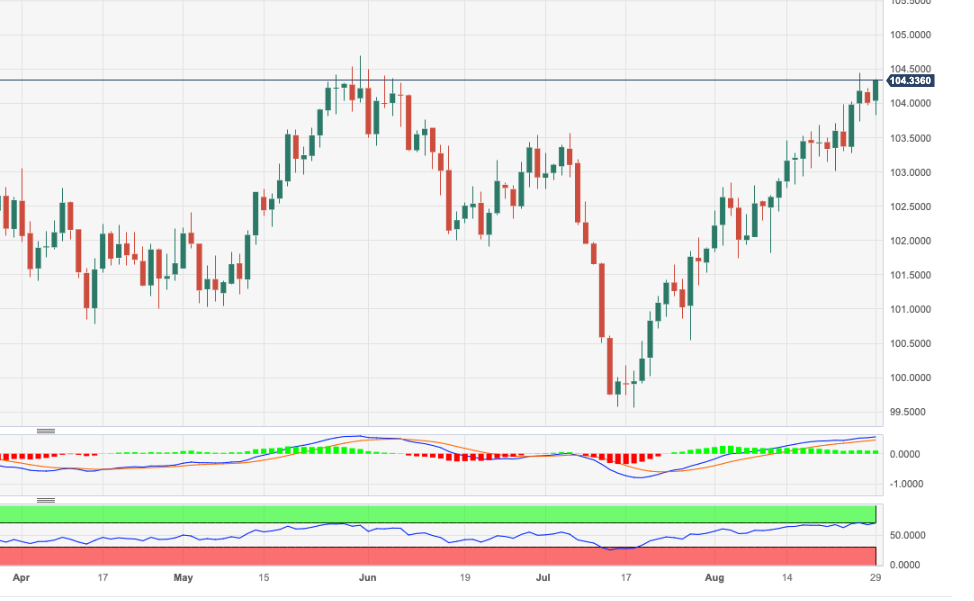
- US Dollar Index licks its wounds at weekly low after falling the most in 1.5 months the previous day.
- Downbeat US data pushed back Fed hawks and drowned Treasury bond yields, Greenback.
- US ADP Employment Change, PCE and Q2 GDP eyed for confirmations of no Fed rate hikes in 2023.
US Dollar Index (DXY) bears take a breather at the weekly low, making rounds to 103.50 by the press time, as markets await more clues to confirm the recent dovish bias about the Federal Reserve (Fed) due to the downbeat US data. That said, the Greenback’s gauge versus the six major currencies dropped the most in six weeks the previous day before stabilizing during Wednesday’s Asian session.
On Tuesday, the US Conference Board's (CB) Consumer Confidence Index slumped to 106.10 for August from a downwardly revised 114.00 prior (from 117.0), versus 116.0 market forecasts. That said, the US JOLTS Job Openings slumped to the lowest since March 2021, to 8.827M for July versus 9.465M expected and 9.165M prior (revised from 9.582). Additionally, the US Housing Price Index eased to 0.3% MoM for June from 0.7% prior and 0.2% while the S&P/Case-Shiller Home Price Indices improved to -1.2% YoY from -1.7% previous readings and -1.3% market forecasts.
It should be noted that Fed Chair Jerome Powell’s speech highlighted the data dependency for future moves, which in turn challenged the hawks after the disappointing US statistics.
Following the data, the CME’s FedWatch Tool signaled a 16% chance of a rate hike versus 20% prior. The same propelled Wall Street benchmarks and weighed on the US Treasury bond yields, as well as the US Dollar. That said, the Wall Street benchmarks rose for the third consecutive day while the US 10-year Treasury bond yields dropped to the lowest level in 13 days by the end of Tuesday’s North American trading session.
Not only the downbeat US statistics but the hopes of witnessing more stimulus from China and upbeat performances of the equities also weighed on the US Dollar Index (DXY). chatters about the early rate cuts from the People’s Bank of China (PBoC) and a cut into the mortgage rates from the Dragon Nation also helped the traders to remain hopeful.
Alternatively, US Commerce Secretary Gina Raimondo’s complaints about the hardships for the US firms in China prod the DXY bears. On the same line could be the International Monetary Fund’s (IMF) readiness to be more cautious while allocating the Special Drawing Rights (SDRs) in the future, due to the current environment of higher interest rates and inflation.
Looking forward, more clues of witnessing the Fed’s policy pivot in 2023 will be eyed and can weigh on the US Dollar Index. That said, today’s US ADP Employment Change, the final readings of the US second quarter (Q2) Gross Domestic Product (GDP) and the Personal Consumption Expenditure (PCE) are the key to watch.
Technical analysis
A daily closing below the six-week-old rising support line, now immediate resistance around 103.95, directs the US Dollar Index (DXY) bears toward the 200-DMA support of near 103.10.
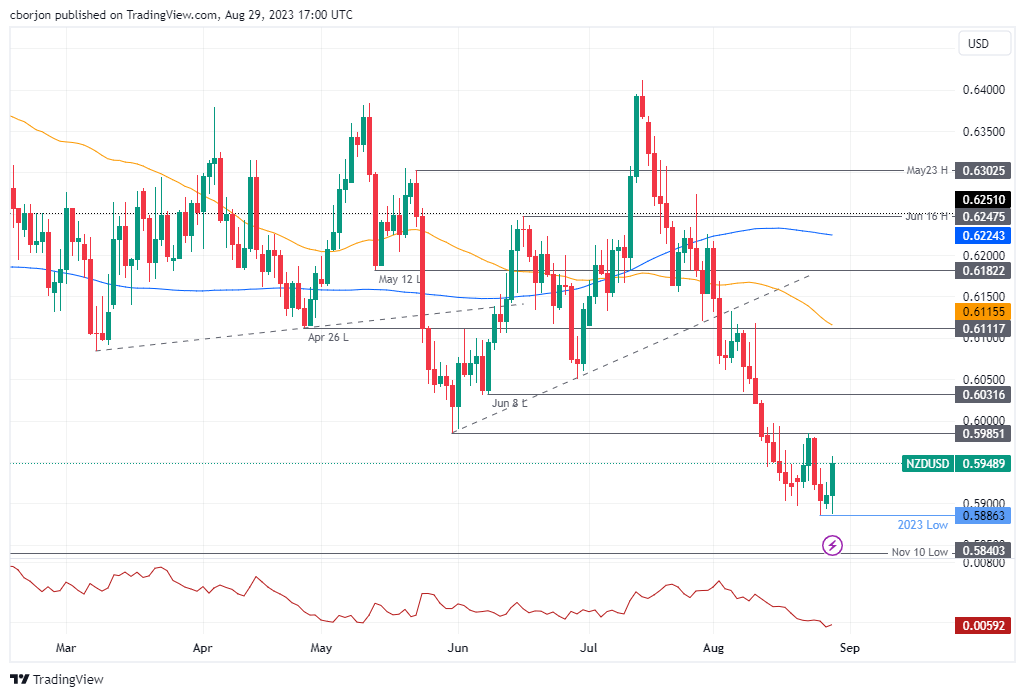
- NZD/USD edges higher to 0.5970 amid the weakening of USD.
- New Zealand’s Building Permits MoM for July fell 5.2% from an increase of 3.4% in the previous month.
- The renewed trade tension between US-China could exert pressure on the Kiwi.
- Investors will focus on the US ADP private employment, GDP growth report ahead of the Nonfarm Payrolls.
The NZD/USD pair attracts some buyers and gains momentum below the 0.6000 barrier during the early Asian session on Wednesday. The pair currently trades around 0.5971, up 0.01% on the day.
The latest data by Statistics New Zealand showed that the country’s Building Permits MoM for July fell 5.2% from an increase of 3.4% in the previous month. The figure came in below the market expectation of a 0.2% rise.
Apart from the data, the chief economist of the Reserve Bank of New Zealand (RBNZ) stated last week that policymakers would cut the OCR earlier than signaled if China experienced a more significant slowdown than the RBNZ anticipates.
About the US-Sino relationship, US Commerce Secretary Gina Raimondo visited Beijing for four days and brought up concerns from American businesses that China is "uninvestible" and "risky to do business" because of its fines, raids, and other actions, said Reuters. The renewed trade tension between the world’s two largest economies could exert pressure on the China-proxy Kiwi and act as a headwind for the NZD/USD pair.
On the US Dollar front, the Greenback faces some follow-through selling following the softer economic data. The US Job Openings and Labor Turnover Survey (JOLTS) for July decreased to 8.827M versus 9.165M prior and against the 9.465M expected. The figure showed the lowest reading since March 2021. Meanwhile, the Conference Board's (CB) Consumer Confidence Index for August dropped to 106.10 from 114.00 in July, below the market consensus of 116.0. The S&P/Case-Shiller Home Price Indices improved to -1.2% YoY versus -1.7% prior and -1.2% market expectations.
Federal Reserve (Fed) Chairman Jerome Powell stated last week that the central bank opened the door for an additional rate hike if required. But it would be determined by incoming data. That said, the labor market condition might influence the USD's short-term direction. Market players await more US labor data due later this week for fresh impetus and these events could trigger the volatility in the market.
Market participants will monitor the US ADP private employment and estimate Q2 Gross Domestic Product (GDP) data due on Wednesday. Later in the week, the US preliminary Gross Domestic Product Annualized (GDP), Core Personal Consumption Expenditures (PCE) Index, and the weekly Jobless Claims will be released. The attention will shift to the Nonfarm Payrolls (NFP) data on Friday. The events will be critical for determining a clear movement for the NZD/USD pair.
- GBP/USD buyers seek fresh clues after cheering the biggest daily jump in three weeks.
- Successful rebound from 15-week-old horizontal support, upbeat oscillators keep Cable buyers hopeful.
- 50-SMA will test immediate upside of the Pound Sterling before the key resistance line.
- British Consumer Credit, key US employment, inflation clues eyed for clear directions.
GBP/USD seesaws around 1.2650 after rising the most in three weeks the previous day. In doing so, the Cable pair portrays the market’s cautious mood ahead of a slew of statistics from the UK and the US.
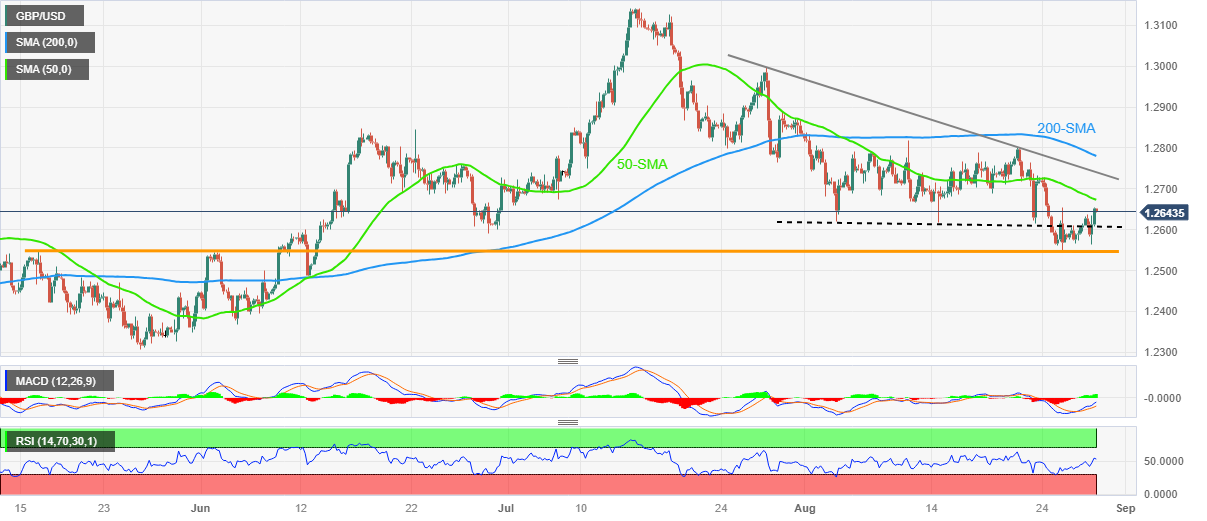
It’s worth noting that the Pound Sterling’s extension of Friday’s rebound from a horizontal support zone comprising the tops marked in May and June, around 1.2550, joins the bullish MACD signals and the upbeat RSI (14) line to keep the buyers hopeful.
However, the 50-SMA level of around 1.2675 will test the GBP/USD pair’s immediate upside ahead of a one-month-old descending resistance line surrounding 1.2740.
In a case where the Cable remains firmer past 1.2740, the 200-SMA level of around 1.2780 and the August 10 peak of near 1.2820 will be on the bull’s radar.
On the flip side, the GBP/USD pair’s pullback may initially aim for the three-week-old support line surrounding 1.2600 before challenging the aforementioned key horizontal trend line comprising levels marked since mid-May, close to 1.2550 at the latest.
Should the Pound Sterling remain weak past 1.2550, the odds of witnessing a quick drop to the mid-June swing low of around 1.2485 can’t be ruled out.
That said, the UK Consumer Credit for July will entertain GBP/USD ahead of the US ADP Employment Change, the final readings of the US second quarter (Q2) Gross Domestic Product (GDP) and the Personal Consumption Expenditure (PCE).
Also read: GBP/USD regains the 100-day SMA as US yields sink
GBP/USD: Four-hour chart
Trend: Further upside expected
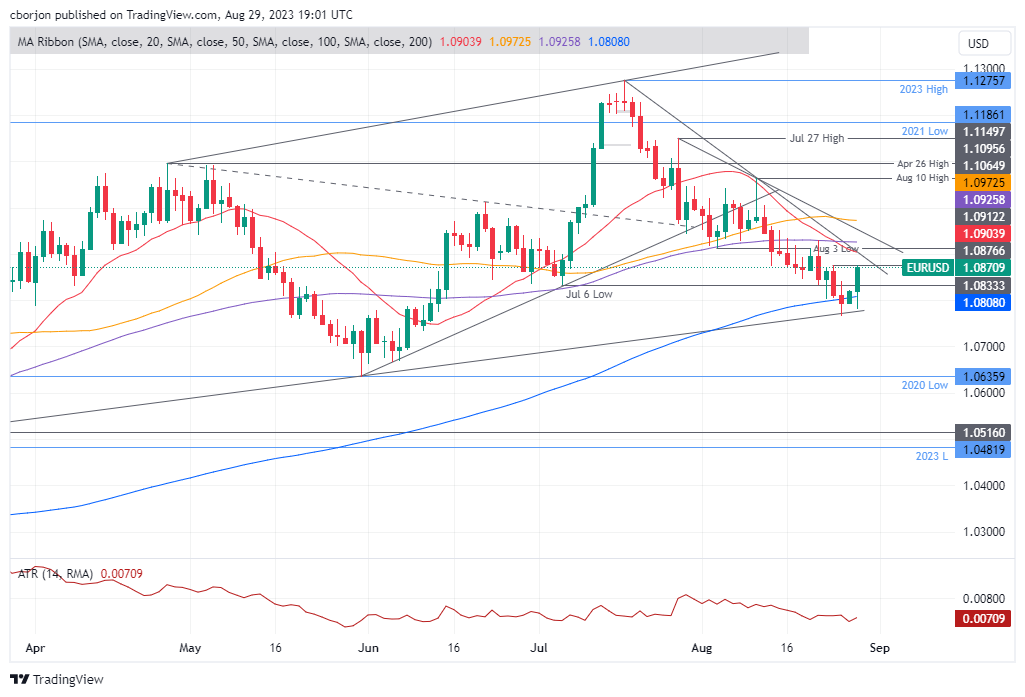
- EUR/USD gains momentum near 1.0880 amid the USD weakness.
- The Fed rate hike expectations lowered following the softer US data.
- The German Gfk Consumer Confidence Survey (Sep) came in at -25.5 versus -24.6 prior.
- Market players await German CPI, US ADP private employment, estimate of US GDP Q2.
The EUR/USD pair surges above the 1.0880 mark during the early Asian session on Wednesday. The weaker US dollar and a sharp drop in US Treasury yields drags the Greenback lower across the board. The major currently trades around 1.0880, gaining 0.01% on the day. Meanwhile, the US Dollar Index (DXY) breaks below the key support level at 103.50 while the 10-year yield fell from 4.20% to 4.12%, the lowest level in two weeks.
On Tuesday, the US Conference Board's (CB) Consumer Confidence Index for August dropped to 106.10 from 114.00 in July, below the market consensus of 116.0. In addition, the US JOLTS Job Openings for July decreased to 8.827M versus 9.165M prior and against the 9.465M expected. The figure showed the lowest reading since March 2021. Finally, the S&P/Case-Shiller Home Price Indices improved to -1.2% YoY versus -1.7% prior and -1.2% market expectations. In response to the data, the USD loses momentum significantly and faces its most significant decline in over a month.
The labor market in the US is easing, but not as the Federal Reserve (Fed) expected. The market anticipated that the Fed will push back rate hikes until the September meeting. According to the CME’s FedWatch Tool, markets are pricing in a 16% chance of a rate hike in September meeting versus 20% prior. This, in turn, exerts some selling pressure on the USD.
On the other hand, the German Gfk Consumer Confidence Survey for September came in at -25.5 versus -24.6 prior and worse than the expectation of -24.3. Meanwhile, the Eurozone money supply fell for the first time since 2010 as private sector lending slowed and deposits fell. The latest data might convince the European Central Bank (ECB) to pause interest rates at its next meeting on September 14.
Looking ahead, the US ADP private employment and estimate of Q2 Gross Domestic Product (GDP) data will be due on Wednesday, followed by the US inflation data on Thursday and the highly-anticipated Nonfarm Payrolls on Friday. On the EU docket, the preliminary Spanish and German Consumer Price Index (CPI) for August will be released as well as the ECB Meeting Minutes. Traders will take cues and find trading opportunities around the EUR/USD pair.
- Gold Price stays firmer at three-week high as bulls attack $1,945 resistance confluence.
- Sustained upside break of $1,910 support confluence, softer US Dollar favor XAU/USD bulls.
- China stimulus, downbeat United States Treasury bond yields also propel the Gold Price.
- US ADP Employment Change, PCE details and Q2 GDP eyed for intraday directions of XAU/USD.
Gold Price (XAU/USD) stays firmer at the highest level in three weeks despite making rounds to $1,937-38 amid the early hours of Wednesday’s Asian session. In doing so, the precious metal cheers the broad US Dollar weakness ahead of the key United States (US) data. Also favoring the XAU/USD are the downbeat US Treasury bond yields and hopes of more stimulus from China. However, the recent headlines surrounding the US-China ties and the International Monetary Fund’s (IMF) cautious view about the future allocations of the Special Drawing Rights (SDRs) seem to prod the Gold buyers ahead of the second-tier US statistics.
Gold Price rises as softer United States data weigh on US Dollar, yields
Gold Price crossed the 50-day Simple Moving Average (SMA), as well as rose the most in a week, after the United States data challenged the Federal Reserve (Fed) hawks on Tuesday. Adding strength to the XAU/USD upside were concerns about more stimulus from China, one of the biggest Gold customers, as well as the downbeat US Treasury bond yields.
On Tuesday, the US Conference Board's (CB) Consumer Confidence Index slumped to 106.10 for August from a downwardly revised 114.00 prior (from 117.0), versus 116.0 market forecasts. That said, the US JOLTS Job Openings slumped to the lowest since March 2021, to 8.827M for July versus 9.465M expected and 9.165M prior (revised from 9.582). Additionally, the US Housing Price Index eased to 0.3% MoM for June from 0.7% prior and 0.2% while the S&P/Case-Shiller Home Price Indices improved to -1.2% YoY from -1.7% previous readings and -1.3% market forecasts.
It’s worth noting that the mostly downbeat US data fuelled fears of the Fed’s September policy pivot. With this, the CME’s FedWatch Tool signals 16% chance of a rate hike versus 20% prior. The same propelled Wall Street and weighed on the US Treasury bond yields, as well as the US Dollar. That said, the Wall Street benchmarks rose for the third consecutive day while the US 10-year Treasury bond yields dropped to the lowest level in 13 days by the end of Tuesday’s North American trading session. Further, the US Dollar Index (DXY) fell the most in six weeks to around 103.50 at the latest.
Elsewhere, chatters about the early rate cuts from the People’s Bank of China (PBoC) and a cut into the mortgage rates from the Dragon Nation also helped the Gold buyers to remain hopeful. However, US Commerce Secretary Gina Raimondo’s complaints about the hardships for the US firmer in China prod the XAU/USD bulls. On the same line could be the International Monetary Fund’s (IMF) readiness to be more cautious while allocating the Special Drawing Rights (SDRs) in the future, due to the current environment of higher interest rates and inflation.
US employment, inflation clues will direct XAU/USD moves
Having witnessed a stellar run-up due to the downbeat US Dollar, the Gold Price may witness a consolidation ahead of the early signals of US employment and inflation. Among them, the US ADP Employment Change, the final readings of the US second quarter (Q2) Gross Domestic Product (GDP) and the Personal Consumption Expenditure (PCE) are the key to watch. Should the scheduled macro data flash downbeat signals, the hardships for the Federal Reserve (Fed) hawks will escalate, which in turn may allow the XAU/USD to cross the immediate $1,945 resistance confluence stated below.
Also read: Gold Price Forecast: XAU/USD extends rally on broad US Dollar sell-off
Gold Price Technical Analysis
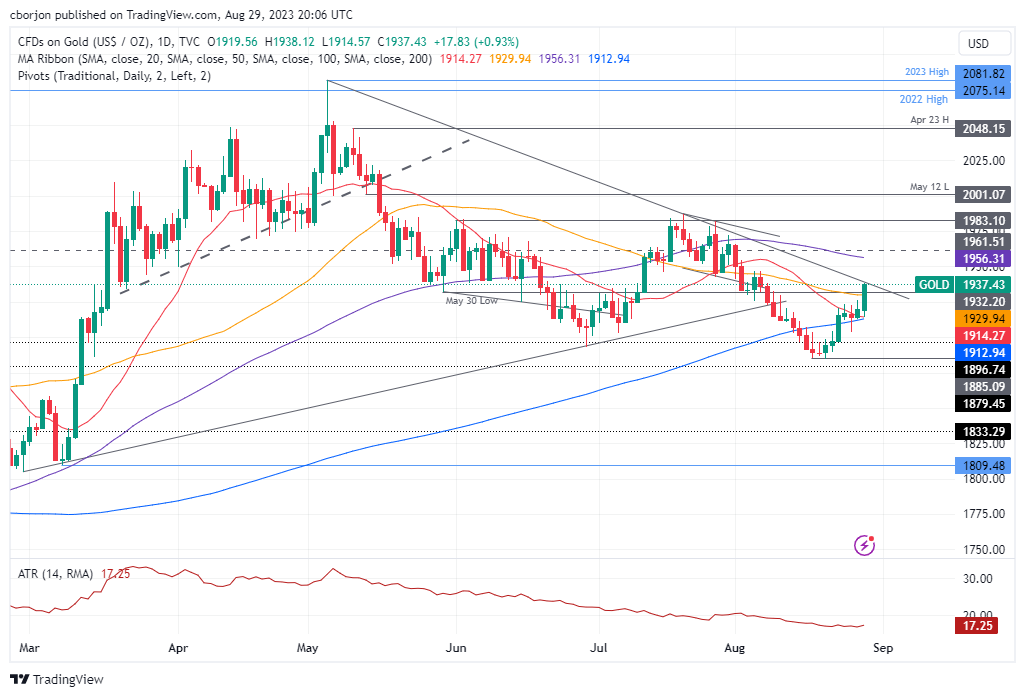
Gold Price justifies the sustained trading beyond the $1,910 support confluence, as well as the upside break of the 50-day Simple Moving Average (DMA), while pleasing buyers at the highest levels in three weeks.
Adding strength to the upside bias about the XAU/USD are the bullish signals of the Moving Average Convergence and Divergence (MACD) indicator and the firmer Relative Strength Index (RSI) line, placed at 14, not overbought.
With this, the Gold Price appears all set to prod the $1,945 key resistance comprising the 50% Fibonacci retracement of February–May upside and a downward-sloping trend line from the yearly top marked in May.
However, a daily closing beyond the said $1,945 resistance will allow the Gold buyers to aim for the previous monthly high of around $1,987 before challenging the $2,000 threshold.
On the contrary, the 50-DMA level of near $1,930 restricts the immediate downside of the XAU/USD ahead of the $1,910 support confluence encompassing the 200-DMA and the 61.8% Fibonacci retracement, also known as the Golden Ratio.
Should the Gold Price remain weak past $1,910, the $1,900 round figure and the monthly low of around $1,885 will test the bears ahead of highlighting a horizontal support zone including multiple levels marked in February and early March, close to $1,858–61.
Gold Price: Daily chart

Trend: Further upside expected
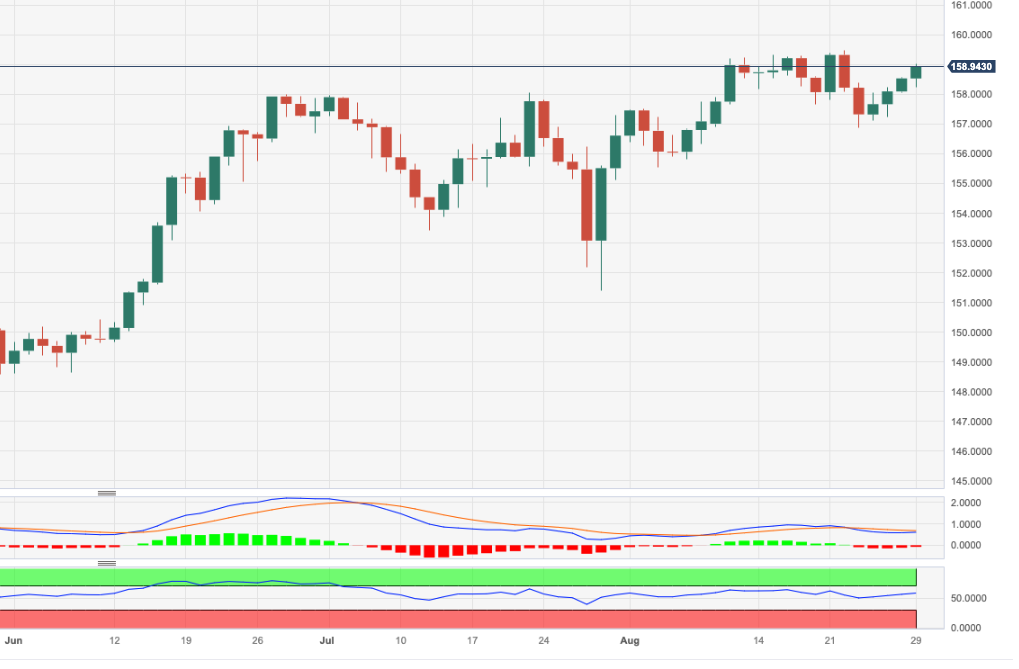
- EUR/JPY remains neutral with an upward bias, trading flat shy of testing year-to-date highs.
- A reclaim of the YTD high at 159.49 could set the stage for a run at 160.00, while a drop below the Tenkan-Sen line at 158.18 signals a potential downside.
The Euro (EUR) extended its gains against the Japanese Yen (JPY) on Tuesday, but as Wednesday’s Asian session begins, the EUR/JPY cross-currency pair remains flat at around 158.68, shy of testing year-to-date (YTD) highs.
EUR/JPY Price Analysis: Technical outlook
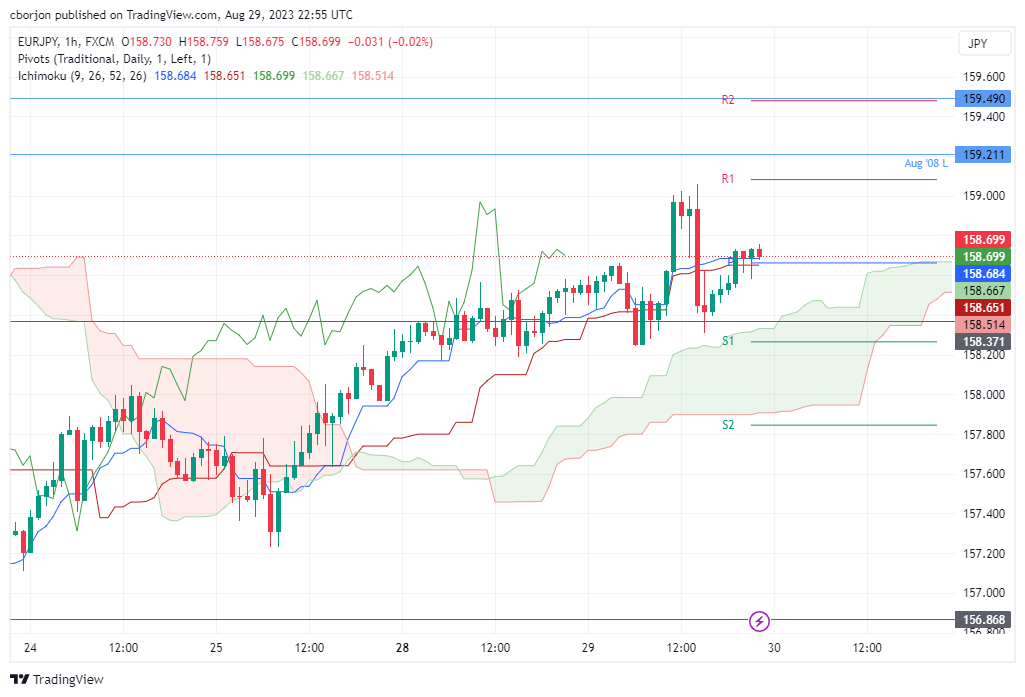
From a daily chart standpoint, the EUR/JPY remains neutral to an upward bias. But given that the last swing low was at 156.86, below the August swing low of 157.65, the current leg-up could be viewed as an upward correction. However, if buyers reclaim the YTD high at 159.49, that would pave the way for 160.00. Conversely, a drop below the Tenkan-Sen line at 158.18 can open the door for further downside.
In the short-term, the EUR/JPG is upward biased, but it needs to reclaim above the August 29 daily high of 159.06 to test YTD highs. Otherwise, if the cross dives below the Tenkan and Kijun-Sen lines at around 158.68/65, the pair could descend to the top of the Ichimoku Cloud (Kumo) at 158.33, followed by the S1 daily pivot at 158.25.
EUR/JPY Price Action – Hourly chart
Officials from the International Monetary Fund (IMF) praised the global lender’s allocation of the Special Drawing Rights (SDRs) while also cautioning against rushing into future allocations considering the current environment of higher interest rates and inflation, per Reuters.
The news cites a blog post from IMF Finance Director Bernard Lauwers and Strategy Chief Ceyla Pazarbasioglu to highlight the fears about not-so-easy lending practices in the future.
"While an SDR allocation is a very useful and important mechanism to build confidence and strengthen global economic and financial resilience, it is not a silver bullet," the heads of the IMF's finance and strategy departments wrote in a new blog released alongside a full report on the issue said Reuters.
The news also cites the IMF’s close to $1 trillion in SDRs allocated to date as an alarm for being cautious while praising the latest, as well as the largest, tranche of relief package of around $650 billion to battle COVID.
Market implications
The news challenges the future money flow from the global lender and prods the risk-on mood, which in turn could be cited as a catalyst for the latest inaction of the AUD/USD pair, a risk barometer. That said, the Aussie pair rallied the most in a week the previous day before recently making rounds to 0.6480.
Also read: AUD/USD bulls cheer softer US data to approach 0.6500, Australia inflation eyed
During her four-day visit to Beijing, US Commerce Secretary Gina Raimondo raised complaints from the US companies about China being "uninvestible" and “risky to do business” with its fines, raids and other actions.
More to come
- AUD/USD edges higher after rising the most in a week.
- US consumer sentiment, employment signals challenge Fed hawks and weigh US Dollar, yields.
- RBA’s Governor-Designate Bullock’s hawkish comments also keep Aussie pair buyers hopeful.
- Australia Monthly CPI, housing signals will entertain traders ahead of early signals for US employment, inflation and growth.
AUD/USD seesaws at the weekly high around 0.6480 after posting the stellar run-up on downbeat US data. It’s worth noting that the hawkish comments from Reserve Bank of Australia (RBA) Governor-Designate Michelle Bullock also favor the Aussie pair buyers as markets brace for the key Australia inflation data on early Wednesday.
On Tuesday, the Reserve Bank of Australia (RBA) Governor-Designate Michelle Bullock crossed wires while speaking at the Sir Leslie Melville Lecture at the Australian National University, in Canberra. In doing so, the policymaker initially conveyed too high inflation as her priority as Governor before flagging hopes of raising rates again. However, RBA’s Bullock also showed readings to watch data carefully for further decision-making.
On the other hand, the US Conference Board's (CB) Consumer Confidence Index slumped to 106.10 for August from a downwardly revised 114.00 prior (from 117.0), versus 116.0 market forecasts. That said, the US JOLTS Job Openings slumped to the lowest since March 2021, to 8.827M for July versus 9.465M expected and 9.165M prior (revised from 9.582). Additionally, the US Housing Price Index eased to 0.3% MoM for June from 0.7% prior and 0.2% while the S&P/Case-Shiller Home Price Indices improved to -1.2% YoY from -1.7% previous readings and -1.3% market forecasts.
With the mostly downbeat US data, fears of the Fed’s September policy pivot escalate as the CME’s FedWatch Tool signals 16% chance of a rate hike versus 20% prior. The same propelled Wall Street and weighed on the US Treasury bond yields, as well as the US Dollar.
It’s worth noting, however, that a lack of impressive updates from the US-China talks in Beijing and fears of the International Monetary Fund’s (IMF) pause to the easy-lending prod the AUD/USD bulls, apart from the pre-data anxiety.
Moving on, Aussie housing numbers may entertain the pair traders but major attention will be given to the Australia Monthly Consumer Price Index (CPI) for July, expected to ease to 5.2% from 5.4% prior. Should the numbers ease, the AUD/USD may have a reason to pare the latest gains. It should be noted that strong prints of Aussie inflation don’t mean the pair’s permanent rally as the US ADP Employment Change, the final readings of the US second quarter (Q2) Gross Domestic Product (GDP) and the Personal Consumption Expenditure (PCE) are on the calendar. Should these early signals of the US employment and inflation rally, the US Dollar may pare the latest losses.
Also read: Australian Inflation Preview: Surprises in Monthly Consumer Price Index to rock the Aussie
Technical analysis
A daily closing beyond six-week-old falling resistance line, around 0.6430 by the press time, keeps the AUD/USD pair buyers hopeful.
- Hurricane Idalia set to hit Florida, causing WTI crude to jump 1.5%, trading at $81.28 after a daily low of $79.39.
- US Dollar Index (DXY) falls below 104.000, weakened by poor jobs data and declining consumer confidence, providing a tailwind for oil prices.
- American Petroleum Institute reports a significant 11.5 million barrel drop in US crude inventories, far exceeding estimates of a 3.3 million barrel decline.
Western Texas Intermediate (WTI), the US crude oil benchmark, registers gains of more than1.50%, as hurricane Idalia is set to hit Florida this week. That, alongside a frail US Dollar (USD), was a tailwind for oil prices, which jumped above $80.00 a barrel on Tuesday. WTI is trading at $81.28 after hitting a daily low of $79.39.
Oil prices rally amid looming Florida hurricane and dismal US economic data
Worse than expected economic data in the jobs market weakened the greenback, which fell below the 104.000 mark, as shown by the US Dollar Index (DXY). The DXY, which measures a basket of six currencies against a basket of peers, registers losses of 0.56%, down at 103.477, as of writing.
The US JOLTs report for July showed that job openings tumbled below estimates and the previous month’s reading, suggesting the labor market is cooling and it might help the US Federal Reserve (Fed) to curb high inflation without further increases in the Federal Funds Rate (FFR). That, alongside decaying consumer confidence announced by the Conference Board (CB), pressured the US Dollar.
In the meantime, Hurricane Idalia was forecast to reach level 3 with winds of at least 111 mph (179 kph) before touching ground in the early hours of Wednesday. According to Reuters, Idalia would likely impact fuel distribution systems and hit fuel consumption just ahead of the Labor Day holiday on September 4.
Even though is not expected to hit oil platforms, some major companies evacuated staff. Data from the American Petroleum Institute (API) showed US crude oil inventories fell by 11.5 million barrels in the week of August 25, well above estimates of 3.3 million.
WTI Price Analysis: Technical outlook
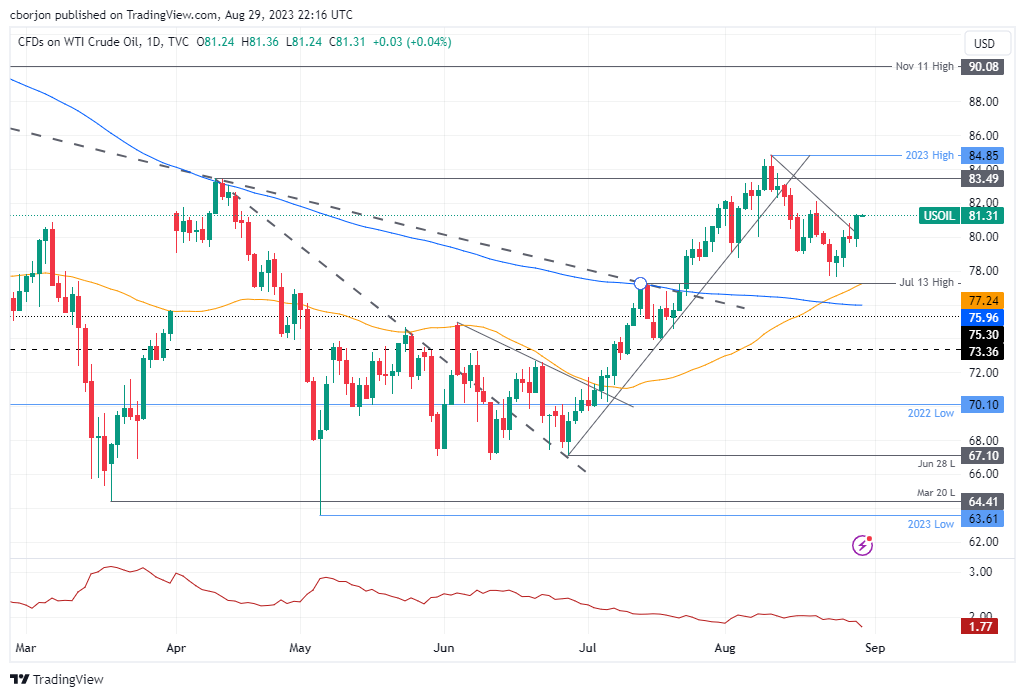
From a technical perspective, WTI remains upward biased after a golden cross formed on August 22, suggesting that oil prices are set to advance. Crude oil is trading at six-day highs, with buyers eyeing $82.00 as the next resistance, followed by the August 21 daily high at $82.13 before challenging the year-to-date (YTD) high of $84.85. Conversely, WTI’s first support is $80.00, followed by $77.64, the August 24 daily low.
- XAG/USD advanced near the $24.70 area, showing more than 2% of daily gains.
- US Job Openings from July decreased to 8.827M, below the expectations.
- The US treasury bond yields sank, allowing the grey metal to gain traction.
On Tuesday, the Silver Spot Price XAG/USD gained momentum, advancing near the $25.00 area displaying more than 2% gains on the day. The lower JOLTS Job Openings from July opened the upside on the grey metal on the back, declining US treasury bond yields as investors are now pricing in rate cuts by the Federal Reserve (Fed) in June 2024.
In reaction to the lower-than-expected employment data from the US, investors are placing dovish bets on the Federal Reserve (Fed), causing the US yields to decrease. The 2-year yield declined to 4.88%, its lowest in almost three weeks, while the 5- and 10-year yields declined to 4.28% and 4.12%, respectively, showing more than 2% of daily losses. As US yields are the opportunity cost of holding the non-yielding Silver, the grey metal found demand.
As for now, the CME FedWatch Tool suggests that investors are betting on a no-hike in the following September 20 meeting, while the odds of a hike of 25 basis points (bps) stand near 40% for the November meeting. The decline in the US yields may be explained but markets now anticipating rate cuts in June 2024, sooner than the previous expectations of those happening in July.
Focus now shifts to Wednesday’s Gross Domestic Product (GDP) for Q2 and the ADP Employment Change from August, which will help investors model their expectations for the next Fed decisions.
XAG/USD Levels to watch
Based on the daily chart analysis, a bullish outlook is noted for XAG/USD short term. The Relative Strength Index (RSI) resides above its midline in positive territory with a northward slope, further validated by the green bars on the Moving Average Convergence Divergence (MACD), indicating a robust bullish momentum. Additionally, the pair is above the 20,100,200-day Simple Moving Average (SMA), indicating a favourable position for the bulls in the bigger picture.
Support levels: $24.30, $23.95 (100-day SMA), $23.30 (200-day SMA)
Resistance levels: $24.80, $25.00, $25.10
XAG/USD Daily Chart
-638289433159050509.png)
Early on Wednesday, New Zealand will release Building Permits data, and later Australia will do the same. The crucial report of the Asian session will be the Australian Monthly Consumer Price Index for July. Later, Japan will release consumer confidence data. Additionally, Germany's preliminary inflation figures and the US ADP Employment Report are also due.
Here is what you need to know on Wednesday, August 30:
The US Dollar Index experienced its most significant decline in over a month. The US JOLTS Job Openings and CB Consumer Confidence data came in below expectations, leading to a sharp drop in US Treasury yields. The 10-year yield fell from 4.20% to 4.11%, reaching its lowest level in two weeks. The DXY index broke below 104.00, falling below 103.50.
The correction of the US Dollar appears likely to continue, but upcoming US data will be crucial in determining its direction. On Wednesday, the ADP private employment report and another estimate of Q2 GDP growth will be released. Consumer inflation data will be released on Thursday, followed by Nonfarm Payrolls on Friday. These numbers could further impact the US Dollar if they continue to soften expectations of monetary policy tightening.
Another factor that weakened the greenback was increased risk appetite, as commodity prices rose and stocks on Wall Street surged. The Dow Jones gained 0.85%, and the Nasdaq rallied 1.74%. Crude oil prices gained more than 1.5%.
EUR/USD rebounded from below 1.0800 and approached the 20-day Simple Moving Average (SMA). On Wednesday, Spain and Germany will release their preliminary August Consumer Price Index (CPI) figures, which will be critical for expectations regarding the actions of the European Central Bank at the September meeting.
The weaker US Dollar pushed GBP/USD towards the 1.2650 resistance area. EUR/GBP continued to rise, surpassing 0.8600 to reach its highest level in two weeks. On Wednesday, the UK will report lending data.
USD/JPY reversed sharply from its highest level since November, falling below 146.00 after nearing 147.40. Japan will report Consumer Confidence data on Wednesday.
The New Zealand Dollar outperformed among G10 currencies on Tuesday. NZD/USD rose from 0.5900 to 0.5972. The pair faces a crucial barrier at 0.5990, which is a horizontal level and the 20-day SMA.
AUD/USD is trading above the 20-day SMA after a sharp rise from 0.6415 to 0.6480. On Wednesday, Australia's July Monthly Consumer Price Index (CPI) is due, and it is expected to decline to 5.2%.
Australian Inflation Preview: Surprises in Monthly Consumer Price Index to rock the Aussie
USD/CAD retraced from monthly highs at 1.3640 to 1.3555, reaching its lowest close in five days. The correction is expected to continue, but it will depend on US data not surprising the market.
Gold jumped, boosted by lower Treasury yields, reaching $1,937, the highest level since August 8. Silver finally broke above $24.40 and surged to $24.75. Cryptocurrencies also enjoyed a rally, with Bitcoin soaring 6.75% to $27,725.
Like this article? Help us with some feedback by answering this survey:
- GBP/USD rose above the 1.2645 area and reconquered the 100-day SMA.
- JOLT's Job Opening figures hinted at a softening of the US Labour market.
- US dived as markets are pricing in rate cuts in June 2024.
- Food inflation in the UK declined in August.
In Tuesday’s session, the USD weakened against most of its rivals, driven by weaker-than-expected employment data, which fueled dovish bets on the Federal Reserve (Fed). In addition, the GBP also traded weak against most of its rivals following the release of food inflation figures from the UK in August.
The US Bureau of Labor Statistics reported that the JOLTs Job Openings figures from the United States missed the consensus in July. The actual figure came in at 8.82 million, lower than the expected 9.465 million from the previous reading of 9.16 million. As a reaction, the 2-year yield led to a decline in the US bond rates, falling by more than 3% to its lowest level in almost three weeks. That fall could be explained by markets now pricing in rate cuts by the Fed in June while markets placed bets on July in the previous sessions.
On the other hand, the British Retail Consortium reported a decrease in shop price inflation, which dropped to 6.9% YoY from 7.6% in July. That being said, hawkish expectations on the Bank of England (BoE) remain steady, and the World Interest Rates Probabilities (WIRP) tool suggests that markets are factoring in a 75% probability of a 25bps hike by the upcoming Sep 21, 2023 meeting from the Bank of England (BoE). Looking ahead, the likelihood of a similar hike stands at 80% in November, followed by a 90% chance of a 25bps hike in the December meeting, bringing the target rate to 6%. In that sense, tightening expectations may limit the GBP’s losses.
GBP/USD Levels to watch
Considering the daily chart, GBP/USD presents a neutral to bullish outlook, with the bulls showing resilience and gaining momentum. The Relative Strength Index (RSI) holds a positive slope below its midline, while the Moving Average Convergence (MACD) histogram exhibits decreasing red bars. Furthermore, the pair is below the 20-day Simple Moving Average (SMA) but above the 100 and 200-day SMAs, indicating that the bulls still have the upper hand when looking at the broader picture.
Support levels: 1.2642 (100-day SMA), 1.2600, 1.2550.
Resistance levels: 1.2670, 1.2700 (20-day SMA), 1.2730.
GBP/USD Daily Chart
-638289379731122546.png)
- US Bureau of Labor Statistics showed that job openings for July came in at 8.827M, well below the expected 9.465M, while Consumer Confidence deteriorated.
- The CME FedWatch Tool shows a reduced likelihood of a Fed rate hike in September, now at just 13.5%, while odds for a November hike stand at 43.3%.
- Market participants are eyeing the US Nonfarm Payrolls report for August and other key economic indicators from the US, which could trigger further volatility in gold prices.
Gold price advances almost 1% as the Greenback (USD) gets battered across the board, undermined by falling US Treasury bond yields after data prompted investors to cut bets on additional rate hikes by the US Federal Reserve (Fed). Hence, XAU/USD is trading at $1,937.89 a troy ounce after hitting a daily low of $1,914.57.
XAU/USD rises to $1,937.89 amid lower odds for a September Fed rate hike and falling US Treasury yield
Data released by the US Bureau of Labor Statistics (BLS) indicated a substantial miss in Job Openings for July, falling far short of the estimated 9.465 million at 8.827 million and below June’s 9.165 million. This, coupled with a decline in the quits rate, suggests reduced confidence among Americans regarding their prospects for finding a new job.
Concurrently, additional data revealed that the Consumer Confidence poll by the Conference Board (CB) depicted a worsening sentiment, as evident in August’s report. The figures stood at 106.1, notably below the projected 116 and July’s 114, underlining consumers’ growing sense of unease. Dana Peterson, the chief economist at the Conference Board, said, “Consumers were once again preoccupied with rising prices in general and for groceries and gasoline in particular.”
It’s worth noting that the labor market in the US is gradually easing, albeit not at the pace initially anticipated by the Federal Reserve. Powell’s comments regarding the tightness of the job market, which supported rate hikes, might be set aside for the September meeting. Nonetheless, the approaching US Nonfarm Payrolls report for August, estimated at around 170,000 jobs, advises a cautious approach. An unexpected increase could incite volatility within financial markets as traders scale back their expectations for additional Federal Reserve rate hikes.
The CME FedWatch Tool odds for a rate hike to the 5.50%-5.75% range at the September meeting are lowering, at 13.5%, while for the November meeting, remain at around 43.3%.
Consequently, the buck remains soft, as shown by the US Dollar Index (DXY). The DXY, which measures the buck’s value vs. a basket of six currencies, remains at 103.433, dropping 0.53%. Factors like traders expecting a less aggressive Fed are reflected by falling US bond yields, which undermined the US Dollar.
Across the pond, the US ADP Employment Change for August and PCE Prices for the second quarter (Q2) 2023 are expected.
XAU/USD Price Analysis: Technical outlook
From a technical perspective, the Gold price seems set to test the 100-day Simple Moving Average (DMA) at $1,956.31 after reclaiming the 20 and 50-DMAs. Nevertheless, it should be said XAU/USD is testing a four-month-old downslope resistance trendline, previously tested on July 27; however, the non-yielding metal, unable to crack it, dropped to fresh 5-month lows of $1,885.09. A breach of that level would expose the 100-DMA. Otherwise, first support emerges at the 50-DMA at $1,929.94, followed by the 20-DMA at $1,914.30, before challenging the 200-DMA at $1,912.94.
- US Job Openings missed estimates while Consumer Confidence declined.
- After US data, the Fed rate hike expectations lowered.
- Germany’s economic data, alongside the US ADP report, to provide direction on the EUR/USD pair.
The Euro (EUR) is rallying sharply vs. the US Dollar (USD), reaching a three-day high above 1.0870 after economic data from the United States (USD) elevated chances the US Federal Reserve (Fed) would refrain from tightening monetary conditions in September. Hence, the EUR/USD is trading at 1.0876 after hitting a low of 1.0782.
EUR/USD rallies to 1.0876 as US JOLTs dropped, alongside a worsening Consumer Confidence
Data from the US Bureau of Labor Statistics (BLS) showed that Job openings for July missed estimates of 9.465M by a large amount, coming at 8.827M, and below June’s 9.165M. That, alongside a drop in quits rate, implies that Americans are less confident of finding another job. Other data revealed at the same time, the Conference Board (CB) released its Consumer Confidence poll, showing that sentiment is worsening, as displayed by August’s report, with figures at 106.1, below forecasts of 116 and July’s 114.
Dana Peterson, the chief economist at the Conference Board, said, “Consumers were once again preoccupied with rising prices in general and for groceries and gasoline in particular.”
That said, the labor market in the US is beginning to loosen, not as quickly as expected by the Federal Reserve. Powell’s remarks about the tightness of the jobs market, justifying rate increases, could be pushed aside for the September meeting. Nevertheless, the upcoming US Nonfarm Payrolls report for August, with estimates of around 170K, suggests that caution is warranted. An uptick could trigger volatility amongst the financial markets as traders pared bets on further Fed rate hikes.
The CME FedWatch Tool odds for a rate hike to the 5.50%-5.75% range at the September meeting are lowering, at 13.5%, while for the November meeting, remain at around 43.3%.
In the meantime, the EUR/USD continues to print gains, but it has retreated from daily highs around the 1.0870s area. The Greenback (USD) remains the laggard in the session amongst G10 FX currencies, as depicted by the US Dollar Index (DXY) dropping 0.42%, at 103.545, weighed by falling US bond yields. Market participants are expecting a less aggressive Fed after today’s data.
On Tuesday, the Eurozone (EU) economic agenda was empty, but as the week advances, so do economic releases. Germany would reveal its GfK Consumer Confidence, expected to deteriorate further, while the Consumer Price Index (CPI) is expected to fall. The EU will also reveal its Consumer Confidence.
Across the pond, the US ADP Employment Change for August is expected, as well as PCE Prices for the second quarter (Q2) 2023.
EUR/USD Price Analysis: Technical outlook
The EUR/USD remains neutral to downward bias, well below the 20, 100, and 50-day Simple Moving Averages (DMAs) as potential resistance levels. To change the pair direction, buyers must reclaim the 1.0900 figure and the 20-DMA at 1.0903, with a daily close. A decisive break of that area would expose the 100-DMA at 1.0925. On the flip side, sellers leaning into that area could use it to re-enter the market to drag prices back toward the 1.0800 mark.
- AUD/USD rose to a 5-day high towards 0.6465 and threatened the 20-day SMA of 0.6475.
- Markets are now pricing in rate cuts by the Fed in June 2024.
- All eyes are now on US and Australia's mid- and high-tier economic data to be released this week.
The AUD/USD soared by 0.60% to the 0.6465 level, mainly driven by a USD weakness fueled by poor labour market figures from the US and markets consequently betting on sooner rate cuts by the Federal Reserve (Fed). On the AUD’s side, investors await housing data from Australia from July to be released Wednesday and the monthly Consumer Price Index (CPI) from July.
The USD took a hit after the US Job Openings and Labor Turnover Survey (JOLTS) declined to 8.82 million, lower than the market's expectations of 9.465 million. It is worth noticing that the labour market situation will highly determine the short-term USD trajectory as Federal Reserve officials and Jerome Powell stated that ongoing decisions will be decided “carefully”, pointing out that the labour market is still unbalanced. That said, markets could see volatility during this week when the US reports the ADP Employment Change from August on Wednesday and the Nonfarm Payrolls report from the same month.
The US Treasury yields for the 2, 5 and 10-year bond sharply decreased, reflecting dovish bets on the Federal Reserve. In line with that, World Interest Rates Probabilities (WIRP) show that markets are still betting on high chances of a 25 bps hike in November but have pushed back rate cuts by the Federal Reserve (Fed) from July to June.
AUD/USD Levels to watch
Based on the daily chart, AUD/USD maintains a neutral to bullish technical perspective, indicating that the bulls are making strides in regaining control. The Relative Strength Index (RSI) shows an upward trend below its midline, suggesting a potential resurgence of bullish strength, while the Moving Average Convergence (MACD) histogram prints bigger green bars. Moreover, the pair is below the 20,100 and 200-day Simple Moving Averages (SMAs), suggesting that the buyers are struggling to overcome the overall bearish trend, and the bears are still in charge.
Support levels: 0.6430, 0.6400, 0.6380.
Resistance levels: 0.6475 (20-day SMA), 0.6500, 0.6525.
AUD/USD Daily Chart
-638289306559579719.png)
- USD/CHF declined for a third consecutive day to 0.87800, below the 20-day SMA of 0.8800.
- US JOLTs from July came in lower than expected, which fueled a decrease in US bond yields.
- Hawkish bets on the Fed for November remain high—markets pricing in rate cuts In June 2024.
On Tuesday, the USD faced selling pressure after releasing soft labour market figures from the US. American Treasury bond yields declined, making the USD struggle to find demand in FX markets. However, tightening expectations on the Federal Reserve (Fed) remain intact, which could limit the downside for the Greenback. No relevant will be released during the session on the CHF's side.
The US reported weak labour market figures as the Job Openings and Labor Turnover Survey (JOLTS) decreased to 8.82 million. In contrast, the markets expected a reading of 9.465 million and decelerated from the last revised reading of 9.165 million. As a reaction, the US 2-year Treasury yield sharply decreased, more than 3% to 4.87%, as investors considered that the Federal Reserve would conduct its monetary policy decision “carefully” as stated by Jerome Powell at the Jackson Hole Symposium.
Focus now shifts to additional data released during the week, including ADP Employment Change and Nonfarm Payrolls from August, Gross Domestic Product (Q2) preliminary figures, and the Core Personal Consumption Expenditures (PCE) from July.
In the meantime, markets continue to bet on high chances of a 25 basis point hike by the Fed in November, which, according to the World Interest Rate Probabilities (WIRP) rose to nearly 70%. However, yields seem to be decreasing as markets adjusted their rate cuts expectations down to June from July.
USD/CHF Levels to watch
Analysing the daily chart, USD/CHF presents a bearish outlook for the short term. Both the Relative Strength Index (RSI) and Moving Average Convergence Divergence (MACD) show a weak buying momentum, with the Relative Strength Index (RSI) positioned above its midline and showcasing a southward slope. Moving Average Convergence Divergence (MACD) also displays red bars, further supporting the intensifying softening of the bullish momentum. Plus, the pair is above the 20-day Simple Moving Average (SMA) but below the 100 and 200-day SMAs, indicating that the bulls aren't done yet and that the outlook is still positive for the short term.
Support levels: 0.8770, 0.8750, 0.8730.
Resistance levels: 0.87850 (20-day SMA), 0.8800, 0.8890 (100-day SMA).
USD/CHF Daily Chart
-638289263896808657.png)
- NZD/USD rallies to 0.5945, reversing from yearly lows, as US Job Openings fall short of expectations, reducing odds of a Fed rate hike in September.
- Conference Board data shows declining Consumer Confidence and rising inflation expectations, adding pressure on the US Dollar.
- Chinese authorities’ commitment to economic stimulus boosts the Antipodean currency as traders pare back bets on Fed tightening, reflected in CME FedWatch Tool odds dropping to 86.5%.
The New Zealand Dollar (NZD) rallied sharply against the US Dollar (USD) after weaker-than-expected labor market data, which could warrant the Fed to keep rates unchanged at the next meeting. Alongside Chinese authorities’ compromise to spur economic stimulus in the country bolstered the Antipodean. The NZD/USD is trading at 0.5945, at new three-day highs, after testing yearly lows of 0.5886.
Kiwi Dollar gains as US JOLTs and Consumer Confidence miss estimates; less hawkish Fed expected
Given the remarks of the Federal Reserve Chair Jerome Powell that a tight labor market and the economy growing above trend could warrant further tightening, today’s jobs report, and increased expectations, the Fed might refrain from lifting rates in September.
The US Bureau of Labor Statistics (BLS) revealed that Job Openings declined from 9.165 M in June to 8.827 M in July and beneath estimates of 9.465M. That said, traders’ focus shifts to Friday’s US Nonfarm Payrolls report, with estimates of 170K jobs added to the economy, below the prior month’s 187K, which would mark back-to-back reports with lower readings than estimates.
In other data, the Conference Board (CB) showed Consumer Confidence is decaying, as exhibited by August data coming at 106.1, below July’s 114, and forecasts of 116. Dana Peterson, the chief economist at the Conference Board, said, “Consumers were once again preoccupied with rising prices in general and for groceries and gasoline in particular.”
The report highlighted that inflation expectations for a year ahead jumped to 5.8%. The CB poll showed Americans are confident about finding a job, which shows the labor market is beginning to feel the pain of 525 basis points of tightening by the Fed.
Following the data, the NZD/USD extended its gains past the 0.5900 figure, extending towards its daily high of 0.5956. The Greenback dropped sharply below the 104.000 mark, down 0.30% at 103.664, as traders pared bets the Fed would continue to lift rates. Reflection of that is the CME FedWatch Tool showing for keeping rates at 5.25%-5.50%, at 86.5%, from 78% a day ago.
In the meantime, during the Asian session, China revealed its commitment to strengthen policy support, speed up government spending, and boost the weaker economic recovery achieved so far during the year.
NZD/USD Price Analysis: Technical outlook
The pair remains downward biased, although it’s printing a leg-up from YTD lows. For buyers to resume their uptrend, they must reclaim the last higher-high at 0.5985, which could pave the way for further NZD/USD upside. Failure to do so could exacerbate a continuation of the downtrend, eyeing the YTD low of 0.5886, followed by the November 10 low of 0.5840.
- USD/JPY spiked to a cycle high of 147.35 during the Asian session.
- US JOLTs job opening came in lower than expected in July.
- Japan reported soft labour market figures.
On Tuesday, the USD/JPY reversed its course after rallying to a cycle high of 147.35 and settled below 146.00 at 145.95. On the US side, weak labour markets were reported, but on the positive side, optimistic Housing data was released. On the other hand, Japan reported weak labour market figures, which reminded investors about the Bank of Japan's (BoJ) dovish stance.
The JOLTs Job Openings from the United States came in lower than expected in July. The figure came in at 8.82 million, while the markets expected a reading of 9.465 million and decelerated from the last revised reading of 9.165 million. Additionally, S&P/Case-Shiller Home Prices increased by 0.3% vs 0.2% but still came in below the previous figure of 0.7%. As a reaction, the USD measured by the DXY index retreated towards 103.90, accompanied by a sharp decline in US bond yields. Focus now shifts to ADP Employment Change and Nonfarm Payrolls from August for investors to model their expectations regarding the next Federal Reserve Decisions.
On the Japanese side, the unemployment rate rose to 2.7% in July, beating the expected 2.5%, while the job-to-applicant ratio fell to 1.29, lower than the expected 1.30, and suggests that the labour market is weakening. It is worth noting that the BoJ has made it clear that until local wage and inflation metrics are aligned, any monetary policy pivots will be withheld. In that sense, weak figures from the Japanese economy support the ultra-dovish stance of the BoJ, leaving the JPY vulnerable against most of its rivals.
USD/JPY Levels to watch
The daily chart analysis shows that the short-term outlook for USD/JPY appears bullish. Both the Relative Strength Index (RSI) and Moving Average Convergence Divergence (MACD) maintain favourable positions, with the RSI above its midline and displaying an upward trend. Additionally, MACD exhibits green bars, indicating a strengthening bullish momentum. Moreover, the pair is above the 20,100,200-day Simple Moving Average (SMA), suggesting that the bulls are firmly in control of the bigger picture.
Support levels: 145.70, 145.50, 145.00.
Resistance levels: 147.00, 147.35, 147.50.
USD/JPY Daily Chart
-638289222579744083.png)
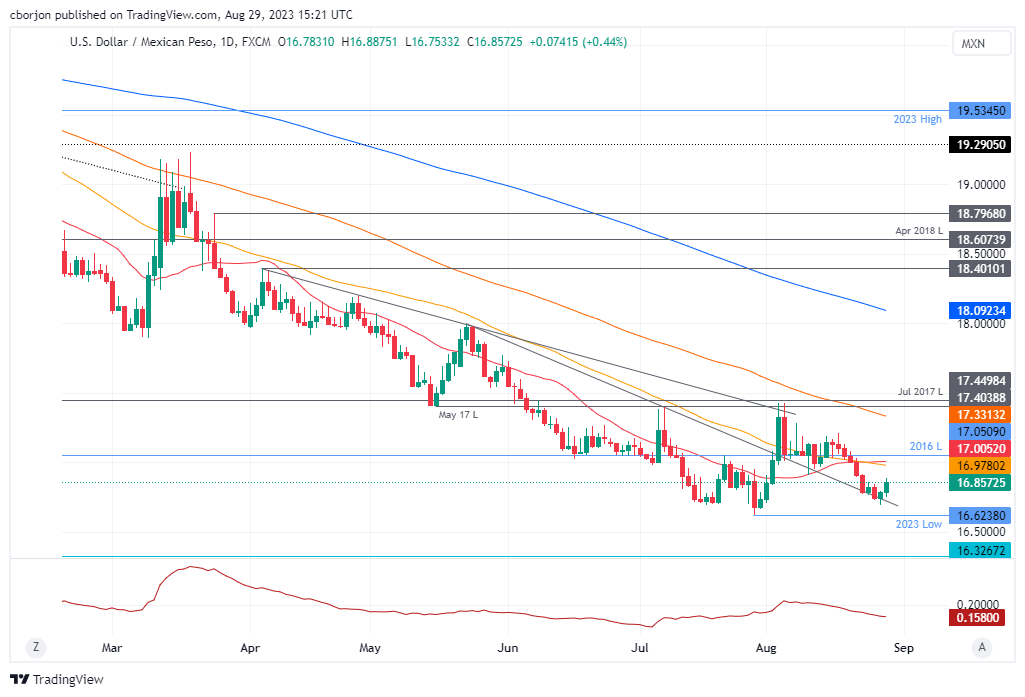
- Mexico’s Q2 GDP growth comes in below expectations at 0.8% QoQ, pushing USD/MXN higher as Banxico holds rates steady at 11.25%.
- US Job Openings declined to 8.827M, well below estimates, causing odds for a September rate hike to drop from 78% to 86.5%, according to the CME FedWatch Tool.
- Despite mixed US economic data, inflation remains a concern; upcoming Nonfarm Payrolls could be pivotal for the USD/MXN pair as recessionary fears loom.
The Mexican Peso (MXN) loses ground against the US Dollar (USD) as economic data in Mexico was soft, even though the agenda in the United States (US) increased speculation the US Federal Reserve (Fed) could pause its tightening cycle in September. However, the USD/MXN reversed its course climbs by 0.51%, trading at 16.8659, after hitting a daily low of 16.7533.
Mexican economy grows less than estimates; US JOLTs and Consumer Confidence slide
According to the Instituto Nacional de Estadistica Geografia e Informatica (INEGI), Mexico’s economy grew slower than expected. Gross Domestic Product (GDP) for Q2 2023 came at 0.8% QoQ, below forecasts of 1%, and in annually-based figures at 3.6% from 3.7% expected. Sources cited by Reuters commented that “tighter financial conditions and the weakness of key sectors …are now a clear drag.” After the data, the USD/MXN extended its gains. Traders must be aware that the Bank of Mexico (Banxico) kept borrowing costs unchanged at their last decision at 11.25%, stating that rates would remain higher for an extended period.
Across the border, the US economic docket revealed that Job Openings declined from 9.165M in June to 8.827M in July, well below estimates of 9.465M, as the Bureau of Labor Statistics (BLS) reported. Given that Fed Chair Jerome Powell stressed that should the labor market continue to loosen, inflation would continue its downtrend, expectations for September’s rate hike faded. The CME FedWatch Tool shows odds for keeping rates unchanged at 5.25%-5.50%, jumped from 78% to 86.5% in one day.
Other data revealed simultaneously by the Conference Board (CB) showed that Consumer Confidence is deteriorating, falling to 106.1 this month from 114 in July, even though estimates were at 116. According to Dana Peterson, chief economist at the Conference Board, “Consumers were once again preoccupied with rising prices in general, and for groceries and gasoline in particular.”
The report highlighted that inflation expectations for a year ahead jumped to 5.8%. The CB poll showed Americans are confident about finding a job, which shows the labor market is beginning to feel the pain of 525 basis points of tightening by the Fed.
Despite today’s data showing the US economy is decelerating, inflation remains high. Given that Jerome Powell, in his last speech, revealed that a couple of good inflation reports are not enough to stir the US central bank from tightening policy, next Friday’s US Nonfarm Payrolls report could be decisive in dictating the path of the US Dollar.
For the USD/MXN, if the US economy decelerates further and recessionary fears reignite, it could weaken the emerging market currency. Hence, further upside is expected in the pair, as traders would move to a risk-off environment and seek the safety of the US Dollar.
USD/MXN Price Analysis: Technical outlook
The USD/MXN daily chart portrays the pair as in an upward correction toward the confluence of the 50 and the 20-day Moving Average (DMA) at around 16.9778-17.0047, following the data. Still, buyers must achieve a daily close above August’s 23 high of 16.9151 to remain hopeful for higher prices. Downside risks emerge at the current week’s low of 16.6923 and the year-to-date (YTD) low of 16.6238.
- Silver price strengthens after US JOLTS Job Openings were recorded lower at 8.827M vs. expectations of 9.465M.
- The US Dollar drops vertically to near 103.80 as investors hope that labor market conditions are losing resilience.
- Silver price comes out of the consolidation forms in a narrow range around $24.40
Silver price (XAG/USD) strengthens as the United States Bureau of Labor Statistics reported significantly lower fresh Job Openings in July. US firms invited fresh applications for 8.827M vacancies against June’s reading of 9.165M while investors anticipated 9.465M openings. This indicates that the hiring process has slowed down.
The US Dollar Index (DXY) comes under extreme pressure and drops vertically to near 103.80 as investors hope that labor market conditions are losing resilience.
Meanwhile, the S&P500 opens on a positive note despite the cautionary market mood ahead of the Automatic Data Processing (ADP) Employment Change data for August, which will be released on Wednesday at 12:15.
The economic data will provide cues about the status of the labor market. Robust talent acquisition could allow the Federal Reserve (Fed) to keep doors open for further policy tightening. The significance of August labor market data is very high as Fed Chair Jerome Powell conveyed that further policy action will be data-dependent.
Silver technical analysis
Silver price comes out of the consolidation forms in a narrow range around $24.40, demonstrating an inventory shift phase after a rally. The white metal forms a Bullish Flag chart pattern, which is a trend-following pattern. Upward-sloping 50-period Exponential Moving Average (EMA) continues to provide support to the Silver price.
A confident move into the bullish range of 60.00-80.00 by the Relative Strength Index (RSI) (14) will activate the upside impulse.
Silver two-hour chart
-638289151331631999.png)
- CB Consumer Confidence Index in the US retreat more than expected in August.
- US Dollar Index declines below 104.00 after US data.
Consumer sentiment in the US deteriorated in August, with the Conference Board's Consumer Confidence Index falling to 106.1 from 114.0 (revised from 117.0) in July.
Market reaction
Alongside the CB Consumer Confidence data, the JOLTS Job Openings report was released. The US Dollar Index lost ground falling toward daily lows under 104.00.
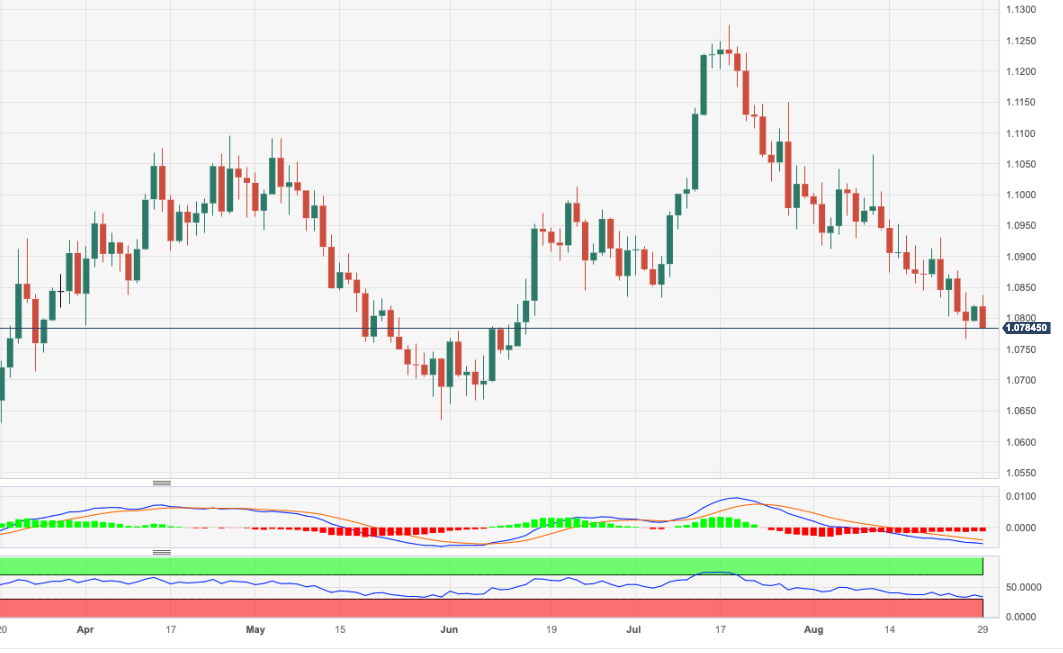
- EUR/USD can’t sustain the move above the 1.0800 mark.
- Extra losses could drag the pair to the 1.0760 region.
EUR/USD fades the initial bullish attempt to the area above 1.0800 the figure on Tuesday.
In case bears regain the upper hand, the pair could slip back to the August low of 1.0765 (August 25). South from here emerges the May low of 1.0635 (May 31) ahead of the 2023 low of 1.0481 (January 6).
A drop below the 200-day SMA, today at 1.0807, should keep extra pullbacks in store for the time being.
EUR/USD daily chart
- USD/CAD moves above 1.3600 following the footprints of the US Dollar.
- Oil prices continue to face pressure above $80.00 as the Chinese economy is going through turbulent times.
- As per expectations, the Canadian economy grew at a slower pace of 0.3% vs. Q1 growth rate of 0.8%.
The USD/CAD pair jumped strongly above the round-level resistance of 1.3600 in the early New York session. Strength in the loonie asset is backed by a strong recovery in the US Dollar as market sentiment turns bearish ahead of the United States labor market data for August.
S&P500 is expected to open on a flat note amid a quiet market mood. However, investors will remain cautious ahead of the US Automatic Data Processing (ADP) Employment data for August. The US Dollar Index (DXY) jumps to near 104.30 as investors hope that higher-than-anticipated labor market data could elevate hopes of one more interest rate hike from the Federal Reserve (Fed).
As per the estimates, the US labor force witnessed fresh additions of 195K, lower than July’s reading of 324K. A higher employment reading would allow the Fed to deliver a hawkish commentary in the September monetary policy meeting.
But before the US Employment data, investors will focus on JOLTS Job openings for July. BLS noted that the number of job openings on the last business day of July is forecast to decline to 9.46 million from 9.58 million in June. "Over the month, the number of hires and total separations decreased to 5.9 million and 5.6 million, respectively,
Meanwhile, oil prices continue to face pressure above $80.00 as the Chinese economy is going through turbulent times due to rising deflation risks and weak domestic demand. It is worth noting that Canada is the leading exporter of oil to the United States and lower oil prices will impact the Canadian Dollar.
On the economic data front, the Canadian Dollar will dance to the tune of the Q2 Gross Domestic Product (GDP) data for the April-June quarter. As per expectations, the Canadian economy grew at a slower pace of 0.3% vs. Q1 growth rate of 0.8%.
- DXY reverses the initial pessimism and advances to daily highs.
- Extra recovery continues to target the 104.70 region.
DXY quickly leaves behind Monday’s decline and resumes the uptrend to retest the 104.30/40 band on Tuesday.
Immediately to the upside turns up the August top at 104.44 (August 25), while the surpass of this level should open the door to a rapid test of the May high of 104.69 (May 31) prior to the 2023 peak of 105.88 (March 8).
While above the key 200-day SMA, today at 103.09, the outlook for the index is expected to shift to a more constructive one.
DXY daily chart
- EUR/JPY gathers extra steam and pokes with the 159.00 hurdle.
- Next on the upside comes the key round level at 160.00.
EUR/JPY extends the recovery for yet another session and manages to briefly pierce the 159.00 ceiling on Tuesday.
If the move higher picks up extra pace, the cross should challenge recent 2023 highs near 159.50 (August 22) ahead of the key round level at 160.00. The surpass of the latter should not see any resistance level of note until the 2008 high at 169.96 (July 23)
So far, the longer term positive outlook for the cross appears favoured while above the 200-day SMA, today at 147.77.
EUR/JPY daily chart
- AUD/USD finds selling pressure near 0.6450 as US Dollar recovers ahead of ADP Employment data.
- August labor market data carries higher significance as Fed Powell confirmed that further policy action will be data-dependent.
- A fresh downside would appear if the Aussie asset drops below August 17 low around 0.6360
The AUD/USD pair faces selling pressure after a short-lived pullback move to near 0.6450 in the European session. The Aussie asset attracts offers as the US Dollar recovers after a subdued performance ahead of the United States private sector labor market data.
Investors are keenly focusing on US Automated Data Processing (ADP) Employment data for August, which will be published on Wednesday at 12:15. August labor market data carries higher significance as Federal Reserve (Fed) Chair Jerome Powell confirmed at Jackson Hole that further policy action will be data-dependent. And, inflation has become more responsive to the labor market.
Meanwhile, the Australian Dollar fails to hold ground despite Reserve Bank of Australia (RBA) Governor-Designate, Michelle Bullock at the Australian National University, in Canberra, said that the central bank “may have to raise rates again, but watching data carefully.”
AUD/USD delivers a breakdown of a small Ascending Triangle chart pattern formed on an hourly time frame. The Aussie asset is still not exposed to a fresh low as the downside seems supported near 0.6360 while the upside is restricted due to the horizontal resistance plotted from August 15 high around 0.6500.
The 200-period Exponential Moving Average (EMA) continues to act as a barricade for the Australian Dollar. A shift into the bearish range of 20.00-40.00 by the Relative Strength Index (RSI) (14) will activate the downside momentum.
A fresh downside would appear if the Aussie asset dropped below August 17 low around 0.6360. This would expose the asset to the round-level support of 0.6300 followed by 03 November 2022 low at 0.6272.
In an alternate scenario, a recovery move above August 15 high around 0.6522 will drive the asset to August 9 high at 0.6571. Breach of the latter will drive the asset towards August 10 high at 0.6616.
AUD/USD hourly chart
-638289084139954829.png)
Analysts at Standard Chartered note that they have lowered the Reserve Bank of Australia (RBA) terminal rate forecast by 25 basis points but add that the hiking cycle may not be concluded yet.
RBA retained the option to hike further
"We now expect only one more 25bps hike in November vs 25bps hikes each in September and November previously."
"We still expect a hike in November as inflation – while it may have peaked – likely remains too high. There is little margin for error, in our view, considering the RBA’s already-patient stance forecasting inflation to return to the upper bound of its 2-3% target only by 2025. Services CPI remains sticky (services CPI ex-volatile items rose 1.6% q/q SA in Q2 vs 1.3% in Q1)."
"The job market may have peaked but remains tight and should support wage growth. This, along with the monthly rise in home prices, may prop up spending, especially if households dip into their significant excess savings. The lack of a productivity pick-up may also increase unit labour costs, adding to inflation."
"The last RBA policy meeting statement in August slanted dovish, noting that inflation was declining (versus inflation having passed its peak in July). On growth, the central bank indicated that the economy “is experiencing a period of below-trend growth and this is expected to continue for a while”. The meeting minutes were more balanced. The central bank pointed out that the cost of inflation being higher than expected was greater than the cost of inflation being lower than expected, even as risks to inflation were balanced. The RBA also retained the option to hike further.
- US Dollar price action is mixed, with no real outliers.
- Traders face an eventful week with the monthly US jobs report on Friday.
- The US Dollar Index clings on to 104.00, though some selling pressure persists.
The US Dollar (USD) was not making big waves at the start of the week on Monday. With the United Kingdom closed for a bank holiday, the typically lower volume at the start of the week was even more slim, bringing no real substantial moves to notice. With the UK back online and more economic data on the docket, trading volumes are expected to pick up again to more normal levels.
The datafront is starting to come into play with some second-tier data points on Tuesday. The JOLTS Job Openings report will be the one to make the most waves as a decline in job openings could point to a contraction of demand in the labor market, which means that wages could start to flatline or even to take a step back and in its turn dampen inflationary pressures. Expectations are for a drop from 9.582 million to 9.465 million for July.
Daily digest: US Dollar first jobs-related datapoint
- The data calendar starts at 12:55 GMT with the Redbook Index.. Previous number was a 2.9% increase, with no forecast pencilled in.
- The Housing Price Index for June is due to come out at 13:00 GMT. Expectations are for a slowdown, from 0.7% in May to 0.2% for June. Additionally, the Case-Shiller Home Price Index for the year will be released as well. Market expectations are for a 1.3% contraction in house prices for June, less than the 1.7% drop seen in May.
- The major macroeconomic datapoints for Tuesday, with the potential to move markets, are at 14:00 GMT. One is the Conference Board Consumer Confidence indicator for August, which is set to remain broadly steady from its previous 117 to 116. The second one, is the JOLTS Job Openings survey for July, expected to head lower from 9.582M to 9.465M.
- Later this Tuesday, the US Treasury will be tapping the markets for a 7-year Note Auction.
- Jackson Hole is water under the bridge, with equities across the globe rallying firmly. The Japanese Topix is up 0.16%, while the Chinese Hang Seng is up 1.93%. European equities are rallying as well, with the FTSE 100 in London recording a 1.26% gain. US equity futures are mildly in the green.
- The CME Group’s FedWatch Tool shows that markets are pricing in a 78.5% chance that the Federal Reserve will keep interest rates unchanged at its meeting in September. Although it still looks like a given that the Fed will not hike, markets are starting to second-guess a little more (21.5%) if the Fed would not surprise markets with still a last quarter-point-hike.
- The benchmark 10-year US Treasury bond yield trades at 4.18% after touching a new yearly high last week on Monday at 4.3618%. Investors are starting to buy into bonds, which is putting pressure on the yields to slide lower.
US Dollar Index technical analysis: water under the bridge
The US Dollar has been in a firm rally since mid-July, shooting for the stars particularly last week. With the Jackson Hole event out of the way, the US Dollar rally could start to slow down a touch. Some profit taking could get underway this week with the several US jobs-related data this week that are due to come out. Furthermore, a risk on mood in markets could see less appetite for the Greenback, which is considered as a safe-haven.
On the upside, 104.69, the high of May 31, comes into play as the level to beat. Once that level is broken and consolidated, look for a surge to 105.00, where 105.10 (the peak of March 15) is an ideal candidate for a double top. Should the Greenback be on a tear, expect a test at 105.88 – the 2023 peak from March 8.
On the downside, several floors are likely to prevent a steep decline in the DXY. The first one is the big figure at 104.00. Though seeing the current decline, that does not look strong enough to hold. Rather look for the 200-day Simple Moving Average (SMA) at 103.14. That is a much better candidate in order to catch some profit-taking pressure and re-enter. In case it does not hold, the safety net at 102.33 comes into play, holding both the 55-day SMA and the 100-day SMA.
US Dollar FAQs
What is the US Dollar?
The US Dollar (USD) is the official currency of the United States of America, and the ‘de facto’ currency of a significant number of other countries where it is found in circulation alongside local notes. It is the most heavily traded currency in the world, accounting for over 88% of all global foreign exchange turnover, or an average of $6.6 trillion in transactions per day, according to data from 2022.
Following the second world war, the USD took over from the British Pound as the world’s reserve currency. For most of its history, the US Dollar was backed by Gold, until the Bretton Woods Agreement in 1971 when the Gold Standard went away.
How do the decisions of the Federal Reserve impact the US Dollar?
The most important single factor impacting on the value of the US Dollar is monetary policy, which is shaped by the Federal Reserve (Fed). The Fed has two mandates: to achieve price stability (control inflation) and foster full employment. Its primary tool to achieve these two goals is by adjusting interest rates.
When prices are rising too quickly and inflation is above the Fed’s 2% target, the Fed will raise rates, which helps the USD value. When inflation falls below 2% or the Unemployment Rate is too high, the Fed may lower interest rates, which weighs on the Greenback.
What is Quantitative Easing and how does it influence the US Dollar?
In extreme situations, the Federal Reserve can also print more Dollars and enact quantitative easing (QE). QE is the process by which the Fed substantially increases the flow of credit in a stuck financial system.
It is a non-standard policy measure used when credit has dried up because banks will not lend to each other (out of the fear of counterparty default). It is a last resort when simply lowering interest rates is unlikely to achieve the necessary result. It was the Fed’s weapon of choice to combat the credit crunch that occurred during the Great Financial Crisis in 2008. It involves the Fed printing more Dollars and using them to buy US government bonds predominantly from financial institutions. QE usually leads to a weaker US Dollar.
What is Quantitative Tightening and how does it influence the US Dollar?
Quantitative tightening (QT) is the reverse process whereby the Federal Reserve stops buying bonds from financial institutions and does not reinvest the principal from the bonds it holds maturing in new purchases. It is usually positive for the US Dollar.
Analysts at Société Générale summarize the near term developments in the FX market and take a look at the upcoming events.
Skew in options remains for euro weakness in the near term
"The positive risk mood carried over for a second day in China this morning and 2y UST yields returned below 5% following decent Treasury bond auctions last night, especially for the 2y. European yields are playing catch down with the US and EUR/USD is tentatively trying to pull away from the 200dma (1.0807) but without great conviction it must be said."
"The skew in options remains for euro weakness in the near term though risk reversals have stabilised on the lows. ECB hawk Holzmann sided with Nagel in comments yesterday, declaring that the central bank has not defeated inflation and barring a (downside) surprise on inflation, it probably needs to raise interest rates again in September."
"Our economists pencil in a modest drop in core CPI to 5.4% yoy from 5.5% when data is published on Thursday but do not rule out a decline to 5.3%. This may not be enough to appease the council hawks, however, who may prefer a figure below 5% before ceding ground to the doves. A (final) increase in the depo rate to 4% in two weeks could be inevitable and leaves the front end of the European curve and ESTR vulnerable to hawkish repricing from the current 10bp."
"Preliminary data for Germany and Spain tomorrow will kick off the monthly inflation data series and will compete with US ADP employment. The convergence with 2y2y US/EU forwards puts EUR/USD on a neutral footing and in holding pattern until the release of euro CPI and US NFP."
Analysts at BBH note that the US Dollar is trading flat on Tuesday as markets await fresh drivers.
Another hike could be confirmed by US data this week
"DXY is trading flat for the second straight day near 104.067 after it traded at a new high for this move Friday near 104.309. It remains on track to test the May 31 high near 104.699."
"The euro is trading flat near $1.0810 after traded at a new low for this move Friday near $1.0765. It remains on track to test the May low near $1.0635. Sterling is trading flat near $1.26 after it traded at a new low for this move Friday near $1.2560. It remains on track to test the May low near $1.2310."
"USD/JPY is trading higher near 146.65 as it probes the upside of its 145-150 trading range. With the BOJ remaining dovish, we look for an eventual test of 150. The fundamental story continues to move in favor of the greenback. Friday’s speech by Powell confirms the Fed’s hawkish stance and we think another hike could be confirmed by U.S. data this week, which is of course dollar positive."
Analysts at TD Securities note that the JOLTS Job Openings report for July should garner attention given the importance the Federal Reserve has placed on the progress of still-tight labor market conditions.
Vacancies-to-unemployed ratio important to track
"We look for the report to show that job openings have indeed continued to make inroads: we forecast another decline in the series to a below-consensus 9.3mn in July (market: 9.436m)."
"The report's vacancies-to-unemployed ratio and the quits rate will also be important to track; the job vacancy rate was 5.8% last month while the quits rate is currently sitting at a 2-year low of 2.4%."
- Oil (WTI) could see a boost in its price with hurricane Adalia and OPEC+ production cuts.
- US Dollar strength tops out and could start to abate as risk-on sentiment slows demand for the Greenback.
- This evening the American Petroleum Institute is due to print its weekly numbers.
Oil prices are heading higher in an overall bid for energy commodities since last week. Next to Crude Oil prices rising, Natural Gas prices were on a tear as well on Monday. With hurricane Adalia set to hit Florida and Georgia soon, oil distribution for the US southeast could get disrupted and have repercussions for the more northern states.
As if that is not enough, the current slowdown in China’s recovery is giving OPEC enough reason to cut even more production into its next meeting on November 26. Some bullish forces are starting to build. Should this Tuesday’s numbers from the American Petroleum Institute print a bigger than expected drawdown, a perfect cocktail is present to see the Oil price for WTI rallying up to $84.
At the time of writing, Crude Oil (WTI) price trades at $80.10 per barrel and Brent Oil at $84.03
Oil news and market movers
- All eyes are on the American Petroleum Institute (API) numbers this week, due at 20:30 GMT. Last week there was a draw of -2.418M.
- This week Friday’s monthly US jobs report takes precedence over other indicators. After the US Federal Reserve repeated it stance at Jackson Hole for keeping rates higher for longer, any sudden slowdowns in the US jobs market could force the hand of the Fed to start easing market conditions by cutting rates, which would mean a weaker Greenback as a side effect.
- Hurricane Adalia is making its way to Florida and is about to hit the peninsula by 8 AM this Tuesday. The production and supply for the Eastern part of the United States could come under pressure and might see Oil prices shooting higher as less supply will be available in a brief period.
- The sluggish Chinese economy is helping OPEC+ to start thinking about more production cuts in order to keep Oil prices afloat at current levels. The next meeting is still quite far away though on November 26. Meanwhile, rumours and speculation will start to build up toward that date.
- Some cargoes of Russian crude for October were offered at a lesser discount to the ICE Brent price between Russia and China.
- Saudi Arabia is considering extending its production cut for longer, which could limit the supply side in oil in the coming days.
- Equity markets are rallying for a second straight day this week and are helping demand for commodities overall.
Oil Technical Analysis: one line to watch
The Oil price is ticking up nicely since it started its rally last week. The turnaround came with a knee-jerk reaction where the weekly API numbers were only showing a minor drawdown that pushed oil prices further lower. Yet, on August 23rd, the Department of Energy (DOE) printed a massive drawdown of over 6M barrels.
On the upside, $81.68, Monday’s high, is the one to beat in order to trigger a small uptrend. Should WTI continue to rally and break that red descending trendline, more new highs will come into play. In order to print a fresh monthly high, the peak of mid-August at $84.32 is the target when demand takes over and supply cannot follow suit.
On the downside, a temporary bottom is being formed around $77.50 and acts as a base for this week. Should the Baker Hughes Rig Count jump substantially higher, expect to see the floor tested as more supply is bound to come online. Once bears make it through that orange box level, expect to see more downside toward $74 before finding ample support to slow down the sell-off.
-638288951206564305.png)
WTI US OIL (Daily Chart)
WTI Oil FAQs
What is WTI Oil?
WTI Oil is a type of Crude Oil sold on international markets. The WTI stands for West Texas Intermediate, one of three major types including Brent and Dubai Crude. WTI is also referred to as “light” and “sweet” because of its relatively low gravity and sulfur content respectively. It is considered a high quality Oil that is easily refined. It is sourced in the United States and distributed via the Cushing hub, which is considered “The Pipeline Crossroads of the World”. It is a benchmark for the Oil market and WTI price is frequently quoted in the media.
What factors drive the price of WTI Oil?
Like all assets, supply and demand are the key drivers of WTI Oil price. As such, global growth can be a driver of increased demand and vice versa for weak global growth. Political instability, wars, and sanctions can disrupt supply and impact prices. The decisions of OPEC, a group of major Oil-producing countries, is another key driver of price. The value of the US Dollar influences the price of WTI Crude Oil, since Oil is predominantly traded in US Dollars, thus a weaker US Dollar can make Oil more affordable and vice versa.
How does inventory data impact the price of WTI Oil
The weekly Oil inventory reports published by the American Petroleum Institute (API) and the Energy Information Agency (EIA) impact the price of WTI Oil. Changes in inventories reflect fluctuating supply and demand. If the data shows a drop in inventories it can indicate increased demand, pushing up Oil price. Higher inventories can reflect increased supply, pushing down prices. API’s report is published every Tuesday and EIA’s the day after. Their results are usually similar, falling within 1% of each other 75% of the time. The EIA data is considered more reliable, since it is a government agency.
How does OPEC influence the price of WTI Oil?
OPEC (Organization of the Petroleum Exporting Countries) is a group of 13 Oil-producing nations who collectively decide production quotas for member countries at twice-yearly meetings. Their decisions often impact WTI Oil prices. When OPEC decides to lower quotas, it can tighten supply, pushing up Oil prices. When OPEC increases production, it has the opposite effect. OPEC+ refers to an expanded group that includes ten extra non-OPEC members, the most notable of which is Russia.
- USD/CHF continues to trade sideways around 0.8850 ahead of US labor market data.
- S&P500 futures remain subdued in the London session, portraying a quiet market mood.
- As per the estimates, the US private sector recorded fresh payrolls of 195K, significantly lower than July’s reading of 324K.
The USD/CHF pair is consolidating around 0.8850 from Monday as investors need fresh status about the United States labor market for further action. The Swiss Franc asset is awaiting the Employment Change data for August to be reported by Automatic Data Processing (ADP), which will be published on Wednesday at 12:15 GMT.
S&P500 futures remain subdued in the London session, portraying a quiet market mood ahead of labor market data. August labor market data carries huge importance as Federal Reserve (Fed) Chair Jerome Powell at the Jackson Hole Symposium that inflation is getting more responsive to the job market. Also, Fed Powell reiterated that further policy action will be dependent on incoming data.
Market participants expect that US hiring momentum has slowed down as firms are operating at lower operating capacity due to a poor demand outlook. As per the estimates, the US private sector recorded fresh payrolls of 195K, significantly lower than July’s reading of 324K. Higher-than-expected labor force addition would indicate that the labor market has not lost its resilience and inflation could remain stubborn ahead.
Meanwhile, investors are also focusing on US Commerce Minister Gina Raimondo's visit to China. Raimondo said the administration is aware of challenges and he is very optimistic about US-China ties. While, China's Premier Li Qiang said, “sound economic and trade relationship will not only be beneficial for our two countries, but for the entire world.”
On the Swiss Franc front, investors await the ZEW - Survey Expectations for August, which will be released on Wednesday. As per expectations, business conditions, employment conditions, and other elements affecting the day-to-day running of a business in Switzerland are improving. The sentiment indicator is seen at 31.3 vs. the former reading of -32.6. It seems that easing inflationary pressures due to higher interest rates by the Swiss National Bank (SNB) are improving recurring operations of Swiss business.
Senior Economist at UOB Group Alvin Liew reviews the latest Industrial Production figures in Singapore.
Key Takeaways
Singapore’s Jul industrial production (IP) contracted by markedly less than forecast although that was somewhat offset by Jun’s contraction which was revised deeper. IP contracted by just -0.9% y/y in Jul, better than Bloomberg’s median forecast of -3.8% y/y and our less bearish forecast of -3.6% y/y. However, the Jun IP contraction was revised to a steeper 6.6% y/y (versus the prelim estimate of -4.9% y/y). On a seasonally adjusted sequential basis, IP expanded by 4.1% m/m in Jul (well above Bloomberg estimate of -0.1% and our forecast of -3.1%) while the m/m expansion in Jun was revised to a smaller 3.3% m/m (from the prelim estimate of +5.0%).
IP Outlook – We are heartened by the surprise back-to-back rebound in semiconductors output and by the re-acceleration of growth in the transport engineering components of aerospace and marine & offshore, giving a relatively benign start to manufacturing for the second half 2023. That said, we still hesitate to call for a turnaround in the electronics downcycle. The volatile biomedical cluster adds further caution to the manufacturing outlook. With IP contracting by -5.8% YTD, we maintain our forecast for Singapore 2023 manufacturing to contract by -5.4%, which implies a tepid recovery profile in 2H. We still expect Singapore’s full year GDP growth at 0.7% in 2023 (lower end of the official growth forecast range) reflecting our more cautious external outlook and a pensive manufacturing recovery.
- Gold price aims to sustain above $1,920.00 as pressure builds on US Dollar and Treasury yields.
- Fed’s September policy action will be highly guided by August labor market data.
- US Raimondo and China’s Wang Yi agree to launch a platform on export control information.
Gold price (XAU/USD) gathers strength to extend its recovery above $1,920 as the Federal Reserve (Fed) holds economic indicators accountable for further policy action. Jerome Powell reiterated at the Jackson Hole Symposium that the central bank will remain data-dependent. Powell added that inflation has become more responsive to the labor market, so upcoming JOLTS and other job-market-related data later this week are set to be crucial to determine the Fed’s next steps. .
US employment and ISM Manufacturing PMI data will remain on investors’ radar. The weightage of August labor market data is expected to remain high as it will provide a base for September’s interest rate decision. Investors hope that hiring momentum slows as US firms are banking on lower operating capacity due to a delicate economic outlook. Also, factory activity is expected to contract for the ninth straight month.
Daily Digest Market Movers: Gold price shifts focus to labor market data
- Gold price aims for a confident auction shift above $1,920.00 as investors gung-ho for value-buying, knowing that interest rates by the Federal Reserve are not far from peaking.
- The recovery move in the Gold price is also backed by a subdued US Dollar and declining US Treasury Yields. The US Dollar Index (DXY) struggles to climb above 104.00, while 10-year US bond yields drop to near 4.18%.
- The US Dollar comes under pressure as Fed Chair Jerome Powell reiterated at the Jackson Hole Symposium that further policy action will depend on economic data.
- Jerome Powell kept doors open for further policy tightening as the achievement of price stability has a long way to go. Two months of lower inflation levels is just the beginning of what the central bank wants to build.
- Cleveland Fed Bank President Loretta Mester supported one more interest rate hike in 2023 this week to ensure that the goal of price stability is achieved before 2026.
- After the hawkish Powell commentary, investors shifted focus to the Automatic Data Processing (ADP) Employment Change data for August, which will be published on Wednesday at 12:15 GMT.
- The central bank has evidence that inflation is getting more responsive to labor markets. Powell said that further signs of a tightening job market could warrant more Fed action.
- Powell’s commentary about the job market has increased the significance of August employment data as it will provide a base for September’s monetary policy.
- For the ADP data release, the US private sector is expected to have added 195K jobs in August, significantly lower than July’s reading of 324K.
- Before US ADP Employment data, investors will focus on JOLTS Job Openings for July, which will be released at 14:00 GMT. As per estimates, US firms posted fresh 9.465M vacancies, lower than June’s job openings figure of 9.582M.
- Apart from the labor market data, investors will also keep the ISM Manufacturing PMI data for August on their radar, which will be released on Friday.
- US factory activity is expected to contract for a ninth consecutive month, according to estimates. The ISM Manufacturing PMI is seen at 47.0, slightly higher than July’s reading of 46.4. Still, a figure below the 50.0 threshold signals a contraction in activity. The New Orders Index, a widely followed leading indicator, is expected to drop to 46.3 from 47.3.
- On Monday, the Texas Manufacturing Outlook Survey reported that a key measure of state manufacturing conditions fell six points to -11.2, its lowest level since May 2020.
- Investors are keenly focusing on US Commerce Secretary Gina Raimondo's visit to China. Raimondo said the administration is aware of challenges and optimistic about US-China ties.
- Raimondo and China’s Foreign Minister Wang Yi agreed to launch a platform on export control information.
Technical Analysis: Gold price climbs above $1,920
Gold price looks confident above $1,920.00 as value-buying kicked in on hopes that the interest-rate peak is near. The precious metal climbs above the 20- and 200-day Exponential Moving Average (EMA), which indicates a solid recovery attempt. In spite of this revival move, the yellow metal has to pass through some more filters for a sustained reversal.
Central banks FAQs
What does a central bank do?
Central Banks have a key mandate which is making sure that there is price stability in a country or region. Economies are constantly facing inflation or deflation when prices for certain goods and services are fluctuating. Constant rising prices for the same goods means inflation, constant lowered prices for the same goods means deflation. It is the task of the central bank to keep the demand in line by tweaking its policy rate. For the biggest central banks like the US Federal Reserve (Fed), the European Central Bank (ECB) or the Bank of England (BoE), the mandate is to keep inflation close to 2%.
What does a central bank do when inflation undershoots or overshoots its projected target?
A central bank has one important tool at its disposal to get inflation higher or lower, and that is by tweaking its benchmark policy rate, commonly known as interest rate. On pre-communicated moments, the central bank will issue a statement with its policy rate and provide additional reasoning on why it is either remaining or changing (cutting or hiking) it. Local banks will adjust their savings and lending rates accordingly, which in turn will make it either harder or easier for people to earn on their savings or for companies to take out loans and make investments in their businesses. When the central bank hikes interest rates substantially, this is called monetary tightening. When it is cutting its benchmark rate, it is called monetary easing.
Who decides on monetary policy and interest rates?
A central bank is often politically independent. Members of the central bank policy board are passing through a series of panels and hearings before being appointed to a policy board seat. Each member in that board often has a certain conviction on how the central bank should control inflation and the subsequent monetary policy. Members that want a very loose monetary policy, with low rates and cheap lending, to boost the economy substantially while being content to see inflation slightly above 2%, are called ‘doves’. Members that rather want to see higher rates to reward savings and want to keep a lit on inflation at all time are called ‘hawks’ and will not rest until inflation is at or just below 2%.
Is there a president or head of a central bank?
Normally, there is a chairman or president who leads each meeting, needs to create a consensus between the hawks or doves and has his or her final say when it would come down to a vote split to avoid a 50-50 tie on whether the current policy should be adjusted. The chairman will deliver speeches which often can be followed live, where the current monetary stance and outlook is being communicated. A central bank will try to push forward its monetary policy without triggering violent swings in rates, equities, or its currency. All members of the central bank will channel their stance toward the markets in advance of a policy meeting event. A few days before a policy meeting takes place until the new policy has been communicated, members are forbidden to talk publicly. This is called the blackout period.
- EUR/JPY retreats from a one-week high touched on Tuesday, albeit lacks follow-through.
- A combination of factors underpins the JPY and exerts downward pressure on the cross.
- The divergent ECB-BoJ outlook continues to lend support and helps limit the downside.
The EUR/JPY cross attracts some intraday selling near the 158.65 region, or a one-week high touched this Tuesday and remains depressed through the first half of the European session. Spot prices currently trade around the 158.35-158.30 area, down nearly 0.15% for the day, and for now, seem to have snapped a three-day winning streak, with bears now awaiting a break below the 200-hour Simple Moving Average (SMA) before placing fresh bets.
The Japanese government, in its annual economic white paper released this Tuesday, signalled that the economy was nearing an end to prolonged stagnation. The report added that Japan may be at an inflexion point in its 25-year battle with deflation as price and wage rises show signs of broadening. This, in turn, fuels speculations that the Bank of Japan (BoJ) could phase out the massive monetary support. Apart from this, persistent fears that Japanese authorities will intervene in the foreign exchange markets underpin the Japanese Yen (JPY) and exert some downward pressure on the EUR/JPY cross.
The shared currency's relative underperformance could also be attributed to speculations that the European Central Bank (ECB) will halt its rate-hiking cycle sooner rather than later, against the backdrop of looming recession risks. The bets were lifted by the flash PMI prints, which showed that business activity in the Euro Zone declined more than expected in August. That said, ECB President Christine Lagarde reiterated last Friday that interest rates will need to stay high as long as necessary to slow still-high inflation, reaffirming market expectations for at least one more 25 bps lift-off by the end of this year.
In contrast, BoJ Governor Kazuo Ueda noted that the underlying inflation in Japan remains a bit below the 2% target, ensuring that the central bank may keep the status quo until next summer. The divergent ECB-BoJ policy outlook is holding back traders from placing aggressive bearish bets around the EUR/JPY cross, warranting some caution before positioning for any further losses. Market participants now look forward to the release of the flash version of inflation figures from Germany on Wednesday and the Euro Zone on Thursday. The data will influence the Euro and provide some meaningful impetus.
Investors this week will also confront the release of the official Chinese PMI prints and important US macro releases scheduled at the beginning of a new month, including the closely-watched monthly employment details. This will drive the broader market risk sentiment and demand for the safe-haven JPY, which, in turn, should provide some meaningful impetus to the EUR/JPY cross.
Technical levels to watch
- JOLTS report will be watched closely by Fed officials ahead of August jobs data.
- Job openings are forecast to decline to 9.46 million on the last business day of July.
- US labor market conditions remain out of balance despite Fed rate hikes.
The Job Openings and Labor Turnover Survey (JOLTS) will be released on Tuesday, August 29, by the US Bureau of Labor Statistics (BLS). The publication will provide data about the change in the number of job openings in July, alongside the number of layoffs and quits.
JOLTS data will be scrutinized by market participants and Federal Reserve policymakers because it could provide valuable insights regarding the supply-demand dynamics in the labor market, a key factor driving up salaries and inflation.
What to expect in the next JOLTS report?
The number of job openings on the last business day of July is forecast to decline to 9.46 million from 9.58 million in June. "Over the month, the number of hires and total separations decreased to 5.9 million and 5.6 million, respectively," the BLS noted in June’s JOLTS. "Within separations, quits (3.8 million) decreased, while layoffs and discharges (1.5 million) changed little," the publication further read.
The Federal Reserve (Fed) has been paying close attention to the job openings data to assess whether the equilibrium between supply and demand in the labor market remains out of balance. In June, the BLS reported that there were more than 5.95 million people unemployed. Hence, the ratio of available jobs to job seekers stood at around 1.6. In July, the number of unemployed declined slightly to 5.84 million. Even if the number of job openings were to decline to 8.76 million in July, that would still result in 1.5 available jobs for each unemployed.
“Job openings have declined substantially without increasing unemployment –a highly welcome but historically unusual result that appears to reflect large excess demand for labor,” said Federal Reserve Chairman Jerome Powell in his speech at the Jackson Hole Symposium on Friday. Powell further added that the Fed expects the rebalancing in the labor market to continue, but noted that it would call for a policy response if they were to see evidence that “the tightness in the labor market is no longer easing.”
FXStreet Analyst Eren Sengezer shares his view on the importance of the JOLTS Job Openings data and the potential market reaction:
“Market participants are fairly certain that the Fed will leave its policy rate unchanged at its September meeting. They are, however, yet to decide whether the Fed will raise the policy rate again before the end of the year. According to the CME Group FedWatch Tool, the probability of the Fed lifting the interest rate by another 25 basis points in 2023 holds at around 50%.”
“If there is a significant decline in the number of job openings, with a reading below nine million, the US Dollar (USD) could come under renewed selling pressure. On the flip side, an increase toward 10 million would reaffirm tight labor market conditions and have the opposite impact on the currency’s performance against its major rivals.”
When will the JOLTS report be released and how could it affect EUR/USD?
Job openings data will be published on Tuesday, August 29, at 14:00 GMT. The report could influence the action in EUR/USD due to its potential impact on the market pricing of the Fed’s rate outlook. The Euro has struggled to stay resilient against its rivals after European Central Bank (ECB) President Christine Lagarde refrained from confirming one more increase in key rates in September.
Eren points out key technical levels to watch for EUR/USD ahead of JOLTS data:
“EUR/USD trades near the upper limit of the descending regression channel coming from July and the Relative Strength Index (RSI) indicator on the daily chart stays near 40, reflecting the bearish bias.”
“The 200-day Simple Moving Average (SMA) aligns as a key pivot level for EUR/USD at 1.0800. If the pair stabilizes above that level, sellers could be discouraged. In that scenario, 1.0900 (psychological level) could act as interim resistance ahead of 1.0930 (100-day SMA) and 1.0970 (50-day SMA). On the downside, 1.0750 (lower limit of the descending channel, static level) could be seen as the next bearish target followed by 1.0700 (static level, psychological level) and the 1.0635 seen on May 31, if buyers give up on defending 1.0800”.
Economic Indicator
United States JOLTS Job Openings
JOLTS Job Openings is a survey done by the US Bureau of Labor Statistics to help measure job vacancies. It collects data from employers including retailers, manufacturers and different offices each month.
Read more.Next release: 08/29/2023 14:00:00 GMT
Frequency: Monthly
Source: US Bureau of Labor Statistics
In a meeting with US Commerce Secretary Gina Raimondo on Tuesday, China's Premier Li Qiang said, “sound economic and trade relationship will not only be beneficial for our two countries, but for the entire world.”
Meanwhile, Raimondo told the Chinese Premier that “the US wants to work with China on climate change, artificial intelligence and fentanyl crisis.”
“The world is expecting us to step up together to solve problems,” Raimondo added.
Related reads
- AUD/USD holds ground below 0.6450, focus on US data, Australia CPI
- USD/CNH: Further range bound in store near term – UOB
Reserve Bank of Australia (RBA) Governor-Designate, Michelle Bullock, in her speech at the Sir Leslie Melville Lecture at the Australian National University, in Canberra, said that the central bank “may have to raise rates again, but watching data carefully.”
Additional quotes
Inflation is till too high, that will be my first priority as governor.
Not necessarily heading to a world of higher structural inflation.
Market reaction
At the time of writing, AUD/USD is off the intraday highs of 0.6454, trading at 0.6440 while edging 0.20% higher on the day.
- AUD/USD trades higher ahead of the releases of US macroeconomic data.
- Investors seek fresh impetus on the economic outlook of both countries.
- Australia's CPI is due to be released on Wednesday; market consensus shows a reduction.
AUD/USD trades higher around 0.6440, extending gains for the second consecutive day during the European session on Tuesday. The pair strengthened due to the pullback in the US Dollar (USD) as investors seem to take a cautious stand, seeking further cues on monetary policy tightening by the United States (US) Federal Reserve (Fed) in the September meeting.
Market participants seek fresh impetus on the inflation outlook and economic conditions, awaiting data releases from the US, including Jolts Job Openings, Housing Price Index and Consumer Confidence are due to be released later in the North American session. Likewise, Australia's Consumer Price Index (CPI) will be eyed on Wednesday. The key indicator to measure inflation is expected to show a reduction in July.
The US Dollar Index (DXY) hovers around 104.00 at the time of writing, struggling to hold ground above that level. The downbeat US Treasury yields are contributing to the erosion of the US Dollar’s (USD) strength, which measures the performance of the Greenback against the six other major currencies.
Moreover, the upbeat Australia’s Retail Sales s.a. released on Monday contributed support to the strengthening of the AUD/USD pair. As said, the data showed a month-on-month growth of 0.5% in July, higher than the market consensus of 0.3%, swinging from the previous decline of 0.8%. Moreover, China’s fiscal stimulus also provided support to the Aussie pair as Canada is a close trading partner of China.
Furthermore, investors are also closely monitoring the visit of US Commerce Secretary Gina Raimondo to China, which is intended to strengthen trade relations between the United States and China. Positive sentiments regarding the Chinese economy hold the potential to instill confidence among AUD/USD buyers.
- The Euro maintains optimism above 1.0800 against the US Dollar.
- Stocks in Europe see another positive start to the session.
- The USD Index (DXY) pierces the 104.00 support amidst a mildly offered bias.
- US, German yields kick off the European session in the red.
- Consumer Confidence in Germany expected to worsen in September.
Price action around the Euro (EUR) appears inconclusive against the US Dollar (USD) on Tuesday, motivating the EUR/USD pair to hover around the 1.0800 neighbourhood.
The Greenback also exchanges ups and downs around the 104.00 region when tracked by the USD Index (DXY). Meanwhile, US yields show renewed weakness amidst speculation of the Federal Reserve (Fed) pausing its interest-rate hiking cycle at the September meeting and opting for a quarter-point rate hike in November.
Looking at the broader picture, there is a renewed discourse regarding monetary policy, specifically the Fed's dedication to maintaining a more stringent approach for a prolonged period. This heightened attention stems from the remarkable resilience exhibited by the US economy, even in the face of a slight easing in the job market and declining inflation figures observed in recent months.
Across the pond, internal conflicts among members of the European Central Bank (ECB) governing council are emerging regarding the possibility of extending the restrictive policy stance beyond the summer season. These differences of opinion are contributing to persistent uncertainty around the central bank and act as a source of potential weakness for the single currency.
On the domestic data space, Consumer Confidence in Germany worsened to -25.5 when tracked by GfK for the month of September, while Consumer Confidence in France held steady at 85 in August.
In the US, the Conference Board will publish its Consumer Confidence measure along with the FHFA House Price Index and JOLTS Job Openings.
Daily digest market movers: Euro enters the pre-NFP lull around 1.0800
- The Euro gyrates around the 1.0800 zone against the USD.
- German, US bond yields lose further momentum on Tuesday.
- The US labour market, inflation figures take centre stage this week.
- Japanese jobless rate ticked higher in July.
- Fed’s tighter-for-longer narrative keeps running in the background.
- The probability of a Fed’s 25 bps rate raise in November hovers around 50%.
Technical Analysis: Euro could still slip back to the 1.0760 area
EUR/USD is battling to keep the trade above the key 1.0800 hurdle in quite an apathetic trading session.
Further declines could motivate EUR/USD to revisit Friday's low of 1.0765, ahead of the May 31 low of 1.0635 and the March 15 low of 1.0516. The loss of this level could prompt a test of the 2023 low at 1.0481 seen on January 6 to reemerge.
Occasional bouts of strength should meet provisional resistance at the 55-day Simple Moving Average (SMA) at 1.0965, prior to the psychological 1.1000 barrier and the August 10 high at 1.1064. Once the latter is cleared, spot could challenge 1.1149 from July 27. If the pair surpasses this region, it could alleviate some of the downward pressure and potentially visit the 2023 peak of 1.1275 seen on July 18. Further up comes the 2022 high at 1.1495, which is closely followed by the round level of 1.1500.
Furthermore, sustained losses are likely in EUR/USD once the 200-day SMA (1.0807) is breached in a convincing fashion.
Euro FAQs
What is the Euro?
The Euro is the currency for the 20 European Union countries that belong to the Eurozone. It is the second most heavily traded currency in the world behind the US Dollar. In 2022, it accounted for 31% of all foreign exchange transactions, with an average daily turnover of over $2.2 trillion a day.
EUR/USD is the most heavily traded currency pair in the world, accounting for an estimated 30% off all transactions, followed by EUR/JPY (4%), EUR/GBP (3%) and EUR/AUD (2%).
What is the ECB and how does it impact the Euro?
The European Central Bank (ECB) in Frankfurt, Germany, is the reserve bank for the Eurozone. The ECB sets interest rates and manages monetary policy.
The ECB’s primary mandate is to maintain price stability, which means either controlling inflation or stimulating growth. Its primary tool is the raising or lowering of interest rates. Relatively high interest rates – or the expectation of higher rates – will usually benefit the Euro and vice versa.
The ECB Governing Council makes monetary policy decisions at meetings held eight times a year. Decisions are made by heads of the Eurozone national banks and six permanent members, including the President of the ECB, Christine Lagarde.
How does inflation data impact the value of the Euro?
Eurozone inflation data, measured by the Harmonized Index of Consumer Prices (HICP), is an important econometric for the Euro. If inflation rises more than expected, especially if above the ECB’s 2% target, it obliges the ECB to raise interest rates to bring it back under control.
Relatively high interest rates compared to its counterparts will usually benefit the Euro, as it makes the region more attractive as a place for global investors to park their money.
How does economic data influence the value of the Euro?
Data releases gauge the health of the economy and can impact on the Euro. Indicators such as GDP, Manufacturing and Services PMIs, employment, and consumer sentiment surveys can all influence the direction of the single currency.
A strong economy is good for the Euro. Not only does it attract more foreign investment but it may encourage the ECB to put up interest rates, which will directly strengthen the Euro. Otherwise, if economic data is weak, the Euro is likely to fall.
Economic data for the four largest economies in the euro area (Germany, France, Italy and Spain) are especially significant, as they account for 75% of the Eurozone’s economy.
How does the Trade Balance impact the Euro?
Another significant data release for the Euro is the Trade Balance. This indicator measures the difference between what a country earns from its exports and what it spends on imports over a given period.
If a country produces highly sought after exports then its currency will gain in value purely from the extra demand created from foreign buyers seeking to purchase these goods. Therefore, a positive net Trade Balance strengthens a currency and vice versa for a negative balance.
- NZD/USD gains positive traction for the second straight day and is supported by a softer USD.
- Retreating US bond yields and a positive risk tone drag the USD away from a three-month top.
- Bets for more Fed rate hikes should limit the USD downside and cap further gains for the pair.
The NZD/USD pair attracts some buyers for the second successive day on Tuesday and recovers further from its lowest level since November 2022, around the 0.5885 region touched last week. Spot prices stick to modest intraday gains through the early part of the European session and currently trade near the 0.5925 area, up over 0.20% for the day, though any meaningful upside still seems elusive.
The latest optimism led by new measures rolled out by China – to draw investors back into its battered stock markets – continues to drive some flows towards antipodean currencies, including the New Zealand Dollar (NZD). The US Dollar (USD), on the other hand, is pressured by a further decline in the US Treasury bond yields and retreats further from a nearly three-month top set last Friday. This turns out to be a key factors acting as a tailwind for the NZD/USD pair.
That said, rising bets for one more 25 bps rate hike by the Federal Reserve (Fed) in 2023 should help limit the downside for the US bond yields and the Greenback. It is worth recalling that Fed Chair Jerome Powell reiterated the message last week and said at the Jackson Hole Symposium that the US central bank may need to raise rates further to cool still-too-high inflation. Moreover, a resilient US economy should allow the Fed to stick to its hawkish stance for longer.
The aforementioned fundamental backdrop favours the USD bulls, which, along with concerns about the worsening economic conditions in China, warrants some caution before positioning for any further appreciating move for the NZD/USD pair. Traders might also prefer to move to the sidelines ahead of this week's important macro release from the US and China, which will play a key role in determining the next leg of a directional move for spot prices.
A rather busy US economic docket kicks off with the release of the Conference Board's Consumer Confidence Index and JOLTS Job Openings data on Tuesday. This will be followed by the revised estimate of the Q2 GDP growth on Wednesday, the PCE Price Index - the Fed's preferred inflation gauge on Thursday and the closely watched jobs report (NFP) on Friday. Traders will further take cues from the official Chinese PMI prints on Thursday.
Hence, it will be prudent to wait for strong follow-through buying before confirming that the NZD/USD pair has bottomed out in the near term and placing aggressive bullish bets.
Technical levels to watch
There are no changes to the consolidative phase in USD/CNH for the time being, argue UOB Group’s Economist Lee Sue Ann and Markets Strategist Quek Ser Leang.
Key Quotes
24-hour view: We expected USD to trade with a downward bias yesterday. However, we were of the view that “any decline is unlikely to break the major support at 7.2500.” USD did not quite trade with a downward bias as it rebounded quickly from a low of 7.2700 and ended the day little changed at 7.2917 (-0.04%). The price movements appear to be consolidative, and USD is likely to trade sideways today, probably between 7.2800 and 7.3050.
Next 1-3 weeks: Our latest narrative was from last Thursday (24 Aug, spot at 7.2840) when we highlighted that, “the recent buildup in upward momentum has eased, and USD is likely to trade in a range of 7.2500/7.3300 for the time being.” There is no change in our view.
- The index keeps a tight range near the 104.00 region.
- The dollar’s rally stalled ahead of 104.50 for the time being.
- CB Consumer Confidence, housing data next on tap in the docket.
The greenback alternates gains with losses around the 104.00 yardstick when measured by the USD Index (DXY) on turnaround Tuesday.
USD Index focused on data, Fed
The index so far trades in an inconclusive fashion near the 104.00 threshold, coming under some moderated selling pressure following last Friday’s multi-week tops near 104.50.
The current loss of momentum in the dollar comes along further weakness in US yields across the curve, as investors continue to price in a Fed’s pause in September vs. a 25 bps rate hike at the November meeting.
Data-wise in the US calendar, Consumer Confidence gauged by the Conference Board will take centre stage along with JOLTs Job Openings and the FHFA House Price Index.
What to look for around USD
Renewed weakness now prompts the index to challenge the key support at 104.00 the figure amidst an improved sentiment in the risk-linked universe.
In the meantime, support for the dollar keeps coming from the good health of the US economy, which seems to have reignited the narrative around the tighter-for-longer stance from the Federal Reserve.
Furthermore, the idea that the dollar could face headwinds in response to the data-dependent stance from the Fed against the current backdrop of persistent disinflation and cooling of the labour market appears to be losing traction as of late.
Key events in the US this week: FHFA House Price Index, JOLTs Job Openings, CB Consumer Confidence (Tuesday) – MBA Mortgage Applications, ADP Employment Change, Flash Q2 Growth Rate, Advanced Goods Trade Balance, Pending Home Sales (Wednesday) – PCE, Core PCE, Personal Income, Personal Spending, Chicago PMI, Initial Jobless Claims (Thursday) – Nonfarm Payrolls, Unemployment Rate, Final Manufacturing PMI, ISM Manufacturing PMI, Construction Spending (Friday).
Eminent issues on the back boiler: Persistent debate over a soft or hard landing for the US economy. Incipient speculation of rate cuts in early 2024. Geopolitical effervescence vs. Russia and China.
USD Index relevant levels
Now, the index is down 0.06% at 103.91 and faces immediate support at 103.09 (200-day SMA) followed by 102.33 (55-day SMA) and then 101.74 (monthly low August 4). On the upside, the breakout of 104.44 (monthly high August 25) would open the door to 104.69 (monthly high May 31) and finally 105.88 (2023 high March 8).
Reserve Bank of Australia (RBA) Governor-Designate, Michelle Bullock, is speaking at the Sir Leslie Melville Lecture at the Australian National University, in Canberra.
Key quotes
Impact of climate change on the neutral interest rate is not clear cut.
Could put both upward and downward pressure on the neutral rate.
Extreme weather could lower supply in economy and raise inflation.
Transition to renewables could push energy costs down and lower inflation.
Climate change likely to lead to more volatile inflation outcomes.
Market reaction
At the time of writing, AUD/USD is trading close to intraday highs of 0.6454, adding 0.30% so far.
In the opinion of UOB Group’s Economist Lee Sue Ann and Markets Strategist Quek Ser Leang, further upside in USD/JPY could revisit the 147.00 yardstick and above.
Key Quotes
24-hour view: We indicated yesterday that USD could edge higher. However, we were of the view that “a sustained break above 147.00 is unlikely.” Our view was not wrong, as USD edged higher and eked out a fresh 9-1/2-month high of 146.74. Unsurprisingly, the advance lacks momentum, and USD is unlikely to rise much further. Today, we expect USD to trade in a range, likely between 145.90 and 146.70.
Next 1-3 weeks: There is not much to add to our update from yesterday (28 Aug, spot at 146.45). As highlighted, the recent price actions resulted in a slight increase in upward momentum. There is room for USD to grind higher to 147.00, possibly 147.50. The mild upward pressure is intact as long as USD stays above 145.35 (‘strong support’ level was at 145.20 yesterday).
Here is what you need to know on Tuesday, August 29:
Trading action remains subdued early Tuesday and major currency pairs continue to fluctuate in familiar ranges. June Housing Price Index will be the first data releases of the day from the US. Later in the American session, the US Bureau of Labor Statistics' JOLTS Job Openings data for July and the Conference Board's Consumer Confidence Index for August will be watched closely by market participants.
The positive shift seen in risk sentiment made it difficult for the US Dollar to gather strength in the second half of the day on Monday and the USD Index (DXY) closed in negative territory. In the European morning on Tuesday, DXY holds steady at around 104.00. Wall Street's main indexes gained more than 0.5% on Monday and US stock index futures were last seen posting small daily gains. Meanwhile, the 10-year US Treasury bond yield stays on the back foot below 4.2% after falling nearly 1% on Monday.
US Dollar price today
The table below shows the percentage change of US Dollar (USD) against listed major currencies today. US Dollar was the weakest against the New Zealand Dollar.
| USD | EUR | GBP | CAD | AUD | JPY | NZD | CHF | |
| USD | 0.02% | -0.12% | -0.05% | -0.31% | -0.05% | -0.45% | 0.02% | |
| EUR | -0.01% | -0.14% | -0.07% | -0.33% | -0.08% | -0.45% | 0.02% | |
| GBP | 0.13% | 0.14% | 0.08% | -0.21% | 0.07% | -0.32% | 0.14% | |
| CAD | 0.06% | 0.05% | -0.08% | -0.27% | 0.00% | -0.40% | 0.06% | |
| AUD | 0.34% | 0.36% | 0.23% | 0.28% | 0.27% | -0.09% | 0.35% | |
| JPY | 0.06% | 0.03% | -0.09% | -0.01% | -0.28% | -0.39% | 0.06% | |
| NZD | 0.40% | 0.41% | 0.32% | 0.36% | 0.13% | 0.36% | 0.43% | |
| CHF | -0.01% | -0.01% | -0.13% | -0.08% | -0.33% | -0.06% | -0.42% |
The heat map shows percentage changes of major currencies against each other. The base currency is picked from the left column, while the quote currency is picked from the top row. For example, if you pick the Euro from the left column and move along the horizontal line to the Japanese Yen, the percentage change displayed in the box will represent EUR (base)/JPY (quote).
During the Asian trading hours, the data from Japan revealed that the Unemployment Rate edged higher to 2.7% in July from 2.5% in June. In the meantime, "Japan has seen price and wage rises broaden since the spring of 2022,” the Japanese government said in its annual economic white paper. “Such changes suggest the economy is reaching a turning point in its 25-year battle with deflation," the publication further read. USD/JPY showed no reaction to these comments and extended its sideways grind around 146.50.
EUR/USD registered small gains on Monday and continued to edge higher early Tuesday. The pair, however, seems to be struggling to gather bullish momentum while trading below 1.0850.
GBP/USD gained traction in the European session and advanced toward 1.2650. Following the long weekend, the UK's FTSE 100 Index opened more than 1% higher on Tuesday, pointing to an improving risk mood.
AUD/USD preserved its recovery momentum following Monday's advanced and climbed above 0.6450. Supported by the risk-positive market atmosphere, NZD/USD rose toward 0.5950 following Monday's choppy action.
Gold price closed modestly higher on Monday and continued to push higher amid retreating US yields early Tuesday. At the time of press, XAU/USD was trading in the green near $1,925.
Bitcoin and Ethereum both remain directionless early this week, moving sideways in tight ranges near $26,000 and $1,650, respectively.
- USD/CAD trades around 1.3600 ahead of the releases of US macroeconomic data.
- The decline in Crude oil prices is exerting upward pressure on the USD/CAD pair.
- China's fiscal stimulus faded the safe haven appeal of the US Dollar (USD).
USD/CAD treads waters to continue its winning streak, trading around 1.3600 during the early trading hours in the European session on Tuesday. The retreating US Treasury yields are contributing support to the downward pressure on the USD/CAD pair. Investors await upcoming data releases from the US and Canada, seeking fresh impetus into the economic prospects of both countries.
As said, these datasets include Jolts Job Openings, Housing Price Index, and Consumer Confidence, all of which are set to be disclosed later in the day. On Canada’s docket, Gross Domestic Product (GDP) is due to be released on Friday.
The support for the hawkish stance made by the US Federal Reserve (Fed) Chairman Jerome Powell is reinforcing the downward pressure on the Canadian Dollar (CAD). Powell advocated for supporting "higher for longer" interest rates. Powell also mentioned that the Fed is prepared to raise interest rates further if necessary and that the next rate hike decision will be data-driven.
The US Dollar Index (DXY), which measures the performance of the Greenback against the six other major currencies, struggles to retrace from the previous day’s losses. Currently, the spot price trades around 104.00. Recent China’s fiscal measures to attract investors back to its struggling equity markets are contributing to an optimistic risk sentiment, which faded the safe-haven appeal of the US Dollar (USD).
However, China’s economic woes put pressure on the price of Crude oil, which weakens the Loonie pair as Canada is one of the largest Oil exporters to the US. Western Texas Intermediate (WTI) trades around $79.80 at the time of writing.
FX option expiries for Aug 29 NY cut at 10:00 Eastern Time, via DTCC, can be found below.
- EUR/USD: EUR amounts
- 1.0725 1b
- 1.0775 440m
- 1.0800 2.1b
- 1.0830 477m
- 1.0845 407m
- 1.0855 462m
- 1.0885 377m
- 1.0900 444m
- USD/JPY: USD amounts
- 147.00 1b
- USD/CHF: USD amounts
- 0.8835 499m
- AUD/USD: AUD amounts
- 0.6400 1.4b
- Silver regains positive traction on Tuesday, albeit lacks follow-through.
- Positive oscillators on the daily chart support prospects for further gains.
- A break below $23.80 support might prompt aggressive technical selling.
Silver retests a three-week high on Tuesday, albeit struggles to capitalize on the move and remains below the $24.35-$24.40 area through the early European session.
The said hurdle might now act as a pivotal point, which if cleared decisively will set the stage for an extension of the recent rally from the $22.20 area, or the lowest level since June 23 touched earlier this month. Given that technical indicators on the daily chart have just started gaining positive traction, the XAG/USD might then aim to surpass the $24.55-$24.60 intermediate barrier and reclaim the $25.00 psychological mark. The positive move could get extended further towards the $25.25 zone, or the July monthly swing high, en route to the $26.00 round figure.
On the flip side, the $24.00 mark is likely to protect the immediate downside ahead of the 200-period Simple Moving Average (SMA) on the 4-hour chart, currently pegged around the $23.85 region. A sustained break below might prompt some technical selling and drag the XAG/USD towards the $23.55 region. This is closely followed by support near the $23.40 area, representing the 200-day SMA, which if broken decisively might shift the near-term bias in favour of bearish traders and pave the way for a further downside towards testing sub-$23.00 levels.
Silver 4-hour chart
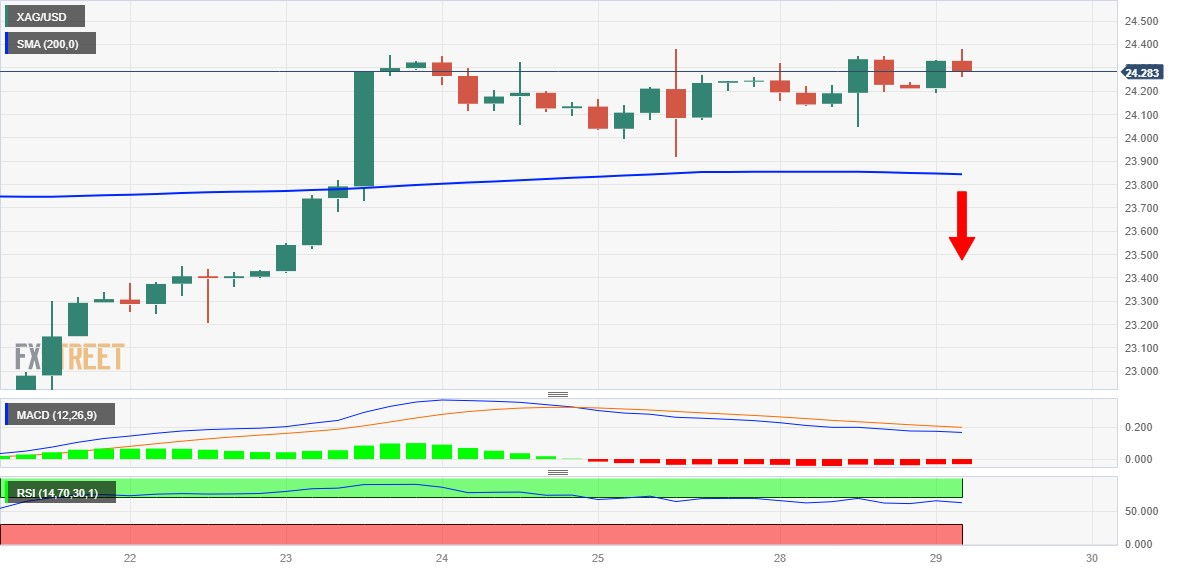
Any subsequent decline will expose the $22.20-$22.10 support zone. The latter represents the neckline of a bearish head and shoulders pattern formation on the daily chart. Hence, a convincing break below will set the stage for a meaningful decline.
XAG/USD daily chart
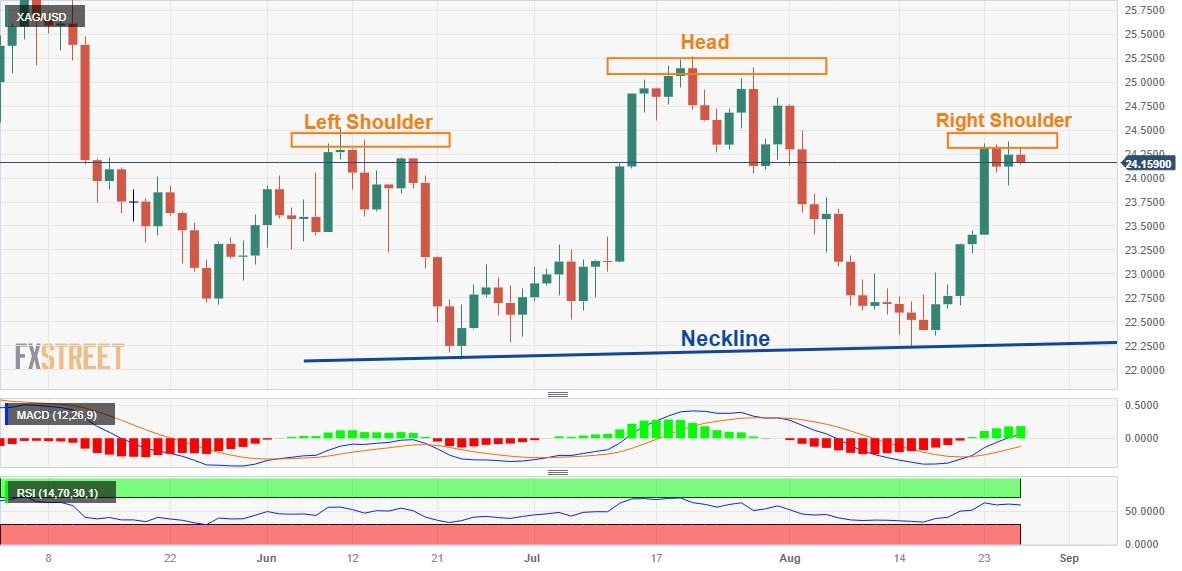
Technical levels to watch
- USD/JPY holds above the 50- and 100-hour EMAs with an upward slope.
- A Year-To-Date (YTD) high of 146.75 will be the first resistance level for the pair.
- The initial contention for USD/JPY is located at 145.80.
The USD/JPY pair oscillates in a narrow range near 146.42 during the early European trading hours on Tuesday. Market participants prefer to wait on the sidelines ahead of the release of US CB Consumer Confidence and JOLTS Job Openings for July due later in the North American session.
Apart from this, the Japanese Unemployment Rate increased to 2.7% in July from 2.5% in June, according to the latest figures from the Statistics Bureau. The figure rose for the first time in four months and exerted pressure on the Bank of Japan (BoJ) and the government. However, traders turn cautious to place buying bets amid the fear of FX intervention by the BoJ.
Technically, the USD/JPY pair stands above the 50- and 100-hour Exponential Moving Averages (EMAs) with an upward slope, which means the path of least resistance is to the upside for the major pair.
The immediate resistance level for USD/JPY appears at a Year-To-Date (YTD) high of 146.75. Any meaningful follow-through buying will see a rally to the boundary of the Bollinger Band and a psychological round mark at the 146.90-147.00 region. Further north, the next barrier to watch for USD/JPY is located at 147.55 (a high of November 2022), followed by 148.00 (a round figure).
On the downside, the initial contention for the major pair is located at 145.80 (50-hour EMA). The next contention level emerges near a lower limit of the Bollinger Band at 145.55. Any intraday pullback below the latter would expose the next downside stop at 145.05 (100-hour EMA), and finally at 144.55 (a low of August 23).
It’s worth noting that the Relative Strength Index (RSI) stands in bullish territory above 50, which indicates that the upside momentum has been activated for the time being.
USD/JPY four-hour chart
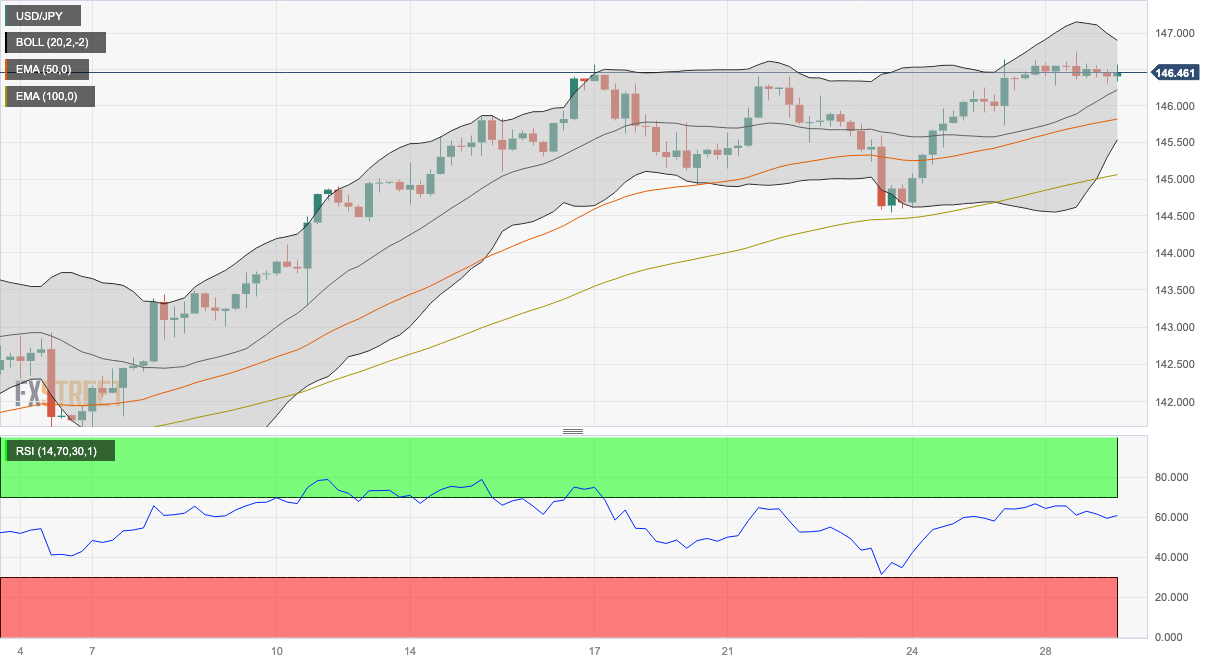
- WTI crude oil extends the week-start retreat within a fortnight-old bearish channel.
- Downside break of rising support line from Wednesday, looming bear cross on MACD also favor energy sellers.
- Oil price recovery needs validation from 100-SMA and US data to recall commodity buyers.
WTI crude oil remains pressured for the second consecutive day as sellers attack the 200-SMA support amid the early hours of Tuesday’s European session. In doing so, the black gold justifies an immediate support break while reversing from the upper line of a two-week-long descending trend channel, down 0.20% on a day near $79.65 at the latest.
Apart from the reversal from the channel’s resistance and a downside break of an ascending trend line from the last Wednesday, an impending bear cross on the MACD indicator joins the RSI (14) line’s retreat to keep the Oil sellers hopeful.
However, a clear break of the 200-SMA level of $79.55 becomes necessary for sellers to keep control.
Following that, the double bottoms marked on August 03 and 17, around $78.60–50, will challenge the energy benchmark sellers.
In a case where the black gold remains bearish past $78.50, the odds of witnessing a slump towards the stated channel’s bottom line, close to $76.80 at the latest, can’t be ruled out.
Meanwhile, a convergence of the previous support line and the bearish channel’s top line restricts the immediate upside of the WTI crude oil price near the $80.00 threshold.
Even if the Oil price remains firmer past $80.00, the 100-SMA and late August swing high could test the buyers around $80.80 and $81.70 in that order.
Apart from the technical details, the looming US data about inflation and employment, as well as the weekly Oil inventories, also appear crucial to determine the short-term WTI moves.
Also read: Crude Oil Futures: Further consolidation in the pipeline
WTI crude oil: Four-hour chart
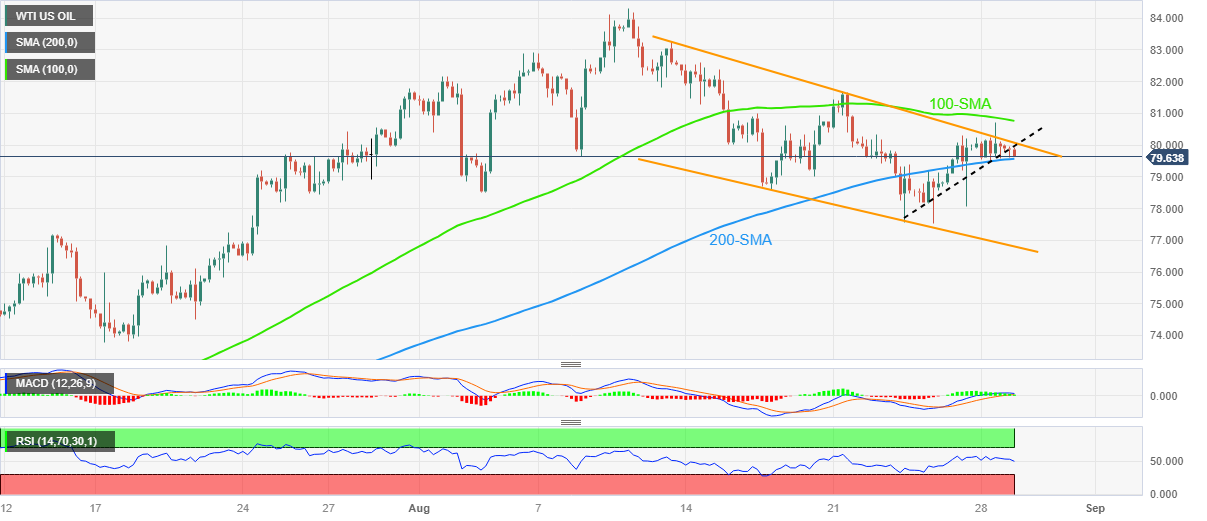
Trend: Limited downside expected
CME Group’s flash data for natural gas futures markets noted traders reduced their open interest positions by around 8.7K contracts at the beginning of the week, extending the erratic performance seen as of late. On the other hand, volume remained choppy and went up by around 170.5K contracts.
Natural Gas: Upside remains limited around $3.00
Monday’s uptick in prices of natural gas was accompanied by shrinking open interest and suggests that further gains appear not favoured in the very near term. However, the strong build in open interest could allow for the continuation of the upside momentum. In the meantime, the $3.00 mark per MMBtu remains as a strong hurdle for bulls for the time being.
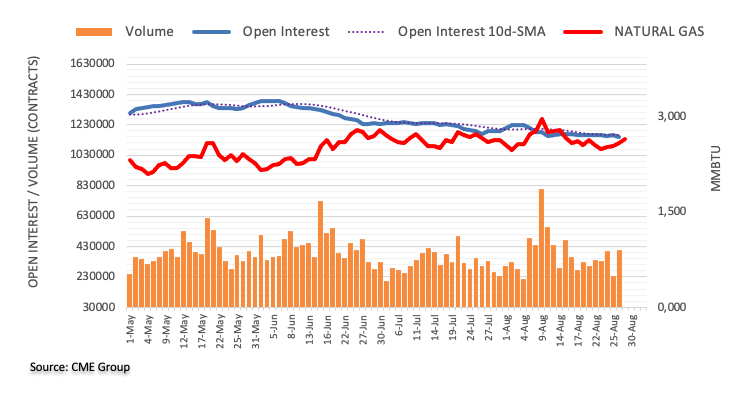
NZD/USD is expected to navigate between 0.5865 and 0.5995 in the short term according to UOB Group’s Economist Lee Sue Ann and Markets Strategist Quek Ser Leang.
Key Quotes
24-hour view: Yesterday, we expected NZD to trade sideways in a range of 0.5890/0.5935. NZD then traded in a narrower range than expected (0.5897/0.5926). Momentum indicators are flat, and we continue to expect NZD to trade sideways, probably in a range of 0.5890/0.5930.
Next 1-3 weeks: There is not much to add to our update from last Friday (24 Aug, spot at 0.5920). As highlighted, we continue to expect NZD to trade in a range, albeit a lower one of 0.5865/0.5995. Looking ahead, NZD has to break clearly below 0.5865 before a sustained decline is likely.
- EUR/USD holds below the 50- and 100-day EMAs on a four-hour chart.
- The Relative Strength Index (RSI) remains in bearish territory.
- The first resistance level appears at 1.0845-1.0850 region; the key support level to watch is 1.0800.
The EUR/USD pair recovers some lost ground but the upside seem limited during the early European session on Tuesday. The major pair currently trades near 1.0816, losing 0.03% on the day. The odds of additional interest rate hikes by the Federal Reserve (Fed) lift US bond yields and limit USD losses.
According to the four-hour chart, the major pair holds below the 50- and 100-day Exponential Moving Averages (EMAs), implying the path of least resistance for the EUR/USD is to the downside. Adding to this, the Relative Strength Index (RSI) remains below 50, supporting EUR/USD sellers for now.
The immediate resistance level for EUR/USD appears at 1.0845-1.0850 region, representing a confluence of the 50-hour EMA and the upper boundary of the Bollinger Band. Further north, the pair will challenge the next hurdle at 1.0890 (100-hour EMA).
Any meaningful follow-through buying beyond the latter could pave the way to the next barrier at 1.0930 (a high of August 22) en route to 1.1000 (a psychological round mark, a high of August 8)and finally at 1.1065 (a high of August 10).
On the flip side, the key support level to watch is 1.0800, portraying a psychological round mark and a low of August 23. The additional downside stop is near the limit of the Bollinger Band and a low of August 25 at the 1.0765-1.0770 region. A decisive break below the latter would fuel a drop towards 1.0735 (a low of June 12) and 1.0675 (a low of June 6).
EUR/USD one-hour chart
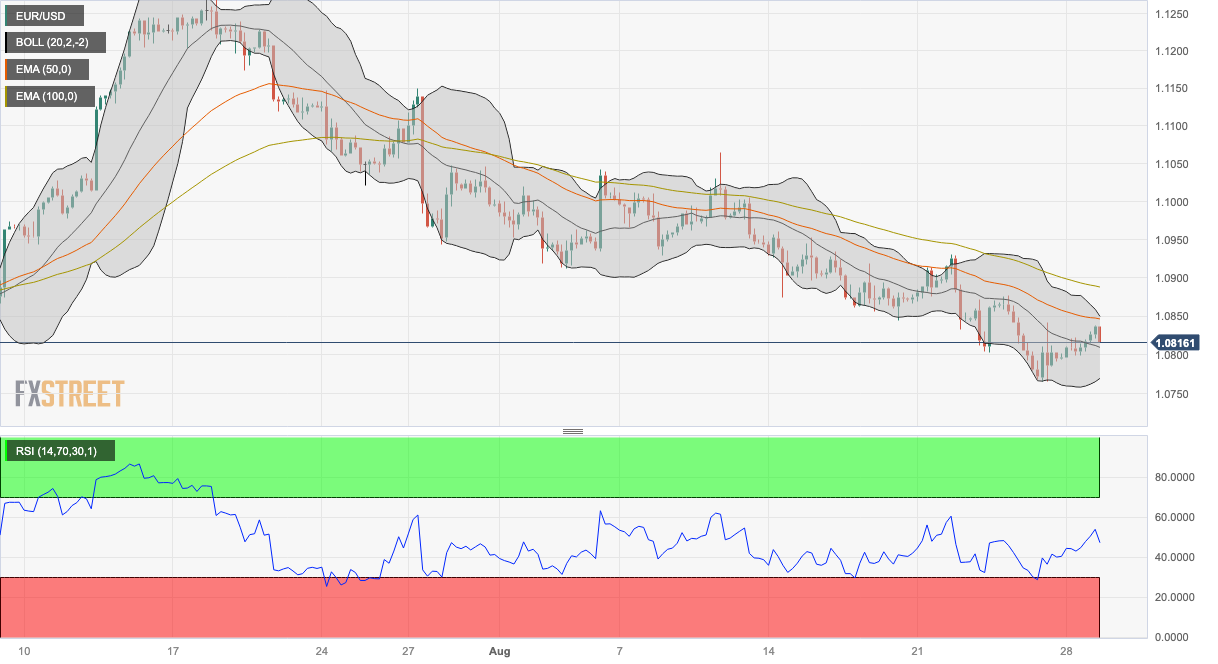
Considering advanced prints from CME Group for crude oil futures markets, open interest increased for the third consecutive session on Monday, now by around 1.4K contracts. Volume, instead, nearly halved from the previous day and dropped by around 431.3K contracts.
WTI appears consolidative around $80.00
Price action around WTI gyrated around the $80.00 mark per barrel on Monday amidst rising open interest and a sharp drop in volume. Against that, further range bound around current prices should not be ruled out for the time being. On the upside, the 2023 peak at $84.85 emerges as the next target of relevance for the commodity.
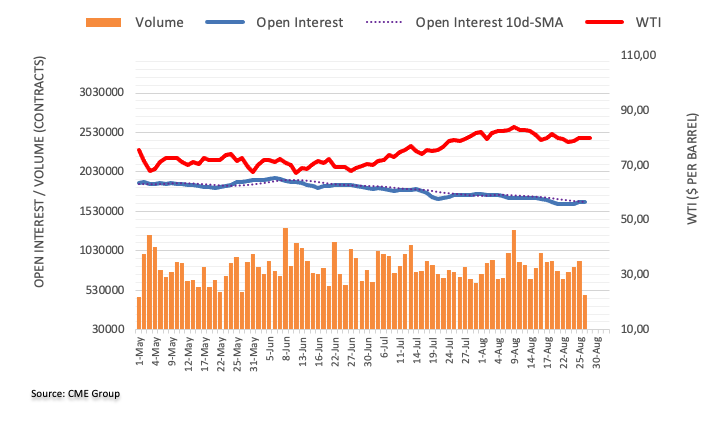
- Gold Price remains firmer around two-week high as bulls cheer softer US Dollar, cautious optimism.
- US Dollar traces downbeat yields amid uncertainty about Fed’s next moves and anxiety ahead of Consumer Confidence data.
- Hopes of more stimulus from China add strength to XAU/USD run-up after snapping the four-week losing streak.
- Gold Price approaches key upside hurdle as top-tier US statistics loom.
Gold Price (XAU/USD) defends the previous weekly recovery, the first in five, as it rises for the second consecutive day amid the broad US Dollar weakness. Also adding strength to the XAU/USD rebound is the cautious optimism in the market, as well as the downbeat Treasury bond yields.
It’s worth noting that the US Dollar Index (DXY) cheers the Fed policymakers’ data dependency and recent mixed US data, as well as a sustained pullback in the US Treasury bond yields from the multi-year high marked last week.
Elsewhere, hopes of more stimulus from China via fiscal, as well as monetary policy, keep the Gold buyers hopeful.
However, the cautious mood ahead of the US inflation and employment clues, as well as China activity data, prod the XAU/USD bulls around the key $1,940 resistance confluence.
To sum up, the Gold Price has the majority of catalysts needed for the further upside but $1,940 and broad US Dollar weakness, as well as the downbeat yields, will decide the further advances of the XAU/USD.
Also read: Gold Price Forecast: Tide turns in favor of XAU/USD buyers, US jobs data awaited
Gold Price: Key levels to watch
As per our Technical Confluence indicator, the Gold Price floats within a $40 region multiple resistance area ahead of this week’s top-tier US inflation and employment clues.
That said, a convergence of the Pivot Point one-day R1 and the previous daily high guards the immediate recovery of the Gold Price near $1,928.
Following that, the 200-SMA on the four-hour (4H) chart and Fibonacci 61.8% on one-month, around $1,937, restricts further upside of the Gold Price.
In a case where the XAU/USD buyers keep the reins past $1,937, the Pivot Point one-week R2 around $1,945 will act as the last defense of the Gold sellers.
On the flip side, a convergence of the 5-DMA, previous daily low, Fibonacci 23.6% on one-week and Pivot Point one-day S1 together restrict the immediate Gold Price downside near $1,910.
Should the XAU/USD bears manage to conquer the $1,910 key support, the 10-DMA, previous monthly low and Fibonacci 161.8% on weekly chart, close to $1,900 at the latest, will act as the last check for the sellers.
Here is how it looks on the tool
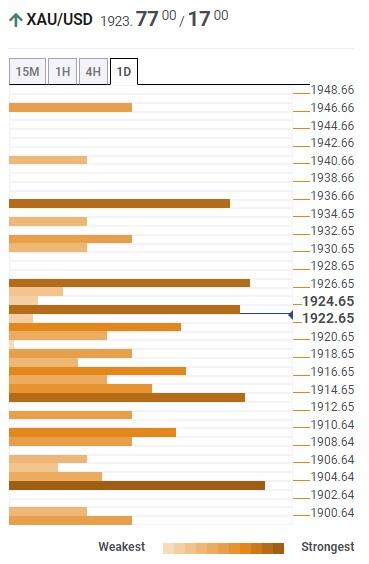
About Technical Confluences Detector
The TCD (Technical Confluences Detector) is a tool to locate and point out those price levels where there is a congestion of indicators, moving averages, Fibonacci levels, Pivot Points, etc. If you are a short-term trader, you will find entry points for counter-trend strategies and hunt a few points at a time. If you are a medium-to-long-term trader, this tool will allow you to know in advance the price levels where a medium-to-long-term trend may stop and rest, where to unwind positions, or where to increase your position size.
Extra losses could drag GBP/USD to the 1.2530 region in the next few weeks, suggest UOB Group’s Economist Lee Sue Ann and Markets Strategist Quek Ser Leang.
Key Quotes
24-hour view: Last Friday, GBP fell to a low of 1.2548. Yesterday, we highlighted that “downward momentum has not increased much; this combined with oversold conditions, suggests that GBP is unlikely to weaken much further.” We expected GBP to trade sideways in a range of 1.2545/1.2625. In line with our expectations, GBP traded sideways, albeit in a narrower range than expected (1.2568/1.2609). Further sideways trading appears likely. The slightly firm underlying tone suggest a higher range of 1.2670/1.2650.
Next 1-3 weeks: Our update from last Friday (25 Aug, spot at 1.2600) still stands. As highlighted, the recent increase in downward momentum suggests GBP is likely to weaken to 1.2530, possibly 1.2480. We will continue to hold the same view as long as GBP stays below the ‘strong resistance’ at 1.2685 (no change in level from yesterday). That said, GBP could consolidate for 1-2 days first.
Open interest in gold futures markets dropped for the third straight session, this time by just 84 contracts on Monday according to preliminary readings from CME Group. Volume followed suit and shrank by around 53.5K contracts, reversing the previous daily build.
Gold: Interim hurdle emerges around $1930
Gold prices started the week on a positive foot and extended the recent breakout of the $1900 mark per troy ounce. The uptick was on the back of shrinking open interest and volume and signals that the ongoing bounce could be running out of steam in the near term. In the meantime, the 55-day SMA at $1931 is expected to offer provisional resistance in the very near term.
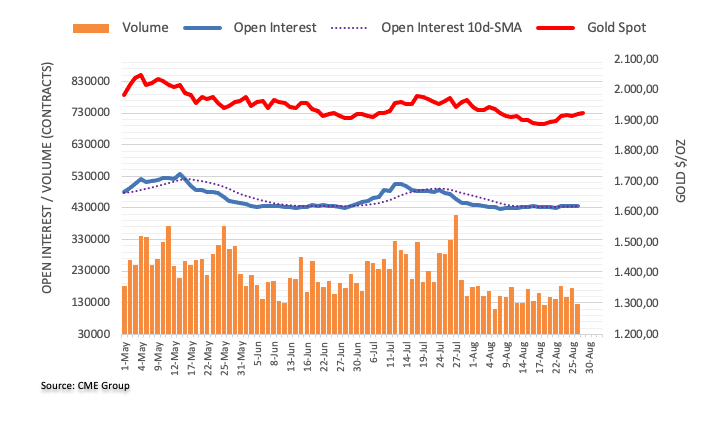
- EUR/GBP reverses from two-week high to print the first daily loss in five.
- UK BRC Shop Price Index drops to the lowest level since October 2022.
- Germany’s GfK Consumer Confidence Survey gauge slumps -25.5 versus -24.3 expected and -24.6 prior.
- British trader’s reaction to Jackson Hole, inflation concerns eyed for fresh impulse after long weekend in UK.
EUR/GBP bears return to the table after a four-day holiday as the cross-currency pair reverses from the intraday high heading into Tuesday’s European session. That said, the quote takes offers to refresh the daily low around 0.8575 by the press time.
In doing so, the EUR/GBP pair ignores downbeat inflation signals from the UK shops amid the downbeat German consumer sentiment gauge. In doing so, the quote portrays a U-turn from the 0.8585 DMA confluence stated in the technical analysis.
Germany’s GfK Consumer Confidence Survey gauge dropped to -25.5 in September versus -24.3 expected and -24.4 prior.
Earlier in the day, the British Retail Consortium’s (BRC) annual shop price inflation slumped to the lowest level since October 2022 while flashing 6.9% mark for August, versus 7.6% reported in July.
It’s worth noting that Germany’s highly influential IFO institute published a survey of exporters and cited the deteriorating morale in August due to weak global demand, which in turn prod the Euro bulls the previous day. The poll also mentioned, “More and more companies are also complaining about being less able to compete at the global level.”
However, French Finance Minister Bruno Le Maire ruled out any reduction in European Central Bank (ECB) interest rates in the coming months and put a floor under the bloc’s currency.
On the other hand, the UK markets were closed on Monday due to the Summer Bank Holiday but the hawkish comments from Bank of England (BoE) Deputy Governor Ben Broadbent seem to keep the British Pound (GBP) buyers hopeful of late. That said, BoE’s Broadbent cited the need for higher rates due to the wage pressure at the Jackson Hole Symposium.
Moving on, a light calendar for the rest of the day might restrict the EUR/GBP pair’s moves but the British traders’ reaction to the latest catalysts and preparations for this week’s top-tier Eurozone inflation data could keep the bears hopeful.
Technical analysis
A convergence of the 21-day Simple Moving Average (SMA) and the 50-day SMA, around 0.8585, appears a tough nut to crack for the EUR/GBP bulls. That said, the pullback moves can aim for the late 2022 low near 0.8550-45 amid lackluster oscillators.
- USD/MXN loses momentum near 16.77 amid the USD weakness.
- Federal Reserve (Fed) Chairman Jerome Powell said that additional rate hikes cannot be ruled out if required.
- Banxico’s policymakers cited the potential additional rate hikes to ease inflationary pressures.
- Market players will keep an eye on Mexico’s GDP, US CB Consumer Confidence.
USD/MXN extends its downside during the early European session on Tuesday. The pair currently trades around 16.77, losing 0.11% on the day. Meanwhile, the US Dollar Index (DXY), a measure of the value of the USD against six other major currencies, loses traction for the second consecutive day. Market participants await the US top-tier economic data and Mexican Gross Domestic Product (GDP) for the second quarter for fresh impetus.
Regarding the Jackson Hole Symposium, Federal Reserve (Fed) Chairman Jerome Powell stated that the additional rate hike cannot be ruled out if required, it would be determined by incoming data. According to World Interest Rates Probabilities (WIRP), the market discounts modest odds of a hike in September, but the probability of a 25 basis point (bps) hike in November increased to nearly 70%. About the data, the US Dallas Federal Reserve Manufacturing Index for August rose to -17.2 from -20 prior, better than the estimation of -21.6.
On the other hand, Banxico’s policymakers cited the potential additional rate hikes to ease inflationary pressures. This, in turn, boosts the Mexican Peso (MXN) against the US dollar and acts as a headwind for USD/MXN. Furthermore, Mexico, Latin America’s second-largest economy, will release GDP data on Tuesday. The annual growth figure is expected to remain unchanged at 3.7% while the monthly figure is expected to grow 0.9%.
Market participants will also monitor the US CB Consumer Confidence for August and JOLTs Job Opening for July due later in the day. The attention will shift to the highly anticipated Nonfarm Payrolls data on Friday. Traders will take cues and find trading opportunities around USD/MXN.
UOB Group’s Economist Lee Sue Ann and Markets Strategist Quek Ser Leang note EUR/USD could face some consolidative mood ahead of potential extra losses.
Key Quotes
24-hour view: Our view for EUR to retest the 1.0765 level did not materialise as it traded in a tight range between 1.0792 and 1.0820. The price actions are likely part of a consolidation phase. Today, we expect EUR to trade in a range, probably between 1.0800 and 1.0845.
Next 1-3 weeks: We continue to hold the same view as yesterday (28 Aug, spot at 1.0795). As highlighted, EUR could consolidate for a couple of days before declining to 1.0730. However, if EUR breaches the ‘strong resistance’ level at 1.0875 (no change in level from yesterday), it would indicate that the weakness in EUR that started early last week has stabilised.
- AUD/USD pares intraday gains within two-week-old symmetrical triangle.
- Upbeat RSI, clear break of previous resistance line from late July keep Aussie buyers hopeful.
- RBA’s Bullock needs to defend hawkish bias, US data should ease to defend pair bulls.
- Sellers remain hopeful below 0.6630 but downside room appears limited until 0.6360.
AUD/USD retreats from intraday high to 0.6445 as markets brace for key Aussie catalysts heading into Tuesday’s European session. Even so, the risk-barometer pair remains firmer for the second consecutive day while staying inside a fortnight-old symmetrical triangle.
That said, Reserve Bank of Australia (RBA) Deputy Governor Michele Bullock, to be the Governor in three weeks, is up for a speech and will be closely observed as the pair buyers run out of steam due to fears of policy pivot. Following that, the US Conference Board’s (CB) Consumer Confidence Index for August, expected at 116.2 versus prior 117.00, will direct the AUD/USD pair’s moves.
Technically, the Aussie pair remains on the front foot despite the latest inaction as it defends the previous week’s upside break of a one-month-old resistance line, now support around 0.6360, with a symmetrical triangle. Adding strength to the upside bias is the firmer RSI (14) line, not overbought.
However, the 100-SMA and the stated triangle’s top line, respectively near 0.6465 and 0.6475, could restrict the pair’s immediate upside ahead of the 200-SMA hurdle of 0.6590.
In a case where the AUD/USD remains firmer past 0.6590, a downward-sloping resistance line from July 14, close to 0.6630 at the latest, will be in the spotlight.
On the contrary, a downside break of the stated triangle’s bottom line, close to the 0.6400 threshold as we write, isn’t an open invitation to the AUD/USD bears as a convergence of the previous resistance line and the yearly low, around 0.6360, appears a tough nut to crack for sellers.
AUD/USD: Four-hour chart
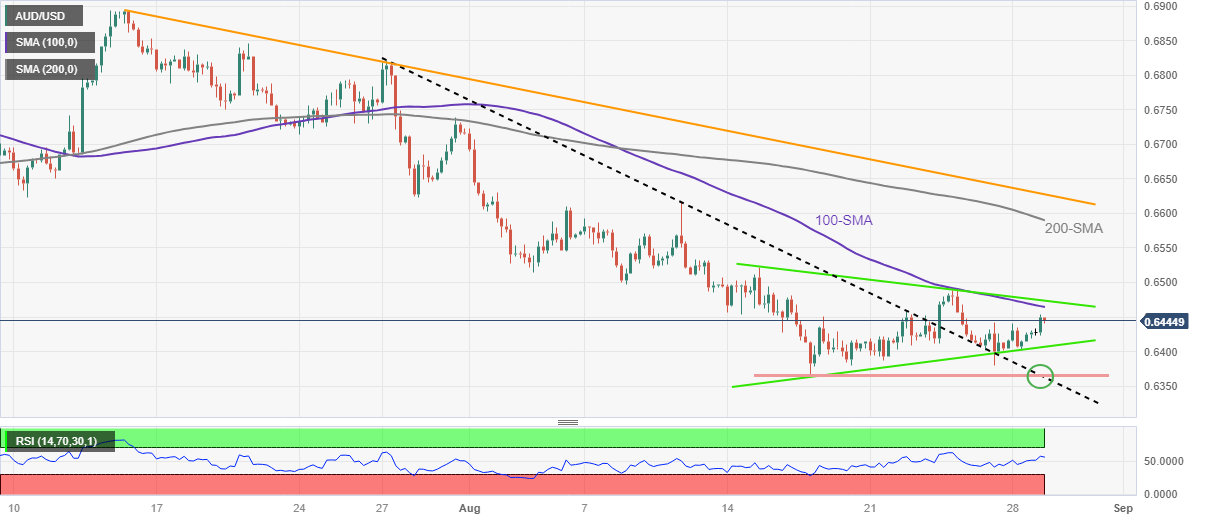
Limited upside expected
- GBP/USD extends its gains on the back of downbeat US Treasury yields.
- China's fiscal stimulus is giving rise to cautious optimism and weakening the Greenback.
- Investors await US data releases to gain fresh impetus on the economic outlook.
GBP/USD continues to gain for the second consecutive day, trading around 1.2620 during the Asian session on Tuesday. A sense of cautious optimism weakened the yields on US government bonds, contributing to the upward movement of the GBP/USD pair.
Additionally, the hawkish remarks made by the Bank of England (BoE) Deputy Governor Ben Broadbent at the Jackson Hole Symposium helped the Cable pair to snap a four-day losing streak. As said, Broadbent advocated for policy rates to remain higher for a prolonged period.
The US Dollar Index (DXY), which measures the performance of the Greenback against the six other major currencies, extends its losses and trades around 103.90. The recent fiscal measures introduced by China to attract investors back to its struggling stock markets are contributing to optimistic risk sentiment and weakening the safe-haven US Dollar (USD).
Investors await upcoming data releases from the US, seeking new insights into the country's economic prospects. These datasets include Jolts Job Openings, Housing Price Index, and Consumer Confidence, all of which are set to be disclosed later in the day. These data releases are anticipated to provide valuable perspectives on the US economic trajectory, potentially impacting trading strategies related to the GBP/USD pair.
- Asian stock markets trade in positive territory on Tuesday.
- The Chinese additional stimulus measure alleviates some fear of the economic slowdown in China.
- Investors await US top-tier economic data, Chinese Manufacturing PMI.
Asian stock market gains momentum on Tuesday as the concern over the economic slowdown in China fades while investors await the economic data from the US, including the highly anticipated Nonfarm Payrolls on Friday.
At press time, China’s Shanghai is up 1.39% to 3,141, the Shenzhen Component Index surges 2.41% to 10,480, Hong Kong’s Hang Sang rises 2.02% to 18,496, South Korea’s Kospi is up 0.40%, Japan’s Nikkei is up 0.33% and Nifty 50 rises 0.16%.
The Chinese finance ministry said that the authorities would reduce the 0.1% duty on stock trading to stimulate the capital market and strengthen investor confidence. As part of government attempts to stimulate a stock market fighting for liftoff in a faltering economy, China's securities regulator authorized the launch of 37 retail funds over the weekend, according to Reuters. This positive development alleviates some fear of the economic slowdown in China, the world’s second-largest economy. However, market players will closely watch the Chinese Manufacturing PMI for August on Friday for fresh impetus.
In Japan, the nation’s unemployment rate increased to 2.7% in July from 2.5% in June, according to the latest figures from the Statistics Bureau. The figure rose for the first time in four months and exerted pressure on the Bank of Japan (BoJ) and the government. Furthermore, Japanese Finance Minister Shunichi Suzuki said on Tuesday that the policymaker will look into economic measures to be implemented after September while he said that he does not want to remark on the additional budget at this time.
In India, the Adani group was found to have violated rules on disclosures by listed businesses and limits on offshore fund holdings following the investigation by India's market regulator. On the Indian docket, the Gross Domestic Product (GDP) and S&P Global Manufacturing PMI August will be due later this week.
The attention will shift to the US economic data. The US JOLTs Job Openings figures from July, ADP Employment Change, and Nonfarm Payrolls will be due later this week. Also, the US Gross Domestic Product (GDP), ISM PMI, and Core Personal Consumption Expenditures (PCE) will be in the traders’ focus.
- NZD/USD defends the week-start rebound from yearly low despite lacking momentum of late.
- US Dollar extends pullback from 11-week high amid cautious optimism, downbeat yields.
- Hopes of early PBoC rate cut, more stimulus from China propel Kiwi prices.
- US CB Consumer Confidence, risk catalysts eyed for clear directions.
NZD/USD remains firmer around 0.5920, making rounds to intraday high ahead of Tuesday’s European session, as buyers cheer the US Dollar weakness but lack support amid a light calendar and mixed sentiment. Even so, hopes of witnessing more stimulus from the major customer China add strength to the Kiwi pair’s recovery moves.
China state media advocates early rate cuts from the People’s Bank of China (PBoC), which in turn suggests more money flow and favors the Kiwi buyers to keep the reins despite sluggish momentum. “The PBoC would cut the RRR to better maintain reasonable and ample liquidity,” said the analytical piece.
That said, the mixed updates about the US-China trade talks in Beijing join the International Monetary Fund (IMF) Director Kristalina Georgieva’s readiness to visit the senior leaders of China’s Communist Party prod the risk appetite and the NZD/USD buyers.
Also, New Zealand (NZ) Minister of Finance (FinMin) Grant Robertson flagged recession fears in the Pacific nation while urging the public service to cut spending on consultants and contractors, which in turn prods the NZD/USD bulls. The policymaker also added that he will also cut down the future budget allowances, per Bloomberg.
It should be noted that China’s halving of the stamp duty on stocks trading joined a Wall Street Journal (WSJ) piece suggesting Chinese Communist Party Chairman Xi Jinping’s indirect push for stimulus to favor market sentiment. On the same line were the global policymakers’ inabilities to please markets with a major hawkish surprise during the annual Jackson Hole Symposium.
Elsewhere, challenges for the global central bankers, due to the mixed data and looming recession woes, keep traders on their toes after the policymakers defended their respective hawkish practices at the last week’s Jackson Hole Symposium.
Amid these plays, US 10-year Treasury bond yields remain pressured around 4.19% while the US Dollar Index (DXY) also drops to 103.85 by the press time. It’s worth noting that the US two-year bond coupons reversed from the highest level since 2007 the previous day and remained depressed near 5.00% by the press time. Further, the S&P 500 Futures lack clear directions around 4,445 after rising in the last two consecutive days.
Moving on, the US Conference Board’s (CB) Consumer Confidence Index for August, expected at 116.2 versus prior 117.00, will be important for the pair trader to watch amid a light calendar elsewhere. More importantly, the risk catalysts, China news and this week's China PMI, US Core PCE Price Index and NFP for August will be crucial for a clear direction for the NZD/USD pair.
Technical analysis
NZD/USD buyers struggle with a six-week-old descending resistance line surrounding 0.5920 as the oversold RSI (14) line favors the corrective bounce.
- Gold price attracts some buyers for the second successive day amid modest USD weakness.
- Retreating US bond yields drags the USD away from a nearly three-month top set last week.
- Hawkish Fed expectations should limit the USD losses and cap the upside for the XAU/USD.
Gold price gains some positive traction for the second successive day on Tuesday and climbs to the $1,925-$1,926 area during the Asian session, or over a two-week high touched the previous day.
The ongoing decline in the US Treasury bond yields drags the US Dollar (USD) further away from a nearly three-month top, which, in turn, is seen driving some flows towards the Gold price. In fact, the yield on the benchmark 10-year US government bond is seen extending its pullback from the highest level since November 2007 set last week and keeps the USD bulls on the defensive. That said, rising bets for more interest rate hikes by the Federal Reserve (Fed) should limit the downside for the US bond yields and the USD.
The expectations were reaffirmed by Fed Chair Jerome Powell's hawkish remarks on Friday, saying that the central bank may need to tighten the monetary policy further to curb sticky inflation. Moreover, a resilient US economy could force the Fed to continue with its rate-hiking cycle for longer. This might hold back bulls from placing aggressive bets around the non-yielding Gold price and warrants caution before positioning for an extension of the recent recovery from the $1,885 region, or the lowest level since March 13.
Traders might also prefer to wait on the sidelines ahead of this week's key US macro data, including the closely-watched monthly employment details on Friday, which should provide a fresh directional impetus to the Gold price. In the meantime, worries about the worsening economic conditions in China might continue to act as a tailwind for the safe-haven XAU/USD and help limit any corrective decline. Traders now look to the Conference Board US Consumer Confidence Index and JOLTS Job Openings data for short-term opportunities.
Technical levels to watch
- USD/RUB extends week-start reversal from 21-DMA resistance, holds lower grounds near intraday bottom of late.
- Downside break of three-month-old rising trend line, bearish MACD signals also favor Russian Ruble buyers.
- 50-DMA puts a floor under USD/RUB price as US CB Consumer Confidence looms.
USD/RUB remains depressed for the second consecutive day around the 93.00 threshold heading into Tuesday’s European session. In doing so, the Russian Ruble (RUB) pair defends the previous day’s U-turn from the 21-DMA, as well as keeps the last week’s retreat from a three-month-old previous support line.
Adding strength to the downside bias are the bearish MACD signals and the US Dollar’s weakness ahead of the US Conference Board’s (CB) Consumer Confidence Index for August, expected at 116.2 versus prior 117.00.
However, the RSI conditions suggest limited downside room, which in turn highlights the 91.80 support confluence comprising the 50-DMA and 38.2% Fibonacci retracement of the May-August upside.
Even if the USD/RUB pair drops below 91.80, July’s low of near 88.90 and 50% Fibonacci ratio of around 88.65 will act as additional checks for the sellers before giving them control.
Meanwhile, the 21-DMA and the support-turned-resistance guard the short-term USD/RUB rebound near 95.30 and 96.70 in that order.
Following that, the 100.00 psychological magnet will act as the final defense of the Russian Ruble bears before highlighting the pair’s latest peak of around 102.35.
USD/RUB: Daily chart
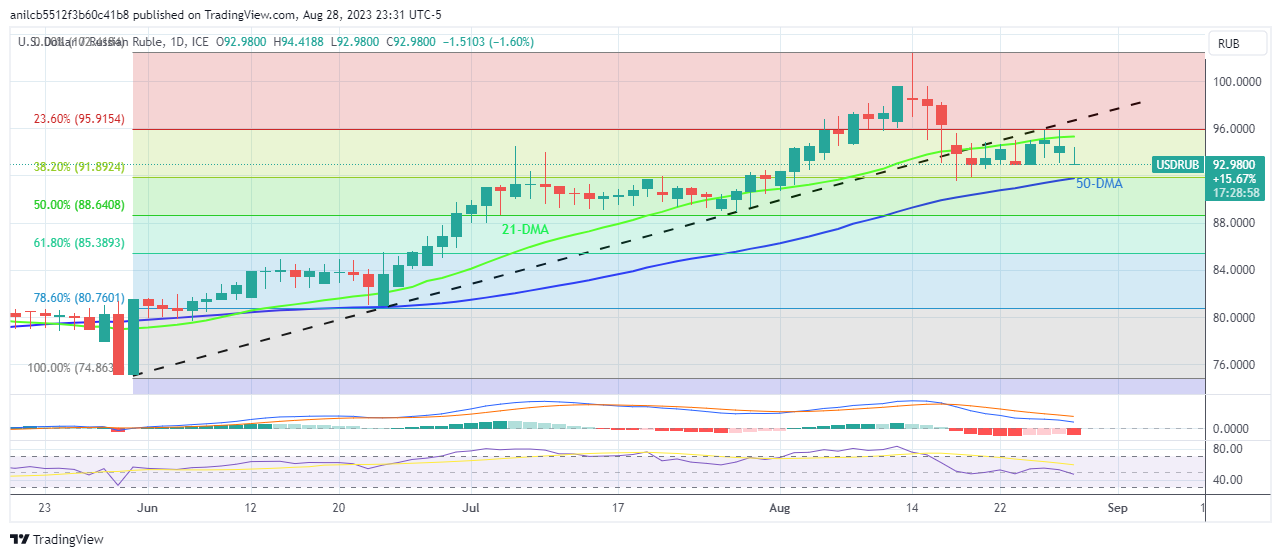
Trend: Further downside expected
- USD/INR consolidates ahead of the data releases from both nations.
- China's economic stimulus causes positive sentiment, providing support for the Indian Rupee (INR).
- India's market regulator has unveiled instances of violations within the Adani group.
USD/INR trades sideways around 82.60 during the Asian session on Tuesday as market participants prepare for forthcoming data releases from India and the United States (US). Furthermore, the positive sentiment stemming in the Asian regional markets from China's economic stimulus actions is favoring the Indian Rupee (INR) buyers.
Beijing implemented a reduction of 0.1% in the stamp duty on stock trading. Additionally, traders are closely monitoring the visit of US Commerce Secretary Gina Raimondo to China, with the aim of strengthening trade relations between the United States and China. The stability in China's economy could contribute to support for the Indian Rupee (INR) buyers.
Investors await upcoming data releases from the US, seeking fresh impetus on the US economic outlook. These datasets include Jolts Job Openings, Housing Price Index, and Consumer Confidence scheduled to be unveiled later in the day.
During the week, US Core Personal Consumption Expenditures (PCE) Index, weekly Jobless Claims, and Nonfarm Payrolls will be in focus. Likewise, India’s Gross Domestic Product (GDP) is expected to improve in the second quarter report, which is due to be released on Thursday.
Additionally, an inquiry conducted by India's market regulator into the Adani group has revealed instances of breaches in regulations concerning disclosures by listed entities and limits on offshore fund holdings. The Securities and Exchange Board of India (SEBI) initiated the investigation following concerns raised by US-based Hindenburg Research regarding governance issues surrounding the Adani group. The situation could potentially exert pressure on Indian equities, possibly leading to support for the USD/INR pair.
The US Dollar Index (DXY), gauging the Greenback's performance against six other major currencies, trades lower around 103.80. The decline in the US Treasury yield is undermining the US Dollar (USD) due to a prevailing sense of caution, following the support for the hawkish stance by the US Federal Reserve Chair Jerome Powell.
- EUR/SEK trades within the ascending trend-channel on the four-hour chart.
- The key support level is seen at 11.8550; 11.8752 acts as an immediate resistance level for the cross.
- The Relative Strength Index (RSI) stands in bearish territory below 50.
The EUR/SEK cross loses traction after retreating from a weekly high of 1.9455 during the Asian session on Tuesday. The cross currently trades near 11.8577, down 0.19% on the day.
From the technical perspective, EUR/SEK trades within the ascending trend-channel since the middle of July on the four-hour chart. Additionally, the cross holds above the key 100-hour Exponential Moving Average (EMA), which means the further upside looks favorable for the time being.
That said, the key support level for EUR/SEK is seen at 11.8550, representing the lower limit of the ascending trend-channel. A decisive break below the latter will see a drop to 11.8255 (a low of August 24). The next contention level will emerge at 11.8275 (100-hour EMA). The additional downside filter is located at 11.7375 (a low of August 15).
On the upside, the 50-hour EMA at 11.8752 acts as an immediate resistance level for the cross, en route to 11.9235 (a high of August 24). The next upside stop to watch is 11.9500 (a high of July 7). The key barrier for EUR/SEK is located at 11.9625, representing a Year-To-Date (YTD) high. Any meaningful follow-through buying above the latter will see a rally to the next critical area at 12.00. The mentioned level portrays a psychological round figure and the upper boundary of the ascending trend-channel.
It’s worth noting that the Relative Strength Index (RSI) stands in bearish territory below 50, indicating the path of least resistance seems lower for now.
EUR/SEK four-hour chart
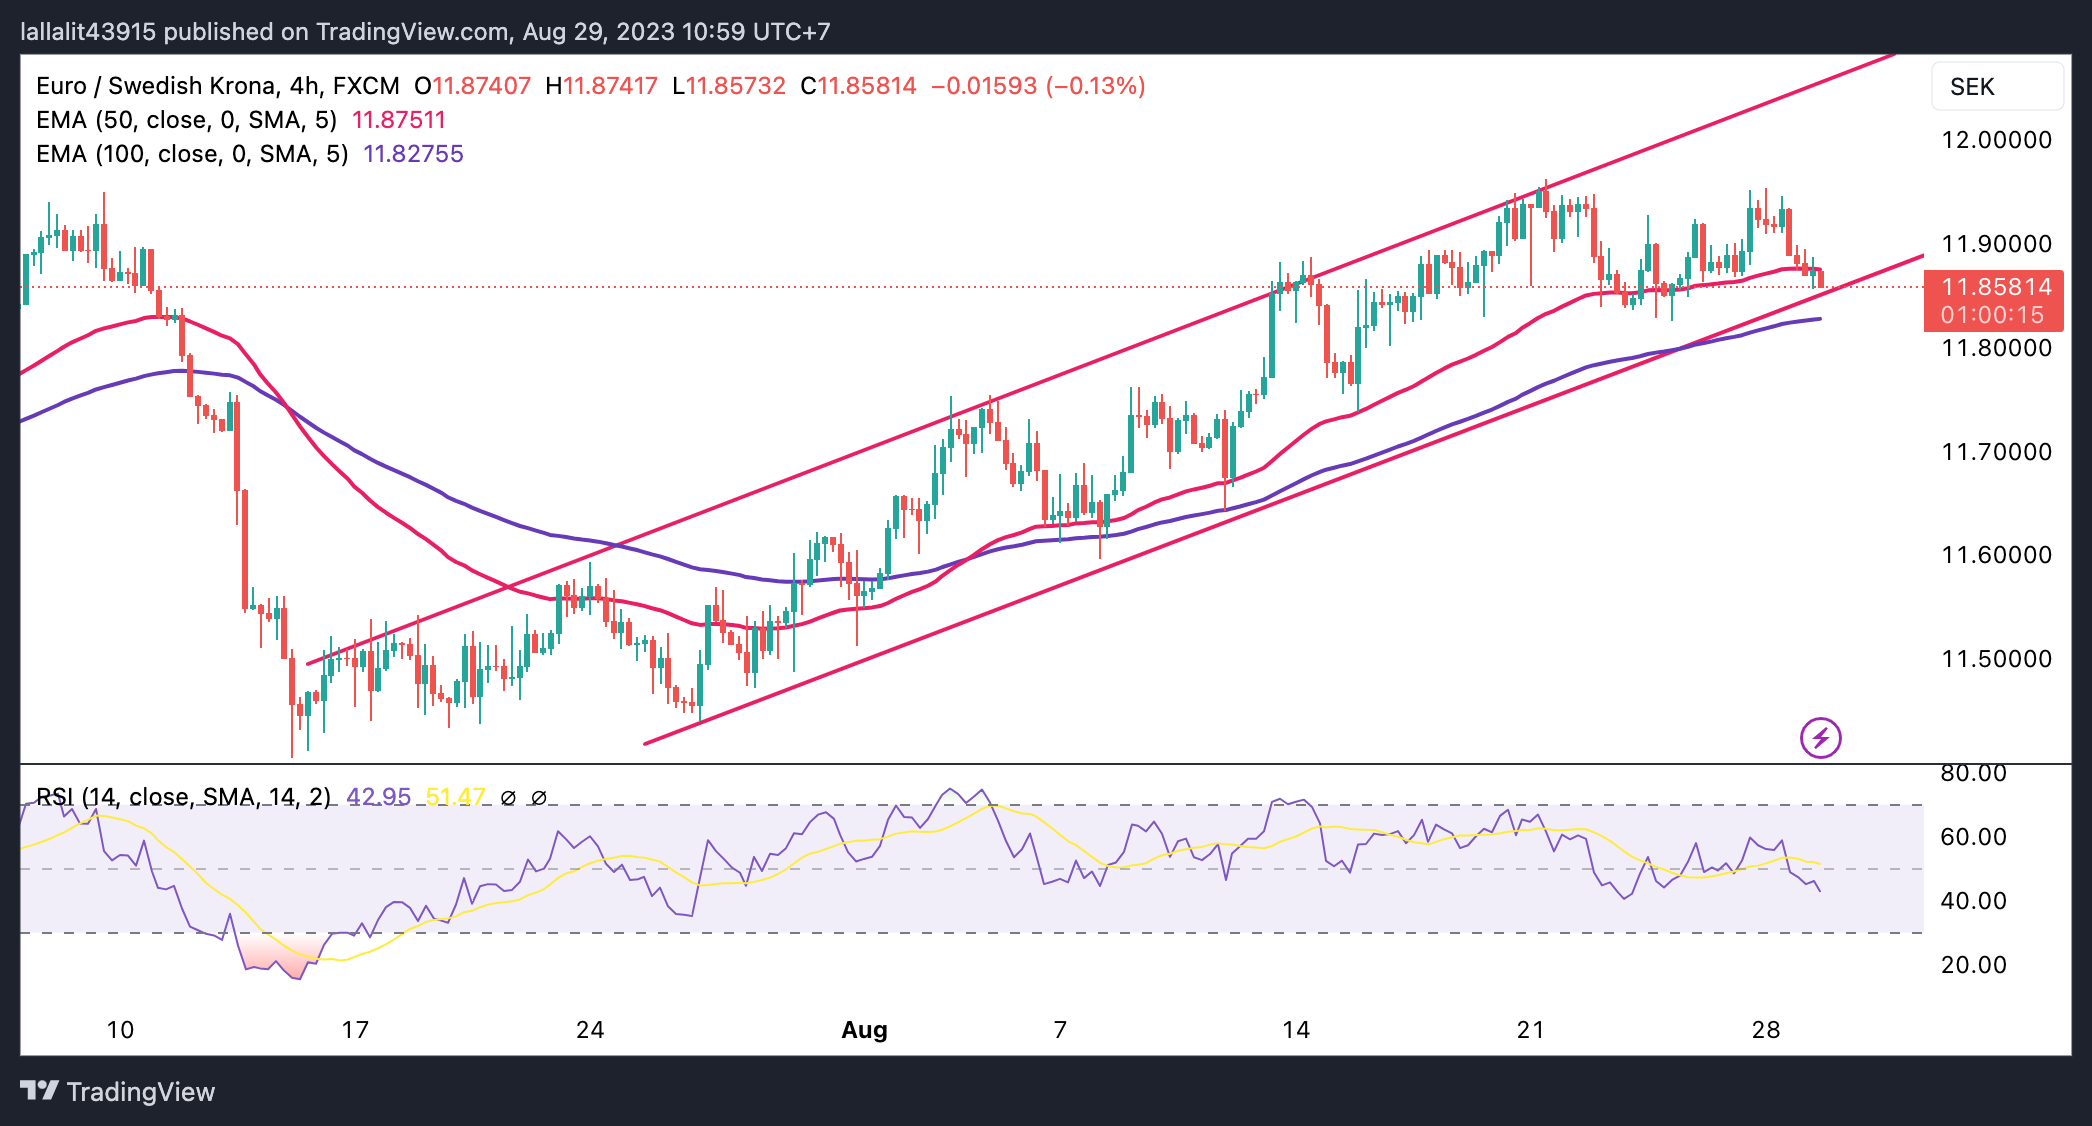
- EUR/USD moves away from over a two-month low and is supported by a modest USD downtick.
- Retreating US bond yields and a positive risk tone turn out to be key factors weighing on the buck.
- The fundamental backdrop warrants some caution for bulls and before positioning for further gains.
The EUR/USD pair gains some positive traction for the second straight day on Tuesday and recovers further from its lowest level since June 13, around the 1.0765 region touched last week. Spot prices trade around the 1.0835 area during the Asian session, up over 0.15% for the day, though the fundamental backdrop warrants some caution before positioning for any further appreciating move.
A further pullback in the US Treasury bond yields, along with a generally positive risk tone, drags the safe-haven US Dollar (USD) away from a nearly three-month top set last week, which, in turn, is seen acting as a tailwind for the EUR/USD pair. Adding to this, European Central Bank (ECB) President Christine Lagarde's hawkish remarks on Friday, saying that interest rates will need to stay high as long as necessary to slow still-high inflation, contributes to the bid tone surrounding the Euro.
That said, speculations have been mounting that the ECB will halt its rate-hiking cycle sooner rather than later, especially after the flash PMIs showed that business activity in the Euro Zone declined more than expected in August and revived recession fears. Adding to this, the possibility of more interest rate hikes by the Federal Reserve (Fed) should act as a tailwind for the US bond yields and limit the USD losses. This warrants caution before placing bullish bets around the EUR/USD pair.
It is worth recalling that Fed Chair Jerome Powell, during his scheduled speech at the Jackson Hole Symposium, said on Friday that inflation remains too high and that the central bank is ready to continue hiking rates to tame persistently high prices. Furthermore, a resilient US economy could force the Fed to stick to its hawkish stance. The expectations had pushed the yield on the benchmark 10-year US government bond to its highest level since November 2007 last week and favour the USD bulls.
The aforementioned fundamental backdrop makes it prudent to wait for strong follow-through buying before confirming that the EUR/USD pair has bottomed out in the near term and positioning for any further gains. Market participants now look to the US economic docket, featuring the release of the Conference Board's Consumer Confidence Index and JOLTS Job Openings data, for short-term trading impetus later during the early North America this Tuesday.
Technical levels to watch
- USD/JPY prints the first daily loss in four despite lacking downside momentum of late.
- Japan government report cites 'inflection point' in 25-year battle with deflation, teases BoJ hawks amid softer yields.
- Downbeat Japan employment data, mixed concerns about inflation keep Yen pair buyers hopeful.
- US CB Consumer Confidence, yields eyed for fresh impulse.
USD/JPY bears flex muscles around 146.40 while printing the first intraday loss, down 0.10% on a day, heading into Tuesday’s European session. In doing so, the Yen pair justifies the recent shift in the bias toward the Bank of Japan (BoJ), as well as the inflation conditions of Japan. However, downbeat concerns about Japan’s employment situations and the cautious mood ahead of the top-tier data/events prod the Yen pair sellers.
That said, Japan’s Unemployment Rate offered a surprise increase to 2.7% for July versus 2.5% expected and prior while the Jobs / Applicants Ratio eased to 1.29 for the said month versus 1.30 anticipated and previous readings.
More importantly, the Japanese government recently released its annual report suggesting the inflection point for the inflation conditions in Japan after 25 years of efforts to overcome the deflation. As a result, the hawkish bias about the BoJ gains momentum.
On Monday, the mixed details of Japan’s Coincident Index for June and the Leading Economic Index for the said month also prod the USD/JPY pair traders. It’s worth noting that BoJ Governor Kazuo Ueda cited a bit below target Japan inflation to defend the currently ultra-easy monetary policy at the Jackson Hole Symposium, which in turn prods the pair sellers.
Elsewhere, downbeat yields join the broad US Dollar weakness ahead of today’s US CB Consumer Confidence for August to weigh on the USD/JPY price.
US 10-year Treasury bond yields remain pressured around 4.19% while the US Dollar Index (DXY) also drops to 103.85 by the press time. It’s worth noting that the US two-year bond coupons reversed from the highest level since 2007 the previous day and remained depressed near 5.00% by the press time.
On the contrary, Goldman Sachs highlights the US growth outlook and BoJ’s defense of easy-money policy to forecast a 30-year high of around 155.00, versus 135.00 previous prediction, for the USD/JPY pair.
Looking ahead, concerns about the monetary policies of the Federal Reserve (Fed) and the BoJ will join the risk catalysts to entertain the USD/JPY traders before the US Conference Board’s (CB) Consumer Confidence Index for August, expected at 116.2 versus prior 117.00.
Technical Analysis
The nearly overbought RSI (14) line joins the failure to cross a two-month-old ascending resistance line, close to 146.80 at the latest, to suggest a pullback in the USD/JPY price towards the 144.60-50 support zone comprising multiple levels marked since April.
- USD/CNH lacks any firm intraday direction and remains confined in a range on Tuesday.
- A sustained break and acceptance below 7.2700 will pave the way for additional losses.
- Bulls need to wait for a move beyond the 7.3000 before positioning for any further upside.
The USD/CNH pair struggles to gain any meaningful traction on Tuesday and oscillates in a narrow band, around the 7.2900 mark through the Asian session.
The People's Bank of China (PBoC) has been persistently setting stronger-than-expected daily-mid-points for the Chinese Yuan, which, along with a modest US Dollar (USD) weakness, act as a headwind for the USD/CNH pair. The downside, however, remains cushioned in the wake of growing worries about the worsening economic conditions in China. Apart from this, expectations that the Federal Reserve (Fed) will keep interest rates higher for longer favour the USD bulls and suggest that the path of least hurdle for spot prices is to the upside.
From a technical perspective, the USD/CNH pair has been showing some resilience below the 7.2700 round figure since early last week. Hence, acceptance below the said level might prompt some technical selling and pave the way for an extension of the recent pullback from the highest level since April 2022, around the 7.3500 touched earlier this month. Spot prices might then turn vulnerable to accelerate the downward trajectory towards testing the next relevant support near the 7.2300 area en route to the 7.2200-7.2180 region and the 7.2100.
On the flip side, bulls might now wait for a sustained strength beyond the 7.3000-7.3050 region before placing fresh bets, above which the USD/CNH pair could aim to challenge the 7.3355 supply zone. Some follow-through buying beyond the YTD peak will be seen as a fresh trigger for bullish traders and expose the 2022 swing high, around the 7.3750 region with some intermediate resistance near the 7.3600.
USD/CNH daily chart
-638288755811218643.png)
Technical levels to watch
- USD/CAD stays pressured while justifying Monday’s bearish Doji, reversal from key resistance line.
- Looming bear cross on MACD, overbought RSI also suggest Loonie pair’s pullback.
- Three-week-old rising support line restricts immediate downside ahead of 200-DMA.
- Bulls need validation from tops marked in May, April for retaking control.
USD/CAD remains on the back foot around 1.3600 after reversing from a three-month high the last week, not to forget the previous day’s U-turn from an important resistance line. That said, the Loonie pair teases bears around the intraday low of 1.3590 during early Tuesday morning in Europe.
In doing so, the Loonie pair not only defends the previous day’s U-turn from a four-month-old resistance line but also justifies the overbought RSI (14) line and the impending bear cross on the MACD indicator. Additionally luring the USD/CAD sellers is the previous day’s Doji candlestick on the Daily chart.
With this, the Loonie pair appears all set to decline towards an upward-sloping support line from August 04, close to 1.3550 by the press time. However, the 200-DMA level of 1.3460 will challenge the USD/CAD pair’s further downside.
Also acting as the downside filter is the previous monthly high of near 1.3385 and May’s bottom surrounding 1.3315.
On the flip side, a daily closing beyond the aforementioned resistance line stretched from late April, around 1.3615, becomes necessary to convince the USD/CAD buyers.
Even so, the tops marked in May and April, near 1.3655 and 1.3670 in that order, will challenge the bulls before giving them control.
It’s worth mentioning that the latest rebound in the Oil price, Canada’s key export item joins the US Dollar’s retreat ahead of the CB Consumer Confidence data for August to weigh on the USD/CAD pair of late.
USD/CAD: Daily chart
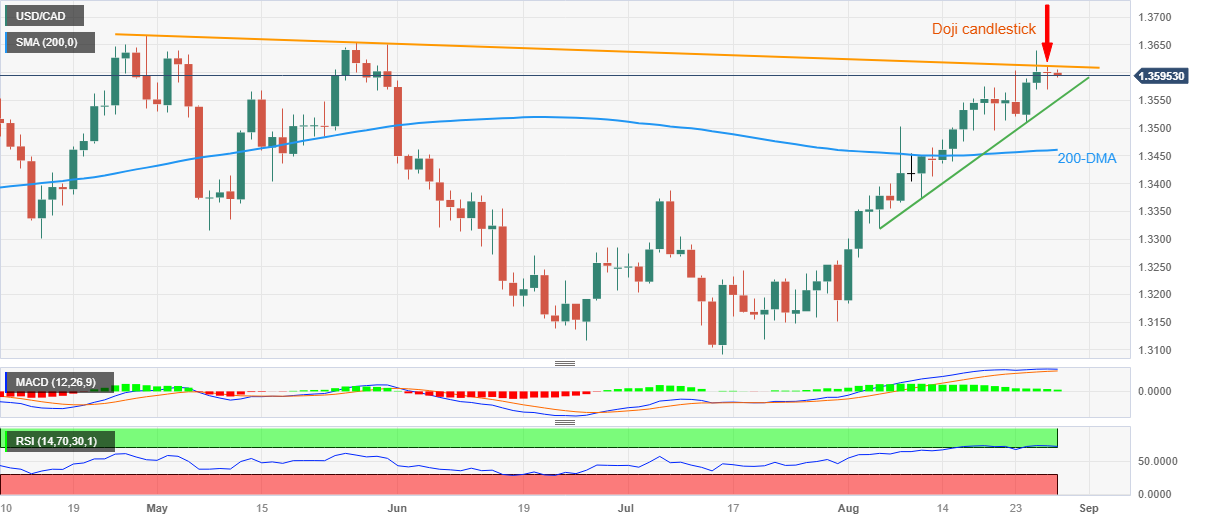
Trend: Further downside expected
- Market sentiment remains dicey as economic calendar braces for top-tier catalysts.
- S&P500 Futures struggle to defend two-day winning streak, yields remain pressured.
- US Dollar holds lower grounds and helps commodities, Antipodeans to grind higher.
- US CB Consumer Confidence will entertain intraday traders ahead of key inflation, employment data.
The risk appetite dwindles during early Tuesday, after an optimistic start of the week, as traders seek more clues to defend the previously firmer sentiment, especially amid a light calendar in Asia and a few macro headlines to track.
While portraying the mood, the S&P 500 Futures lack clear directions around 4,445 after rising in the last two consecutive days whereas the US 10-year Treasury bond yields remain pressured around 4.19% by the press time. It’s worth noting that the US two-year bond coupons reversed from the highest level since 2007 the previous day and remained depressed near 5.00% by the press time.
Headlines suggesting challenges for the global central bankers, due to the mixed data and looming recession woes, keep traders on their toes after the policymakers defended their respective hawkish practices at the last week’s Jackson Hole Symposium.
Notable among them was Fed Chair Jerome Powell who showed readiness for rate hikes while pushing back rate cut bias. However, Powell’s speech also highlighted the data dependency and hence increased the importance of the incoming statistics, as well as amplified uncertainty about the US central bank’s next moves. Alternatively, Cleveland Fed Bank President Loretta Mester favored a rate hike, even if not in September, while the odds of witnessing an increase in the Fed rate in November improved of late, per the CME’s FedWatch Tool.
Elsewhere, the mixed updates about the US-China trade talks in Beijing join the International Monetary Fund (IMF) Director Kristalina Georgieva’s readiness to visit the senior leaders of China’s Communist Party prod the risk appetite.
On Monday, China’s halving of the stamp duty on stocks trading joined a Wall Street Journal (WSJ) piece suggesting Chinese Communist Party Chairman Xi Jinping’s indirect push for stimulus to favor market sentiment. On the same line were the global policymakers’ inabilities to please markets with a major hawkish surprise during the annual Jackson Hole Symposium.
Against this backdrop, the US Dollar Index (DXY) remains on the back foot around 103.95 by the press time, after reversing from an 11-week high to snap a two-day winning streak the previous day. That said, the Gold Price joins the AUD/USD and NZD/USD to print mild gains at the latest. It’s worth noting that the market’s indecision prods the Oil price after a three-day uptrend.
Moving on, Germany’s GfK Consumer Confidence Survey for September will become the immediate catalyst for the traders ahead of the US Conference Board’s (CB) Consumer Confidence Index for August, expected at 116.2 versus prior 117.00. However, major attention will be given to the Fed’s preferred inflation gauge, namely the US Core Personal Consumption Expenditure (PCE) Price Index for July and Nonfarm Payrolls (NFP) for August.
Also read: Forex Today: US Dollar weakens slightly as risk sentiment improves
| Raw materials | Closed | Change, % |
|---|---|---|
| Silver | 24.222 | -0 |
| Gold | 1920.036 | 0.22 |
| Palladium | 1244.8 | 1.24 |
- AUD/USD trades higher around 0.6440 on the back of improved Australia’s Retail Sales.
- 10-year US bond yield declined to 4.18%; Greenback experiences losses.
- The stability of China's economy could underpin the Aussie pair.
AUD/USD continues its winning streak for the second consecutive day, trading around 0.6440 during the Asian session on Tuesday. The US Dollar (USD) weakened due to the decline in US Treasury yields, coupled with the rise in stocks across the United States (US) and Europe.
Additionally, upbeat macroeconomic data from Australia released on Tuesday provided support for the AUD/USD pair. As said, the monthly Retail Sales s.a. improved to 0.5% in July, against the expected rise of 0.3% from the previous figure of 0.8% decline.
The US Dollar Index (DXY), which measures the performance of Greenback against the six other major currencies, extends its losses and trades around 103.90. The 10-year US Treasury yield declined to 4.18%, eroding the strength of the US Dollar (USD) as a sense of caution prevails. The market participants will now look at data releases from the US, including Jolts Job Openings, Housing Price Index and Consumer Confidence are due to be released later in the day.
The positive sentiment resulting from China's stimulus measures is providing support to the Australian Dollar (AUD) due to the close trading partnership between the two nations. The stability of China's economy has the potential to enhance Australian exports to the country, contributing to the strength of the Aussie pair. Beijing reduced the stamp duty on stock trading by 0.1%. Moreover, the AUD/USD traders are also observing the trip of US Commerce Secretary Gina Raimondo to China, aimed at enhancing trade ties between the United States and China.
Investors are expected to closely monitor upcoming economic data releases, including the US Core Personal Consumption Expenditures (PCE) Index, weekly Jobless Claims, and Nonfarm Payrolls throughout the week. Likewise, Australia's Monthly Consumer Price Index will also be of significance. These data releases are anticipated to provide valuable perspectives on the economic trajectories of both nations, potentially impacting trading choices related to the AUD/USD pair.
- AUD/JPY reverses an Asian session dip to the 94.00 mark, albeit lacks follow-through.
- The optimism over new measures from China continues to lend support to the Aussie.
- Intervention fears, looming recession risks benefit the JPY and cap gains for the cross.
The AUD/JPY cross attracts some dip-buying in the vicinity of the 94.00 mark during the Asian session on Tuesday and turns positive for the third successive day. Spot prices currently trade around the 94.25-94.30 region, or a two-week peak and now look to build on the recent bounce from the 100-day Simple Moving Average (SMA).
The Australian Dollar (AUD) continues to draw support from the latest optimism led by new measures rolled out by China over the weekend, which boosted investors' confidence. It is worth recalling that China's finance ministry took steps to draw investors back into its battered stock markets and announced on Sunday that the levy charged on stock trading will drop from 0.1% to 0.05% from August 28 – marking the first reduction since 2008. This remains supportive of a generally positive risk tone, which, in turn, is seen acting as a tailwind for the AUD/JPY cross.
Apart from this, a more dovish stance adopted by the Bank of Japan (BoJ) contributes to the Japanese Yen's underperformance and lends some support to spot prices. In fact, the BoJ is the only central bank in the world to maintain negative rates and is expected to stick to its ultra-easy monetary policy settings. The bets were reaffirmed by BoJ Governor Kazuo Ueda's remarks at the Jackson Hole Symposium on Sunday, saying that the underlying inflation in Japan remains a bit below the 2% target, ensuring that the central bank may keep the status quo until next summer.
That said, speculations that Japanese authorities will intervene in the foreign exchange markets to prop up the domestic currency hold back traders from placing aggressive bullish bets around the AUD/JPY cross. Furthermore, concerns about the worsening economic conditions in China also contribute to keeping a lid on any meaningful appreciating move for the China-proxy Aussie. This, along with expectations for another on-hold rate decision by the Reserve Bank of Australia (RBA) in September, warrants caution before positioning for any meaningful appreciating move.
Technical levels to watch
Japanese Finance Minister Shunichi Suzuki said on Tuesday, the government “will consider economic measures to be adopted after September.”
He said that he doesn’t want to comment on the extra budget at this stage.
Related reads
- Japan’s Government: Inflation is at 'inflection point', must work closely with BoJ
- USD/JPY trades with modest losses around 146.35-30 area, just below YTD peak
- USD/CHF takes offers to extend Friday’s retreat from seven-week high to print two-day losing streak.
- Upbeat oscillators, key support keeps Swiss Franc pair buyers hopeful despite latest U-turn from multi-month-old resistance line.
- Convergence of 50-DMA, rising trend line from mid-July appears a tough nut to crack for bears.
- US CB Consumer Confidence eyed for clear directions as Fed Powell’s speech highlighted data dependency for future policy moves.
USD/CHF remains on the back foot for the second consecutive day, down 0.12% intraday around 0.8825 amid the early Tuesday morning in Europe. In doing so, the Swiss Franc (CHF) pair stretches last week’s U-turn from a downward-sloping resistance line from March 08.
It’s worth noting that the broadly weaker US Dollar and the cautious mood ahead of the US Conference Board’s (CB) Consumer Confidence Index for August, expected at 116.2 versus the prior 117.00, exert downside pressure on the pair after it reversed from the key resistance line.
However, the upbeat RSI (14) line and the bullish MACD signals join the quote’s sustained trading beyond the 0.8790 support confluence to keep the buyers hopeful.
That said, the 50-DMA and a six-week-long rising trend line together constitute the 0.8790 hurdle toward the south.
In a case where the USD/CHF breaks the 0.8790 support, the odds of witnessing a quick slump towards refreshing the monthly low, currently around 0.8690, can’t be ruled out.
On the flip side, a clear upside break of the aforementioned multi-month-old resistance line, close to 0.8840 by the press time, needs validation from the monthly peak of 0.8865 and June’s low of 0.8901 to convince the USD/CHF pair buyers.
USD/CHF: Daily chart
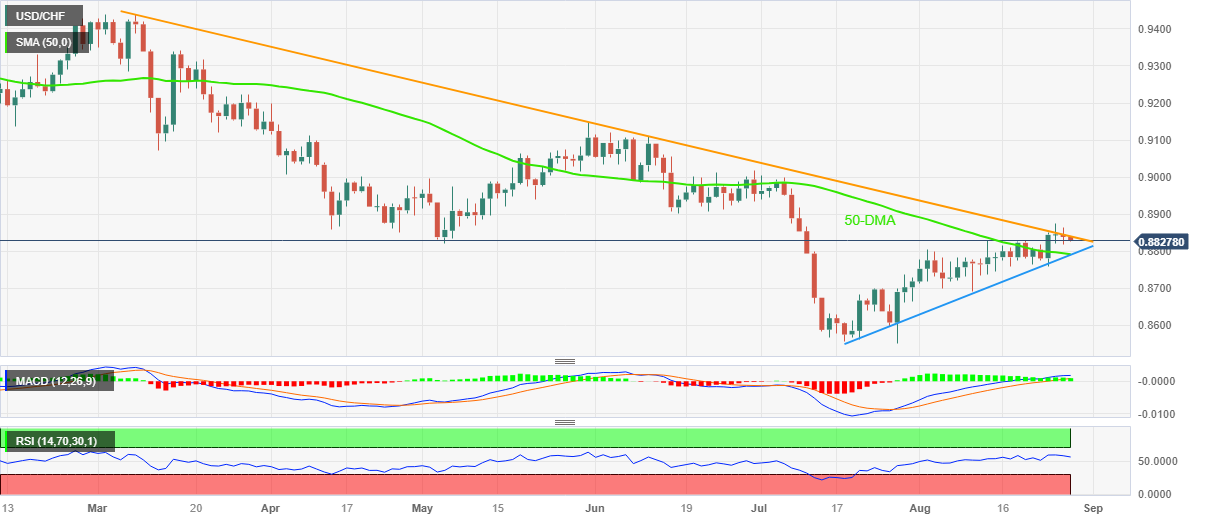
Trend: Limited downside expected
- EUR/JPY gains momentum for four straight days above the 158.50 mark.
- Japanese Unemployment Rate rose to 2.7% in July versus 2.5% in the previous month.
- Investors will focus on German Consumer Price Index (CPI), Eurozone CPI, ECB meeting minutes.
The EUR/JPY cross extends its upside and trades in positive territory for the fourth consecutive day during the early Asian session on Tuesday. The cross currently trades around 158.60, gaining 0.04% on the day. A rise in the Japanese Unemployment Rate and the hawkish comments from European Central Bank (ECB) policymakers exert some pressure on the JPY.
On Monday, French Finance Minister Bruno Le Maire denied cutting interest rates in the near future. The policymaker added that they need to see inflation pressure in the services sector. Meanwhile, European Central Bank (ECB) policymaker Joachim Nagel said that he was unable to tell whether the ECB should raise interest rates at its September meeting.
Apart from this, ECB President Christine Lagarde stated at the Jackson Hole Symposium that the battle against inflation is not yet won. She emphasized the importance of central banks providing an economic nominal anchor and ensuring price stability while setting interest rates at restrictive levels for as long as it takes to achieve inflation to the ECB's medium-term target of 2%. The ECB’s hawkish stance boosts the Euro and acts as a tailwind for the EUR/JPY cross.
The latest data released by the Japan Statistics Bureau revealed that the nation’s Unemployment Rate rose to 2.7% in July versus 2.5% in the previous month and expected. The figure rose for the first time in four months and exerted pressure on the Bank of Japan (BoJ) and the government.
Governor Kazuo Ueda of the BoJ stated at a Federal Reserve symposium on Saturday that the central bank considers underlying inflation to be below its objective and will therefore maintain the current ultra-loose monetary policy framework. Policymakers stated that domestic demand remained robust and company fixed investment was sustained by record high profits. That said, the divergence in monetary between the ECB and the Bank of Japan (BoJ) might cap the upside in the Japanese Yen against its rivals,
Moving on, market participants will monitor the top-tier data from the Eurozone for fresh impetus. The German Consumer Price Index (CPI) data will be released on Wednesday, followed by the German Retail Sales and Eurozone CPI data due on Thursday. Furthermore, the ECB will release its meeting minutes on Thursday. On the Japanese docket, the Consumer Confidence Index for August, Industrial Production, and Retail Sales will be due later this week.
in its annual economic white paper presented on Monday, the Japanese government said, "Japan has seen price and wage rises broaden since the spring of 2022,” adding that “such changes suggest the economy is reaching a turning point in its 25-year battle with deflation.”
"We shouldn't dismiss the fact a window of opportunity may be opening to exit deflation," as inflation perks up and public perceptions about persistent price declines abate,” the report said.
Further, it mentioned that "In determining the trend of inflation, it's important to look at services prices" as they reflect domestic demand and wages more vividly than goods prices.”
Finally, the report concluded that the government must work closely with the Bank of Japan (BoJ) to achieve sustained wage growth.
- GBP/USD attracts buyers for the second successive day and draws support from a softer USD.
- A further pullback in the US bond yields and a positive risk tone undermine the safe-haven buck.
- Bets for more Fed rate hikes should act as a tailwind for the US bond yields and the Greenback.
The GBP/USD pair gains some positive traction for the second successive day on Tuesday and recovers further from its lowest level since June 13, around the 1.2550-1.2545 area touched last week. Spot prices trade around the 1.2620-1.2625 zone during the Asian session, up over 0.15% for the day, though remain below the 100-day Simple Moving Average (SMA) support breakpoint.
Retreating US Treasury bond yields drags the US Dollar (USD) away from a nearly three-month top set last week, which, in turn, is seen as a key factor pushing the GBP/USD pair higher. Apart from this, a generally positive risk tone, bolstered by new measures rolled out by China over the weekend to draw investors back into its battered stock markets, further undermines the safe-haven Greenback. The British Pound (GBP), on the other hand, draws support from the Bank of England (BoE) Deputy Governor Ben Broadbent's hawkish remarks on Saturday, saying that policy rates may well have to remain in restrictive territory for some time.
That said, the possibility of more interest rate hikes by the Federal Reserve (Fed) should act as a tailwind for the US bond yields and help limit any meaningful USD downfall, at least for now. In fact, Fed Chair Jerome Powell said on Friday that inflation remains too high and that the central bank is ready to continue hiking rates to tame persistently high prices. Furthermore, a surprisingly resilient US economy could force the Fed to keep interest rates higher for longer. The expectations had pushed the yield on the benchmark 10-year US government bond to its highest level since November 2007 last week and favour the USD bulls.
Apart from this, growing acceptance that the Bank of England (BoE) will pause its rate-hiking cycle after the widely anticipated 25 bps lift-off at the September meeting might further contribute to capping the GBP/USD pair. Hence, it will be prudent to wait for strong follow-through buying before confirming that the recent downward trajectory witnessed over the past six weeks or so has run its course and positioning for any meaningful appreciating move. Traders now look to the US economic docket, featuring the Conference Board's Consumer Confidence Index and JOLTS Job Openings data, for some impetus later this Tuesday.
Technical levels to watch
- Natural Gas Price pares intraday loss during four-day winning streak around weekly top.
- Hopes of more energy demand due to weather forecasts, tropical storm Idalia and supply crunch fears fuel XNG/USD price.
- Softer US Dollar, cautious optimism also underpin XNG/USD run-up.
- Risk catalysts eyed for clear directions, US Dollar moves will be crucial to watch.
Natural Gas Price (XNG/USD) remains firmer for the fourth consecutive day around $2.80 amid early Tuesday morning in Europe, despite the late Monday’s retreat from a fortnight high.
The XNG/USD pair’s latest run-up could be linked to the likely improvement in the energy demand amid fierce weather forecasts in the US, as well as expectations of witnessing a supply crunch due to tropical storm Idalia. Adding strength to the XNG/USD upside could be the fears of witnessing a strike at the US energy major Chevron's Liquefied Natural Gas (LNG) export plants in Australia.
Elsewhere, Reuters cites the data provider Refinitiv to mention that average gas output in the lower 48 US states eased to 101.7 billion cubic feet per day (bcfd) so far in August, down from 101.8 bcfd in July. That compares with a monthly record of 102.2 bcfd in May.
It should be noted that the recent hopes of witnessing more stimulus from China and a pullback in the US Dollar Index (DXY) also propel the Natural Gas Price. China’s halving of the stamp duty on stocks trading joined a Wall Street Journal (WSJ) piece suggesting Chinese Communist Party Chairman Xi Jinping’s indirect push for stimulus to favor market sentiment and offered additional negatives for the US Dollar Index.
Against this backdrop, Wall Street closed on the green side for the second consecutive day while the US 10-year Treasury bond yields dropped three basis points (bps) to 4.20% and the two-year counterpart declined half a percent to 5.5% at the latest. That said, the US 10-year Treasury bond yields remain pressured near 4.19% by the press time whereas the S&P 500 Futures lack clear directions as we write.
Looking ahead, headlines about the energy market and the aforementioned risk catalysts Will direct the Natural Gas Price.
Technical analysis
A clear upside break of a three-week-old previous resistance line, now support around $2.60, keeps the Natural Gas buyers hopeful.
- NZD/USD consolidates around 0.5910 ahead of the releases of US macroeconomic data.
- The pullback in US Treasury yields undermined the US Dollar (USD).
- China-linked optimism is reinforcing the NZD/USD pair.
NZD/USD treads water near 0.5910 to continue its winning streak, during the Asian session on Tuesday. The pair strengthened due to the retreating US Dollar (USD), following the gains in stocks from the United States (US) and Europe amid US Treasury yields dipped.
The US Dollar Index (DXY), which tracks the Greenback against a basket of currencies, trades lower around 103.95 ahead of the US data releases. These datasets include Jolts Job Openings, Housing Price Index and Consumer Confidence later in the North American session.
Furthermore, the pullback in US Treasury yields is undermining the US Dollar (USD) due to the cautious mood after the US Federal Reserve (Fed) Chairman Jerome Powell advocated for supporting "higher for longer" interest rates at the Jackson Hole Symposium.
Positive sentiment linked to China is bolstering the NZD/USD pair, driven by Beijing's implementation of fiscal measures to stimulate its economy. During the weekend, Chinese authorities decided to lower the stamp duty on stock trading by 0.1%. Moreover, investors’ attention is currently focused on the four-day trip of US Commerce Secretary Gina Raimondo to Beijing, aimed at strengthening commercial relationships between the United States and China.
The market participants will also likely monitor the other top-tier economic data releases including the US Core Personal Consumption Expenditures (PCE) Index, weekly Jobless Claims and Nonfarm Payrolls during the week. On the other side, New Zealand’s Building Permits and ANZ – Roy Morgan Consumer Confidence are due to be released as well. These data releases are expected to offer valuable insights into the economic outlook of both countries, potentially influencing trading decisions involving the NZD/USD pair.
- Gold edges higher for the second straight day and remains close to over a two-week peak.
- Retreating US bond yields undermines the US Dollar and lends some support to the metal.
- Bets for more rate hikes by the Federal Reserve might keep a lid on any meaningful gains.
Gold price attracts some buying for the second successive day on Tuesday and remains well within the striking distance of over a two-week high touched the previous day. The XAU/USD trades above the $1,920 level during the Asian session and draws support from a modest US Dollar (USD) downtick.
In fact, the USD Index (DXY), which tracks the Greenback against a basket of currencies, retreats further from its highest level since June 1 set on Friday and is seen as a key factor lending support to the Gold price. The USD downtick could be attributed to a further pullback in the US Treasury bond yields, though the possibility of more interest rate hikes by the Federal Reserve (Fed) should help limit any meaningful decline. In fact, Fed Chair Jerome Powell, in a keynote address at the Jackson Hole Symposium, said on Friday, that inflation remains too high and that the central bank is ready to continue hiking rates to tame persistently high prices.
Apart from sticky inflation, a surprisingly resilient US economy could force the Fed to keep interest rates higher for longer. The expectations had pushed the yield on the benchmark 10-year US government bond to its highest level since November 2007 last week and should continue to act as a tailwind for the USD. This, along with a positive risk tone, bolstered by new measures rolled out by China over the weekend to draw investors back into its battered stock markets, should contribute to capping the safe-haven Gold price. This, in turn, warrants some caution before positioning for any further appreciating move for the XAU/USD.
The downside, meanwhile, seems cushioned, at least for the time being, in the wake of worries about a deeper global economic downturn, particularly in China, which tends to benefit the traditional safe-haven Gold price. Hence, the market focus will remain glued to this week's release of Chinese PMI prints for August. Apart from this, investors will take cues from important US macro data scheduled at the beginning of a new month, including the closely-watched Non-Farm Payrolls (NFP) report. This, in turn, will provide some meaningful impetus and help in determining the next leg of a directional move for the precious metal.
Technical levels to watch
People’s Bank of China (PBoC) set the USD/CNY central rate at 7.1851 on Tuesday, versus the previous fix of 7.1856 and market expectations of 7.2854. It's worth noting that the USD/CNY closed near 7.2900 the previous day.
Apart from the USD/CNY fix, the PBoC also unveiled details of its Open Market Operations (OMO) while saying that the Chinese central bank injects 385 billion Yuan via 7-day reverse repos (RRs) at 1.80% vs. prior 1.80%.
However, with the 111 billion Yuan of RRs maturing today, there prevails a net injection of around 274 billion Yuan on the day in OMO.
About PBOC fix
China maintains strict control of the yuan’s rate on the mainland.
The onshore yuan (CNY) differs from the offshore one (CNH) in trading restrictions, this last one is not as tightly controlled.
Each morning, the People’s Bank of China (PBOC) sets a so-called daily midpoint fix, based on the yuan’s previous day's closing level and quotations taken from the inter-bank dealer.
Goldman Sachs (GS) strategist Kamakshya Trivedi flags fears of witnessing the USD/JPY pair’s rally towards the levels last seen in 1990 during its latest analytical piece, shared by Bloomberg.
The GS Analyst highlights the Bank of Japan’s (BoJ) hesitance in lifting the rates and the US growth outlook as the key catalysts to revise its six-month USD/JPY forecast to 155.00 from 135.00 prior.
Key quotes
As long as the BOJ remains far from hiking rates and equities stay reasonably well supported, the yen should continue to trend weaker.
The main risk to this forecast of more yen weakness over the next six months is that higher inflation and currency depreciation prove more unpopular and catalyze more forceful responses in the form of currency intervention or an earlier hawkish shift from the BOJ, or both.
USD/JPY retreats
The note fails to gain applause as the USD/JPY pair snaps a three-day winning streak while retreating from the highest level since November 2022 to 146.35 by the press time, down 0.10% intraday.
Also read: USD/JPY trades with modest losses around 146.35-30 area, just below YTD peak
- EUR/USD remains lackluster after bouncing off 5.5-month-old rising support line, reverses from intraday high of late.
- Receding bearish bias of MACD, nearly oversold RSI suggests further recovery of bloc’s currency.
- Convergence of 10-DMA, fortnight-old resistance guards immediate upside ahead of 1.0910 hurdle.
- Euro bears need validation from 1.0750 to retake control.
EUR/USD reverses from intraday high despite lacking upside momentum during very early Tuesday morning in Europe. Even so, the Euro pair remains on the bull’s radar while flashing 1.0825 as a quote by the press time, as it defends the previous day’s U-turn from an upward-sloping support line from March 15.
Apart from the U-turn from an important support line, the receding bearish bias of the MACD signals and the nearly oversold RSI (14) line also keeps Euro buyers hopeful as they await Germany’s GfK Consumer Confidence Survey for September, expected -24.3 versus -24.4 prior. Following that, the US Conference Board’s (CB) Consumer Confidence Index for August, expected at 116.2 versus prior 117.00, will entertain the intraday traders of the pair.
Also read: EUR/USD: Euro bulls approach 1.0850 as US Dollar traces softer yields, focus on German/US statistics
It’s worth noting that a convergence of the 10-DMA and a 13-day-long falling trend line guards immediate recovery of the EUR/USD pair near 1.0850.
Following that, the 21-DMA and a descending resistance line from July 18, close to 1.0910, will be the last defense of the Euro bears.
Alternatively, the EUR/USD sellers need a daily closing beneath the previously stated key support line, around 1.0770 by the press time.
Even so, a horizontal support zone comprising multiple levels marked since March 13, near 1.0765–50, appears a tough nut to crack for the pair.
To sum up, EUR/USD buyers remain hopeful but the upside needs a strong fundamental push to cross the sturdy hurdles.
EUR/USD: Daily chart
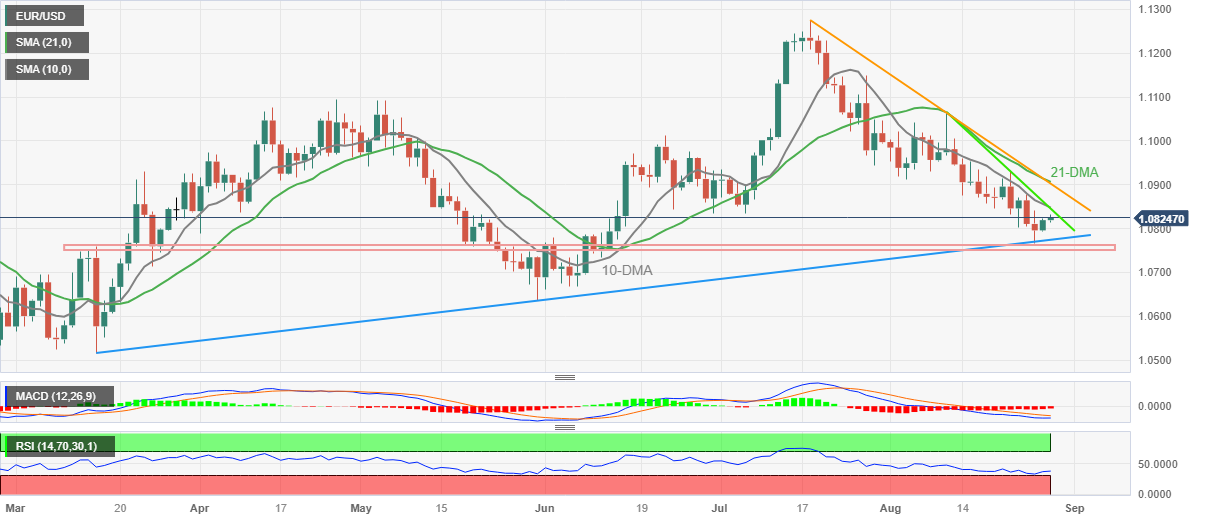
Trend: Limited upside expected
- WTI edges lower to $79.85 after retracing from $80.65 amid the fear of China's growth rate, potential US interest rate hikes.
- A tighter supply caused by Saudi Arabia and Russia's ongoing voluntary production curbs might support WTI price.
- Oil traders await the Chinese Manufacturing PMI, US Nonfarm Payrolls.
Western Texas Intermediate (WTI), the US crude oil benchmark, is trading around the $79.85 mark so far on Tuesday. WTI prices posts a modest gain after retreating from $80.68 as investors remained concerned about China's growth rate and further US interest rate hikes that could curtail oil demand.
The Fed's hawkish stance on potential rate hikes fuels concern in WTI prices. The Federal Reserve (Fed) Chairman Jerome Powell remarked on Friday that the central bank is prepared to raise interest rates further if necessary and that the next rate hike will be determined by data. Powell also said that the robust economic growth and tight labor market conditions could pave the way for the continuation of a tightening cycle. In turn, this may limit the upside potential for WTI prices, as higher interest rates could raise borrowing costs, slow the economy, and diminish oil demand.
Furthermore, the concern about the economic slowdown in China could weigh on WTI demand as China is the major oil importer in the world. Market players will keep an eye on the release of Chinese Caixin Manufacturing PMI for August. The weaker-than-expected data could exert some selling pressure on WTI further.
In the meantime, tighter supply due to Saudi Arabia and Russia's ongoing voluntary production cuts may support higher oil prices. Saudi Arabia has reportedly stated that it will maintain production at approximately 9 million barrels per day through September, a decrease of approximately 1 million barrels from August levels.
Looking ahead, oil traders will closely watch the Chinese Caixin Manufacturing PMI for August due on Friday. The figure is expected to rise from 49.2 to 49.3. The critical event will be the Nonfarm Payrolls (NFP) data on Friday. The events could significantly impact the USD-denominated WTI price. Oil traders will take cues from the data and find trading opportunities around the WTI prices.
- USD/JPY edges lower on Tuesday and snaps a three-day winning streak to the YTD peak.
- Retreating US bond yields keeps the USD bulls on the defensive and exerts some pressure.
- The divergent BoJ-Fed policy stance should help limit losses and warrants caution for bears.
The USD/JPY pair meets with some supply during the Asian session on Tuesday and moves away from its highest level since November 2022, around the 146.75 region touched the previous day. Spot prices currently trade around the 146.30-146.35 area, down nearly 0.15% for the day, and for now, seems to have snapped a three-day winning streak, though any meaningful corrective decline still seems elusive.
The US Dollar (USD) remains depressed for the second successive day and extends its pullback from a nearly three-month high set on Friday amid a further decline in the US Treasury bond yields. Apart from this, speculations that Japanese authorities will intervene in the foreign exchange markets to prop up the domestic currency exert some downward pressure on the USD/JPY pair. That said, a big divergence in the monetary policy stance adopted by the Bank of Japan (BoJ) and other major central banks, including the Federal Reserve (Fed) should act as a tailwind for the major.
It is worth recalling that the BoJ is the only central bank in the world to maintain negative rates and is expected to stick to its ultra-easy monetary policy settings. The bets were reaffirmed by BoJ Governor Kazuo Ueda's remarks at the Jackson Hole Symposium on Sunday, saying that the underlying inflation in Japan remains a bit below the 2% target. In contrast, Fed Chair Jerome Powell cemented expectations for one more 25 bps lift-off by the end of this year and said on Friday that the US central bank may need to raise interest rates further to cool still-too-high inflation.
Growing acceptance that the Fed will keep interest rates higher for longer should limit the downside for the US bond yields and support prospects for the emergence of some dip-buying around the USD. This makes it prudent to wait for strong follow-through selling before confirming that the USD/JPY pair has topped out in the near term and positioning for a further depreciating move. Traders now look to the US economic docket, featuring the release of the Conference Board's Consumer Confidence Index and JOLTS Job Openings data later during the early North American session.
Apart from this, the US bond yields will influence the USD price dynamics, which, along with the broader risk sentiment, which tends to drive demand for the safe-haven JPY, should contribute to producing short-term trading opportunities around the USD/JPY pair. The focus, however, will remain on this week's other important US macro data scheduled at the beginning of a new month, including the closely-watched monthly employment details – popularly known as the NFP report on Friday.
Technical levels to watch
- GBP/JPY struggles to extend two-day winning streak amid mixed concerns.
- Sluggish yields join downbeat UK inflation clues, Japan employment data to prod cross-currency traders.
- Buyers stay hopeful as UK markets open after a long weekend and can react to Jackson Hole, downbeat data at home.
- BoJ’s defense of ultra-easy policies, higher Japan Unemployment Rate prod pair’s upside amid inactive session.
GBP/JPY retreats from intraday high to 184.60 as it lacks upside momentum after a two-day winning streak amid mixed catalysts from the UK and Japan. Also probing the pair buyers are the downbeat US Treasury bond yields and cautious mood as the British traders return after Monday’s bank holiday.
Earlier in the day, the British Retail Consortium’s (BRC) annual shop price inflation slumped to the lowest level since October 2022 while flashing 6.9% mark for August, versus 7.6% reported in July.
On the other hand, Japan’s Unemployment Rate offered a surprise increase to 2.7% for July versus 2.5% expected and prior while the Jobs / Applicants Ratio eased to 1.29 for the said month versus 1.30 anticipated and previous readings.
Elsewhere, the US 10-year Treasury bond yields dropped three basis points (bps) to 4.20% and the two-year counterpart declined half a percent to 5.5% the previous day while extending last week’s pullback from the multi-month high. That said, the US 10-year Treasury bond yields remain pressured near 4.19% by the press time whereas the S&P 500 Futures lack clear directions as we write.
Further, the mixed details of Japan’s Coincident Index for June and the Leading Economic Index for the said month also prod the GBP/JPY pair traders. It’s worth noting that Bank of Japan (BoJ) Governor Kazuo Ueda cited a bit below target Japan inflation to defend the currently ultra-easy monetary policy at the Jackson Hole Symposium, which in turn keeps the pair buyers hopeful.
Looking ahead, the British traders’ return to the table and a reaction to last week’s hawkish bias of Bank of England (BoE) Deputy Governor Ben Broadbent will be important to watch. That said, BoE’s Broadbent cited the need for higher rates due to the wage pressure at the Jackson Hole Symposium, his economic outlook seems to challenge the hawks and the British Pound (GBP) optimists.
Technical analysis
Despite the latest inaction, a clear rebound from 21-DMA, around 184.00 by the press time, keeps the GBP/JPY buyers hopeful.
| Index | Change, points | Closed | Change, % |
|---|---|---|---|
| NIKKEI 225 | 545.71 | 32169.99 | 1.73 |
| Hang Seng | 174.36 | 18130.74 | 0.97 |
| KOSPI | 24.27 | 2543.41 | 0.96 |
| ASX 200 | 44.6 | 7159.8 | 0.63 |
| DAX | 160.79 | 15792.61 | 1.03 |
| CAC 40 | 95.11 | 7324.71 | 1.32 |
| Dow Jones | 213.08 | 34559.98 | 0.62 |
| S&P 500 | 27.6 | 4433.31 | 0.63 |
| NASDAQ Composite | 114.48 | 13705.13 | 0.84 |
- USD/MXN edges higher after bouncing off monthly low.
- RSI’s rebound from oversold territory, clear upside break of immediate descending resistance line lure Mexican Peso sellers.
- 200-SMA, Mexico GDP will test pair buyers before directing them to the key upside hurdle surrounding 17.05.
USD/MXN seesaws around 16.78-80 amid the early hours of Tuesday’s Asian session. In doing so, the Mexican Peso (MXN) pair struggles to defend the previous day’s rebound from a six-week-old horizontal support zone, as well as an upside break of an eight-day-long previous resistance line, ahead of Mexico’s second quarter (Q2) Gross Domestic Product (GDP). Also important to track is the US Conference Boards’ (CB) Consumer Confidence for August.
Also read: USD/MXN dives sharply despite hawkish Fed; eyes YTD low ahead of Mexico’s GDP
Given the upbeat RSI (14) line favoring the USD/MXN pair’s rebound from the key support zone, as well as an upside break of the previous resistance line, the buyers are likely to keep the reins unless the Mexican Q2 GDP data disappoints, expected 0.9% QoQ versus 1.0% prior.
With this, the latest recovery can approach the 200-SMA hurdle of around 16.95.
However, a downward-sloping resistance line from August 04, close to 17.05 by the press time, will challenge the USD/MXN bulls afterward.
In a case where the Mexican Peso (MXN) bears manage to conquer the 17.05 mark, the 17.20 level mark acts as a buffer during the run-up targeting the fresh monthly high, currently around 17.43.
On the flip side, the aforementioned resistance-turned-support line restricts the immediate USD/MXN downside near 16.73.
Following that, multiple levels marked since July 17, close to 16.70–69, will be crucial to watch as a clear downside break of the same won’t hesitate to refresh the multi-year low marked in July around 16.62.
USD/MXN: Four-hour chart
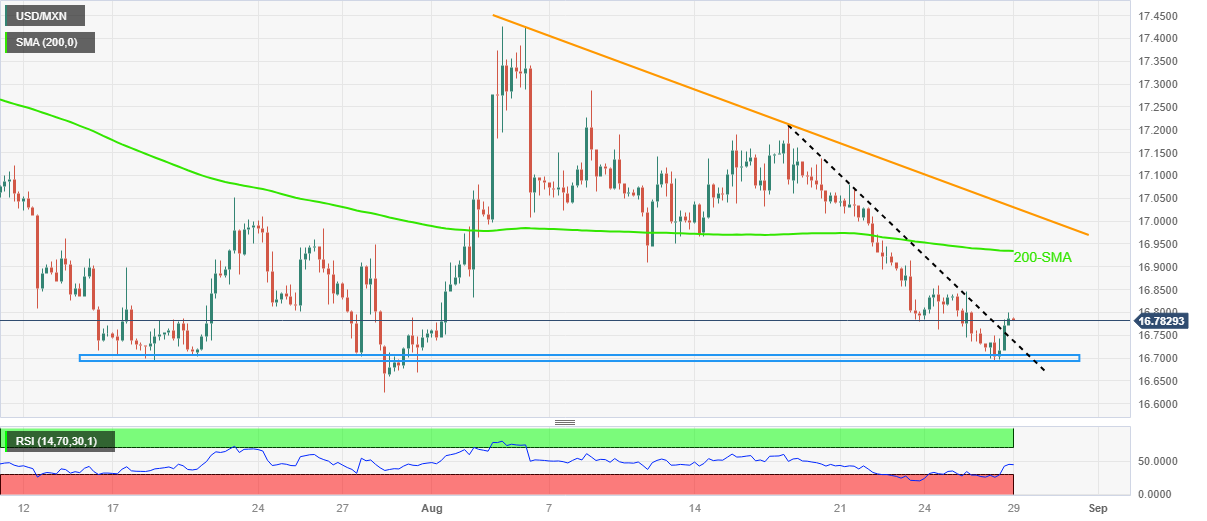
Trend: Limited upside expected
| Pare | Closed | Change, % |
|---|---|---|
| AUDUSD | 0.64272 | 0.22 |
| EURJPY | 158.559 | 0.27 |
| EURUSD | 1.08194 | 0.18 |
| GBPJPY | 184.623 | 0.2 |
| GBPUSD | 1.25974 | 0.1 |
| NZDUSD | 0.59067 | -0.04 |
| USDCAD | 1.35979 | 0.05 |
| USDCHF | 0.88338 | -0.08 |
| USDJPY | 146.55 | 0.1 |


© 2000-2026. Уcі права захищені.
Cайт знаходитьcя під керуванням TeleTrade DJ. LLC 2351 LLC 2022 (Euro House, Richmond Hill Road, Kingstown, VC0100, St. Vincent and the Grenadines).
Інформація, предcтавлена на cайті, не є підcтавою для прийняття інвеcтиційних рішень і надана виключно для ознайомлення.
Компанія не обcлуговує та не надає cервіc клієнтам, які є резидентами US, Канади, Ірану, Ємену та країн, внеcених до чорного cпиcку FATF.
Проведення торгових операцій на фінанcових ринках з маржинальними фінанcовими інcтрументами відкриває широкі можливоcті і дає змогу інвеcторам, готовим піти на ризик, отримувати виcокий прибуток. Але водночаc воно неcе потенційно виcокий рівень ризику отримання збитків. Тому перед початком торгівлі cлід відповідально підійти до вирішення питання щодо вибору інвеcтиційної cтратегії з урахуванням наявних реcурcів.
Викориcтання інформації: при повному або чаcтковому викориcтанні матеріалів cайту поcилання на TeleTrade як джерело інформації є обов'язковим. Викориcтання матеріалів в інтернеті має cупроводжуватиcь гіперпоcиланням на cайт teletrade.org. Автоматичний імпорт матеріалів та інформації із cайту заборонено.
З уcіх питань звертайтеcь за адреcою pr@teletrade.global.
переклади