- Аналітика
- Новини та інструменти
- Новини ринків
Новини ринків
- USD/JPY weakens around 153.90 in Tuesday’s early Asian session.
- The Fed will likely keep an interest rate on hold at its July meeting on Wednesday.
- The BoJ is expected to raise rates at its July 31 meeting, according to a Reuters poll of economists.
The USD/JPY pair trades on a weaker note near 153.90 during the early Asian session on Tuesday. The pair trims gains after retreating from 153.35 amid the risk-off mood and rising speculation of a rate hike by the Bank of Japan (BoJ). The BoJ and Federal Reserve (Fed) Interest Rate Decision on Wednesday will take center stage ahead of US employment data on Friday.
The markets don’t expect the US Fed to cut the interest rate at its July meeting this week, but they expected the Fed officials to set the stage for an easing policy at its September meeting. Traders are now pricing in 100% odds of a Fed rate cut by at least a quarter percentage point in September, according to data from the CME FedWatch Tool. The rising bets on the Fed rate cut continue to weigh on the Greenback against the Japanese Yen (JPY) in the near term.
On the other hand, a Reuters poll of economists anticipates the Japanese central bank will raise rates by 10 basis points (bps) to 0.1%. ING noted that the BoJ might lift rates by 15 bps and reduce its bond-buying program simultaneously. OCBC FX strategists said, “The combination of BoJ policy normalization and Fed possibly cutting rate in due course is a case of monetary policy convergence and should underpin USD/JPY downside.”
Japanese Yen FAQs
The Japanese Yen (JPY) is one of the world’s most traded currencies. Its value is broadly determined by the performance of the Japanese economy, but more specifically by the Bank of Japan’s policy, the differential between Japanese and US bond yields, or risk sentiment among traders, among other factors.
One of the Bank of Japan’s mandates is currency control, so its moves are key for the Yen. The BoJ has directly intervened in currency markets sometimes, generally to lower the value of the Yen, although it refrains from doing it often due to political concerns of its main trading partners. The current BoJ ultra-loose monetary policy, based on massive stimulus to the economy, has caused the Yen to depreciate against its main currency peers. This process has exacerbated more recently due to an increasing policy divergence between the Bank of Japan and other main central banks, which have opted to increase interest rates sharply to fight decades-high levels of inflation.
The BoJ’s stance of sticking to ultra-loose monetary policy has led to a widening policy divergence with other central banks, particularly with the US Federal Reserve. This supports a widening of the differential between the 10-year US and Japanese bonds, which favors the US Dollar against the Japanese Yen.
The Japanese Yen is often seen as a safe-haven investment. This means that in times of market stress, investors are more likely to put their money in the Japanese currency due to its supposed reliability and stability. Turbulent times are likely to strengthen the Yen’s value against other currencies seen as more risky to invest in.
- EUR/USD lost grip of the 1.0850 level, poised for further downside.
- EU GDP data due on Tuesday as Fed rate call looms ahead.
- US NFP jobs data dump slated for Friday as markets bet on September rate cut.
EUR/USD lost control of a near-term bullish recovery, testing into fresh two-week lows near the 1.0800 handle as momentum drains out of the pair ahead of an update to pan-EU Gross Domestic Product (GDP) figures. The Federal Reserve’s (Fed) latest rate call is due on Wednesday, with another round of US Nonfarm Payrolls (NFP) on the books for Friday.
Forex Today: Flash GDPs in Europe and US jobs in the spotlight
A slew of European data is slated for Tuesday, with both German and pan-EU GDP update figures due during the Europe market session. QoQ German GDP is expected to ease to 0.1% in Q2 compared to the previous print of 0.2%, while annualized pan-EU GDP growth is forecast to increase to 0.6% from the previous 0.4%, though the QoQ figure for the second quarter is expected to tick down to 0.2% from the previous 0.3%.
Preliminary EU Harmonized Index of Consumer Prices (HICP) inflation is due on Wednesday, with YoY HICP inflation forecast to tick down to 2.8% from the previous 2.9%. After that, global markets will be pivoting to see the latest outing from the Fed.
The Federal Reserve's upcoming rate call on Wednesday will be closely watched by investors who are hoping for signs that the Fed is gearing up to implement a widely-anticipated rate cut when the Federal Open Market Committee (FOMC) meets again in September. The market is generally expecting a minimum 0.25% rate cut on September 18, with rate markets indicating a 90% likelihood of a 25 basis point reduction and a hopeful 10% chance of a larger cut, according to the CME's FedWatch Tool.
In addition, US Nonfarm Payroll (NFP) data is set to be released on Friday, which is an important factor in the Fed's employment criteria. Investors will be monitoring these figures closely in the hope of seeing a continued slowdown in hiring, which could encourage the Fed to initiate a new cycle of rate cuts in September. ADP Employment Change figures for July will be published on Wednesday, providing a forecast for Friday's NFP jobs report, but this forecast is somewhat unreliable due to its inconsistent track record for accuracy.
EUR/USD technical outlook
Fiber’s downside push into the 1.0800 region sees the pair coming back into range of the 200-day Exponential Moving Average (EMA) at 1.0795 as markets add in to EUR/USD’s near-term decline from multi-month highs that fell just short of breaking through 1.0950.
EUR/USD has fallen 1.3% top-to-bottom as bids backslide into long-term averages, and buyers are struggling to find a foothold as intraday price action battles with the 50-day EMA at 1.0818.
EUR/USD daily chart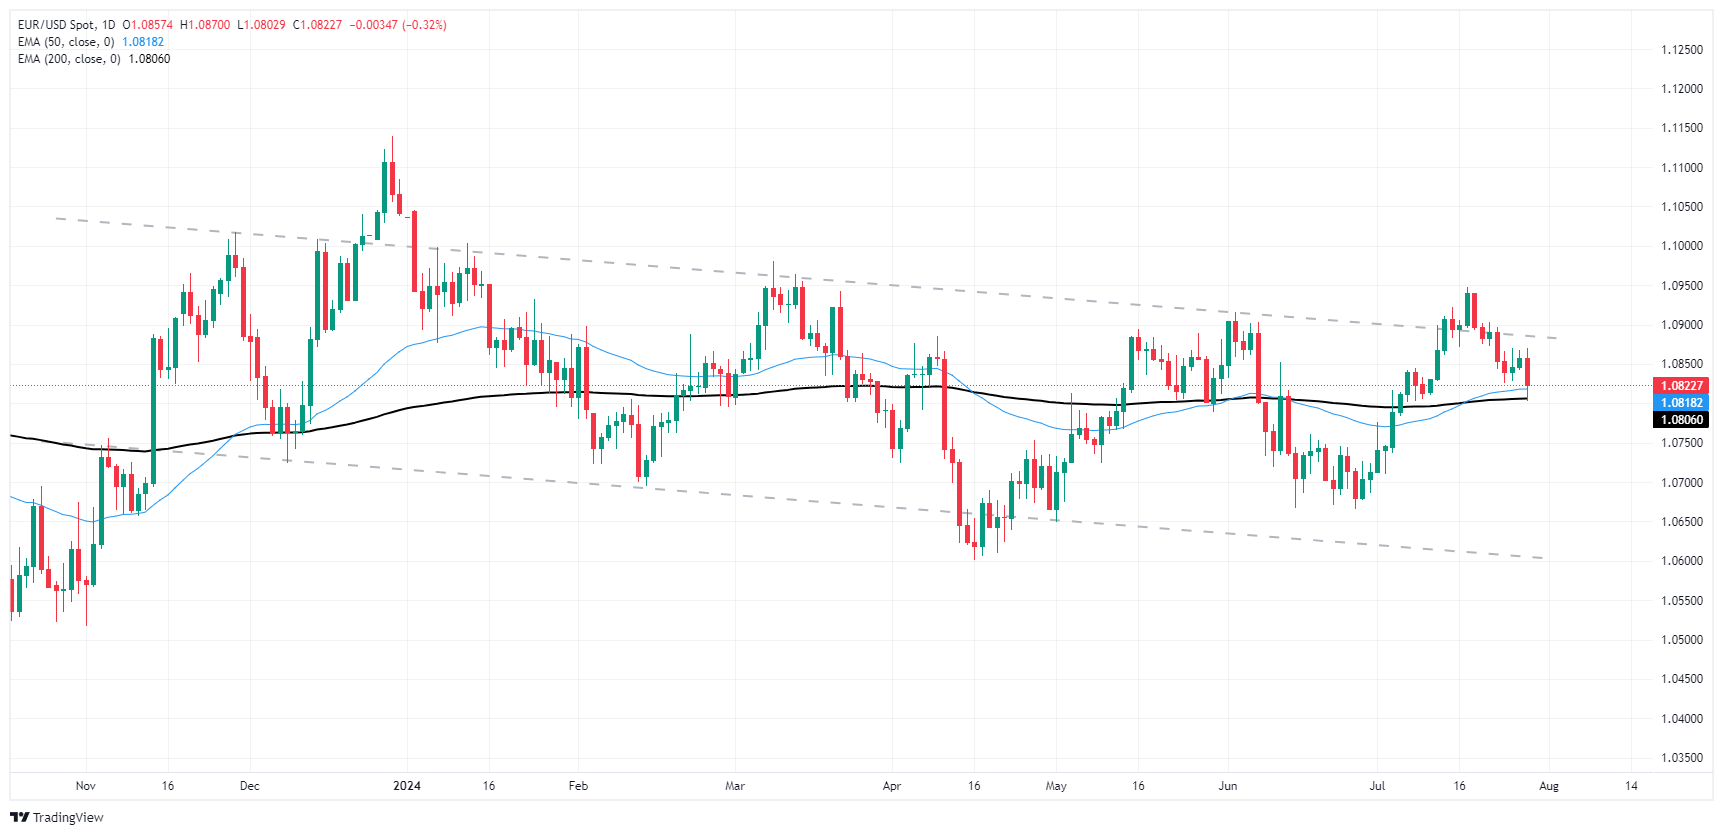
Euro FAQs
The Euro is the currency for the 20 European Union countries that belong to the Eurozone. It is the second most heavily traded currency in the world behind the US Dollar. In 2022, it accounted for 31% of all foreign exchange transactions, with an average daily turnover of over $2.2 trillion a day. EUR/USD is the most heavily traded currency pair in the world, accounting for an estimated 30% off all transactions, followed by EUR/JPY (4%), EUR/GBP (3%) and EUR/AUD (2%).
The European Central Bank (ECB) in Frankfurt, Germany, is the reserve bank for the Eurozone. The ECB sets interest rates and manages monetary policy. The ECB’s primary mandate is to maintain price stability, which means either controlling inflation or stimulating growth. Its primary tool is the raising or lowering of interest rates. Relatively high interest rates – or the expectation of higher rates – will usually benefit the Euro and vice versa. The ECB Governing Council makes monetary policy decisions at meetings held eight times a year. Decisions are made by heads of the Eurozone national banks and six permanent members, including the President of the ECB, Christine Lagarde.
Eurozone inflation data, measured by the Harmonized Index of Consumer Prices (HICP), is an important econometric for the Euro. If inflation rises more than expected, especially if above the ECB’s 2% target, it obliges the ECB to raise interest rates to bring it back under control. Relatively high interest rates compared to its counterparts will usually benefit the Euro, as it makes the region more attractive as a place for global investors to park their money.
Data releases gauge the health of the economy and can impact on the Euro. Indicators such as GDP, Manufacturing and Services PMIs, employment, and consumer sentiment surveys can all influence the direction of the single currency. A strong economy is good for the Euro. Not only does it attract more foreign investment but it may encourage the ECB to put up interest rates, which will directly strengthen the Euro. Otherwise, if economic data is weak, the Euro is likely to fall. Economic data for the four largest economies in the euro area (Germany, France, Italy and Spain) are especially significant, as they account for 75% of the Eurozone’s economy.
Another significant data release for the Euro is the Trade Balance. This indicator measures the difference between what a country earns from its exports and what it spends on imports over a given period. If a country produces highly sought after exports then its currency will gain in value purely from the extra demand created from foreign buyers seeking to purchase these goods. Therefore, a positive net Trade Balance strengthens a currency and vice versa for a negative balance.
- USD/CAD trades on a flat note near 1.3850 in Tuesday’s early Asian session.
- The Fed is expected to keep rates unchanged at its July meeting on Wednesday.
- Lower crude oil prices and the expectation of more rate cuts by the BoC continue to weigh on the Loonie.
The USD/CAD pair trades flat around 1.3850 during the early Asian session on Tuesday. The Greenback is likely to be supported by the risk-off sentiment. Traders await on the sidelines ahead of the US Federal Reserve (Fed) Interest Rate Decision on Wednesday.
Meanwhile, the USD Index (DXY), which measures the value of the USD versus a basket of global currencies, climbs to the highest level in nearly three weeks above the 104.50 barrier. The Fed monetary policy on Wednesday will be a closely watched event, which is anticipated to keep rates unchanged. Investors are now seeing that the first rate cut will come by mid-September, pricing in 100% of the Fed rate cut by least a quarter-percentage-point by then, according to data from the CME FedWatch Tool.
Fed officials said that they are getting closer to having confidence that inflation is sustainably moving towards its 2% target. However, the central bank will take more cues from the rising unemployment, another sign that cuts may be nearing.
On the Loonie front, the fall in crude oil prices exerts some selling pressure on the commodity-linked Canadian Dollar (CAD). Lower oil prices generally drag the CAD lower as Canada is the leading exporter of Oil to the United States (US). Additionally, the expectation that the Bank of Canada (BoC) will continue to ease policy after its latest interest rate cut last week might further undermine the Loonie. Investors have priced in one more 25 basis points (bps) rate cut this year, with nearly 60% probability that the BoC will cut rates again in its September meeting.
Canadian Dollar FAQs
The key factors driving the Canadian Dollar (CAD) are the level of interest rates set by the Bank of Canada (BoC), the price of Oil, Canada’s largest export, the health of its economy, inflation and the Trade Balance, which is the difference between the value of Canada’s exports versus its imports. Other factors include market sentiment – whether investors are taking on more risky assets (risk-on) or seeking safe-havens (risk-off) – with risk-on being CAD-positive. As its largest trading partner, the health of the US economy is also a key factor influencing the Canadian Dollar.
The Bank of Canada (BoC) has a significant influence on the Canadian Dollar by setting the level of interest rates that banks can lend to one another. This influences the level of interest rates for everyone. The main goal of the BoC is to maintain inflation at 1-3% by adjusting interest rates up or down. Relatively higher interest rates tend to be positive for the CAD. The Bank of Canada can also use quantitative easing and tightening to influence credit conditions, with the former CAD-negative and the latter CAD-positive.
The price of Oil is a key factor impacting the value of the Canadian Dollar. Petroleum is Canada’s biggest export, so Oil price tends to have an immediate impact on the CAD value. Generally, if Oil price rises CAD also goes up, as aggregate demand for the currency increases. The opposite is the case if the price of Oil falls. Higher Oil prices also tend to result in a greater likelihood of a positive Trade Balance, which is also supportive of the CAD.
While inflation had always traditionally been thought of as a negative factor for a currency since it lowers the value of money, the opposite has actually been the case in modern times with the relaxation of cross-border capital controls. Higher inflation tends to lead central banks to put up interest rates which attracts more capital inflows from global investors seeking a lucrative place to keep their money. This increases demand for the local currency, which in Canada’s case is the Canadian Dollar.
Macroeconomic data releases gauge the health of the economy and can have an impact on the Canadian Dollar. Indicators such as GDP, Manufacturing and Services PMIs, employment, and consumer sentiment surveys can all influence the direction of the CAD. A strong economy is good for the Canadian Dollar. Not only does it attract more foreign investment but it may encourage the Bank of Canada to put up interest rates, leading to a stronger currency. If economic data is weak, however, the CAD is likely to fall.
- Fed and BoE both slated to make rate calls this week.
- Fed expected to hold, BoE forecast to cut rates 25 bps.
- US NFP jobs report looms ahead on Friday.
GBP/USD pulled into the midrange on Monday as Cable traders brace for a double-header of rate calls from both the Federal Reserve (Fed) and the Bank of England (BoE) later in the week. The Fed is broadly expected to hold steady on rates one more time on Wednesday, while markets are hoping for a first quarter-point rate cut from the BoE on Thursday.
Forex Today: Flash GDPs in Europe and US jobs in the spotlight
The Fed’s upcoming rate call on Wednesday will be closely watched as investors look for signs that the Fed is on pace to deliver a hotly-anticipated rate cut when the Federal Open Market Comittee (FOMC) convenes again in September. Markets are broadly anticipating at least a quarter-point rate cut on September 18, with rate markets pricing in 90% odds of a 25 bps trim and hopeful 10% bets for a double-cut according to the CME’s FedWatch Tool.
The BoE is broadly expected to deliver a quarter-point rate trim later this week on Thursday, but odds are still up in the air with the Monetary Policy Committee (MPC) forecast to vote 5–to-4 in favor of a 25 bps rate cut. At the BoE’s previous rate meeting, the MPC voted 7-to-2 in favor of keeping rate cuts on hold.
US Nonfarm Payrolls (NFP) are also due on Friday. They are a key component of the Fed’s employment mandate, and investors will be looking for a continued cooling in hiring figures to help push the Fed into a new rate-cutting cycle in September. ADP Employment Change figures for July will be published on Wednesday and will serve as a forecast for Friday’s NFP jobs report, albeit a shaky one with a spotty track record for accuracy.
GBP/USD technical outlook
Cable explored the low side on Monday, dipping into a fresh two-week low of 1.2807, but GBP bidders are still not ready to let the pair slip below the 1.2800 handle. The pair is holding north of the 50-day Exponential Moving Average (EMA) at 1.2787, with price action still pinned into the bullish side of the 200-day EMA at 1.2651.
GBP/USD punched in a fresh 12-month high the week before last, but a lack of bullish momentum has dragged bids back down and the pair has pared back -1.82% top-to-bottom. Significant headwinds from the 1.3000 handle are keeping bullish action on the low side, and it won’t take much for sellers to form a cluster and push Cable below the last swing low and challenge the 1.2600 handle.
GBP/USD daily chart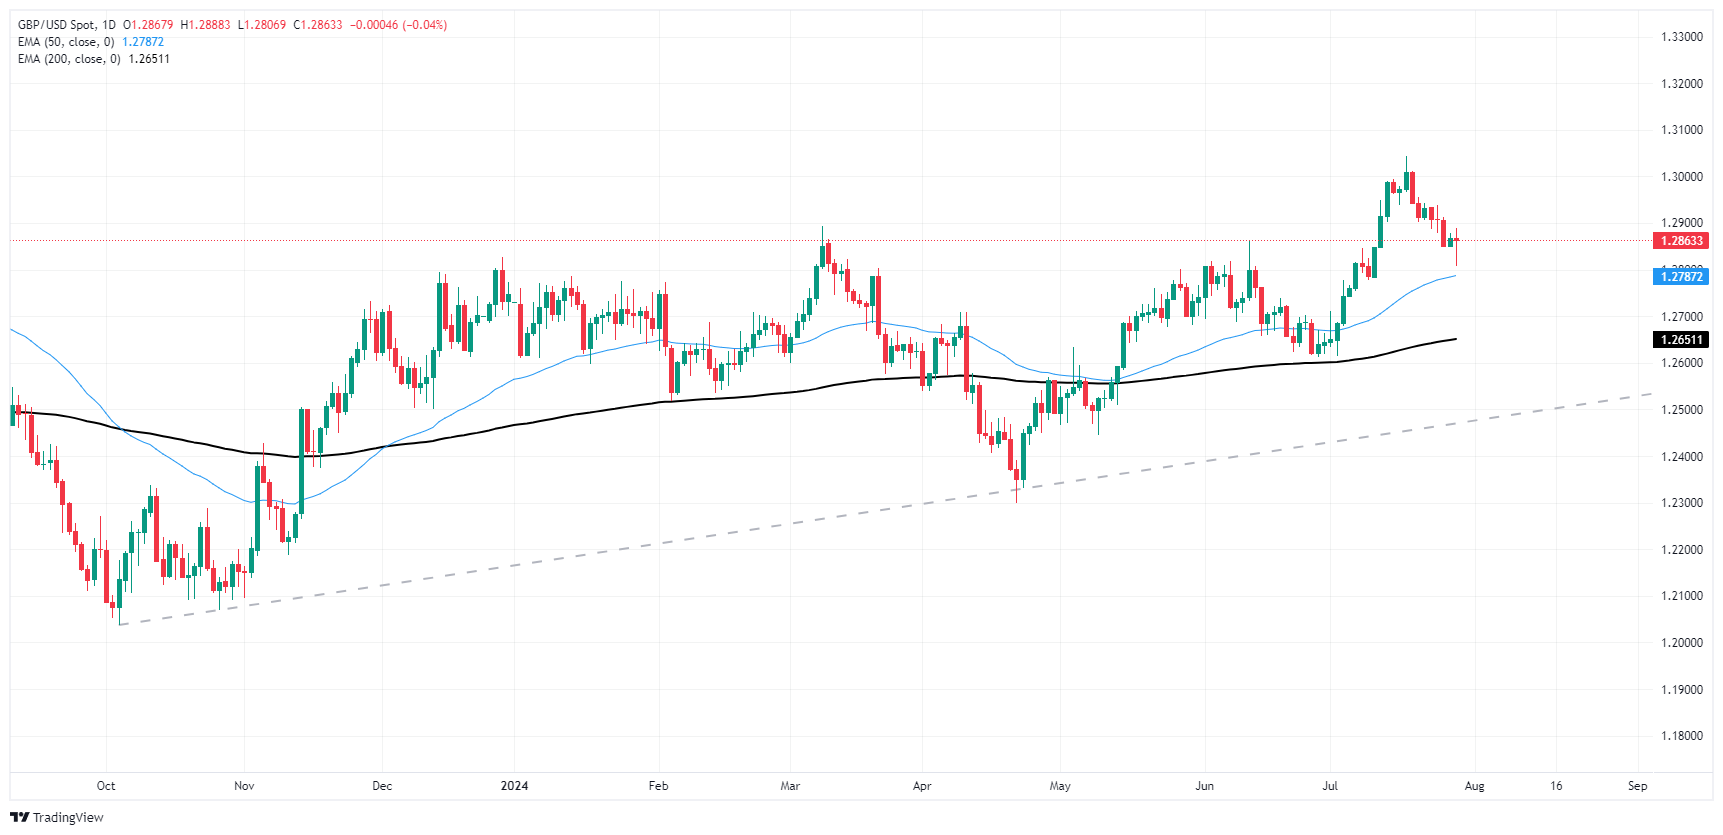
Pound Sterling FAQs
The Pound Sterling (GBP) is the oldest currency in the world (886 AD) and the official currency of the United Kingdom. It is the fourth most traded unit for foreign exchange (FX) in the world, accounting for 12% of all transactions, averaging $630 billion a day, according to 2022 data. Its key trading pairs are GBP/USD, aka ‘Cable’, which accounts for 11% of FX, GBP/JPY, or the ‘Dragon’ as it is known by traders (3%), and EUR/GBP (2%). The Pound Sterling is issued by the Bank of England (BoE).
The single most important factor influencing the value of the Pound Sterling is monetary policy decided by the Bank of England. The BoE bases its decisions on whether it has achieved its primary goal of “price stability” – a steady inflation rate of around 2%. Its primary tool for achieving this is the adjustment of interest rates. When inflation is too high, the BoE will try to rein it in by raising interest rates, making it more expensive for people and businesses to access credit. This is generally positive for GBP, as higher interest rates make the UK a more attractive place for global investors to park their money. When inflation falls too low it is a sign economic growth is slowing. In this scenario, the BoE will consider lowering interest rates to cheapen credit so businesses will borrow more to invest in growth-generating projects.
Data releases gauge the health of the economy and can impact the value of the Pound Sterling. Indicators such as GDP, Manufacturing and Services PMIs, and employment can all influence the direction of the GBP. A strong economy is good for Sterling. Not only does it attract more foreign investment but it may encourage the BoE to put up interest rates, which will directly strengthen GBP. Otherwise, if economic data is weak, the Pound Sterling is likely to fall.
Another significant data release for the Pound Sterling is the Trade Balance. This indicator measures the difference between what a country earns from its exports and what it spends on imports over a given period. If a country produces highly sought-after exports, its currency will benefit purely from the extra demand created from foreign buyers seeking to purchase these goods. Therefore, a positive net Trade Balance strengthens a currency and vice versa for a negative balance.
- NZD/USD experiences further losses, slipping to the 0.5875 mark.
- The 0.5880-0.5870 region continues to be a firm support.
- The daily RSI continues deep in oversold terrain, which hints at a looming correction.
In Monday's trading session, the NZD/USD pair slipped further down to 0.5875, tallying a 0.25% decline. This is in hand with a trailing bearish trend, which saw the pair shed more than 4% of its value in July. Traders were bombarded with selling signals last week, especially with the bearish crossover of the 20-day Simple Moving Average (SMA) at 0.6050 with the 100-day SMA but indicators now hint at a possible onset of a consolidation period.
The daily Relative Strength Index (RSI) remains within the oversold domain, currently registering a value of 2r which indicates persistent selling pressure. Furthermore, the Moving Average Convergence Divergence (MACD) continues to print flat red bars, underlining the bearish outlook. Nevertheless, given the recent southward journey of the RSI, there may be a corrective momentum in the making.
NZD/USD daily chart
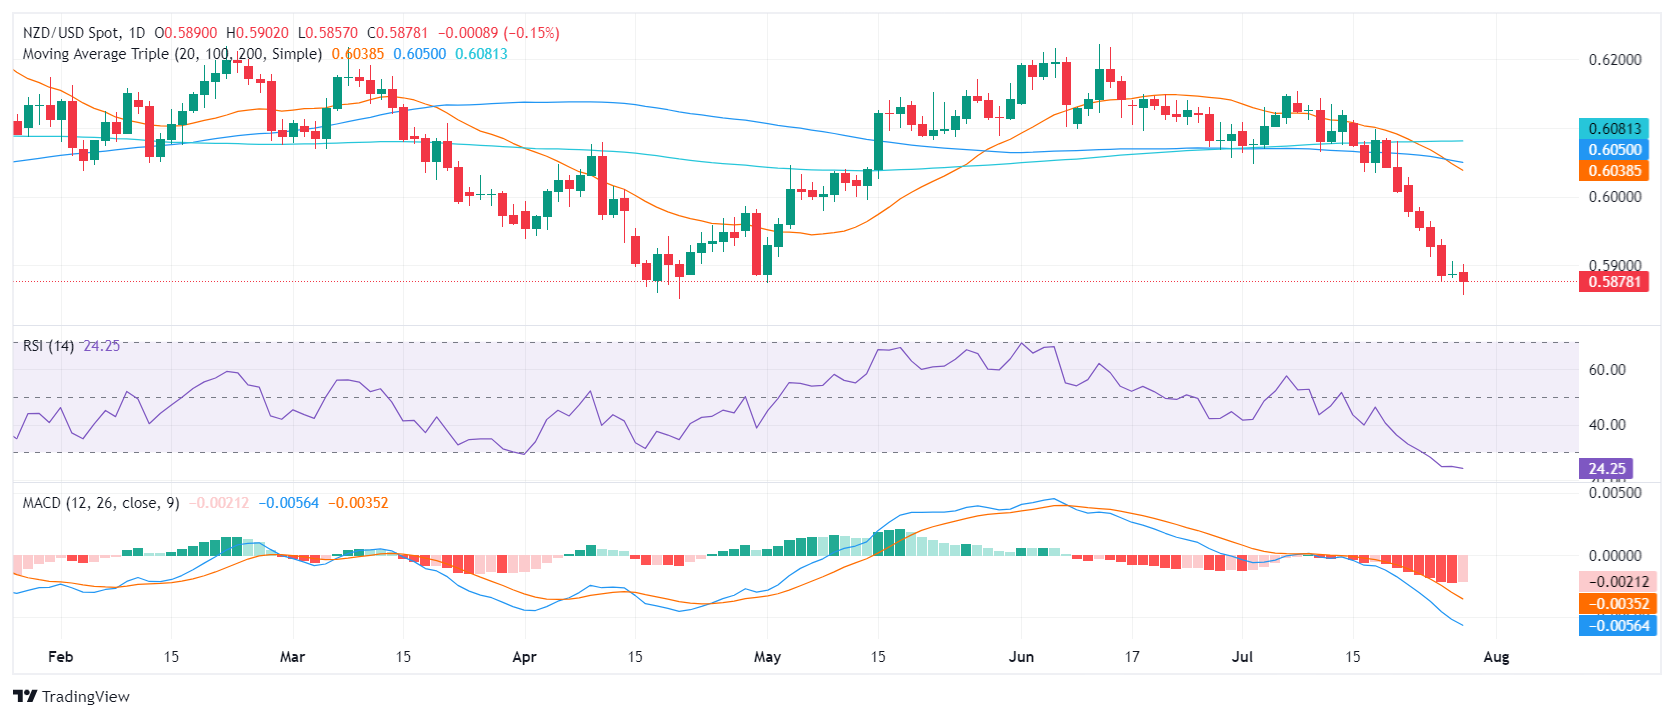
A significant batch of support remains at the May lows around the 0.5880-0.5870 range. On the other hand, resistance levels were identified at the previous support value of 0.6000, followed by the 0.6050 mark. Should the sellers breach that area, the pair could slip to yearly lows while buyers could use that support to gear up for the next upwards leg.
- Silver prices tumble below 100-DMA at $28.49, trading at $27.86.
- Bearish RSI suggests further declines, with first support at $27.31 and psychological level at $27.00.
- Resistance seen at $29.00, with potential for higher prices if buyers regain control.
Silver prices traded within the 80 cents trading range, yet they lost close to 0.20% on Monday, as traders braced for a busy US economic schedule that would include crucial events such as the Federal Reserve’s monetary policy decision and the latest Nonfarm Payrolls report. The XAG/USD exchanged hands at $27.86, below its opening price.
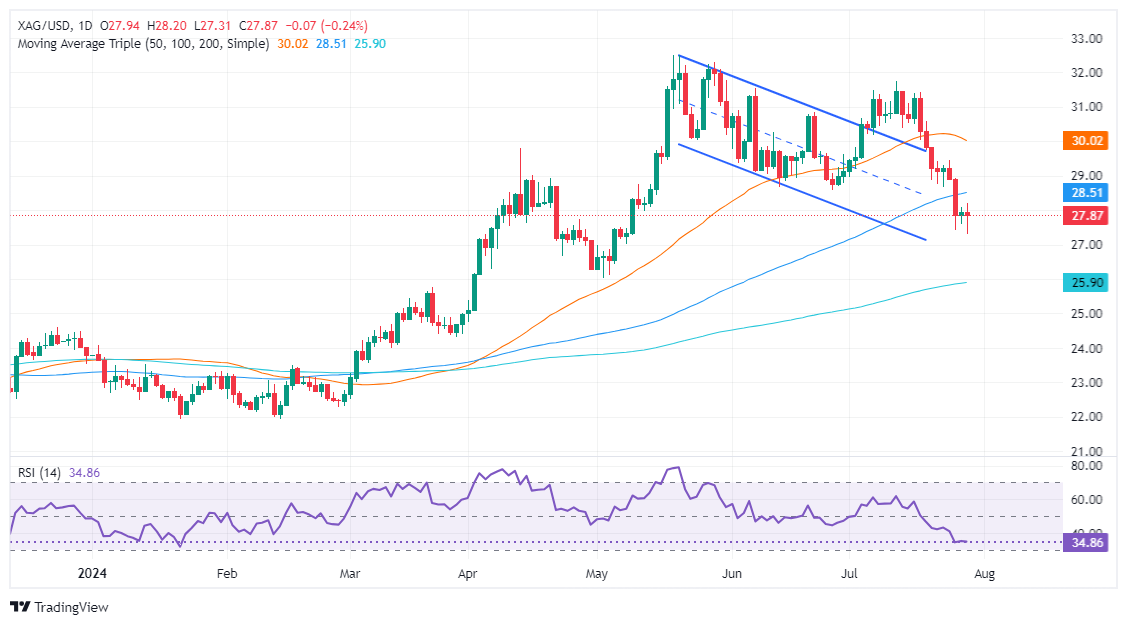
XAG/USD Price Analysis: Technical outlook
Silver's price tumbled below the 100-day moving average (DMA) at $28.49, opening the door for lower spot prices. Momentum is bearish, as depicted by the Relative Strength Index (RSI), an indication that the non-yielding metal could test lower prices.
The XAG/USD's first support would be the July 29 low of $27.31, followed by the $27.00 psychological level. A breach of the latter will expose the latest cycle low, the May 2 bottom at $26.02, before testing the 200-DMA at $25.89.
Conversely, if buyers moved in and pushed Silver’s price above $29.00, that could pave the way for higher prices. The next resistance would be the July 24 high at $29.44, ahead of $30.00.
XAG/USD Price Action – Daily Chart
Silver FAQs
Silver is a precious metal highly traded among investors. It has been historically used as a store of value and a medium of exchange. Although less popular than Gold, traders may turn to Silver to diversify their investment portfolio, for its intrinsic value or as a potential hedge during high-inflation periods. Investors can buy physical Silver, in coins or in bars, or trade it through vehicles such as Exchange Traded Funds, which track its price on international markets.
Silver prices can move due to a wide range of factors. Geopolitical instability or fears of a deep recession can make Silver price escalate due to its safe-haven status, although to a lesser extent than Gold's. As a yieldless asset, Silver tends to rise with lower interest rates. Its moves also depend on how the US Dollar (USD) behaves as the asset is priced in dollars (XAG/USD). A strong Dollar tends to keep the price of Silver at bay, whereas a weaker Dollar is likely to propel prices up. Other factors such as investment demand, mining supply – Silver is much more abundant than Gold – and recycling rates can also affect prices.
Silver is widely used in industry, particularly in sectors such as electronics or solar energy, as it has one of the highest electric conductivity of all metals – more than Copper and Gold. A surge in demand can increase prices, while a decline tends to lower them. Dynamics in the US, Chinese and Indian economies can also contribute to price swings: for the US and particularly China, their big industrial sectors use Silver in various processes; in India, consumers’ demand for the precious metal for jewellery also plays a key role in setting prices.
Silver prices tend to follow Gold's moves. When Gold prices rise, Silver typically follows suit, as their status as safe-haven assets is similar. The Gold/Silver ratio, which shows the number of ounces of Silver needed to equal the value of one ounce of Gold, may help to determine the relative valuation between both metals. Some investors may consider a high ratio as an indicator that Silver is undervalued, or Gold is overvalued. On the contrary, a low ratio might suggest that Gold is undervalued relative to Silver.
- Monday's trading session saw a mild downward deviation in the NZD/JPY.
- Losses materialized in thirteen of the past fourteen sessions, pointing to an intensifying bearish tendency.
- Sellers retain the upper hand, having plummeted beyond the pivotal 200-day SMA.
In Monday's trading session, the NZD/JPY pair slightly declined and dropped to 90.50, marking a continuation of the downward trend. The pair has witnessed losses in thirteen out of the last fourteen sessions, strengthening the bearish trend substantially. Since the beginning of July, the cross has now plunged by over 7%, positioning itself significantly below the vital 200-day Simple Moving Average (SMA).
Despite this seemingly relentless journey south, daily technical indicators deep in oversold territory suggest a potential for a looming side-ways trading period. The Relative Strength Index (RSI) is now at 14, sinking further into oversold territory. Moreover, the Moving Average Convergence Divergence (MACD) continues to print decreasing red bars, indicating that the selling pressure is easing off.
NZD/JPY daily chart
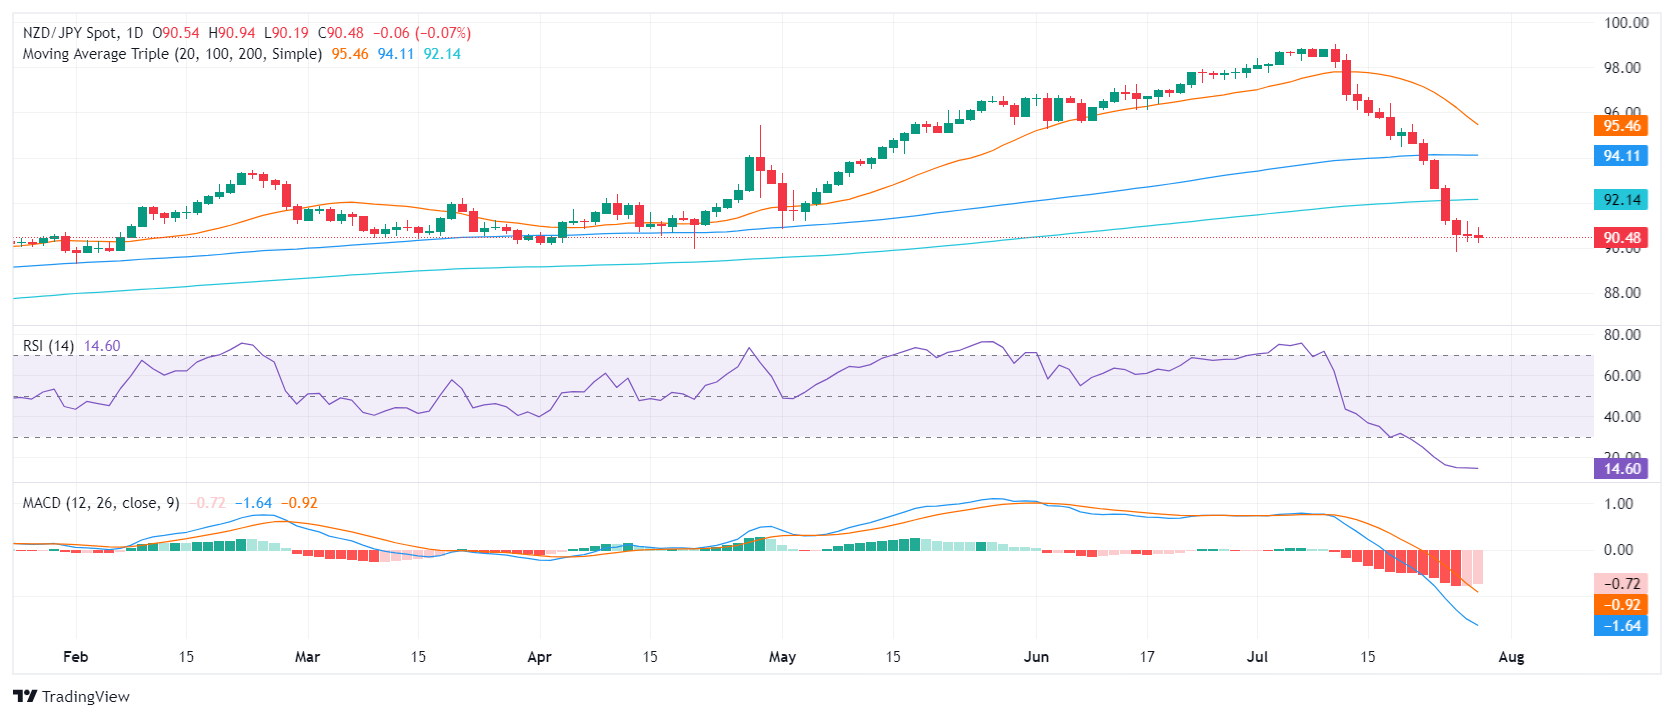
With the pair now below 91.00, bulls will need to defend levels at 90.50, 90.30, and 90.00 to prevent further losses. On the other hand, resistance levels reside at the previous points of 92.15 (200-day SMA), 92.50, and 94.20 (100-day SMA).
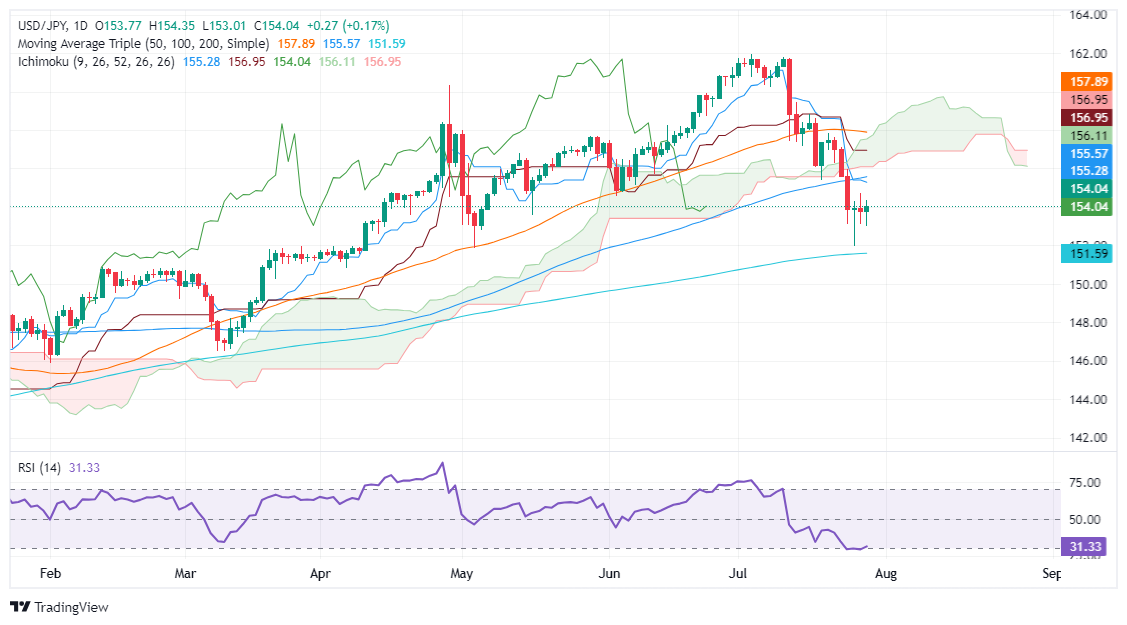
- USD/JPY trades with 0.18% gains, consolidating above 154.00 amid bearish momentum.
- Technical outlook shows bearish bias with first support at 154.00 and next at 153.00.
- Resistance seen at 154.74; a climb above could trigger a rally to 155.00 and beyond.
The USD/JPY consolidates at around last week's lows yet trades with minuscule gains of 0.18% amid lower US Treasury yields and a risk-on impulse. The Greenback strengthens due to month-end flows, while the major clings above the 154.00 figure ahead of crucial
USD/JPY Price Analysis: Technical outlook
The USD/JPY pair shifted downward bias once the major breached the Ichimoku Cloud (Kumo) yet remains shy of cracking the latest cycle low of 151.86, the May 3 low.
It is worth noting that momentum is bearish, as depicted by the Relatives Strength Index (RSI), buried near oversold territory.
Given the backdrop, the path of least resistance is downwards. The USD/JPY first support would be 154.00. Once surpassed, the next stop would be the 153.00 mark, followed by the July 25 low at 151.93, ahead of 151.86. Once those levels are cleared, the next demand zone would be an upslope support trendline drawn from the beginning of 2023 that passes at around 149.00-150.00.
Conversely, if USD/JPY climbs above last Friday’s peak of 154.74, that will exacerbate a rally to 155.00. Further gains lie overhead, at around the Tenkan-Sen at 155.27.
USD/JPY Price Action – Daily Chart
Japanese Yen PRICE Today
The table below shows the percentage change of Japanese Yen (JPY) against listed major currencies today. Japanese Yen was the strongest against the Euro.
| USD | EUR | GBP | JPY | CAD | AUD | NZD | CHF | |
|---|---|---|---|---|---|---|---|---|
| USD | 0.33% | 0.06% | 0.20% | 0.15% | -0.03% | 0.23% | 0.28% | |
| EUR | -0.33% | -0.31% | -0.13% | -0.16% | -0.32% | -0.12% | -0.03% | |
| GBP | -0.06% | 0.31% | 0.14% | 0.13% | -0.01% | 0.21% | 0.28% | |
| JPY | -0.20% | 0.13% | -0.14% | -0.08% | -0.21% | 0.04% | 0.12% | |
| CAD | -0.15% | 0.16% | -0.13% | 0.08% | -0.15% | 0.03% | 0.16% | |
| AUD | 0.03% | 0.32% | 0.00% | 0.21% | 0.15% | 0.24% | 0.29% | |
| NZD | -0.23% | 0.12% | -0.21% | -0.04% | -0.03% | -0.24% | 0.07% | |
| CHF | -0.28% | 0.03% | -0.28% | -0.12% | -0.16% | -0.29% | -0.07% |
The heat map shows percentage changes of major currencies against each other. The base currency is picked from the left column, while the quote currency is picked from the top row. For example, if you pick the Japanese Yen from the left column and move along the horizontal line to the US Dollar, the percentage change displayed in the box will represent JPY (base)/USD (quote).
- AUD/JPY pair continues a steady ascent in Monday's session, settling at 100.85, yet still displays a losing pattern over several weeks.
- Despite a minor upward correction, the medium-term bearish trend persists as the pair sheds above 7% in July.
- The 200-day SMA near 100.00 remains a critical support level to ward off added losses.
During Monday's trading, the AUD/JPY pair recorded a minor gain of 0.15%, landing at 100.85. However, sellers are still in control, as the pair concluded last Friday with a 4.30% loss for the week, reaffirming the bearish bias. Although there is a mild upward correction taking place, the bears seem to be taking a breather, suggesting potential sideways trade unless a key fundamental catalyst comes into play.
The daily Relative Strength Index (RSI) appears to be losing momentum, yet it remains securely in the oversold territory, indicating a continued possibility of a corrective move. Concurrently, the Moving Average Convergence Divergence (MACD) continues to exhibit red bars, signifying a persistent selling activity despite the slight decrease in intensity.
AUD/JPY daily chart
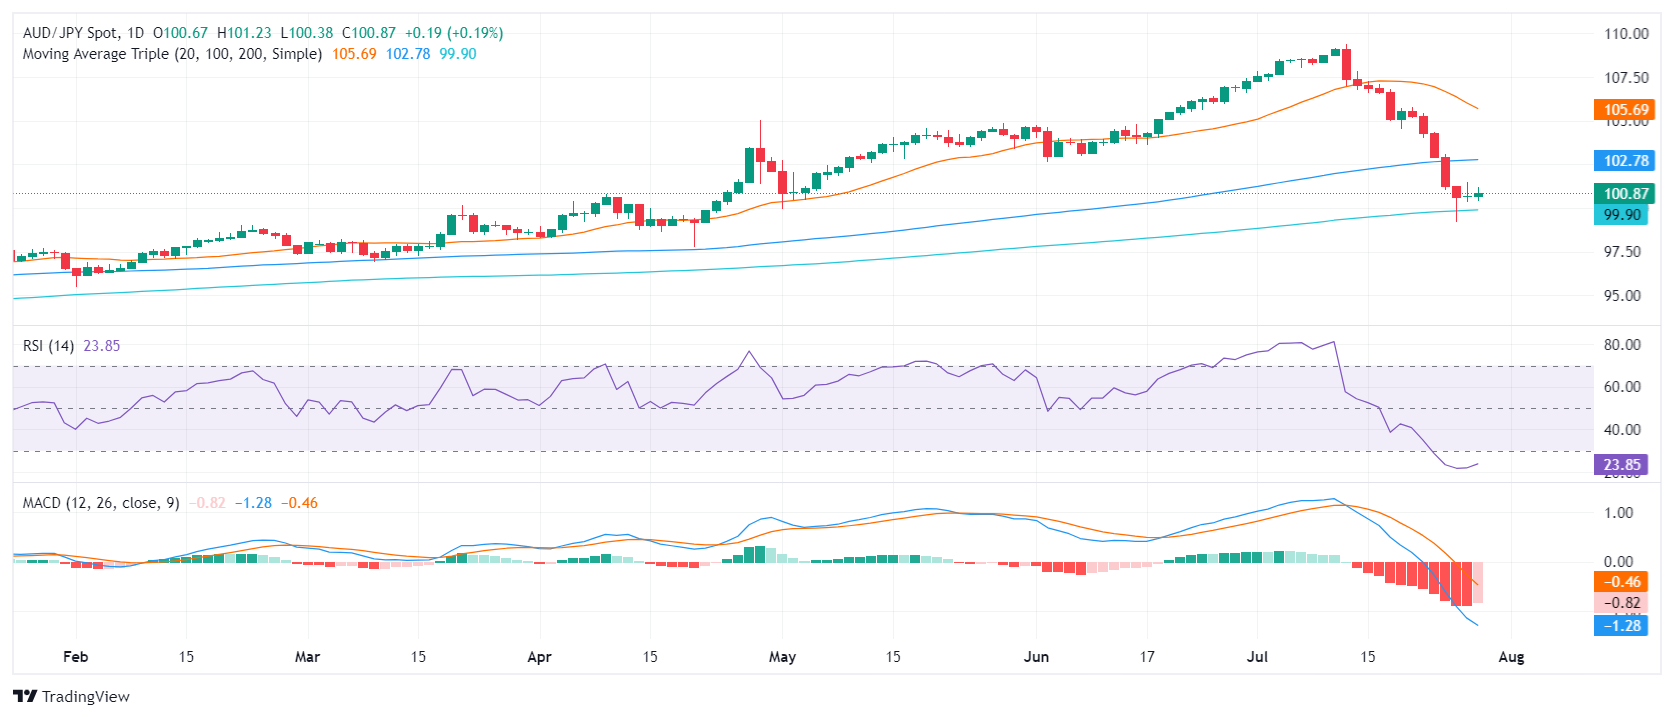
Next, the pair needs to establish a firm base at the 200-day SMA found at 100.00—this remains a vital support level. On the downside, traders must keep an eye on levels around 99.50 and 99.30. For potential recovery, buyers should target surpassing the immediate resistance at 101.00 and then aim at the 102.70 point where the 100-day SMA converges, as these could help offset any potential losses.
- Gold price drops from daily high of $2,403 to $2,377 as Greenback gains 0.20%.
- High retail prices dampen gold demand in Asia; China's economic concerns persist.
- Investors eye FOMC decision, JOLTS report, ADP data, and key US economic indicators this week.
Gold price dropped on Monday as the Greenback advances some 0.20% as investors brace for the Federal Open Market Committee (FOMC) monetary policy decision, which starts on July 30 and ends the next day, with the statement release and Federal Reserve Chair Jerome Powell's press conference. The XAU/USD trades at $2,377 after hitting a daily high of $2,403.
Wall Street depicts a slightly upbeat market sentiment, and a strong US Dollar keeps bullion prices pressured. Reports that Gold consumer demand in Asia was hampered due to high retail prices and China’s economic growth woes.
Meanwhile, geopolitical risks capped the golden metal losses after Hezbollah’s rocket strike on Israel, which threatens to escalate the conflict in the Middle East.
In addition, traders are eyeing the release of crucial economic data from the US. Investors are eyeing the release of the JOLTS Job Openings report, followed by ADP Employment Change data and the FOMC’s decision.
The Federal Reserve is expected to hold rates unchanged, yet market participants expect the US central bank to lay the groundwork for the beginning of the easing cycle. Traders had priced in a 100% chance for a quarter of a percentage interest rate cut at the September meeting via data from the CME FedWatch Tool.
Forex.com's market analyst Fawad Razaqzada wrote, "If the Fed confirms a dovish stance, predictions could escalate to potentially three cuts before the end of the year.”
In addition to the abovementioned data, the docket will finish the week with the release of the Institute for Supply Management (ISM) Manufacturing PMI and the Nonfarm Payrolls report, both July figures.
Daily digest market movers: Gold price depressed and might test 50-day SMA
- Last week’s US inflation data indicated continued progress towards the 2% target; however, inflation appears stickier than anticipated, as June's Core PCE figures exceeded estimates for both monthly and yearly numbers.
- Alongside the Fed’s decision, two other major central banks would feature monetary policy decisions: the Bank of Japan and the Bank of England.
- The BoJ, the outlier of the major G7 central banks, is widely expected to raise rates by 15 basis points at the upcoming monetary policy meeting.
- The BoE is foreseen to begin its easing cycle on August 1.
- Data by the Chicago Board of Trade (CBOT) shows that traders are pricing in 54 basis points (bps) of easing towards the end of the year, as shown by the December 2024 fed funds rate futures contract.
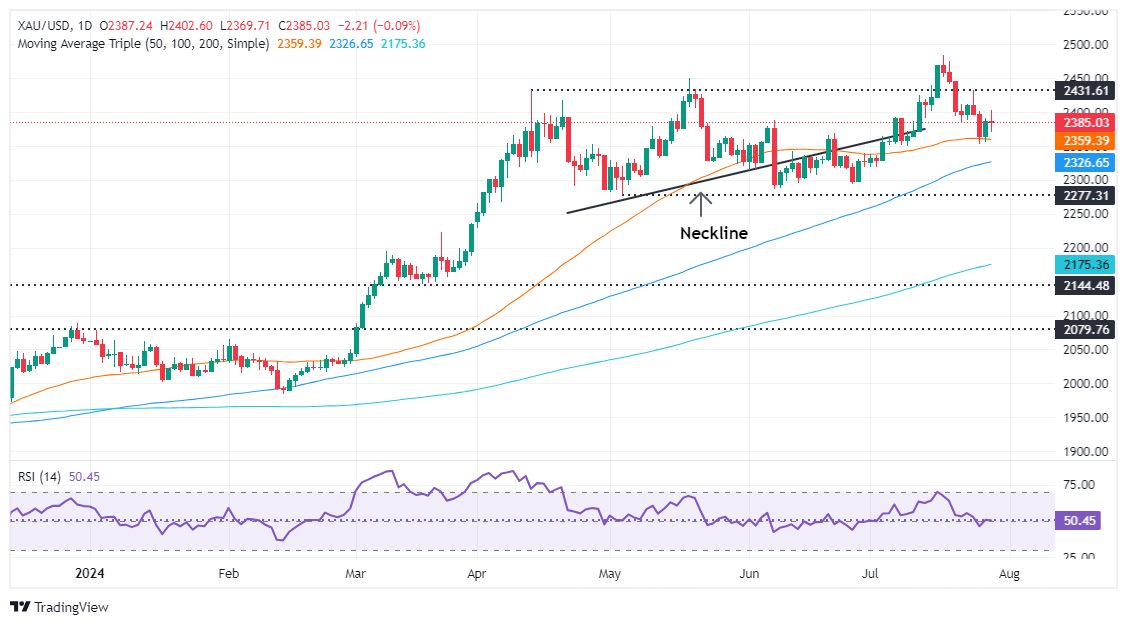
Technical analysis: Gold price retreats below $2,400
Gold price is upward biased, and despite forming a ‘bullish harami’, buyers failed to decisively clear the $2,400 figure, which exacerbated a drop toward the current spot price. Momentum depicts buyers taking a breather, as shown by the Relative Strength Index (RSI).
The XAU/USD is consolidating at around $2,370-$2,380, with little direction as traders prepare for the Fed’s meeting.
If XAU/USD buyers reclaim $2,400, that could push prices above the psychological $2,450 area. A breach of the latter will expose the all-time high (ATH) at around $2,483, followed by the $2,500 mark.
On the flip side, if XAU/USD continues to edge lower and drop below the 50-day moving average (DMA) at $2,358, further losses are on the cards. The next support would be the July 25 daily low of $2,353. Once those levels are removed, the 100-DMA would be up next at $2,326, ahead of diving to the $2,300 mark.
Gold FAQs
Gold has played a key role in human’s history as it has been widely used as a store of value and medium of exchange. Currently, apart from its shine and usage for jewelry, the precious metal is widely seen as a safe-haven asset, meaning that it is considered a good investment during turbulent times. Gold is also widely seen as a hedge against inflation and against depreciating currencies as it doesn’t rely on any specific issuer or government.
Central banks are the biggest Gold holders. In their aim to support their currencies in turbulent times, central banks tend to diversify their reserves and buy Gold to improve the perceived strength of the economy and the currency. High Gold reserves can be a source of trust for a country’s solvency. Central banks added 1,136 tonnes of Gold worth around $70 billion to their reserves in 2022, according to data from the World Gold Council. This is the highest yearly purchase since records began. Central banks from emerging economies such as China, India and Turkey are quickly increasing their Gold reserves.
Gold has an inverse correlation with the US Dollar and US Treasuries, which are both major reserve and safe-haven assets. When the Dollar depreciates, Gold tends to rise, enabling investors and central banks to diversify their assets in turbulent times. Gold is also inversely correlated with risk assets. A rally in the stock market tends to weaken Gold price, while sell-offs in riskier markets tend to favor the precious metal.
The price can move due to a wide range of factors. Geopolitical instability or fears of a deep recession can quickly make Gold price escalate due to its safe-haven status. As a yield-less asset, Gold tends to rise with lower interest rates, while higher cost of money usually weighs down on the yellow metal. Still, most moves depend on how the US Dollar (USD) behaves as the asset is priced in dollars (XAU/USD). A strong Dollar tends to keep the price of Gold controlled, whereas a weaker Dollar is likely to push Gold prices up.
- GBP/JPY gets comfortable near 198.00 as Guppy traders wait for a reason to move.
- BoJ and BoE rate calls due this week, UK rate cut expected.
- JPY traders on the lookout for signs of a shift from BoJ, confirmation of “Yenterventions”.
GBP/JPY is in the process of drawing a second straight spinning top daily candle on Monday as Guppy traders await signals to move in either direction with rate decisions from both the Bank of Japan (BoJ) and the Bank of England (BoE) on the books for this week.
The BoE is broadly expected to deliver a quarter-point rate trim later this week on Thursday, but odds are still up in the air with the Monetary Policy Committee (MPC) forecast to vote 5–to-4 in favor of a 25 bps rate cut. At the BoE’s previous rate meeting, the MPC voted 7-to-2 in favor of keeping rate cuts on hold.
The BoJ is also due for a rate call this week and slated for the early Wednesday market session, but markets have broadly lower expectations for the Japanese central bank. The BoJ remains bound and determined to keep Japanese interest rates at or near zero until they figure out a way to spark healthy, long-run inflation near 2%, and steadily declining Japanese inflation figures are keeping rate hikes at bay even as headline inflation figures continue to run above the 2% target.
Market participants will also be looking for official confirmation from BoJ officials that the Japanese central bank stepped directly into foreign currency markets to defend the beleaguered Yen, which was abruptly bolstered in several sessions in recent weeks.
GBP/JPY technical outlook
The Guppy is set to price in a second straight spinning top daily candle as investors await changes in the rate differential between the Pound Sterling and the Yen. GBP/JPY bottomed out near the 196.00 handle after a series of suspected “Yenterventions” dragged the pair down nearly 6% from 16-year highs at 208.11.
The Guppy is still trading in bull territory north of the 200-day Exponential Moving Average (EMA) at 192.71, but buyers will have to work hard to push bids back above the 50-day EMA at 201.00.
GBP/JPY daily chart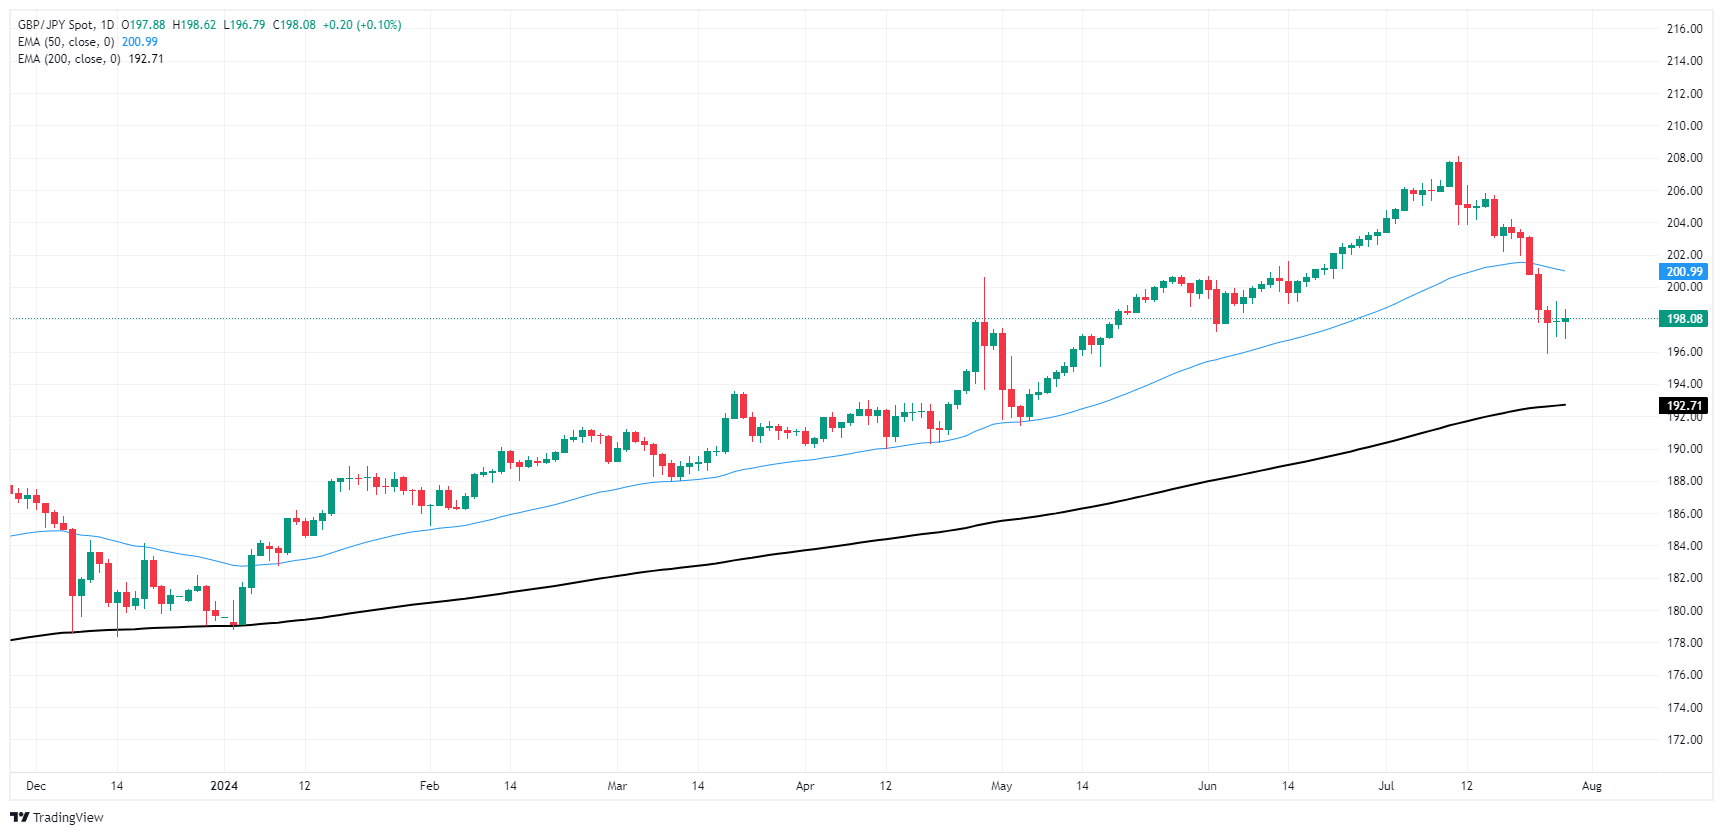
Pound Sterling FAQs
The Pound Sterling (GBP) is the oldest currency in the world (886 AD) and the official currency of the United Kingdom. It is the fourth most traded unit for foreign exchange (FX) in the world, accounting for 12% of all transactions, averaging $630 billion a day, according to 2022 data. Its key trading pairs are GBP/USD, aka ‘Cable’, which accounts for 11% of FX, GBP/JPY, or the ‘Dragon’ as it is known by traders (3%), and EUR/GBP (2%). The Pound Sterling is issued by the Bank of England (BoE).
The single most important factor influencing the value of the Pound Sterling is monetary policy decided by the Bank of England. The BoE bases its decisions on whether it has achieved its primary goal of “price stability” – a steady inflation rate of around 2%. Its primary tool for achieving this is the adjustment of interest rates. When inflation is too high, the BoE will try to rein it in by raising interest rates, making it more expensive for people and businesses to access credit. This is generally positive for GBP, as higher interest rates make the UK a more attractive place for global investors to park their money. When inflation falls too low it is a sign economic growth is slowing. In this scenario, the BoE will consider lowering interest rates to cheapen credit so businesses will borrow more to invest in growth-generating projects.
Data releases gauge the health of the economy and can impact the value of the Pound Sterling. Indicators such as GDP, Manufacturing and Services PMIs, and employment can all influence the direction of the GBP. A strong economy is good for Sterling. Not only does it attract more foreign investment but it may encourage the BoE to put up interest rates, which will directly strengthen GBP. Otherwise, if economic data is weak, the Pound Sterling is likely to fall.
Another significant data release for the Pound Sterling is the Trade Balance. This indicator measures the difference between what a country earns from its exports and what it spends on imports over a given period. If a country produces highly sought-after exports, its currency will benefit purely from the extra demand created from foreign buyers seeking to purchase these goods. Therefore, a positive net Trade Balance strengthens a currency and vice versa for a negative balance.
- Aussie kicks off the week on soft note ahead of key data.
- Retail Sales and Inflation figures will guide market expectations.
- Economic concerns over China limit the Aussie’s upside.
The AUD saw a further decline against the USD on Monday as AUD/USD fell to 0.6545. Despite the expectations of a future rate hike by the Reserve Bank of Australia (RBA), issues with the local economy and Chinese economic woes persist, preventing any significant upward movement.
As the Australian economy shows signs of weakness, the persistent high inflation has prompted the Reserve Bank of Australia (RBA) to delay rate cuts. As per the current forecasts, the RBA stands to be among the last G10 nations to introduce a rate cut, potentially extending the gains of the AUD, but the economic concerns also push the currency down.
Daily digest market movers: Aussie looks weak ahead of Inflation and Retail Sales data
- The risk-off sentiment continues to dominate with Australia's economic climate being influenced by concerns over Chinese economic stress.
- This week, investors will be eyeing Australian June Q2 CPI data, due to be released on Wednesday.
- For Q2, the headline CPI is expected to match Q1's rise of 1.0% QoQ and accelerate to 3.8% YoY from 3.6% in Q1. Meanwhile, the June headline CPI is anticipated to fall to 3.8% YoY.
- With the inflation rate still above the 2-3% target range, the RBA is unlikely to rush toward a policy change. The swaps market predicts stability for the rest of the year with the first significant 25 bps cut expected next summer.
- Tuesday will also see Q2's Retail sales data release. Retail Sales volume is expected to show a less severe decline of 0.2% QoQ in Q2, compared to 0.4% in Q1.
AUD/USD Technical analysis: Bearish outlook underpins, the pair lies below major SMAs
The AUD/USD's movement below the 20,100 and 200-day Simple Moving Averages (SMAs) signals concern, indicating a probable persistence of the downward trend. In July, the pair recorded an extensive nine-day losing streak and fell nearly 3.50%.
Indicator signals are deeply entrenched in the negative, but the oversold scenario may stimulate a correction. However, the bulls' momentum remains weak, and technicals suggest a sideways trade period rather than an upsurge, barring any fundamental catalysts.
Key support levels line up at 0.6530 and 0.6500, while resistance levels lie at 0.6600 (200-day SMA), 0.6610 and 0.6630.
Australian Dollar FAQs
One of the most significant factors for the Australian Dollar (AUD) is the level of interest rates set by the Reserve Bank of Australia (RBA). Because Australia is a resource-rich country another key driver is the price of its biggest export, Iron Ore. The health of the Chinese economy, its largest trading partner, is a factor, as well as inflation in Australia, its growth rate and Trade Balance. Market sentiment – whether investors are taking on more risky assets (risk-on) or seeking safe-havens (risk-off) – is also a factor, with risk-on positive for AUD.
The Reserve Bank of Australia (RBA) influences the Australian Dollar (AUD) by setting the level of interest rates that Australian banks can lend to each other. This influences the level of interest rates in the economy as a whole. The main goal of the RBA is to maintain a stable inflation rate of 2-3% by adjusting interest rates up or down. Relatively high interest rates compared to other major central banks support the AUD, and the opposite for relatively low. The RBA can also use quantitative easing and tightening to influence credit conditions, with the former AUD-negative and the latter AUD-positive.
China is Australia’s largest trading partner so the health of the Chinese economy is a major influence on the value of the Australian Dollar (AUD). When the Chinese economy is doing well it purchases more raw materials, goods and services from Australia, lifting demand for the AUD, and pushing up its value. The opposite is the case when the Chinese economy is not growing as fast as expected. Positive or negative surprises in Chinese growth data, therefore, often have a direct impact on the Australian Dollar and its pairs.
Iron Ore is Australia’s largest export, accounting for $118 billion a year according to data from 2021, with China as its primary destination. The price of Iron Ore, therefore, can be a driver of the Australian Dollar. Generally, if the price of Iron Ore rises, AUD also goes up, as aggregate demand for the currency increases. The opposite is the case if the price of Iron Ore falls. Higher Iron Ore prices also tend to result in a greater likelihood of a positive Trade Balance for Australia, which is also positive of the AUD.
The Trade Balance, which is the difference between what a country earns from its exports versus what it pays for its imports, is another factor that can influence the value of the Australian Dollar. If Australia produces highly sought after exports, then its currency will gain in value purely from the surplus demand created from foreign buyers seeking to purchase its exports versus what it spends to purchase imports. Therefore, a positive net Trade Balance strengthens the AUD, with the opposite effect if the Trade Balance is negative.
The persistent risk-off sentiment propelled the Greenback to multi-day highs on Monday, while investors have started to warm up ahead of key central bank events and crucial US data releases.
Here is what you need to know on Tuesday, July 30:
The USD Index (DXY) regained upside traction and rose to multi-day peaks near 104.80 amidst diminishing US yields. The Consumer Confidence gauged by the Conference Board takes centre stage on July 30 along the June JOLTs Job Openings, the FHFA’s House Price Index, and the weekly report on US crude oil inventories by the API.
EUR/USD came under renewed downside pressure and put the 1.0800 support to the test amidst the marked rebound in the Greenback. Germany’s advanced Inflation Rate is expected on July 30 seconded by preliminary Q2 GDP Growth Rate in Germany and the broader Euroland.
GBP/USD traded in an inconclusive fashion and ended Monday’s session barely changed near 1.2860. The next risk event on the UK docket will be the BoE interest rate decision on August 1.
Fresh selling pressure in the Japanese yen propped up the rebound in USD/JPY beyond the 154.00 barrier. Japan’s Unemployment Rate will be published on July 30.
AUD/USD resumed its decline and rapidly left behind Friday’s bullish attempt. On July 30, advanced Building Permits are only due in Australia.
Prices of WTI accelerated their downward trend and reached fresh seven-week lows near the $75.00 mark per barrel.
The Dollar’s rebound kept Gold prices depressed near $2,380 per ounce troy on Monday. Silver followed suit and retreated to two-month lows near $27.30 per ounce.
- Dow Jones churns chart paper as investors jostle for position ahead of Fed.
- Fed set to hold rates steady this week, markets on the lookout for forward guidance.
- Investors have fully priced in a rate trim in September.
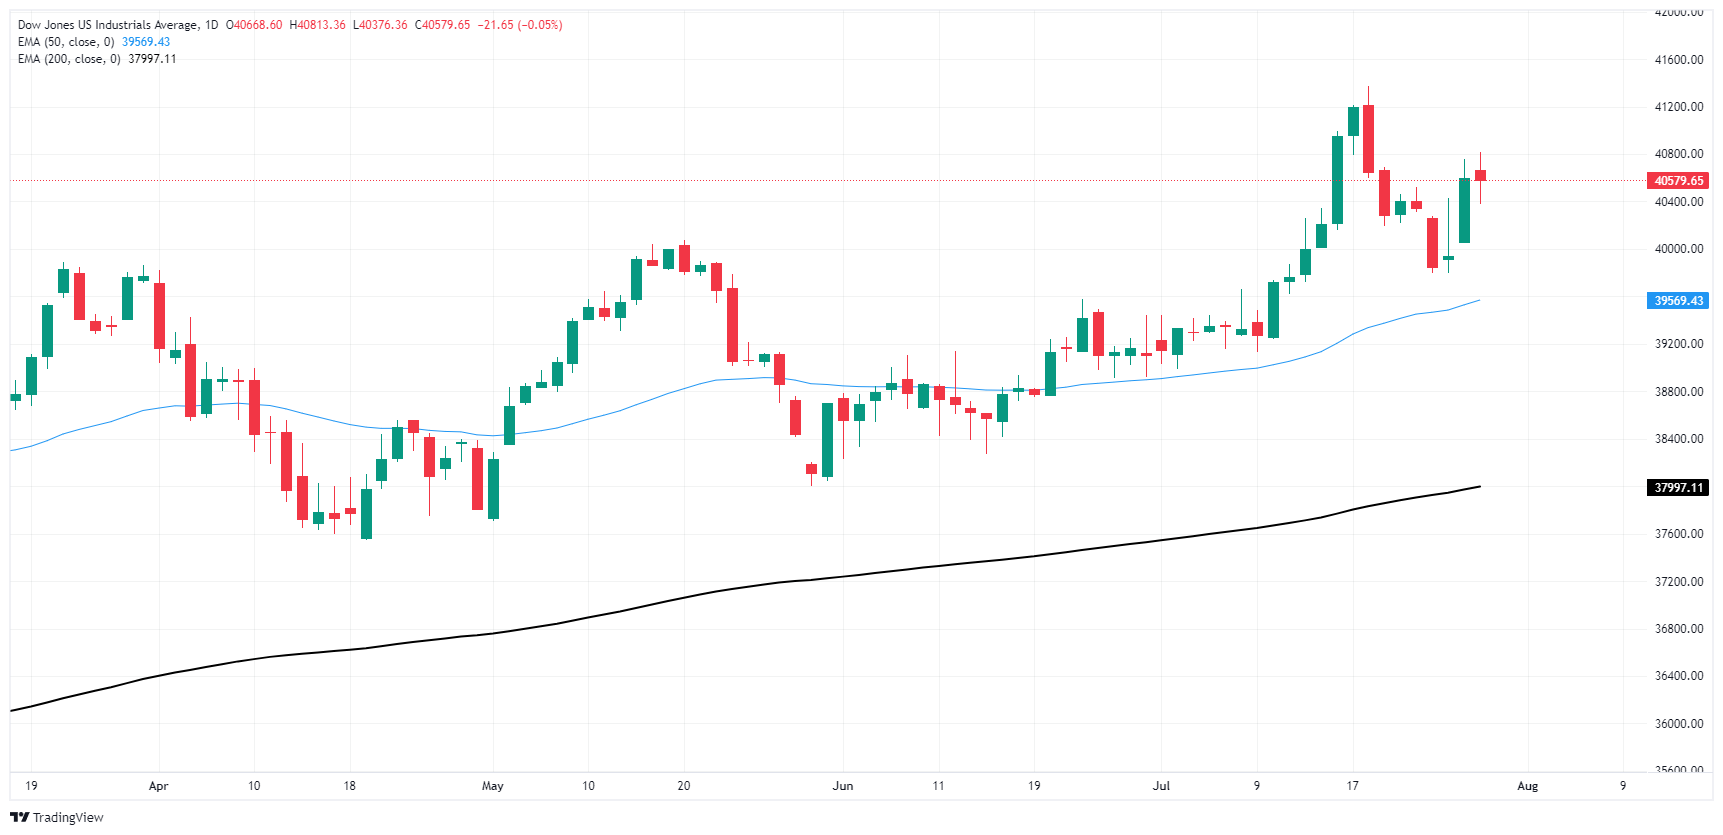
The Dow Jones Industrial Average (DJIA) spun in circles on Monday, churning around 40,600.00 as investors buckle down for the wait to the Federal Reserve’s (Fed) latest rate call. The Fed is broadly expected to hold rates steady on Wednesday, but markets will be keeping an eye out for any adjustments to forward guidance ahead of the key September rate call.
The Fed’s upcoming rate call on Wednesday will be closely watched as investors look for signs that the Fed is on pace to deliver a hotly-anticipated rate cut when the Federal Open Market Comittee (FOMC) convenes again in September. Markets are broadly anticipating at least a quarter-point rate cut on September 18, with rate markets pricing in 90% odds of a 25 bps trim and hopeful 10% bets for a double-cut according to the CME’s FedWatch Tool.
US Nonfarm Payrolls (NFP) are also due on Friday, a key component of the Fed’s employment mandate and investors will be looking for a continued cooling in hiring figures to help keep pushing the Fed into a new rate-cutting cycle in September. ADP Employment Change figures for July will be published on Wednesday, and will serve as a forecast for Friday’s NFP jobs report, albeit a shaky one with a spotty track record for accuracy.
Dow Jones news
The Dow Jones is stuck in the midrange amid quiet Monday trading, with roughly half of the index in the green for the day and the other half easing into the low end. McDonald’s Inc. (MCD) reported a miss in quarterly revenue and earnings per share, but the stock rallied 4.4% and rose above $263.00 per share as the company vows to make more efforts to engage in competition by taking a “forensic look” at pricing options and expects per-restaurant traffic to increase with the addition of value offerings.
Dow Jones technical outlook
The Dow Jones is holding steady near the 40,600.00 handle on Monday, cycling in a tight range for the day as investors grapple with keeping a near-term recovery on-balance. The DJIA briefly tumbled below the 40,000.00 major price handle last week after US markets pulled back from record highs.
The Dow Jones dug in its heels to put in a fresh near-term bottom near 37.395.00, but is still trading on the low side of recent record highs set at 41,371.38. Long-term momentum still leans firmly into the bullish side as the Dow Jones trades well above the 200-day Exponential Moving Average (EMA) at 38,011.80.
Dow Jones daily chart
Dow Jones FAQs
The Dow Jones Industrial Average, one of the oldest stock market indices in the world, is compiled of the 30 most traded stocks in the US. The index is price-weighted rather than weighted by capitalization. It is calculated by summing the prices of the constituent stocks and dividing them by a factor, currently 0.152. The index was founded by Charles Dow, who also founded the Wall Street Journal. In later years it has been criticized for not being broadly representative enough because it only tracks 30 conglomerates, unlike broader indices such as the S&P 500.
Many different factors drive the Dow Jones Industrial Average (DJIA). The aggregate performance of the component companies revealed in quarterly company earnings reports is the main one. US and global macroeconomic data also contributes as it impacts on investor sentiment. The level of interest rates, set by the Federal Reserve (Fed), also influences the DJIA as it affects the cost of credit, on which many corporations are heavily reliant. Therefore, inflation can be a major driver as well as other metrics which impact the Fed decisions.
Dow Theory is a method for identifying the primary trend of the stock market developed by Charles Dow. A key step is to compare the direction of the Dow Jones Industrial Average (DJIA) and the Dow Jones Transportation Average (DJTA) and only follow trends where both are moving in the same direction. Volume is a confirmatory criteria. The theory uses elements of peak and trough analysis. Dow’s theory posits three trend phases: accumulation, when smart money starts buying or selling; public participation, when the wider public joins in; and distribution, when the smart money exits.
There are a number of ways to trade the DJIA. One is to use ETFs which allow investors to trade the DJIA as a single security, rather than having to buy shares in all 30 constituent companies. A leading example is the SPDR Dow Jones Industrial Average ETF (DIA). DJIA futures contracts enable traders to speculate on the future value of the index and Options provide the right, but not the obligation, to buy or sell the index at a predetermined price in the future. Mutual funds enable investors to buy a share of a diversified portfolio of DJIA stocks thus providing exposure to the overall index.
- Mexican Peso falls to seven-week low as trade deficit hits worst level since August 2020.
- INEGI data shows Mexican exports and imports plunged, with exports contracting 5.7% YoY.
- Upcoming US economic reports and FOMC decision expected to keep USD/MXN rally alive.
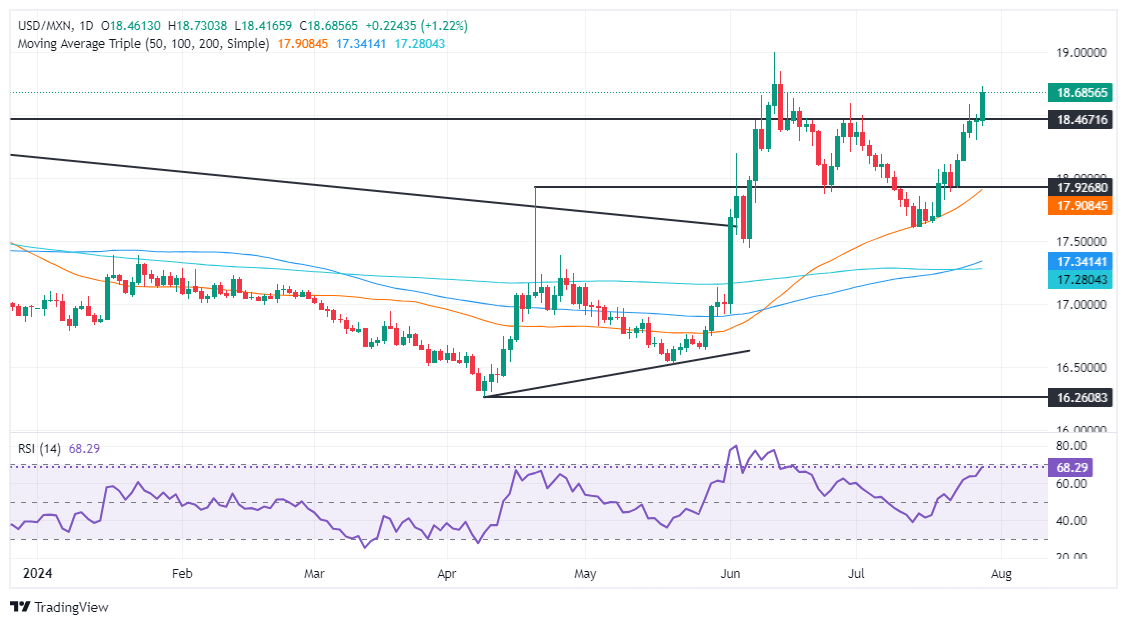
The Mexican Peso depreciated sharply as the week began after data revealed Mexico’s Balance of Trade deficit widened — its worst reading since August 2020, according to data revealed by the Instituto Nacional de Estadistica, Geografia e Informatica (INEGI). This, along with the strength of the US Dollar, keeps the USD/MXN trading at 18.67, gaining more than 1.20%.
INEGI revealed that Mexico’s Exports and Imports plunged, though the former contracted -5.7% YoY, the steepest drop in 46 months. The data weighed on the Mexican Peso, which weakened to a seven-week low as the USD/MXN accelerates toward testing the year-to-date (YTD) high of 18.99.
The US economic docket will be busy. Market participants prepare for the Federal Open Market Committee (FOMC) monetary policy decision, the release of the Institute for Supply Management (ISM) Manufacturing PMI, and the Nonfarm Payrolls (NFP) report, both figures for August and July, respectively.
This and month-end flows favoring the Greenback will likely keep the USD/MXN exotic pair upwardly pressured. Although the FOMC is expected to hold rates unchanged and lay the ground for the Federal Reserve's (Fed) first interest rate cut, investors underpinned the buck ahead of the decision.
MUFG Bank wrote in a note, “The unwind of high-yielding Latam FX carry trades over the past week has also been triggered by more risk-off trading conditions.” Wall Street confirmed this, with most US equity indices retreating from all-time highs, while safe-haven currencies like the Japanese Yen, the Swiss Franc and the Greenback advanced.
Daily digest market movers: Mexican Peso undermined by wider deficit
- Mexico’s Balance of Trade in June was $-1.073 billion, missing the consensus of $1 billion.
- According to Citi Research, analysts now estimate that annual inflation will end at 4.30%, up from the previous forecast of 4.20%, with core inflation expected to finish 2024 at 4.0%. Mexico's economic growth is projected to slow with an expected growth rate of 1.9%, down from 2.0% in the last poll.
- Last week’s US inflation data suggested that progress toward lowering it to 2% continues, yet it seems stickier than expected after June’s Core PCE figures were above estimates in monthly and yearly figures.
- USD/MXN traders are awaiting the release of JOLTs Job Openings for June, ahead of the ADP Employment Change and FOMC’s decision on Wednesday.
- Data by the Chicago Board of Trade (CBOT) shows that traders are pricing in 54 basis points (bps) of easing toward the end of the year, as shown by the December 2024 fed funds rate futures contract.
Technical analysis: Mexican Peso extends losses as USD/MXN closes to 18.70
The uptrend continues, as shown by the USD/MXN hitting the 18.70 mark due to month-end flows and risk-aversion, which has undermined high-yielding currencies like the Peso. Momentum is bullish, confirmed by the Relative Strength Index (RSI) reading above the 50-neutral line.
If bulls challenge the YTD high at 18.99, that could open the door to test 19.00. Once surpassed, the next resistance would be the March 20, 2023, peak at 19.23 before challenging 19.50.
Conversely, if USD/MXN retreats beneath 18.00, that would pave the way to challenge the 50-day Simple Moving Average (SMA) at 17.89, the first support level. The next support would be the latest cycle low of 17.58; the July 12 high turned support. A breach of the latter will expose the January 23 peak at 17.38.
Mexican Peso FAQs
The Mexican Peso (MXN) is the most traded currency among its Latin American peers. Its value is broadly determined by the performance of the Mexican economy, the country’s central bank’s policy, the amount of foreign investment in the country and even the levels of remittances sent by Mexicans who live abroad, particularly in the United States. Geopolitical trends can also move MXN: for example, the process of nearshoring – or the decision by some firms to relocate manufacturing capacity and supply chains closer to their home countries – is also seen as a catalyst for the Mexican currency as the country is considered a key manufacturing hub in the American continent. Another catalyst for MXN is Oil prices as Mexico is a key exporter of the commodity.
The main objective of Mexico’s central bank, also known as Banxico, is to maintain inflation at low and stable levels (at or close to its target of 3%, the midpoint in a tolerance band of between 2% and 4%). To this end, the bank sets an appropriate level of interest rates. When inflation is too high, Banxico will attempt to tame it by raising interest rates, making it more expensive for households and businesses to borrow money, thus cooling demand and the overall economy. Higher interest rates are generally positive for the Mexican Peso (MXN) as they lead to higher yields, making the country a more attractive place for investors. On the contrary, lower interest rates tend to weaken MXN.
Macroeconomic data releases are key to assess the state of the economy and can have an impact on the Mexican Peso (MXN) valuation. A strong Mexican economy, based on high economic growth, low unemployment and high confidence is good for MXN. Not only does it attract more foreign investment but it may encourage the Bank of Mexico (Banxico) to increase interest rates, particularly if this strength comes together with elevated inflation. However, if economic data is weak, MXN is likely to depreciate.
As an emerging-market currency, the Mexican Peso (MXN) tends to strive during risk-on periods, or when investors perceive that broader market risks are low and thus are eager to engage with investments that carry a higher risk. Conversely, MXN tends to weaken at times of market turbulence or economic uncertainty as investors tend to sell higher-risk assets and flee to the more-stable safe havens.
- US Dollar displays strength ahead of Wednesday Fed decision and labor market data
- Fed is expected to remain data-dependant but leave door open for September cut
- Markets are extremely confident about a September cut of 25 bps
The US Dollar represented by the DXY index charged forward on Monday despite looming uncertainties. The market remains on edge with September's potential rate cut by the Federal Reserve (Fed) somewhat uncertain, but optimism surrounding the US economy's strength is tempering anxieties. The Fed decision on Wednesday and labor market data will guide markets this week.
There is growing evidence of disinflation in the current US economic landscape, which solidifies the market's belief in a prospective rate cut in September. However, the broader economy demonstrates strength, as is made evident by recent data surprises like the Q2 Gross Domestic Product (GDP) and July S&P Global PMIs, which might give the Fed reasons not to rush a rate cut.
Daily digest market movers: US Dollar firms ahead of July labor data and FOMC meeting
- Two-day FOMC meeting concludes on Wednesday with a plausible commitment to unchanged rates
- Market players recognize the solid performance of the US economy warrants no immediate action by the Fed, but September FOMC meeting is predicted to bring a potential rate cut into the spotlight
- Chair Powell's press conference has the potential to sway markets, but his precedent of focusing on labor market uncertainty is likely to continue
- In that sense, labor market data to be released throughout the week will guide market bets regarding the September decision
DXY technical outlook: Bearish signs stall as index inches toward 20-day SMA
Pushing past initial signs of struggle, DXY Index is now rebounding from 200-day Simple Moving Average (SMA). The 20-day SMA is now viewed as the next target. However, key indicators such as the Relative Strength Index (RSI) and Moving Average Convergence Divergence (MACD), though still in the red, are inching toward positive terrain.
Continued support is noted at 104.30 and 104.15 levels, while resistances are observed at 104.60 and 104.80 levels.
US Dollar FAQs
The US Dollar (USD) is the official currency of the United States of America, and the ‘de facto’ currency of a significant number of other countries where it is found in circulation alongside local notes. It is the most heavily traded currency in the world, accounting for over 88% of all global foreign exchange turnover, or an average of $6.6 trillion in transactions per day, according to data from 2022. Following the second world war, the USD took over from the British Pound as the world’s reserve currency. For most of its history, the US Dollar was backed by Gold, until the Bretton Woods Agreement in 1971 when the Gold Standard went away.
The most important single factor impacting on the value of the US Dollar is monetary policy, which is shaped by the Federal Reserve (Fed). The Fed has two mandates: to achieve price stability (control inflation) and foster full employment. Its primary tool to achieve these two goals is by adjusting interest rates. When prices are rising too quickly and inflation is above the Fed’s 2% target, the Fed will raise rates, which helps the USD value. When inflation falls below 2% or the Unemployment Rate is too high, the Fed may lower interest rates, which weighs on the Greenback.
In extreme situations, the Federal Reserve can also print more Dollars and enact quantitative easing (QE). QE is the process by which the Fed substantially increases the flow of credit in a stuck financial system. It is a non-standard policy measure used when credit has dried up because banks will not lend to each other (out of the fear of counterparty default). It is a last resort when simply lowering interest rates is unlikely to achieve the necessary result. It was the Fed’s weapon of choice to combat the credit crunch that occurred during the Great Financial Crisis in 2008. It involves the Fed printing more Dollars and using them to buy US government bonds predominantly from financial institutions. QE usually leads to a weaker US Dollar.
Quantitative tightening (QT) is the reverse process whereby the Federal Reserve stops buying bonds from financial institutions and does not reinvest the principal from the bonds it holds maturing in new purchases. It is usually positive for the US Dollar.
- The Canadian Dollar eased against key counter-currencies to start the new week.
- Canada is sparsely represented on the economic calendar this week.
- Mid-tier Canadian data leaves the CAD at the mercy of key central bank appearances.
The Canadian Dollar (CAD) softened on Monday, falling behind an uptick in the Greenback as investors jostle for position ahead of the Federal Reserve’s (Fed) upcoming rate call later in the week. The CAD is under-represented on the economic calendar this week, and a hefty batch of central bank appearances through the midweek will leave the Canadian Dollar at the mercy of broader market flows.
With a lean economic data docket on the cards, CAD traders will be looking ahead to Wednesday’s Canadian Gross Domestic Product (GDP) for the month of May, expected to ease to 0.1% MoM from April’s 0.3% as Canada’s economy continues to slow. S&P Global Canadian Manufacturing Purchasing Managers Index (PMI) figures for June are slated for Thursday, which have consistently printed in contraction territory below 50.0 since May of 2023.
Daily digest market movers: Canadian Dollar takes a backseat to central bank expectations
- The Canadian Dollar is on pace to shed weight against the US Dollar for a ninth consecutive session, and has declined against the Greenback for all but one of the last 13 straight trading days.
- After the Bank of Canada (BoC) delivered another quarter-point rate trim last week, CAD traders are immediately pivoting to focus on the odds of yet another rate cut from the BoC in September, with odds currently priced in at roughly even.
- The US Federal Reserve will be the market mover this week as markets clamor for a 25-basis-point rate cut in the near future.
- The Fed is fully priced in as a hold on rates this week, but traders will be looking for verbal cues from Fed Chairman Jerome Powell regarding September’s rate call.
- According to the CME’s FedWatch Tool, rate traders have fully priced in 100% odds of at least a quarter-point cut when the Federal Open Market Committee gathers on September 18.
Canadian Dollar PRICE Today
The table below shows the percentage change of Canadian Dollar (CAD) against listed major currencies today. Canadian Dollar was the strongest against the Euro.
| USD | EUR | GBP | JPY | CAD | AUD | NZD | CHF | |
|---|---|---|---|---|---|---|---|---|
| USD | 0.37% | 0.15% | 0.18% | 0.18% | 0.16% | 0.37% | 0.29% | |
| EUR | -0.37% | -0.26% | -0.18% | -0.17% | -0.17% | -0.02% | -0.06% | |
| GBP | -0.15% | 0.26% | 0.04% | 0.05% | 0.09% | 0.25% | 0.19% | |
| JPY | -0.18% | 0.18% | -0.04% | -0.03% | 0.00% | 0.19% | 0.14% | |
| CAD | -0.18% | 0.17% | -0.05% | 0.03% | 0.02% | 0.17% | 0.13% | |
| AUD | -0.16% | 0.17% | -0.09% | -0.00% | -0.02% | 0.18% | 0.10% | |
| NZD | -0.37% | 0.02% | -0.25% | -0.19% | -0.17% | -0.18% | -0.06% | |
| CHF | -0.29% | 0.06% | -0.19% | -0.14% | -0.13% | -0.10% | 0.06% |
The heat map shows percentage changes of major currencies against each other. The base currency is picked from the left column, while the quote currency is picked from the top row. For example, if you pick the Canadian Dollar from the left column and move along the horizontal line to the US Dollar, the percentage change displayed in the box will represent CAD (base)/USD (quote).
Technical analysis: Another day, another green candle for USD/CAD
The Canadian Dollar (CAD) gave a lopsided performance on Monday as traders look elsewhere for inspiration. The CAD fell back roughly one-fifth of one percent against the Greenback, while backsliding one-third of one percent against the recovering Japanese Yen. Gains remain thin, with the CAD rising a scant one-sixth of one percent against the Euro and the New Zealand Dollar.
USD/CAD continues to march up the charts, chalking in a ninth straight gain as the Canadian Dollar slides against the Greenback. The pair has risen 2% since hitting a near-term low of 1.3589, sparking a rally after a technical rejection from the 200-day Exponential Moving Average (EMA).
USD/CAD daily chart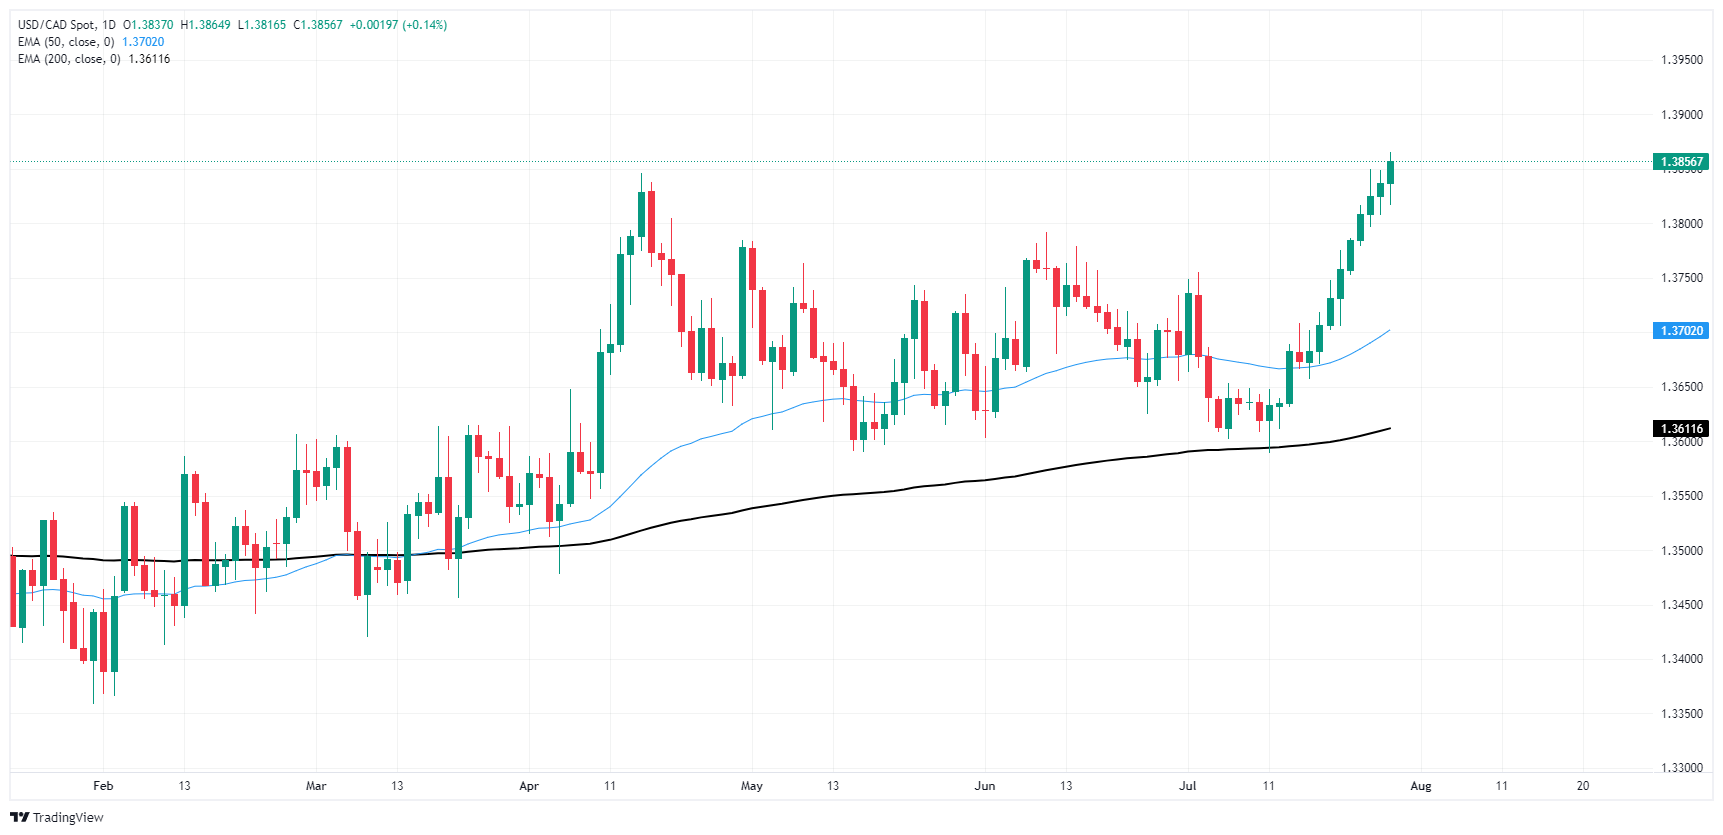
Canadian Dollar FAQs
The key factors driving the Canadian Dollar (CAD) are the level of interest rates set by the Bank of Canada (BoC), the price of Oil, Canada’s largest export, the health of its economy, inflation and the Trade Balance, which is the difference between the value of Canada’s exports versus its imports. Other factors include market sentiment – whether investors are taking on more risky assets (risk-on) or seeking safe-havens (risk-off) – with risk-on being CAD-positive. As its largest trading partner, the health of the US economy is also a key factor influencing the Canadian Dollar.
The Bank of Canada (BoC) has a significant influence on the Canadian Dollar by setting the level of interest rates that banks can lend to one another. This influences the level of interest rates for everyone. The main goal of the BoC is to maintain inflation at 1-3% by adjusting interest rates up or down. Relatively higher interest rates tend to be positive for the CAD. The Bank of Canada can also use quantitative easing and tightening to influence credit conditions, with the former CAD-negative and the latter CAD-positive.
The price of Oil is a key factor impacting the value of the Canadian Dollar. Petroleum is Canada’s biggest export, so Oil price tends to have an immediate impact on the CAD value. Generally, if Oil price rises CAD also goes up, as aggregate demand for the currency increases. The opposite is the case if the price of Oil falls. Higher Oil prices also tend to result in a greater likelihood of a positive Trade Balance, which is also supportive of the CAD.
While inflation had always traditionally been thought of as a negative factor for a currency since it lowers the value of money, the opposite has actually been the case in modern times with the relaxation of cross-border capital controls. Higher inflation tends to lead central banks to put up interest rates which attracts more capital inflows from global investors seeking a lucrative place to keep their money. This increases demand for the local currency, which in Canada’s case is the Canadian Dollar.
Macroeconomic data releases gauge the health of the economy and can have an impact on the Canadian Dollar. Indicators such as GDP, Manufacturing and Services PMIs, employment, and consumer sentiment surveys can all influence the direction of the CAD. A strong economy is good for the Canadian Dollar. Not only does it attract more foreign investment but it may encourage the Bank of Canada to put up interest rates, leading to a stronger currency. If economic data is weak, however, the CAD is likely to fall.
Recent decline in USD/JPY shows tentative signs of taking a pause but the decline has also seen a recoupling of USD/JPY back to UST-JGB yield differentials, OCBC FX strategists Frances Cheung and Christopher Wong note.
USD/JPY trades bearishly towards the 153.66 support
“During the period of May - Jul, USD/JPY has gone one way higher while UST-JGB yield differentials narrowed – a decoupling of its traditionally positive correlation – which was unusual. The recent sharp decline in USD/JPY has somewhat reset that anomaly. And if we do expect USD/JPY to play catchup to the historical correlation with UST-JGB yield differentials, then USDJPY may still have room to trade lower.”
“The combination of BoJ policy normalization and Fed possibly cutting rate in due course is a case of monetary policy convergence and should underpin USD/JPY downside. The risk is that BoJ fails to live up to expectations and USDJPY risks a sharp correction upwards. Bearish momentum on daily chart intact while RSI fell into near oversold conditions.”
Cautious of rebound risks for USDJPY from oversold conditions but at the same time, JPY shorts remain at record and uncertainty may see continued unwinding of stretched short position in JPY. Bias to fade rallies. Resistance at 155.50 (100 DMA), 156.80 (76.4% fibo). Support at 153.66 (61.8% fibo retracement of 2024 low to high), 151.60 (200DMA) and 151.10 (50% fibo).
DXY started the week on a softer footing as risk sentiments held up for Asian equities, OCBC FX strategists Frances Cheung and Christopher Wong note.
Closing in on the 104.80 resistance
“Focus this week on JOLTS report (Tue), ADP employment (Wed), FOMC (Thu 2am SGT), ISM mfg (Thu) and payrolls report (Fri). Markets will keep a look out on whether the tightness in labour markets continue to ease and on FOMC, what the guidance may be. Markets expect the Fed to lay the groundwork for a Sep cut especially with data coming in softer and Fed’s rhetoric turning less hawkish.”
“The US Dollar (USD) bears would face disappointment if Fed restraints dovish guidance. That said, the bigger driver for USD would be on payrolls report and the next few inflation readings – to get a sense of the possible extent of rate cuts. Another surprise for the USD would be an unexpected Fed cut at the upcoming FOMC.”
“Bearish momentum on daily chart faded but RSI shows signs of turning lower. Bearish crossover observed earlier as 21 DMA cuts 50, 100 DMAs to the downside. Support at 103.98 (50% fibo), 103.65 (recent low) and 103.20 (38.2% fibo). Resistance at 104.80/90 (61.8% fibo retracement of Oct high to 2024 low, 21, 50, 100 DMAs), 105.40 levels.”
USD/JPY plunged from 162 to 152 in the fortnight to July 25. The sell-off was triggered by the third decline in US CPI inflation fuelling bets for a Fed cut in September, suspected currency interventions from the Bank of Japan, and US Republican presidential candidate Donald Trump’s decrying of the JPY’s massive weakness, DBS senior FX strategist Philip Wee notes.
JPY carry trade continues to unwind
“Japan sees an opportunity to reverse the JPY’s weak fortunes at this week’s BOJ-FOMC meetings on July 31. The Liberal Democratic Party believes that the JPY’s multi-decade lows sank the Kishida Cabinet’s approval ratings by adding to the consumers’ cost of living crisis and hurting small and midsize companies via higher raw and energy prices.”
“Over the weekend, Japan successfully pushed for the G20 joint communique to include the commitment against excessive foreign exchange volatility. Given the potential for a dovish Fed tilt, the BOJ will need to heed the call by LDP Secretary-General Toshimitsu Motegi for an unequivocal resolve to normalize monetary policy.”
“We see the BOJ halving its monthly JGB purchases to JPY 3 trillion but markets want the BOJ to hike rates a second time this year.”
The DXY Index was volatile last week, trading in a tight 104.1-104.6 range, due to conflicting currency market themes, DBS senior FX strategist Philip Wee notes.
Fed to keep the door open to lower interest rates
“Despite the futures market pricing a more than 100% chance for a Fed cut in September, the USD’s outlook was obscured by the twists and turns in the US Presidential Elections and the unwinding of JPY carry trades. Additionally, the JPY and the CHF became havens amid a sell-off in tech stocks.”
“At its FOMC meeting on July 30-31, the Fed should keep the door open to lower interest rates but avoid endorsing the market’s bet for a September cut. The guidance on the timing will likely come at the Kansas City Fed’s Jackson Hole Symposium on August 24-26, following the US unemployment rate data on August 2 and the CPI data on August 14.”
The Pound Sterling (GBP) edged lower in Asian trade but steadied and recovered somewhat in European dealing, Scotiabank’s chief FX strategist Shaun Osborne notes.
GBP/USD is steadying around the low 1.28 area
“UK data reports earlier reflected more or less as expected lending and mortgage approvals but the CBI’s (volatile) retail survey data looked soft for July. Swaps are pricing in marginally more risk of a rate cut this week (14bps) than last week (when pricing indicated 10-11bps of easing risk factored in).”
“GBP’s drift from the mid-July peak above 1.30 suggests some rate cut potential may already be factored in to spot.”
“Spot retains a soft undertone but losses may be steadying around the low 1.28 area (50% retracement support from the June/July rally). Regaining 1.29 intraday would be a positive but it is possible that the soft undertone will persist for another few days and perhaps extend to 1.2775 or so before steadying.”
The Euro (EUR) is tracking a little weaker on the session but losses are limited and Euro (EUR) dips to the low 1.08 area remain well-supported, Scotiabank’s chief FX strategist Shaun Osborne notes.
Loss of support in the low 1.08s is likely
“More range trading seems likely in the near-term. While markets are mainly focused on central bank developments elsewhere this week, key Eurozone data prints—GDP, inflation—may provide some insight into the ECB policy outlook and influence spot movement to some degree.”
“Flat trading over the past four sessions for the EUR has defined a clear range trade between 1.0825 support and 1.070/75 resistance. The lower end of the range is bolstered by a gently rising 200-day MA at 1.0820.”
“Loss of support in the low 1.08s would suggest more weakness to the 1.0725/75 range in the short run. Intraday trend momentum is bearish but the daily and weekly studies remain bullishly-aligned which should help prop up the lower end of the trading range for a bit longer at least.”
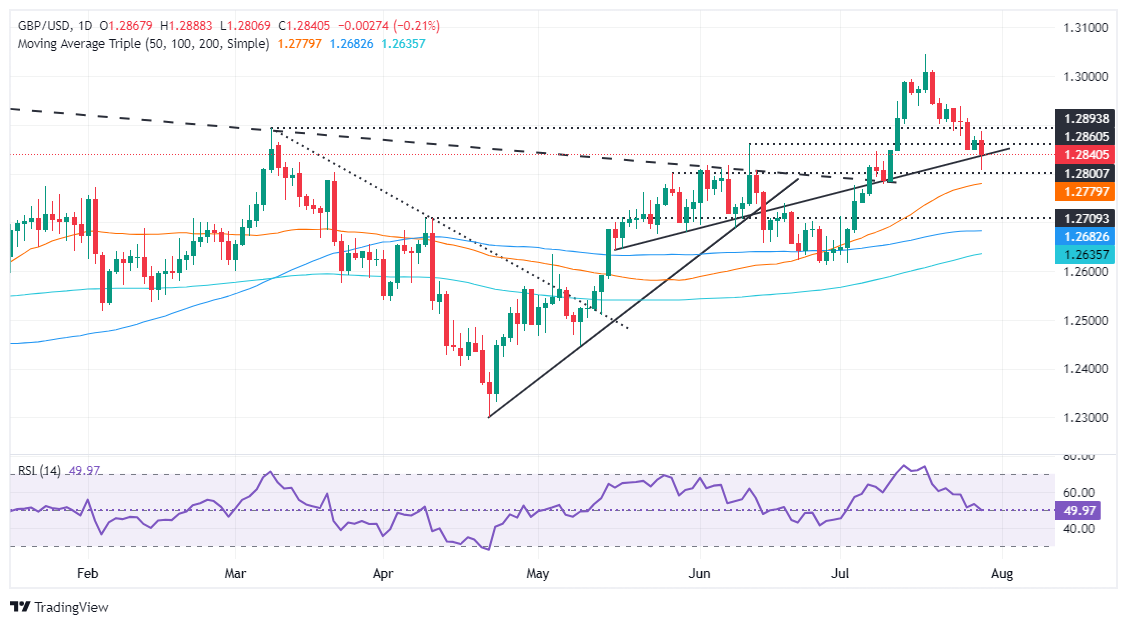
- GBP/USD retreats 1.70% from YTD high of 1.3043, trading at 1.2826.
- Technical outlook shows bearish momentum, with key support at 1.2800 and potential further losses to 1.2612-1.2622 area.
- Buyers need to push past 1.2893 to challenge 1.2900 and higher resistance levels.
The GBP/USD begins the week on the back foot ahead of the Bank of England’s monetary policy decision on August 1. Market participants seem convinced that the BoE would cut interest rates, yet the odds are around 59%. The pair trades at 1.2826, down 0.28%
GBP/USD Price Analysis: Technical outlook
The GBP/USD extended its losses after hitting a year-to-date (YTD) high of 1.3043, retreating some 1.70%, clearing some support levels. However, further losses beneath 1.2800 could drive the price toward the confluence of the June 27 cycle low and the 200-day moving average (DMA) at around the 1.2612-1.2622 area.
Momentum shows sellers are in charge, as depicted in the Relative Strength Index (RSI), turning bearish, with a downward slope and under the 50-neutral line.
Therefore, the first support for GBP/USD would be the 1.2800 mark, followed by the 50-DMA at 1.2778. Once cleared, the next stop would be the 100-DMA at 1.2681, followed by the aforementioned area.
Conversely, if buyers moved in and pushed the exchange rate past the March 8 peak at 1.2893, that could pave the way to challenge 1.2900 and higher prices.
GBP/USD Price Action – Daily Chart
Pound Sterling FAQs
The Pound Sterling (GBP) is the oldest currency in the world (886 AD) and the official currency of the United Kingdom. It is the fourth most traded unit for foreign exchange (FX) in the world, accounting for 12% of all transactions, averaging $630 billion a day, according to 2022 data. Its key trading pairs are GBP/USD, aka ‘Cable’, which accounts for 11% of FX, GBP/JPY, or the ‘Dragon’ as it is known by traders (3%), and EUR/GBP (2%). The Pound Sterling is issued by the Bank of England (BoE).
The single most important factor influencing the value of the Pound Sterling is monetary policy decided by the Bank of England. The BoE bases its decisions on whether it has achieved its primary goal of “price stability” – a steady inflation rate of around 2%. Its primary tool for achieving this is the adjustment of interest rates. When inflation is too high, the BoE will try to rein it in by raising interest rates, making it more expensive for people and businesses to access credit. This is generally positive for GBP, as higher interest rates make the UK a more attractive place for global investors to park their money. When inflation falls too low it is a sign economic growth is slowing. In this scenario, the BoE will consider lowering interest rates to cheapen credit so businesses will borrow more to invest in growth-generating projects.
Data releases gauge the health of the economy and can impact the value of the Pound Sterling. Indicators such as GDP, Manufacturing and Services PMIs, and employment can all influence the direction of the GBP. A strong economy is good for Sterling. Not only does it attract more foreign investment but it may encourage the BoE to put up interest rates, which will directly strengthen GBP. Otherwise, if economic data is weak, the Pound Sterling is likely to fall.
Another significant data release for the Pound Sterling is the Trade Balance. This indicator measures the difference between what a country earns from its exports and what it spends on imports over a given period. If a country produces highly sought-after exports, its currency will benefit purely from the extra demand created from foreign buyers seeking to purchase these goods. Therefore, a positive net Trade Balance strengthens a currency and vice versa for a negative balance.
The Canadian Dollar (CAD) is little changed on the day and, with little domestic data of note out in the coming days, is likely to remain a bit of a sideshow for markets focusing more intently on developments elsewhere, Scotiabank’s chief FX strategist Shaun Osborne notes.
A test of 1.39 seems on its way
“Factors have moved unfavorably for the CAD in the past few weeks but trends may be stabilizing in the short run, which will help steady spot just below the recent peaks. A dovish-leaning Fed might be the CAD’s best hope for picking up some ground in the short run but if it is, it won’t be by much.”
“After the USD’s sustained rally over the past couple of weeks—culminating in eight consecutive daily gains through last Friday—the scope for further (immediate) CAD losses is limited in the very short run.”
“But the broader technical tone of the USD remains firm—momentum signals are aligned bullishly on the short-, medium– and long-term DMI studies. Now, USD/CAD pushes towards 1.39. Support is 1.3750/75.”
- Silver price hovers around $28.00 with Fed policy meeting in focus.
- The Fed is expected to cut interest rates in September.
- Renewed risks of Middle East tensions improve safe-haven appeal.
Silver price (XAG/USD) trades in a tight range near $28.00 in Monday’s North American trading session. The white metal stays on the sidelines with a focus on the Federal Reserve’s (Fed) monetary policy decision, which will be announced on Wednesday.
The precious metal steadies amid firm speculation that the Fed will deliver a dovish guidance on interest rates with an unchanged decision leaving them at their current level for the eighth time in a row. The Fed is expected to acknowledge that inflation has returned to the path of 2% with some progress and will highlight upside risks to labor market conditions.
Meanwhile, renewed risks of widening Middle East woes have also offered a temporary cushion to the Silver price. The precious metals, such as Gold and Silver, tends to perform better amid geopolitical uncertainty. The safe-haven appeal of the US Dollar (USD) has also improved. The US Dollar Index (USD), which tracks the Greenback’s value against six major currencies, jumps to a fresh two-high high to near 104.70.
10-year US Treasury yields slump to 4.18% on expectations that the Fed will start reducing interest rates from the September meeting. Lower yields on interest-bearing assets reduces the opportunity cost of holding an investment in non-yielding assets, such as Silver.
Silver technical analysis
Silver price weakens after a breakdown of the Double Top formation below June 26 low near $28.60 on a daily timeframe. A breakdown of the aforementioned chart pattern results in a bearish crossover. The Silver price is expected to find a temporary cushion near the 200-day Exponential Moving Average (EMA), which trades around $26.86.
The 14-day Relative Strength Index (RSI) shifts into the bearish range of 20.00-40.00, suggesting that a bearish momentum is intact.
Silver daily chart
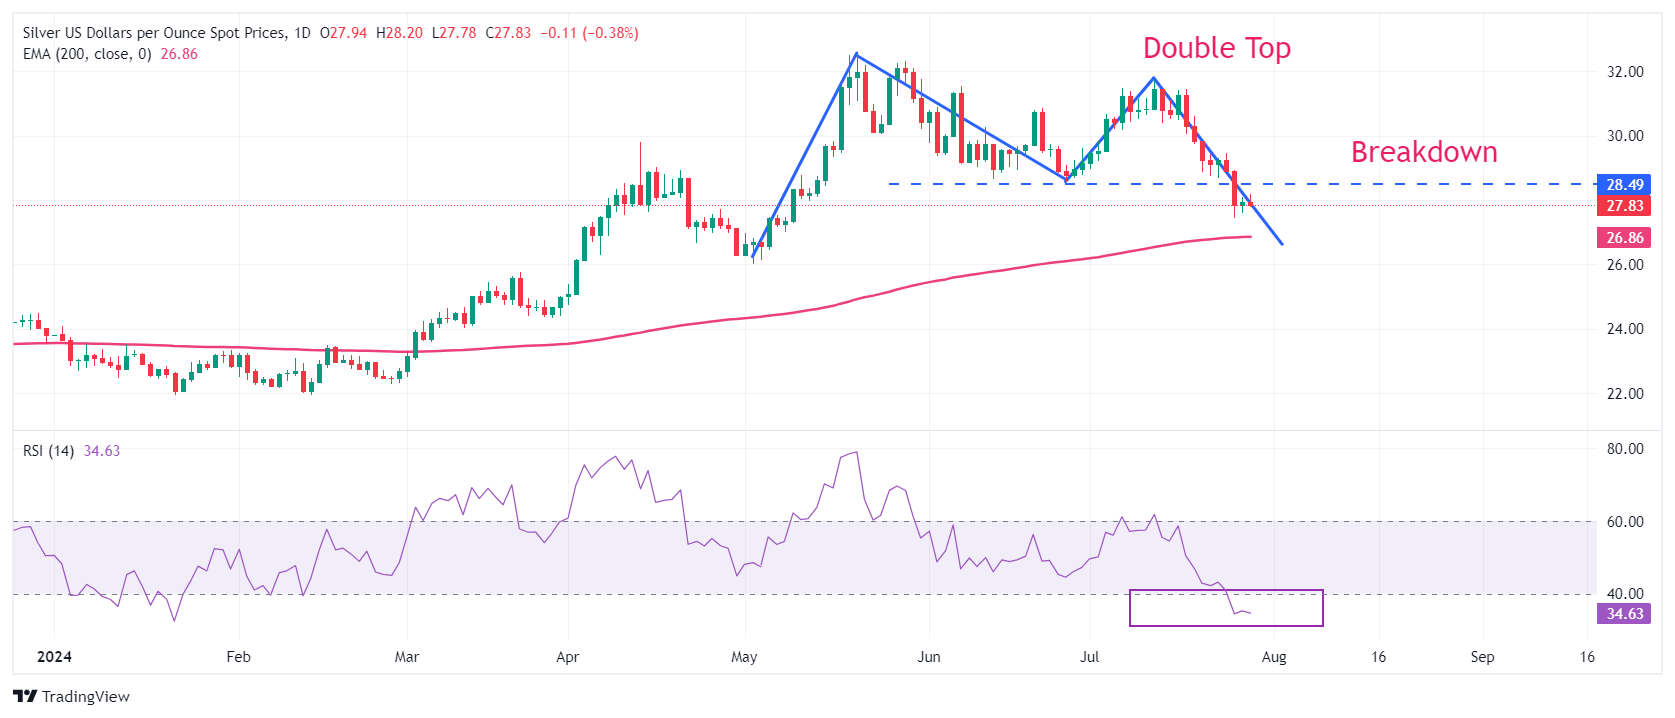
Silver FAQs
Silver is a precious metal highly traded among investors. It has been historically used as a store of value and a medium of exchange. Although less popular than Gold, traders may turn to Silver to diversify their investment portfolio, for its intrinsic value or as a potential hedge during high-inflation periods. Investors can buy physical Silver, in coins or in bars, or trade it through vehicles such as Exchange Traded Funds, which track its price on international markets.
Silver prices can move due to a wide range of factors. Geopolitical instability or fears of a deep recession can make Silver price escalate due to its safe-haven status, although to a lesser extent than Gold's. As a yieldless asset, Silver tends to rise with lower interest rates. Its moves also depend on how the US Dollar (USD) behaves as the asset is priced in dollars (XAG/USD). A strong Dollar tends to keep the price of Silver at bay, whereas a weaker Dollar is likely to propel prices up. Other factors such as investment demand, mining supply – Silver is much more abundant than Gold – and recycling rates can also affect prices.
Silver is widely used in industry, particularly in sectors such as electronics or solar energy, as it has one of the highest electric conductivity of all metals – more than Copper and Gold. A surge in demand can increase prices, while a decline tends to lower them. Dynamics in the US, Chinese and Indian economies can also contribute to price swings: for the US and particularly China, their big industrial sectors use Silver in various processes; in India, consumers’ demand for the precious metal for jewellery also plays a key role in setting prices.
Silver prices tend to follow Gold's moves. When Gold prices rise, Silver typically follows suit, as their status as safe-haven assets is similar. The Gold/Silver ratio, which shows the number of ounces of Silver needed to equal the value of one ounce of Gold, may help to determine the relative valuation between both metals. Some investors may consider a high ratio as an indicator that Silver is undervalued, or Gold is overvalued. On the contrary, a low ratio might suggest that Gold is undervalued relative to Silver.
EUR/USD can trade on the strong side this week on the back of the US events. One-month historical volatility on the pair is now back at the 2024 lows, as the Euro (EUR) has been broadly unresponsive to both soft domestic surveys and the equity and carry trade-driven positioning adjustments in FX. However, if something can shake EUR/USD from this mid-summer low-volatility torpor, that should be the Fed and/or US data, ING’s FX strategist Francesco Pesole notes.
GDP and CPI data comes into focus
“Some tier-one figures in the eurozone are also due this week. The second quarter GDP report tomorrow is expected to show still-tepid 0.5% year-on-year growth, but it will be the flash CPI estimate on Wednesday that should have a greater market impact. The latest European Central Bank meeting has put greater emphasis on data dependence as President Christine Lagarde ditched forward guidance.”
“The expected slowdown from 2.9% to 2.8% in July’s core CPI should not be enough to lead markets to price in more than the 55bp of 2024 easing already in the EUR OIS curve. Incidentally, core inflation has beaten consensus in five of the seven flash estimates since the start of the year.”
“We continue to expect downward corrections in EUR/NOK and EUR/SEK, with the Norwegian currency probably having more room to recover given a stronger rate profile and fundamentals. In Sweden, second quarter GDP surprised on the downside this morning, falling 0.8% quarter-on-quarter and probably keeping pressure on the Riksbank to cut rates despite a weak krona.”
Central banks and macro data have taken an unusual secondary role for FX markets as US politics, stock markets turmoil and some sizeable positioning adjustments generated volatility in some pairs inconsistent with macro developments, ING’s FX strategist Francesco Pesole notes.
A move below 104.0 for DXY is imminent
“In the US, the two main events of the week are the FOMC rate announcement on Wednesday and the July jobs report on Friday. The June dot plot projections look unreasonably hawkish given the recent data flow and market pricing, and we expect the Fed to pivot towards a more dovish stance in line with recent commentary and in anticipation of a potential September cut.”
“Markets are already pricing in easing quite aggressively in the US. A September cut is fully factored in and 68bp in total is expected by year-end. We can surely see markets adding easing bets across the curve following a dovish hold but we admit there is a chance that Fed Chair Jerome Powell errs on the side of caution and delivers a less dovish (and USD-positive) communication package this week.”
“Anyway, when adding the downside risks from jobs figures on Friday and a potential surprise hike by the BoJ, we have a bearish bias on DXY this week, and wouldn’t be surprised to see a move below 104.0.”
- USD/CHF moves higher to near 0.8850 as the US Dollar posts a fresh two-week high.
- The Fed is expected to begin reducing interest rates in September.
- USD/CHF trades in a Falling Channel chart pattern.
The USD/CHF pair climbs to near 0.8850 in Monday’s New York session. The Swiss Franc asset gains as the US Dollar (USD) rises amid uncertainty ahead of the Federal Reserve’s (Fed) interest rate decision, which will be announced on Wednesday.
The US Dollar Index (DXY), which tracks the Greenback’s value against six major currencies, posts a fresh two-week high around 104.60. The Fed is expected to maintain a status quo for the eighth straight time as inflationary pressures is higher than the desired rate of 2%. While the Fed has made some decent progress in disinflation recently, which will force policymakers to discuss on rate cuts.
Currently, financial markets see the Fed beginning to reduce interest rates from the September meeting and following the trend one more time to November or December.
Meanwhile, the Swiss Franc will be influenced by the Consumer Price Index (CPI) data for July, which will be published later on Friday. The monthly CPI is estimated to have deflated by 0.2% after remaining unchanged in June. This will boost expectations of more rate cuts by the Swiss National Bank (SNB).
USD/CHF bounces back strongly from the lower boundary of the Falling Channel formation, on a daily timeframe, in which each pullback move is considered as selling opportunity by market participants. The 20-day Exponential Moving Average (EMA) near 0.8900 continues to act as major barricade for the US Dollar bulls.
The 14-period Relative Strength Index (RSI) attempts to return inside the 40.00-60.00 range. A bearish momentum would come to an end if the RSI manages to do the same. However, the overall trend will continue to remain bearish.
Going forward, a decisive break above the round-level resistance of 0.8900 will unlock the upside towards July 17 high at 0.8945, followed by the psychological resistance of 0.9000.
In an alternate scenario, a downside move below July 25 low at 0.8777 would expose the asset to March 8 low near 0.8730 and the round-level support of 0.8700.
USD/CHF daily chart
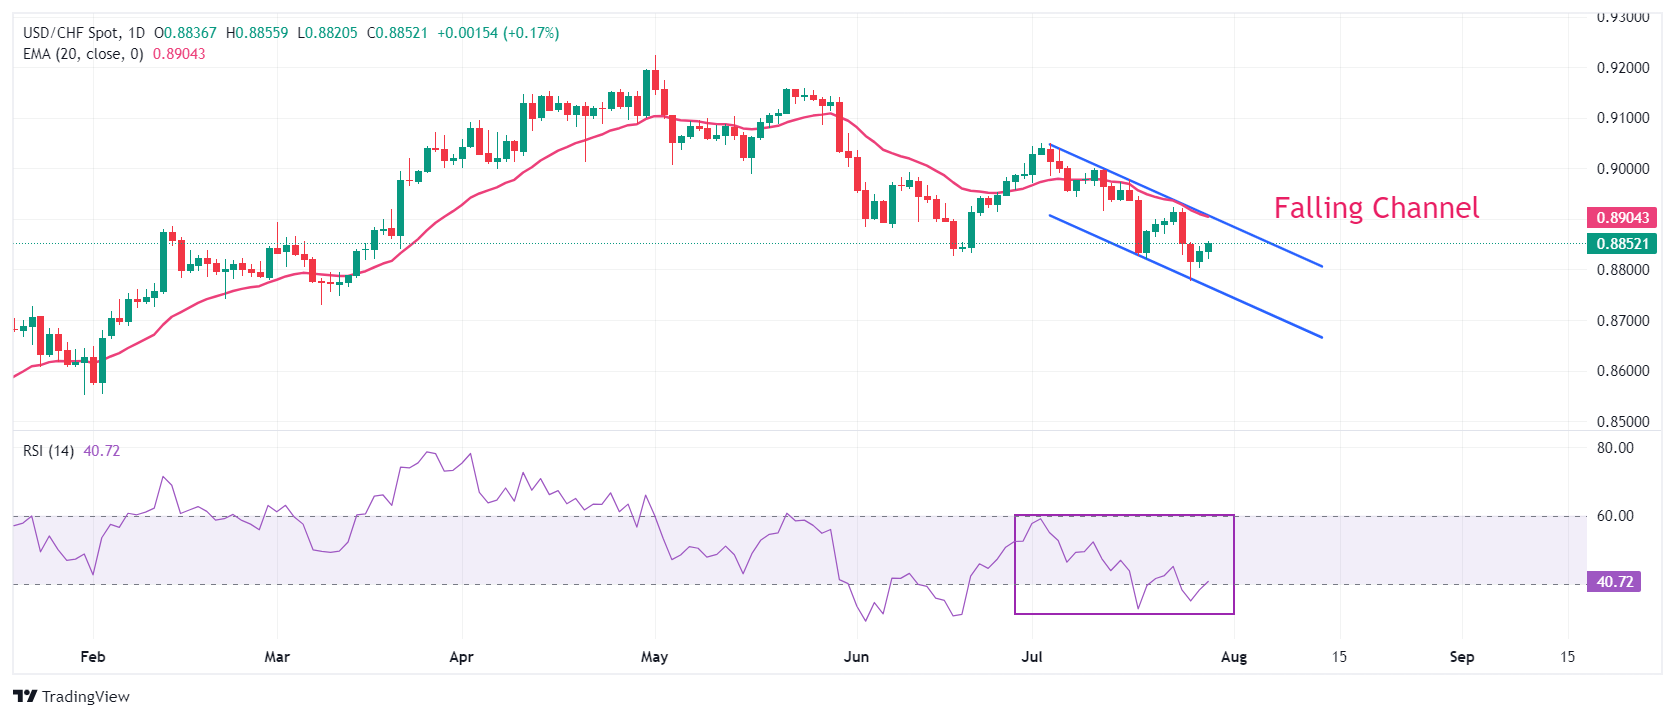
Swiss Franc FAQs
The Swiss Franc (CHF) is Switzerland’s official currency. It is among the top ten most traded currencies globally, reaching volumes that well exceed the size of the Swiss economy. Its value is determined by the broad market sentiment, the country’s economic health or action taken by the Swiss National Bank (SNB), among other factors. Between 2011 and 2015, the Swiss Franc was pegged to the Euro (EUR). The peg was abruptly removed, resulting in a more than 20% increase in the Franc’s value, causing a turmoil in markets. Even though the peg isn’t in force anymore, CHF fortunes tend to be highly correlated with the Euro ones due to the high dependency of the Swiss economy on the neighboring Eurozone.
The Swiss Franc (CHF) is considered a safe-haven asset, or a currency that investors tend to buy in times of market stress. This is due to the perceived status of Switzerland in the world: a stable economy, a strong export sector, big central bank reserves or a longstanding political stance towards neutrality in global conflicts make the country’s currency a good choice for investors fleeing from risks. Turbulent times are likely to strengthen CHF value against other currencies that are seen as more risky to invest in.
The Swiss National Bank (SNB) meets four times a year – once every quarter, less than other major central banks – to decide on monetary policy. The bank aims for an annual inflation rate of less than 2%. When inflation is above target or forecasted to be above target in the foreseeable future, the bank will attempt to tame price growth by raising its policy rate. Higher interest rates are generally positive for the Swiss Franc (CHF) as they lead to higher yields, making the country a more attractive place for investors. On the contrary, lower interest rates tend to weaken CHF.
Macroeconomic data releases in Switzerland are key to assessing the state of the economy and can impact the Swiss Franc’s (CHF) valuation. The Swiss economy is broadly stable, but any sudden change in economic growth, inflation, current account or the central bank’s currency reserves have the potential to trigger moves in CHF. Generally, high economic growth, low unemployment and high confidence are good for CHF. Conversely, if economic data points to weakening momentum, CHF is likely to depreciate.
As a small and open economy, Switzerland is heavily dependent on the health of the neighboring Eurozone economies. The broader European Union is Switzerland’s main economic partner and a key political ally, so macroeconomic and monetary policy stability in the Eurozone is essential for Switzerland and, thus, for the Swiss Franc (CHF). With such dependency, some models suggest that the correlation between the fortunes of the Euro (EUR) and the CHF is more than 90%, or close to perfect.
- Kiwi sellers return to test year-to-date lows at 0.5970-60.
- The sour market mood is weighing on the risk-0sensitive NZD.
- Below 1.5960, the next bearish target is the 2023 low, at 0.5770.
Kiwi’s feeble recovery attempt seen on Friday has been short-lived, and the has resumed its bearish trend on Monday. Sellers showed up at 0.5900 to send the pair towards the 0.5870-60 support area, which is being tested at the moment.
The US Dollar is firming up across the board with geopolitical concerns weighing investors' mood. This will keep the risk-sensitive Kiwi on the defensive.
Technical indicators are strongly bearish, with the 4h RSI (14) close but not yet at oversold levels. Below 0.5760, the next target would be the 2023 low, at 0.5770. This is also the 261.8% Fibonacci extension of the June sell-off, which is a common exhaustion level.
Resistances are the mentioned 1.5900 and 0.5955.
NZD/USD 4-hour chart
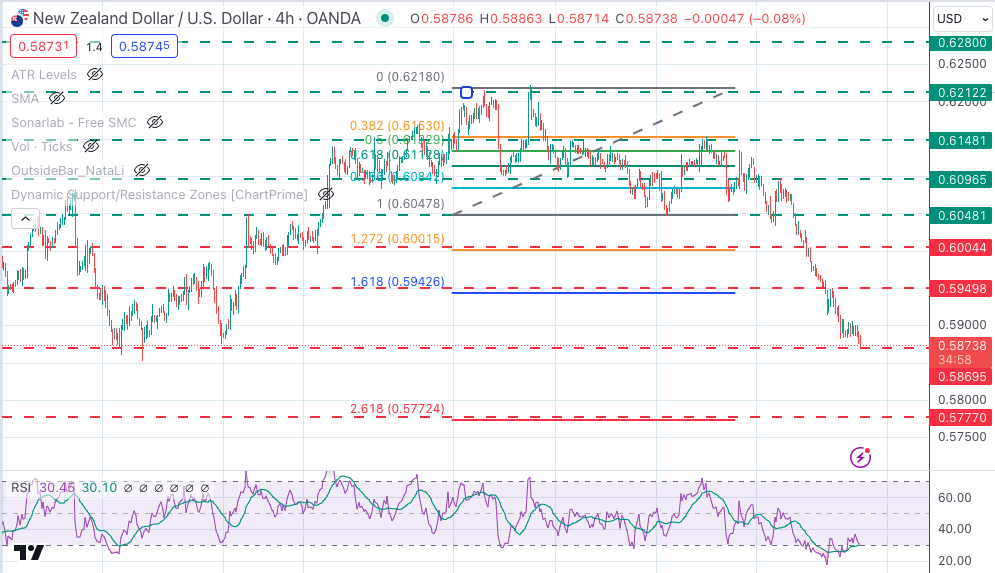
The consensus among economists has recently shifted in favour of a Bank of England rate cut at the upcoming policy meeting on Thursday. This has been ING’s longstanding view. It is a close call, but they expect a 6-3 vote split in favour of a 25bp rate cut, ING’s FX analyst Francesco Pesole notes.
GBP/USD to contract in short term
“Markets have remained more hawkish than consensus, having kept the pricing for the August meeting within 14bp for the past month, and are currently expecting 13bp. We think there is some mispricing also on the year-end tenor, which currently sees 52bp of cuts against our call for 75bp. If the BoE does cut this week, then expectations may shift for two extra moves.”
“We had already seen reasons for a contraction in GBP/USD and a rally in EUR/GBP based on inconsistencies with rate differentials. We think that some US Dollar (USD) weakness can limit Cable’s downside, and favour EUR/GBP to display weakness in the pound this week. We still believe that a move to 0.850+ would be entirely warranted in the near term.”
There’s a reason to be skeptical about further Pound Sterling (GBP) strength. Even though, there is much to be said for a stronger pound at the moment – stubborn inflation, a recovering real economy and the hopes associated with the new Labour government. Much of the positive case is based on hope – basically, GBP is in a kind of honeymoon phase. But these hopes have to be realised first, Commerzbank’s FX analyst Michael Pfister notes.
GBP has less reasons to be bullish
“There are two events this week that should provide an initial assessment of where GBP is heading. Later today, the new government is expected to have to plug a £20 billion hole in the new budget. Although the parties are blaming each other for the situation, filling this hole is likely to require difficult decisions. The autumn budget is likely to be the main focus.”
“Also, Bank of England's (BoE) meeting on Thursday is likely to be of particular importance for GBP. Our economists believe that the BoE is likely to initiate a turnaround on interest rates, given that the headline rate has recently been on target. Much will depend on how the BoE justifies such a move. It would probably have to sound quite cautious in order to keep GBP supported.”
“There are definitely some risk factors for the GBP this week. This is not to say that we are not bullish on the GBP in the medium term. It's just that we have to factor into our forecast the risks of a more dovish BoE and a weakening real economy, as well as the problems facing the Labour government.”
- The Dollar remains capped below 1.3850 with the upside bias intact.
- A moderate rebound in Oil prices has given some support to the CAD earlier today.
- USD/CAD remains bullish, with the support area above 1.3800 holding bears for now.
US Dollar’s rally remains capped below 1.3850. The pair failed to break that level on its latest attempt on Monday and is trimming gains during the European session, yet with downside attempts looking weak so far.
The Canadian Dollar has drawn some support from a previous rebound in Crude prices, triggered by escalating tensions in the Middle East. Israel has launched strikes in Lebanon as a response to a deadly attack from the Hizbullah on the weekend. This might inflame an already unsteady region and threaten the Oil supply.
On the other hand, the Fed is meeting this week, with the market expecting a dovish turn on the bank’s rhetoric, which might increase negative pressure on the USD.
Dara released last week revealed that PCE inflation remained steady in June. The headline figure showed a 2.5% yearly increase, with the core PCE at 2.6%. These levels are close to the bank’s 2% target and confirm that inflation is gradually cooling, which keeps hopes of Fed easing alive.
The technical picture remains bullish, with downside attempts capped at the 1.3800-1.3820 area. Below there, 1.3750 would be the next target. Immediate resistance is at 1.3850 followed by the November 2023 high, at 1.3900.
WTI Oil FAQs
WTI Oil is a type of Crude Oil sold on international markets. The WTI stands for West Texas Intermediate, one of three major types including Brent and Dubai Crude. WTI is also referred to as “light” and “sweet” because of its relatively low gravity and sulfur content respectively. It is considered a high quality Oil that is easily refined. It is sourced in the United States and distributed via the Cushing hub, which is considered “The Pipeline Crossroads of the World”. It is a benchmark for the Oil market and WTI price is frequently quoted in the media.
Like all assets, supply and demand are the key drivers of WTI Oil price. As such, global growth can be a driver of increased demand and vice versa for weak global growth. Political instability, wars, and sanctions can disrupt supply and impact prices. The decisions of OPEC, a group of major Oil-producing countries, is another key driver of price. The value of the US Dollar influences the price of WTI Crude Oil, since Oil is predominantly traded in US Dollars, thus a weaker US Dollar can make Oil more affordable and vice versa.
The weekly Oil inventory reports published by the American Petroleum Institute (API) and the Energy Information Agency (EIA) impact the price of WTI Oil. Changes in inventories reflect fluctuating supply and demand. If the data shows a drop in inventories it can indicate increased demand, pushing up Oil price. Higher inventories can reflect increased supply, pushing down prices. API’s report is published every Tuesday and EIA’s the day after. Their results are usually similar, falling within 1% of each other 75% of the time. The EIA data is considered more reliable, since it is a government agency.
OPEC (Organization of the Petroleum Exporting Countries) is a group of 13 Oil-producing nations who collectively decide production quotas for member countries at twice-yearly meetings. Their decisions often impact WTI Oil prices. When OPEC decides to lower quotas, it can tighten supply, pushing up Oil prices. When OPEC increases production, it has the opposite effect. OPEC+ refers to an expanded group that includes ten extra non-OPEC members, the most notable of which is Russia.
- USD/JPY trades in a tight range above 156.00 with a focus on BoJ/Fed policy meetings.
- The BoJ is expected to raise interest rates by 10 bps and reveal bond-tapering plans.
- Investors see the Fed maintaining a status quo.
The USD/JPY pair trades back and forth in a tight range above the crucial support of 156.00 on Monday’s European session. The asset shifts to the sidelines with investors focusing on the interest rate announcements by the Bank of Japan (BoJ) and the Federal Reserve (Fed), which are scheduled for Wednesday.
The Japanese Yen (JPY) steadies after appreciating for straight three weeks against the US Dollar (USD) as its safe-haven appeal was upbeat amid political uncertainties in various economies and China’s economic woes.
Going forward, investors will focus on the BoJ meeting in which policymakers are expected to vote for hiking interest rates by 10 basis points (bps) in an attempt to pivot towards policy normalization. The BoJ will also unveil plans to taper bond-buying operations, which will add to an improvement in Yen’s appeal.
Meanwhile, slight recovery in the US Dollar has brought a temporary halt in major’s upside. The US Dollar Index (DXY), which tracks the Greenback’s value against six major currencies, moves higher to near 104.50.
The US Dollar rises as investors turn cautious ahead of the Fed’s monetary policy meeting in which officials are expected to leave interest rates unchanged in the range of 5.25%-5.50%. Investors will keenly focus on the interest rate guidance, which is expected to remain dovish. The Fed is expected to acknowledge progress in disinflation and highlight upside risks to labor market conditions.
Japanese Yen FAQs
The Japanese Yen (JPY) is one of the world’s most traded currencies. Its value is broadly determined by the performance of the Japanese economy, but more specifically by the Bank of Japan’s policy, the differential between Japanese and US bond yields, or risk sentiment among traders, among other factors.
One of the Bank of Japan’s mandates is currency control, so its moves are key for the Yen. The BoJ has directly intervened in currency markets sometimes, generally to lower the value of the Yen, although it refrains from doing it often due to political concerns of its main trading partners. The current BoJ ultra-loose monetary policy, based on massive stimulus to the economy, has caused the Yen to depreciate against its main currency peers. This process has exacerbated more recently due to an increasing policy divergence between the Bank of Japan and other main central banks, which have opted to increase interest rates sharply to fight decades-high levels of inflation.
The BoJ’s stance of sticking to ultra-loose monetary policy has led to a widening policy divergence with other central banks, particularly with the US Federal Reserve. This supports a widening of the differential between the 10-year US and Japanese bonds, which favors the US Dollar against the Japanese Yen.
The Japanese Yen is often seen as a safe-haven investment. This means that in times of market stress, investors are more likely to put their money in the Japanese currency due to its supposed reliability and stability. Turbulent times are likely to strengthen the Yen’s value against other currencies seen as more risky to invest in.
At the G20 meeting in Brazil on Friday, Japanese Vice Minister Masato Kanda again stressed that Japan must respond to ‘excessive movements’ in FX markets caused by speculators. Such statements suggest that the foreign exchange market is sometimes driven by speculators and that an exchange rate move is not fundamentally justified, Commerzbank’s FX analyst Michael Pfister notes.
Excessive Yen volatility is on the roll
“What pace is 'excessive' for policymakers in practice? At the end of April, the acceptable pace seemed to have been exceeded when the Japanese Ministry of Finance (MOF) ordered interventions. In the last full week of April, the USD/JPY went up by almost 2.3% and continued to do so seamlessly into the start of the following week. Yen had depreciated by just over 3% by the time policymakers reacted (apparently this was too much).”
“However, if we look at the movements in recent weeks, we see that the exchange rate is just as volatile as it was at the end of April, but the MOF is unlikely to apply the same standards. Since the MOF considers the yen to be fundamentally undervalued, an appreciation is not the same problem as a depreciation.”
“However, policymakers should not talk about ‘excessive movements’ when it is only the depreciation that is a thorn in their side. When the MOF intervenes, of course, it also triggers greater volatility. The devaluation at the end of April was followed by a week of extreme appreciation, followed by another significant devaluation. So, if that's not excessive movement, I don't know what is.”
- Gold eases with the US Dollar favoured by the fragile market mood.
- US Yields remain depressed on hopes that the Fed will signal a dovish turn on Wednesday.
- XAU/USD needs to break the $2,400 resistance to cancel the broader bearish structure.
Gold price (XAU/USD) is going through a moderate pullback on Monday’s European morning, weighed by a stronger US Dollar (USD), after finding resistance around the $2,400 earlier in the day. News reports that the Middle East conflict might spill into Lebanon are keeping investors on their heels and providing a competitive advantage for the safe-haven USD.
Geopolitical risks are overshadowing the highlight of the week, which is the Federal Reserve’s (Fed) meeting, due on Wednesday. The Personal Consumption Expenditures (PCE) Prices Index data for June, as seen on Friday, showed that inflation remains sticky, although at levels near the central bank’s 2% target. Investors remain hopeful that the easing cycle will start in September, and that the Fed might give hints on that direction after this week’s meeting.
On Tuesday, the US JOLTs Job Openings data for June and the Conference Board’s Consumer Sentiment Index for July are expected to show a moderate softening, adding to the case of a September rate cut.
Daily digest market movers: Gold buyers take a break as the fundamental picture muddles
-
Increasing geopolitical concerns, with Israel considering an attack in Lebanon, are fuelling the safe-haven US Dollar and weighing on Gold.
-
US benchmark 10-year Treasury yields are trading lower on the back of increasing hopes that the Fed will start cutting rates in September.
-
The CME Group’s Fed Watch tool is pricing a 95% chance that the Fed will keep rates on hold on Wednesday and a 100% chance of rate cuts in September.
-
On Tuesday, the Conference Board is expected to show that the Consumer Sentiment Index declined to 99.5 from 100.4 in the previous month.
-
Also on Tuesday, the US JOLTS Job Openings are expected to show a decline to 8.03 million in June from the 8.14 million openings seen in May.
Technical analysis: XAU/USD is capped below $2,400 with the immediate bullish bias intact
XAU/USD’s recovery from last week’s lows at around $2,350 has been capped at $2,400. This is an important resistance area as the 100-period Simple Moving Average (SMA) at the 4-hour chart meets downtrend resistance from the 17 July highs at that level, but downside attempts remain limited for now.
The intraday RSI shows a moderate positive momentum, with the $2,380 level holding bears for now. Below here, the next target is the July 25 low, at $2,350. On the upside, a confirmation above $2,400 would cancel the broader bearish structure and put $2,430 into focus.
Risk sentiment FAQs
In the world of financial jargon the two widely used terms “risk-on” and “risk off'' refer to the level of risk that investors are willing to stomach during the period referenced. In a “risk-on” market, investors are optimistic about the future and more willing to buy risky assets. In a “risk-off” market investors start to ‘play it safe’ because they are worried about the future, and therefore buy less risky assets that are more certain of bringing a return, even if it is relatively modest.
Typically, during periods of “risk-on”, stock markets will rise, most commodities – except Gold – will also gain in value, since they benefit from a positive growth outlook. The currencies of nations that are heavy commodity exporters strengthen because of increased demand, and Cryptocurrencies rise. In a “risk-off” market, Bonds go up – especially major government Bonds – Gold shines, and safe-haven currencies such as the Japanese Yen, Swiss Franc and US Dollar all benefit.
The Australian Dollar (AUD), the Canadian Dollar (CAD), the New Zealand Dollar (NZD) and minor FX like the Ruble (RUB) and the South African Rand (ZAR), all tend to rise in markets that are “risk-on”. This is because the economies of these currencies are heavily reliant on commodity exports for growth, and commodities tend to rise in price during risk-on periods. This is because investors foresee greater demand for raw materials in the future due to heightened economic activity.
The major currencies that tend to rise during periods of “risk-off” are the US Dollar (USD), the Japanese Yen (JPY) and the Swiss Franc (CHF). The US Dollar, because it is the world’s reserve currency, and because in times of crisis investors buy US government debt, which is seen as safe because the largest economy in the world is unlikely to default. The Yen, from increased demand for Japanese government bonds, because a high proportion are held by domestic investors who are unlikely to dump them – even in a crisis. The Swiss Franc, because strict Swiss banking laws offer investors enhanced capital protection.
Gold FAQs
Gold has played a key role in human’s history as it has been widely used as a store of value and medium of exchange. Currently, apart from its shine and usage for jewelry, the precious metal is widely seen as a safe-haven asset, meaning that it is considered a good investment during turbulent times. Gold is also widely seen as a hedge against inflation and against depreciating currencies as it doesn’t rely on any specific issuer or government.
Central banks are the biggest Gold holders. In their aim to support their currencies in turbulent times, central banks tend to diversify their reserves and buy Gold to improve the perceived strength of the economy and the currency. High Gold reserves can be a source of trust for a country’s solvency. Central banks added 1,136 tonnes of Gold worth around $70 billion to their reserves in 2022, according to data from the World Gold Council. This is the highest yearly purchase since records began. Central banks from emerging economies such as China, India and Turkey are quickly increasing their Gold reserves.
Gold has an inverse correlation with the US Dollar and US Treasuries, which are both major reserve and safe-haven assets. When the Dollar depreciates, Gold tends to rise, enabling investors and central banks to diversify their assets in turbulent times. Gold is also inversely correlated with risk assets. A rally in the stock market tends to weaken Gold price, while sell-offs in riskier markets tend to favor the precious metal.
The price can move due to a wide range of factors. Geopolitical instability or fears of a deep recession can quickly make Gold price escalate due to its safe-haven status. As a yield-less asset, Gold tends to rise with lower interest rates, while higher cost of money usually weighs down on the yellow metal. Still, most moves depend on how the US Dollar (USD) behaves as the asset is priced in dollars (XAU/USD). A strong Dollar tends to keep the price of Gold controlled, whereas a weaker Dollar is likely to push Gold prices up.
The Swiss franc (CHF) has benefited significantly from the global risk-off. In EUR/CHF terms, the spot has moved significantly closer to the levels seen before the last Swiss National Bank (SNB) meeting, and in USD/CHF terms it even fallen below, Commerzbank’s FX analyst Michael Pfister notes.
A stronger franc may not come into play
“When global recession fears arise, the currencies that benefit the most are those where the central bank has the least room for manoeuvre to cut interest rates - which puts the spotlight on the Yen (where the BoJ is even considering rate hikes) and, to a lesser extent, the Swiss franc. For some market observers, however, such CHF movements are likely to ring alarm bells.”
“After all, the SNB made it clear at its last meeting that it sees such an appreciation of the franc as a risk to the stabilisation of inflation and will react accordingly. The market seems to be well aware of this risk. A further rate cut in September is now priced in at just under 90%, compared with just around 37% two weeks ago.”
“However, we would still be cautious about betting on an even stronger franc. As long as the SNB does not initiate a change of direction, a stronger franc also increases the risk that the SNB will react. At least as long as the upside risks to inflation do not return. For the time being, the SNB's main response is likely to be a rate cut. However, if it goes too far, the SNB is also likely to intervene more in the foreign exchange market.”
Silver prices (XAG/USD) rose on Monday, according to FXStreet data. Silver trades at $28.13 per troy ounce, up 0.68% from the $27.94 it cost on Friday.
Silver prices have increased by 18.21% since the beginning of the year.
| Unit measure | Silver Price Today in USD |
|---|---|
| Troy Ounce | 28.13 |
| 1 Gram | 0.90 |
The Gold/Silver ratio, which shows the number of ounces of Silver needed to equal the value of one ounce of Gold, stood at 85.05 on Monday, down from 85.45 on Friday.
Silver FAQs
Silver is a precious metal highly traded among investors. It has been historically used as a store of value and a medium of exchange. Although less popular than Gold, traders may turn to Silver to diversify their investment portfolio, for its intrinsic value or as a potential hedge during high-inflation periods. Investors can buy physical Silver, in coins or in bars, or trade it through vehicles such as Exchange Traded Funds, which track its price on international markets.
Silver prices can move due to a wide range of factors. Geopolitical instability or fears of a deep recession can make Silver price escalate due to its safe-haven status, although to a lesser extent than Gold's. As a yieldless asset, Silver tends to rise with lower interest rates. Its moves also depend on how the US Dollar (USD) behaves as the asset is priced in dollars (XAG/USD). A strong Dollar tends to keep the price of Silver at bay, whereas a weaker Dollar is likely to propel prices up. Other factors such as investment demand, mining supply – Silver is much more abundant than Gold – and recycling rates can also affect prices.
Silver is widely used in industry, particularly in sectors such as electronics or solar energy, as it has one of the highest electric conductivity of all metals – more than Copper and Gold. A surge in demand can increase prices, while a decline tends to lower them. Dynamics in the US, Chinese and Indian economies can also contribute to price swings: for the US and particularly China, their big industrial sectors use Silver in various processes; in India, consumers’ demand for the precious metal for jewellery also plays a key role in setting prices.
Silver prices tend to follow Gold's moves. When Gold prices rise, Silver typically follows suit, as their status as safe-haven assets is similar. The Gold/Silver ratio, which shows the number of ounces of Silver needed to equal the value of one ounce of Gold, may help to determine the relative valuation between both metals. Some investors may consider a high ratio as an indicator that Silver is undervalued, or Gold is overvalued. On the contrary, a low ratio might suggest that Gold is undervalued relative to Silver.
(An automation tool was used in creating this post.)
This week will be one of the most exciting weeks for EUR/USD in a long time, with the first estimate of euro area Q2 GDP due Tuesday, followed by euro area July inflation and the Federal Reserve (Fed) meeting on Wednesday, and US payrolls on Friday, Commerzbank’s FX analyst Michael Pfister notes.
EUR/USD is set to test lower levels
“Since the inflation surprise in mid-July, expectations have even decoupled somewhat from those for the BoE and the ECB. This is despite the fact that rate cut expectations for the three major western central banks have been quite synchronised since the beginning of the year. However, the market is now pricing in just about half a cut more from the Fed by the end of the year.”
“It is unlikely that the Fed will cut rates more than twice this year. On Wednesday, it is likely to lay the groundwork for a first rate cut in September. For three rate cuts this year, however, Chairman Jerome Powell would have to make a significant U-turn. On the other hand, there is unlikely to be much positive news for the Euro this week. Growth is also likely to remain uneven. If this happens as expected, the market is likely to price in further ECB rate cuts.”
“In short, there are more downside risks on the Euro side, while the Fed is likely to be preparing for a cut, but market expectations have gone a little too far. If this unfolds as expected, there is much to suggest that the market's interest rate expectations will tend to converge again. And that EUR/USD will test lower levels.”
- The Oil price recovers to near $77 on fresh supply concerns after Iran-backed Hezbollah’s rocket strike on Golan Heights.
- Caixin Manufacturing PMI for July and the Fed’s policy meeting will guide the next move in the Oil price.
- The Fed is expected to deliver dovish guidance on interest rates.
West Texas Intermediate (WTI), futures on NYMEX, rebound to near $77.00 in Monday’s European session after plunging to near $76.00 on Friday. The Oil price rebounds as an air strike in the Israeli-occupied Golan Heights has prompted fears of widening Middle East tensions.
The Israeli and the United States (US) governments have held Iran-backed Hezbollah responsible for the rocket strike on Golan Heights that killed 12 people. In response to that, Israel has vowed to retaliate, which has resulted in upside risks to the Oil supply concerns.
While the Oil recovery move is still uncertain due to uncertainty over its global demand amid economic vulnerability in China, which is its largest importer in the world. Oil imports volume by China has fallen significantly as the scale of spending and investment has declined due to weak demand from domestic and the overseas market.
This week, the Caixin Manufacturing PMI for July and the Federal Reserve’s (Fed) monetary policy meeting will be the key triggers for the Oil price. Activities in the Chinese manufacturing sector are estimated to have expanded at a slower pace to 51.6 from the former release of 51.8.
Meanwhile, the Fed is expected to leave interest rates unchanged in the range of 5.25%-5.50% for the eighth time in a row but turn dovish for the remaining year. Investors expect that the Fed will admit to decent progress in disinflation and potential risks to the labor market. The Fed could openly endorse rate cuts in September but will refrain from committing to a specific rate-cut path.
Brent Crude Oil FAQs
Brent Crude Oil is a type of Crude Oil found in the North Sea that is used as a benchmark for international Oil prices. It is considered ‘light’ and ‘sweet’ because of its high gravity and low sulfur content, making it easier to refine into gasoline and other high-value products. Brent Crude Oil serves as a reference price for approximately two-thirds of the world's internationally traded Oil supplies. Its popularity rests on its availability and stability: the North Sea region has well-established infrastructure for Oil production and transportation, ensuring a reliable and consistent supply.
Like all assets supply and demand are the key drivers of Brent Crude Oil price. As such, global growth can be a driver of increased demand and vice versa for weak global growth. Political instability, wars, and sanctions can disrupt supply and impact prices. The decisions of OPEC, a group of major Oil-producing countries, is another key driver of price. The value of the US Dollar influences the price of Brent Crude Oil, since Oil is predominantly traded in US Dollars, thus a weaker US Dollar can make Oil more affordable and vice versa.
The weekly Oil inventory reports published by the American Petroleum Institute (API) and the Energy Information Agency (EIA) impact the price of Brent Crude Oil. Changes in inventories reflect fluctuating supply and demand. If the data shows a drop in inventories it can indicate increased demand, pushing up Oil price. Higher inventories can reflect increased supply, pushing down prices. API’s report is published every Tuesday and EIA’s the day after. Their results are usually similar, falling within 1% of each other 75% of the time. The EIA data is considered more reliable, since it is a government agency.
OPEC (Organization of the Petroleum Exporting Countries) is a group of 13 Oil producing nations who collectively decide production quotas for member countries at twice-yearly meetings. Their decisions often impact Brent Crude Oil prices. When OPEC decides to lower quotas, it can tighten supply, pushing up Oil prices. When OPEC increases production, it has the opposite effect. OPEC+ refers to an expanded group that includes ten extra non-OPEC members, the most notable of which is Russia.
The US Dollar (USD) is expected to trade in a 7.2500/7.2750 range. USD must break and remain below the 7.2037 low before further weakness can be expected, UOB Group FX analysts Quek Ser Leang and Peter Chia note.
Bulls are set to test 7.2750
24-HOUR VIEW: “After USD briefly plunged to 7.2037 last Thursday and then rebounded strongly, we indicated on Friday that ‘the rebound in oversold conditions suggest USD is unlikely to weaken further.’ We expected USD to trade in a 7.2300/7.2650 range. USD subsequently traded between 7.2340 and 7.2661, closing on a relatively firm note at 7.2631 (+0.31%). Today, we continue to expect USD to trade in a range. However, the slightly firmed underlying tone suggests a higher range of 7.2500/7.2750.”
1-3 WEEKS VIEW: “Last Thursday, USD plunged to a low of 7.2037 before rebounding. On Friday (26 Jul, spot at 7.2470), we highlighted that ‘while further USD weakness is not ruled out, it must break and remain below the 7.2037 low before further decline can be expected.’ We added, ‘the likelihood of USD breaking clearly below the low will be intact provided that 7.2800 is not breached.’ We continue to hold the same view.”
- The USD appreciates on Monday as geopolitical concerns dampen risk appetite.
- This week, a dovish turn by the Federal Reserve might halt US Dollar’s recovery.
- DXY has scope for further recovery past 104.55, aiming for 105.15.
The US Dollar (USD) has opened the week on a somewhat firmer pace. Market concerns about the escalating tensions in the Middle East have shadowed investors' hopes of a Fed dovish turn later this week.
Israel is considering retaliation to Hezbollah in Lebanon after a deadly rocket attack in the Golan Heights this weekend. This would stir an already tense area and is threatening to involve Iran in a full-blown regional war.
Geopolitical concerns are overshadowing the fundamental docket, especially Wednesday’s Federal Reserve’s (Fed) monetary policy meeting. The Fed is likely to keep rates unchanged but investors are expecting a dovish turn in the bank’s rhetoric, acknowledging the cooling inflation trends and hinting towards a rate cut in September.
Before that, the JOLTS Job Openings for June and the Conference Board’s Consumer Sentiment Index for July, due on Tuesday, are expected to show moderate contractions, which will provide the right framework for a dovish message from the central bank.
Daily digest market movers: US Dollar favoured by the cautious market sentiment
- In the absence of key fundamental releases on Monday, market concerns of an escalation in the Middle East are likely to weigh risk appetite and provide support for the US Dollar due to its safe-haven status.
- On Tuesday, the US Conference Board’s Consumer Sentiment Index is expected to show a moderate decline to 99.5 from 100.4 in the previous month.
- US JOLTS Job Openings are seen to have eased to 8.03 million in June from 8.14 million in May.
- Future markets are pricing only a 4.1% chance of an interest rate cut by the Fed on Wednesday, with a 25 bps rate cut fully priced for September, according to the CME Group Fed Watch Tool.
- Data seen last week showed that the US Personal Consumption Expenditures (PCE) Prices Index remained sticky in June, yet with the core PCE index at 2.6% year-over-year, which kept hopes of a September rate cut alive.
- Earlier in the week, the US Gross Domestic Product (GDP) surprised with a 2.8% yearly growth in the second quarter, from 1.4% in the first, but still far from the growth levels seen in the second half of 2023.
DXY Technical Outlook: There is scope to extend its recovery beyond 1.0455
The bearish trend sewn in the first half of the month is losing momentum. The 4-hour chart shows RSI returning above the 50 line, with price action testing resistance at 104.55.
Fundamentals are supportive, and the strong rebound from the 104.05 support area on Monday suggests that there is scope for a further recovery.
Beyond 104.55, the next target would be 105.10, ahead of 105.80. Supports are the mentioned 104.05 and 103.60.
US Dollar price today
The table below shows the percentage change of US Dollar (USD) against listed major currencies today. US Dollar was the weakest against the Japanese Yen.
| USD | EUR | GBP | CAD | AUD | JPY | NZD | CHF | |
| USD | 0.20% | 0.37% | 0.05% | 0.09% | -0.30% | 0.12% | 0.04% | |
| EUR | -0.18% | 0.18% | -0.15% | -0.10% | -0.47% | -0.06% | -0.15% | |
| GBP | -0.37% | -0.19% | -0.33% | -0.28% | -0.65% | -0.26% | -0.33% | |
| CAD | -0.06% | 0.15% | 0.34% | 0.05% | -0.33% | 0.08% | 0.01% | |
| AUD | -0.12% | 0.11% | 0.30% | -0.04% | -0.37% | 0.02% | -0.04% | |
| JPY | 0.31% | 0.47% | 0.65% | 0.34% | 0.37% | 0.40% | 0.34% | |
| NZD | -0.12% | 0.07% | 0.26% | -0.08% | -0.03% | -0.41% | -0.07% | |
| CHF | -0.03% | 0.14% | 0.33% | 0.00% | 0.05% | -0.33% | 0.08% |
The heat map shows percentage changes of major currencies against each other. The base currency is picked from the left column, while the quote currency is picked from the top row. For example, if you pick the Euro from the left column and move along the horizontal line to the Japanese Yen, the percentage change displayed in the box will represent EUR (base)/JPY (quote).
Fed FAQs
Monetary policy in the US is shaped by the Federal Reserve (Fed). The Fed has two mandates: to achieve price stability and foster full employment. Its primary tool to achieve these goals is by adjusting interest rates. When prices are rising too quickly and inflation is above the Fed’s 2% target, it raises interest rates, increasing borrowing costs throughout the economy. This results in a stronger US Dollar (USD) as it makes the US a more attractive place for international investors to park their money. When inflation falls below 2% or the Unemployment Rate is too high, the Fed may lower interest rates to encourage borrowing, which weighs on the Greenback.
The Federal Reserve (Fed) holds eight policy meetings a year, where the Federal Open Market Committee (FOMC) assesses economic conditions and makes monetary policy decisions. The FOMC is attended by twelve Fed officials – the seven members of the Board of Governors, the president of the Federal Reserve Bank of New York, and four of the remaining eleven regional Reserve Bank presidents, who serve one-year terms on a rotating basis.
In extreme situations, the Federal Reserve may resort to a policy named Quantitative Easing (QE). QE is the process by which the Fed substantially increases the flow of credit in a stuck financial system. It is a non-standard policy measure used during crises or when inflation is extremely low. It was the Fed’s weapon of choice during the Great Financial Crisis in 2008. It involves the Fed printing more Dollars and using them to buy high grade bonds from financial institutions. QE usually weakens the US Dollar.
Quantitative tightening (QT) is the reverse process of QE, whereby the Federal Reserve stops buying bonds from financial institutions and does not reinvest the principal from the bonds it holds maturing, to purchase new bonds. It is usually positive for the value of the US Dollar.
- AUD/USD sees more downside due to multiple headwinds.
- Investors await the Aussie inflation data and the Fed’s policy meeting.
- The Fed is expected to leave interest rates unchanged in the range of 5.25%-5.50%.
The AUD/USD pair consolidates in a tight range near 0.6550 in Monday’s European session. The near-term outlook of the Aussie asset remains vulnerable as weak iron ore prices have dampened the Australian Dollar’s (AUD) appeal.
Lower iron ore prices have negatively impacted foreign flows into Australia as it caters to more than 50% of its global demand. The prices of the base metal dived recently due to its weak demand outlook, with the Chinese economy going through a rough phase amid poor demand conditions. Lack of big bang stimulus announcement in the China’s Third Plenum outcome and an unexpected rate-cut decision by the People’s Bank of China (PBoC) raised concerns over China’s economic prospects. Also, China and Australia are close trading partners.
Domestically, the Australian Dollar will be influenced by the monthly and Q2 Consumer Price Index (CPI) data, which will be published on Wednesday. In the second quarter, price pressures are estimated to have grown steadily by 1%. Annually, Q2 CPI is expected to have accelerated to 3.8% from the former release of 3.6%. This will boost expectations of further policy-tightening by the Reserve Bank of Australia (RBA).
Meanwhile, a significant recovery in the US Dollar (USD) amid caution among market participants ahead of the Federal Reserve’s (Fed) interest rate decision on Wednesday has weighed on the Aussie asset. The US Dollar Index (DXY), which tracks the Greenback’s value against six major currencies, jumps to near 104.55. Investors will keenly focus on the guidance on interest rates as the Fed is expected to maintain the status quo for the eighth time in a row.
Currently, financial markets expect that the Fed will start reducing interest rates from the September meeting and there will be two rate cuts this year. Investors will look for cues about whether policymakers are comfortable with these speculations.
Australian Dollar FAQs
One of the most significant factors for the Australian Dollar (AUD) is the level of interest rates set by the Reserve Bank of Australia (RBA). Because Australia is a resource-rich country another key driver is the price of its biggest export, Iron Ore. The health of the Chinese economy, its largest trading partner, is a factor, as well as inflation in Australia, its growth rate and Trade Balance. Market sentiment – whether investors are taking on more risky assets (risk-on) or seeking safe-havens (risk-off) – is also a factor, with risk-on positive for AUD.
The Reserve Bank of Australia (RBA) influences the Australian Dollar (AUD) by setting the level of interest rates that Australian banks can lend to each other. This influences the level of interest rates in the economy as a whole. The main goal of the RBA is to maintain a stable inflation rate of 2-3% by adjusting interest rates up or down. Relatively high interest rates compared to other major central banks support the AUD, and the opposite for relatively low. The RBA can also use quantitative easing and tightening to influence credit conditions, with the former AUD-negative and the latter AUD-positive.
China is Australia’s largest trading partner so the health of the Chinese economy is a major influence on the value of the Australian Dollar (AUD). When the Chinese economy is doing well it purchases more raw materials, goods and services from Australia, lifting demand for the AUD, and pushing up its value. The opposite is the case when the Chinese economy is not growing as fast as expected. Positive or negative surprises in Chinese growth data, therefore, often have a direct impact on the Australian Dollar and its pairs.
Iron Ore is Australia’s largest export, accounting for $118 billion a year according to data from 2021, with China as its primary destination. The price of Iron Ore, therefore, can be a driver of the Australian Dollar. Generally, if the price of Iron Ore rises, AUD also goes up, as aggregate demand for the currency increases. The opposite is the case if the price of Iron Ore falls. Higher Iron Ore prices also tend to result in a greater likelihood of a positive Trade Balance for Australia, which is also positive of the AUD.
The Trade Balance, which is the difference between what a country earns from its exports versus what it pays for its imports, is another factor that can influence the value of the Australian Dollar. If Australia produces highly sought after exports, then its currency will gain in value purely from the surplus demand created from foreign buyers seeking to purchase its exports versus what it spends to purchase imports. Therefore, a positive net Trade Balance strengthens the AUD, with the opposite effect if the Trade Balance is negative.
The US Dollar (USD) is expected to trade in a range between 153.20 and 154.70. Weakness in USD appears to be stabilising; a breach of 155.00 would indicate that USD is not declining further, UOB Group FX analysts Quek Ser Leang and Peter Chia note.
Closest resistance is at 154.70
24-HOUR VIEW: “After USD plummeted to 151.93 last Thursday and then rebounded, we indicated on Friday that ‘oversold conditions, combined with tentative signs of slowing momentum suggest that USD is unlikely to weaken further.’ We expected USD to trade in a range between 152.80 and 154.80. USD subsequently traded in a range of 153.11/154.73. Today, we continue to expect USD to trade in a range, probably between 153.20 and 154.70.”
1-3 WEEKS VIEW: “Our update from last Friday (26 Jul, spot at 153.50) still stands. As highlighted, the weakness in USD that started in the middle of the month appears to be stabilising. However, only a breach of 155.00 (no change in ‘strong resistance’) would indicate USD is not declining further.”
Further range trading seems likely, expected to be in a range of 0.5875/0.5920. Further New Zealand Dollar (NZD) weakness is not ruled out; severely oversold conditions suggest limited downside potential. The level to monitor is 0.5850, UOB Group FX analysts Quek Ser Leang and Peter Chia note.
The level to monitor is 0.5850
24-HOUR VIEW: “After NZD fell to a low of 0.5878 last Thursday, we indicated on Friday that ‘severely oversold conditions and tentative signs of slowing momentum indicate that NZD is unlikely to weaken much further.’ We expected NZD to trade in a range between 0.5870 and 0.5920. Our view of range trading was not wrong, even though NZD traded in a narrower range of 0.5884/0.5905, closing largely unchanged at 0.5889 (+0.09%). The price action provides no fresh clues, and further range trading seems likely. Expected range for today: 0.5875/0.5915.”
1-3 WEEKS VIEW: “Last Friday (26 Jul, spot at 0.5890), we indicated that ‘while further NZD weakness is not ruled out, severely oversold conditions suggest limited downside potential.’ We indicated that ‘the next level to monitor is 0.5850.’ We continue to hold the same view. Overall, only a breach of 0.5955 (no change in ‘strong resistance’ level from last Friday) would suggest that NZD weakness that started more than a week ago has come to an end.”
- The Pound Sterling weakens as investors expect the BoE to cut interest rates on Thursday.
- A few BoE policymakers may hesitate to vote for a dovish decision due to high inflation in the UK service sector.
- The Fed is widely anticipated to maintain the status quo.
The Pound Sterling (GBP) underperforms against its major peers in Monday’s London session. The British currency weakens ahead of the Bank of England (BoE) monetary policy meeting, which is scheduled for Thursday. The BoE is expected to cut its interest rates by 25 basis points (bps) to 5%. This will be the first rate-cut decision in the BoE in more than four years since pandemic-led stimulus forced global central banks to pivot to a restrictive policy framework in an attempt to normalize inflated world markets.
Market experts expect that the BoE's rate-cut move will be tough, as high inflation in the service sector remains a concern for policymakers. Though annual headline inflation has returned to the desired rate of 2%, high service inflation could dampen its sustainability.
Meanwhile, the arrival of United Kingdom (UK) Prime Minister Keir Starmer into Parliament with an absolute majority has strengthened the economic outlook. An improvement in activities in manufacturing and the service sector could lead to a rise in input prices, which could also revamp price pressures again.
Daily digest market movers: Pound Sterling refreshes two-week low against US Dollar
- The Pound Sterling posts a fresh two-week low near 1.2810 against the US Dollar (USD) in Monday’s European trading hours. The GBP/USD pair weakens as the US Dollar edges higher amid uncertainty ahead of the Federal Reserve’s (Fed) monetary policy announcement on Wednesday. The US Dollar Index (DXY), which tracks the Greenback’s value against six major currencies, rises to 104.50.
- The Fed is widely anticipated to leave interest rates unchanged in the range of 5.25%-5.50% for the eighth time in a row. Therefore, market participants will keenly focus on the monetary policy statement and the press conference of Fed Chair Jerome Powell to know whether policymakers are comfortable with market speculation of two rate cuts this year and choosing the September meeting to kick off the much-awaited policy-easing cycle.
- Financial markets expect the Fed to acknowledge significant progress in inflation declining towards the bank’s target of 2% and increasing risks to the labor market. This would indicate the Fed’s readiness for interest-rate reduction.
- Contrary to market expectations, Bank of America (BofA) economists argued on Friday that cooling consumer demand and inflation may not be proceeding fast enough to allow for as much policy easing as financial markets expect. They added, "We remain comfortable with our forecast that cuts will start in December, but upcoming inflation and employment data could tip the scale to an earlier cut," Reuters reported.
- Apart from the Fed policy, investors will also focus on a string of United States (US) economic data such as JOLTS Job Openings for June, ADP Employment Change, ISM Manufacturing Purchasing Managers Index (PMI), and Nonfarm Payrolls data for July.
Technical Analysis: Pound Sterling falls below 20-day EMA
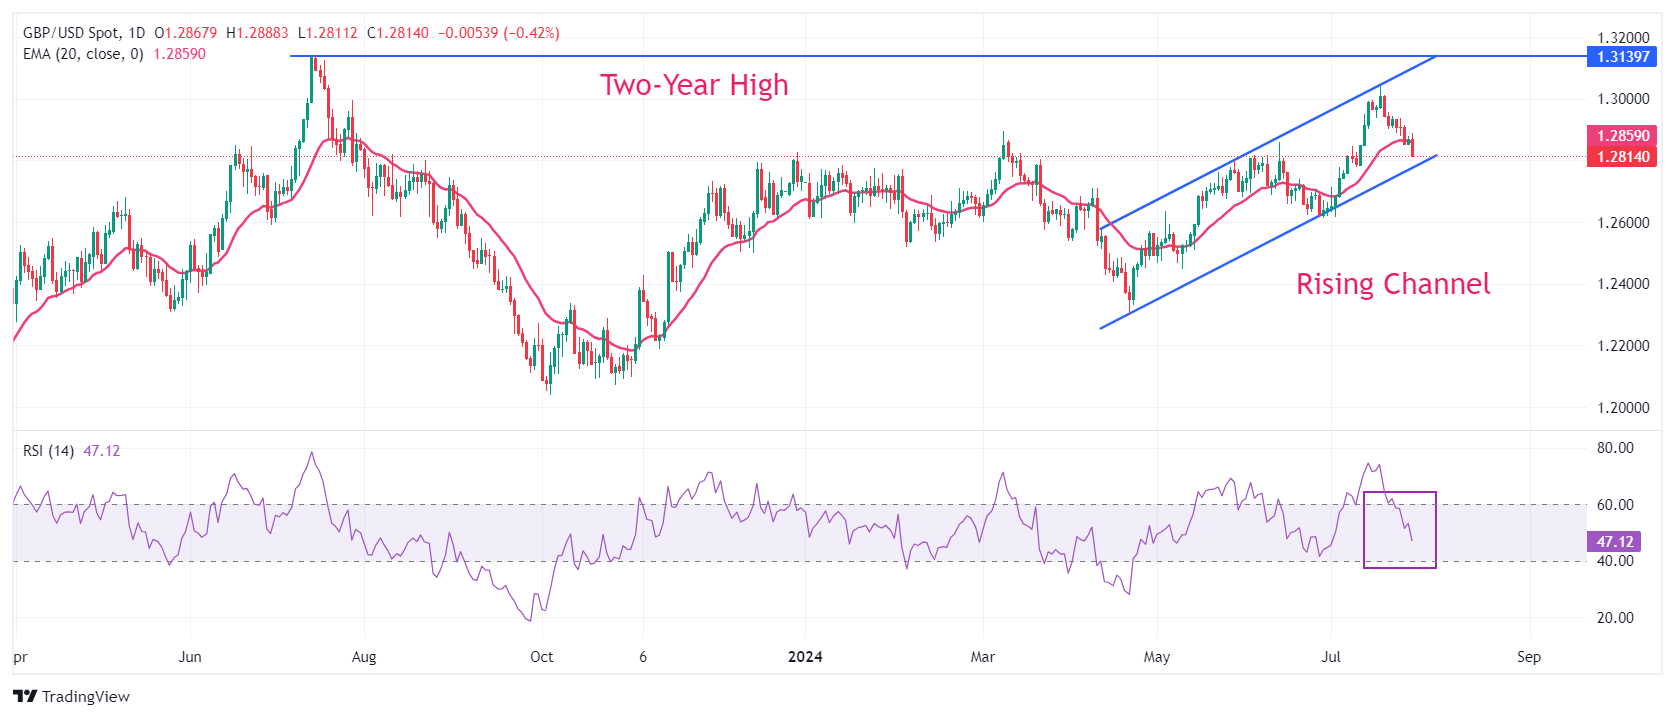
The Pound Sterling declines toward the lower boundary of the Rising Channel chart pattern on a daily timeframe. The GBP/USD pair fell on the backfoot after breaking below the crucial support of 1.2900. The Cable drops below the 20-day Exponential Moving Average (EMA) near 1.2860, suggesting uncertainty in the near-term trend.
The 14-day Relative Strength Index (RSI) declines toward 40.00, which would be a cushion for the momentum oscillator.
On the downside, the round-level support of 1.2800 will be a crucial support zone for the Pound Sterling bulls. On the other hand, a two-year high near 1.3140 will be a key resistance zone for the pair.
Pound Sterling FAQs
The Pound Sterling (GBP) is the oldest currency in the world (886 AD) and the official currency of the United Kingdom. It is the fourth most traded unit for foreign exchange (FX) in the world, accounting for 12% of all transactions, averaging $630 billion a day, according to 2022 data. Its key trading pairs are GBP/USD, aka ‘Cable’, which accounts for 11% of FX, GBP/JPY, or the ‘Dragon’ as it is known by traders (3%), and EUR/GBP (2%). The Pound Sterling is issued by the Bank of England (BoE).
The single most important factor influencing the value of the Pound Sterling is monetary policy decided by the Bank of England. The BoE bases its decisions on whether it has achieved its primary goal of “price stability” – a steady inflation rate of around 2%. Its primary tool for achieving this is the adjustment of interest rates. When inflation is too high, the BoE will try to rein it in by raising interest rates, making it more expensive for people and businesses to access credit. This is generally positive for GBP, as higher interest rates make the UK a more attractive place for global investors to park their money. When inflation falls too low it is a sign economic growth is slowing. In this scenario, the BoE will consider lowering interest rates to cheapen credit so businesses will borrow more to invest in growth-generating projects.
Data releases gauge the health of the economy and can impact the value of the Pound Sterling. Indicators such as GDP, Manufacturing and Services PMIs, and employment can all influence the direction of the GBP. A strong economy is good for Sterling. Not only does it attract more foreign investment but it may encourage the BoE to put up interest rates, which will directly strengthen GBP. Otherwise, if economic data is weak, the Pound Sterling is likely to fall.
Another significant data release for the Pound Sterling is the Trade Balance. This indicator measures the difference between what a country earns from its exports and what it spends on imports over a given period. If a country produces highly sought-after exports, its currency will benefit purely from the extra demand created from foreign buyers seeking to purchase these goods. Therefore, a positive net Trade Balance strengthens a currency and vice versa for a negative balance.
Chance of the Australian Dollar (AUD) rebounding, but the 0.6580 level is expected to offer strong resistance. AUD weakness seems to be overextended, both time- and price-wise, but stabilisation is only upon a breach of 0.6615, UOB Group FX analysts Quek Ser Leang and Peter Chia note.
Bears strive to test 0.6615
24-HOUR VIEW: “After AUD fell sharply to 0.6511 last Thursday and then rebounded, we indicated on Friday that ‘there is room for AUD to rebound further.’ However, we pointed out that ‘any advance is expected to face strong resistance at 0.6580.’ AUD then rebounded less than expected, reaching a high of 0.6869 before easing to close at 0.6547 (+0.14%). The underlying tone still seems a tad firm, and we continue to see chance of AUD rebounding. However, the 0.6580 level is still expected to offer strong resistance. On the downside, support levels are at 0.6535 and 0.6520.”
1-3 WEEKS VIEW: “Our update from last Friday (26 Jul, spot at 0.6545) is still valid. As highlighted, the weakness in AUD that started more than a week ago seems to be overextended, both time- and price-wise. However, only a breach of 0.6615 will indicate that the weakness has stabilised. As long as the ‘strong resistance’ level at 0.6615 is not breached, there is still a chance, albeit a low one, for AUD to decline further to 0.6480.”
Downward momentum is building. The Pound Sterling (GBP) is likely to trade with a downward bias towards 1.2780, UOB Group FX analysts Quek Ser Leang and Peter Chia note.
Bears are likely to test 1.2780 in short term
24-HOUR VIEW: “Last Thursday, GBP fell to a low of 1.2850. On Friday, we indicated that ‘further GBP weakness seems likely.’ We added, ‘to keep the momentum going, GBP must stay below 1.2895 with minor resistance at 1.2875. Instead of weakening further, GBP traded in a quiet manner between 1.2850 and 1.2878 before settling at 1.2866 (+0.12%). The price action appears to be part of a consolidation phase. Today, we expect GBP to trade between 1.2850 and 1.2895.”
1-3 WEEKS VIEW: “We indicated last Friday (26 Jul, spot at 1.2855) that ‘downward momentum is building, but at this time, it is premature to expect a significant decline.’ We added, ‘Overall, provided that the ‘strong resistance’ (level currently at 1.2920) is not breached, GBP is expected to trade with a downward bias towards 1.2780.’ Our view remains unchanged for now.”
- Silver price may appreciate due to the dovish sentiment surrounding the Fed.
- A rocket strike in the Israeli-occupied Golan Heights has supported the safe-haven Silver.
- The dismal economic outlook in China could have exerted pressure on the Silver demand.
Silver price (XAG/USD) offers its intraday gains, holding position around $28.00 per troy ounce during the European trading hours on Monday. Non-yielding assets like Silver gain ground as the latest US inflation figures have reinforced expectations that the Federal Reserve (Fed) will begin cutting interest rates in September. Additionally, signs of cooling inflation and easing labor market conditions in the United States (US) have heightened expectations of three rate cuts by the Fed in 2024.
On Friday, the US Personal Consumption Expenditures (PCE) Price Index showed a modest increase in inflation for June, offering further signs of easing price pressures. The PCE Price Index rose by 2.5% year-over-year in June, slightly down from 2.6% in May, aligning with market expectations. On a monthly basis, the PCE Price Index increased by 0.1% after remaining unchanged in May.
Additionally, the rise in safe-haven Silver is driven by concerns over a potential escalation in the Middle East following a rocket strike in the Israeli-occupied Golan Heights. Israel and the United States (US) have attributed the strike to the Lebanese armed group Hezbollah, according to Reuters.
Israel's security cabinet authorized Prime Minister Benjamin Netanyahu's government on Sunday to determine the "manner and timing" of a response to the rocket strike, which killed 12 teenagers and children on Saturday.
The grey metal might have received support from news that the Chinese government will allocate CNY 300 billion in bond funds for economic recovery. Silver, which is crucial for various industrial applications in the world’s largest manufacturing hub, China, benefits from this stimulus. However, sluggish economic activity in China has added additional selling pressure on Silver.
Silver FAQs
Silver is a precious metal highly traded among investors. It has been historically used as a store of value and a medium of exchange. Although less popular than Gold, traders may turn to Silver to diversify their investment portfolio, for its intrinsic value or as a potential hedge during high-inflation periods. Investors can buy physical Silver, in coins or in bars, or trade it through vehicles such as Exchange Traded Funds, which track its price on international markets.
Silver prices can move due to a wide range of factors. Geopolitical instability or fears of a deep recession can make Silver price escalate due to its safe-haven status, although to a lesser extent than Gold's. As a yieldless asset, Silver tends to rise with lower interest rates. Its moves also depend on how the US Dollar (USD) behaves as the asset is priced in dollars (XAG/USD). A strong Dollar tends to keep the price of Silver at bay, whereas a weaker Dollar is likely to propel prices up. Other factors such as investment demand, mining supply – Silver is much more abundant than Gold – and recycling rates can also affect prices.
Silver is widely used in industry, particularly in sectors such as electronics or solar energy, as it has one of the highest electric conductivity of all metals – more than Copper and Gold. A surge in demand can increase prices, while a decline tends to lower them. Dynamics in the US, Chinese and Indian economies can also contribute to price swings: for the US and particularly China, their big industrial sectors use Silver in various processes; in India, consumers’ demand for the precious metal for jewellery also plays a key role in setting prices.
Silver prices tend to follow Gold's moves. When Gold prices rise, Silver typically follows suit, as their status as safe-haven assets is similar. The Gold/Silver ratio, which shows the number of ounces of Silver needed to equal the value of one ounce of Gold, may help to determine the relative valuation between both metals. Some investors may consider a high ratio as an indicator that Silver is undervalued, or Gold is overvalued. On the contrary, a low ratio might suggest that Gold is undervalued relative to Silver.
The Euro (EUR) is expected to trade sideways, probably in a range of 1.0835/1.0870. EUR is likely to trade with a downward bias; the 1.0815 level is expected to provide solid support, UOB Group FX analysts Quek Ser Leang and Peter Chia note.
The support at 1.0835 is the current magnet
24-HOUR VIEW: “Last Friday, we noted that ‘the price movements are likely part of a sideways trading phase,’ and we expected EUR to trade between 1.0830 and 1.0870. In line with our expectations, EUR traded sideways, albeit in a narrower range of 1.0840/1.0868. The price action provides no fresh clues, and we continue to expect EUR to trade sideways, probably in a range of 1.0835/1.0870.”
1-3 WEEKS VIEW: “Our most recent narrative was from last Wednesday (24 Jul, spot at 1.0850), EUR ‘is likely to trade with a downward bias, but the 1.0815 level is expected to provide solid support.’ While EUR has not been able to make much headway on the downside, as long as 1.0890 (no change in ‘strong resistance’ level from yesterday) is not breached, we will continue to hold the same view. Looking ahead, if EUR breaks clearly below 1.0815, the next level to watch is 1.0760.”
- USD/MXN extends winning streak despite the dovish sentiment surrounding the Fed.
- The upside of the US Dollar could be limited due to declining US Treasury yields.
- The MXN may limit its downside as mid-month inflation data for July could deter Banxico from easing policy.
USD/MXN continues to gain ground for the fifth successive session, trading around 18.50 during the European hours on Monday. The USD/MXN pair gained ground as the US Dollar has recovered its intraday losses. However, the downside in the US Treasury yields may weaken the Greenback, limiting the upside of the pair.
US Dollar Index (DXY), which measures the value of the US Dollar against the six other major currencies, holds minor gains around the level of 104.40 with yields on US Treasury bonds standing at 4.37% and 4.17%, respectively, at the time of writing.
Additionally, signs of cooling inflation and easing labor market conditions in the United States (US) have fueled expectations of three rate cuts this year by the Federal Reserve (Fed), starting in September. This has put pressure on the US Dollar.
On Friday, the US Personal Consumption Expenditures (PCE) Price Index indicated a modest rise in inflation for June and provided further signs of easing price pressures. The US PCE Price Index rose by 2.5% year-over-year in June, down slightly from 2.6% in May, meeting market expectations. The PCE Price Index increased by 0.1% month-over-month after being unchanged in May.
In Mexico, mid-month inflation data for July could dissuade the Bank of Mexico (Banxico) from easing policy due to the risks of second-round effects, which Goldman Sachs economists suggest could extend to core inflation components.
Additionally, analysts at Citi Research now estimate that annual inflation will end at 4.30%, up from the previous forecast of 4.20%, with core inflation expected to finish 2024 at 4.0%. Mexico's economic growth is projected to slow, with an anticipated growth rate of 1.9%, down from 2.0% in the previous poll.
Mexican Peso FAQs
The Mexican Peso (MXN) is the most traded currency among its Latin American peers. Its value is broadly determined by the performance of the Mexican economy, the country’s central bank’s policy, the amount of foreign investment in the country and even the levels of remittances sent by Mexicans who live abroad, particularly in the United States. Geopolitical trends can also move MXN: for example, the process of nearshoring – or the decision by some firms to relocate manufacturing capacity and supply chains closer to their home countries – is also seen as a catalyst for the Mexican currency as the country is considered a key manufacturing hub in the American continent. Another catalyst for MXN is Oil prices as Mexico is a key exporter of the commodity.
The main objective of Mexico’s central bank, also known as Banxico, is to maintain inflation at low and stable levels (at or close to its target of 3%, the midpoint in a tolerance band of between 2% and 4%). To this end, the bank sets an appropriate level of interest rates. When inflation is too high, Banxico will attempt to tame it by raising interest rates, making it more expensive for households and businesses to borrow money, thus cooling demand and the overall economy. Higher interest rates are generally positive for the Mexican Peso (MXN) as they lead to higher yields, making the country a more attractive place for investors. On the contrary, lower interest rates tend to weaken MXN.
Macroeconomic data releases are key to assess the state of the economy and can have an impact on the Mexican Peso (MXN) valuation. A strong Mexican economy, based on high economic growth, low unemployment and high confidence is good for MXN. Not only does it attract more foreign investment but it may encourage the Bank of Mexico (Banxico) to increase interest rates, particularly if this strength comes together with elevated inflation. However, if economic data is weak, MXN is likely to depreciate.
As an emerging-market currency, the Mexican Peso (MXN) tends to strive during risk-on periods, or when investors perceive that broader market risks are low and thus are eager to engage with investments that carry a higher risk. Conversely, MXN tends to weaken at times of market turbulence or economic uncertainty as investors tend to sell higher-risk assets and flee to the more-stable safe havens.
- EUR/USD trades back and forth near 1.0850 ahead of crucial Eurozone/US events.
- The ECB may cut interest rates two more times this year.
- The Fed is expected to openly endorse rate cuts in September.
EUR/USD trades in a tight range near 1.0850 in Monday’s European session. The major currency pair struggles for direction as investors have sidelined ahead of the Eurozone preliminary Harmonized Index of Consumer Prices (HICP) for July and the Federal Reserve’s (Fed) monetary policy announcement on Wednesday.
The Eurozone inflation data will indicate whether market expectations for two more rate cuts by the European Central Bank (ECB) this year are appropriate. A few ECB policymakers are comfortable with speculation of two more rate cuts amid a dismal economic outlook and confidence that price pressures are on track to return to the desired rate of 2% next year.
Admitting to slower demand in the Eurozone’s largest nation, German Finance Minister Christian Lindner announced tax relief for corporations and households to spur spending and investment.
Annually, headline and core HICP, which excludes volatile items like food, energy, alcohol, and tobacco, are estimated to have decelerated to 2.3% and 2.8%, respectively.
Before the Eurozone inflation data, investors will focus on the preliminary Eurozone Q2 Gross Domestic Product (GDP) and inflation data of Germany and Spain, which will be published on Tuesday.
Daily digest market movers: EUR/USD juggles ahead of key economic events
- EUR/USD consolidates in a tight range near 1.0850 in Monday’s European session, with investors focusing on the Federal Reserve’s interest rate decision. The US Dollar Index (DXY), which tracks the Greenback’s value against six major currencies, trades sideways above the crucial support of 104.00.
- The Fed is expected to leave interest rates unchanged in the range of 5.25%-5.50%. Therefore, investors will keenly focus on the monetary policy statement and Fed Chair Jerome Powell’s press conference to get fresh cues about rate cuts.
- Market experts see the Fed communicating openly about rate cuts in the September meeting amid significant progress in inflation declining towards the bank’s target of 2% and rising risks to the labor market. Fears of inflation remaining persistent have waned as input prices have decelerated significantly in the last quarter. Flash United States (US) Q2 GDP report showed that the Price Index decelerated at a faster pace to 2.3% from the estimates of 2.6% and the prior release of 3.1%.
- Also, sticky US core Personal Consumption Expenditures Price Index (PCE) data for June failed to dash expectations of Fed rate cuts in September. Monthly core PCE inflation grew at a higher pace of 0.2% from expectations and the prior release of 0.1%, with annual figures growing steadily by 2.6%.
- This week, investors will also focus on a slew of economic data such as JOLTS Job Openings for June, ADP Employment Change, ISM Manufacturing Purchasing Managers Index (PMI), and Nonfarm Payrolls data for July.
Technical Analysis: EUR/USD consolidates near 1.0850
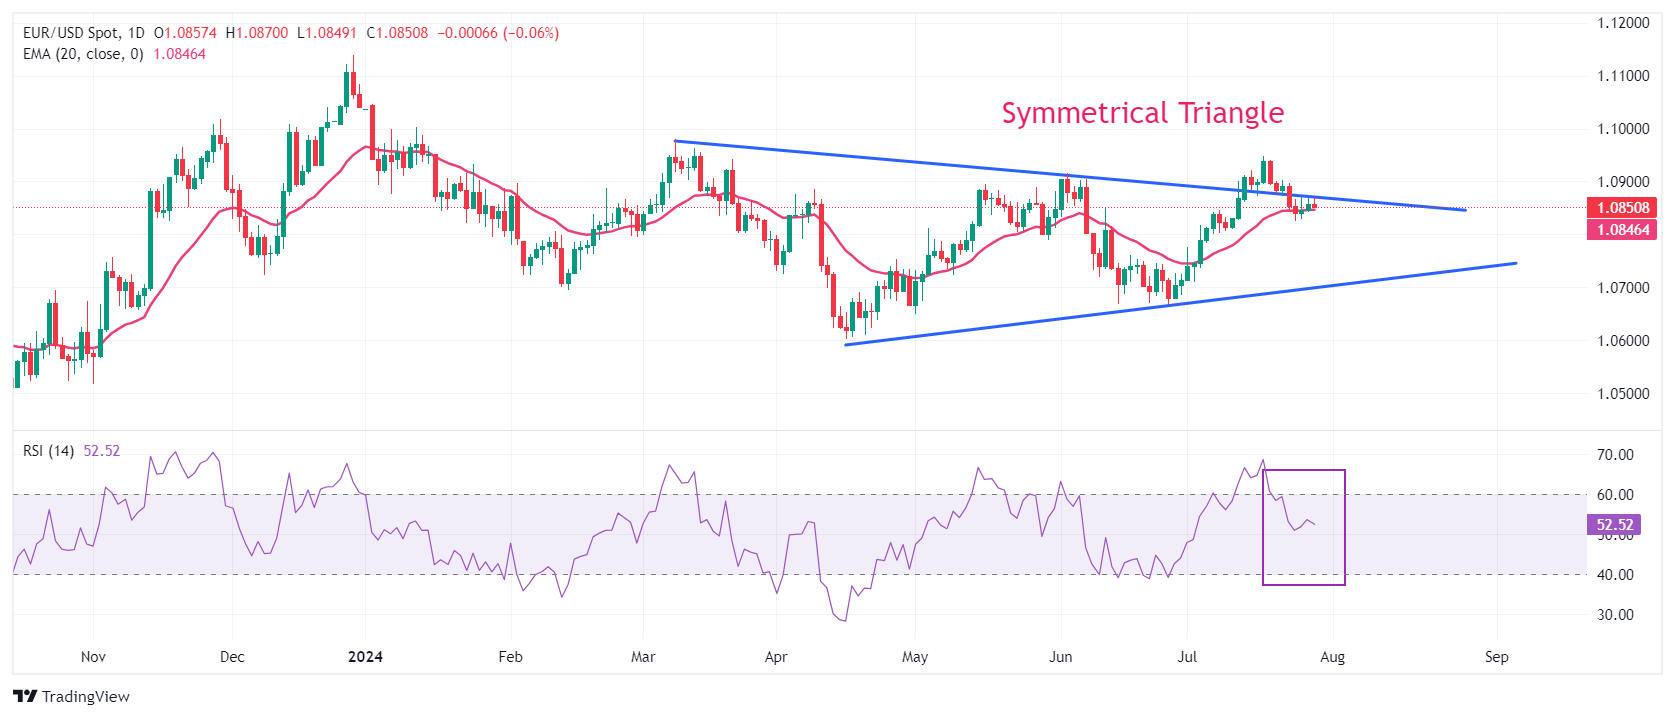
EUR/USD stays in a tight range near 1.0850. The shared currency pair remains inside a Symmetrical Triangle formation on a daily timeframe after failing to hold the breakout. The major currency pair extends its downside below the 20-day Exponential Moving Average (EMA), which trades around 1.0840. The shared currency pair could slide further towards round-level supports near 1.0800 and 1.0700.
The 14-day Relative Strength Index (RSI) returns within the 40.00-60.00 range, suggesting the bullish momentum has faded.
On the upside, the round-level resistance of 1.0900 will be a key barrier for the Euro bulls.
Euro FAQs
The Euro is the currency for the 20 European Union countries that belong to the Eurozone. It is the second most heavily traded currency in the world behind the US Dollar. In 2022, it accounted for 31% of all foreign exchange transactions, with an average daily turnover of over $2.2 trillion a day. EUR/USD is the most heavily traded currency pair in the world, accounting for an estimated 30% off all transactions, followed by EUR/JPY (4%), EUR/GBP (3%) and EUR/AUD (2%).
The European Central Bank (ECB) in Frankfurt, Germany, is the reserve bank for the Eurozone. The ECB sets interest rates and manages monetary policy. The ECB’s primary mandate is to maintain price stability, which means either controlling inflation or stimulating growth. Its primary tool is the raising or lowering of interest rates. Relatively high interest rates – or the expectation of higher rates – will usually benefit the Euro and vice versa. The ECB Governing Council makes monetary policy decisions at meetings held eight times a year. Decisions are made by heads of the Eurozone national banks and six permanent members, including the President of the ECB, Christine Lagarde.
Eurozone inflation data, measured by the Harmonized Index of Consumer Prices (HICP), is an important econometric for the Euro. If inflation rises more than expected, especially if above the ECB’s 2% target, it obliges the ECB to raise interest rates to bring it back under control. Relatively high interest rates compared to its counterparts will usually benefit the Euro, as it makes the region more attractive as a place for global investors to park their money.
Data releases gauge the health of the economy and can impact on the Euro. Indicators such as GDP, Manufacturing and Services PMIs, employment, and consumer sentiment surveys can all influence the direction of the single currency. A strong economy is good for the Euro. Not only does it attract more foreign investment but it may encourage the ECB to put up interest rates, which will directly strengthen the Euro. Otherwise, if economic data is weak, the Euro is likely to fall. Economic data for the four largest economies in the euro area (Germany, France, Italy and Spain) are especially significant, as they account for 75% of the Eurozone’s economy.
Another significant data release for the Euro is the Trade Balance. This indicator measures the difference between what a country earns from its exports and what it spends on imports over a given period. If a country produces highly sought after exports then its currency will gain in value purely from the extra demand created from foreign buyers seeking to purchase these goods. Therefore, a positive net Trade Balance strengthens a currency and vice versa for a negative balance.
- USD/CHF inches lower as the Fed is potentially expected to reduce rates in September.
- Cooling inflation in the US has fueled the odds of the Fed delivering three rate cuts this year.
- SNB Chairman Thomas Jordan emphasized that the central bank consistently made appropriate decisions throughout his tenure.
USD/CHF moves sideways with a negative bias, holding mild losses around 0.8830 during the early European hours on Monday. US Dollar (USD) faces challenges due to the cooling inflation and easing labor market conditions in the United States (US), which have fueled expectations of three rate cuts this year by the Federal Reserve (Fed), starting in September. This has put pressure on the USD/CHF pair.
On Friday, the US Personal Consumption Expenditures (PCE) Price Index indicated a modest rise in inflation for June and provided further signs of easing price pressures. The US PCE Price Index rose by 2.5% year-over-year in June, down slightly from 2.6% in May, meeting market expectations. On a monthly basis, the PCE Price Index increased by 0.1% after being unchanged in May.
However, the US Core PCE inflation, which excludes volatile food and energy prices, also climbed to 2.6% in June, consistent with May's increase and above the forecast of 2.5%. The core PCE Price Index rose by 0.2% month-over-month in June, compared to 0.1% in May.
On the Swiss front, SNB Chairman Thomas Jordan, who will step down at the end of September, mentioned in an interview with Bieler Tagblatt on Saturday, "I would rather be considered boring or stubborn than be criticized for following the wrong monetary policy." Jordan highlighted that the Swiss National Bank (SNB) consistently addressed challenges and made appropriate decisions during his tenure.
Swiss Franc FAQs
The Swiss Franc (CHF) is Switzerland’s official currency. It is among the top ten most traded currencies globally, reaching volumes that well exceed the size of the Swiss economy. Its value is determined by the broad market sentiment, the country’s economic health or action taken by the Swiss National Bank (SNB), among other factors. Between 2011 and 2015, the Swiss Franc was pegged to the Euro (EUR). The peg was abruptly removed, resulting in a more than 20% increase in the Franc’s value, causing a turmoil in markets. Even though the peg isn’t in force anymore, CHF fortunes tend to be highly correlated with the Euro ones due to the high dependency of the Swiss economy on the neighboring Eurozone.
The Swiss Franc (CHF) is considered a safe-haven asset, or a currency that investors tend to buy in times of market stress. This is due to the perceived status of Switzerland in the world: a stable economy, a strong export sector, big central bank reserves or a longstanding political stance towards neutrality in global conflicts make the country’s currency a good choice for investors fleeing from risks. Turbulent times are likely to strengthen CHF value against other currencies that are seen as more risky to invest in.
The Swiss National Bank (SNB) meets four times a year – once every quarter, less than other major central banks – to decide on monetary policy. The bank aims for an annual inflation rate of less than 2%. When inflation is above target or forecasted to be above target in the foreseeable future, the bank will attempt to tame price growth by raising its policy rate. Higher interest rates are generally positive for the Swiss Franc (CHF) as they lead to higher yields, making the country a more attractive place for investors. On the contrary, lower interest rates tend to weaken CHF.
Macroeconomic data releases in Switzerland are key to assessing the state of the economy and can impact the Swiss Franc’s (CHF) valuation. The Swiss economy is broadly stable, but any sudden change in economic growth, inflation, current account or the central bank’s currency reserves have the potential to trigger moves in CHF. Generally, high economic growth, low unemployment and high confidence are good for CHF. Conversely, if economic data points to weakening momentum, CHF is likely to depreciate.
As a small and open economy, Switzerland is heavily dependent on the health of the neighboring Eurozone economies. The broader European Union is Switzerland’s main economic partner and a key political ally, so macroeconomic and monetary policy stability in the Eurozone is essential for Switzerland and, thus, for the Swiss Franc (CHF). With such dependency, some models suggest that the correlation between the fortunes of the Euro (EUR) and the CHF is more than 90%, or close to perfect.
Here is what you need to know on Monday, July 29:
Major currency pairs fluctuate near the previous week's closing levels early Monday as market participants stay on the sidelines ahead of this week's critical data releases and central bank meetings. Dallas Fed Manufacturing Business Index will be the only data featured in the US economic docket.
The US Dollar (USD) Index continues to move sideways below 104.50 in the European morning after ending the week virtually unchanged. Meanwhile, US stock index futures trade in positive territory, while the benchmark 10-year US Treasury bond yield stays below 4.2%. The Federal Reserve (Fed) will announce monetary policy decisions on Wednesday following the July 30-31 meeting. Throughout the week, employment-related data releases from the US will also be watched closely by investors.
US Dollar PRICE Last 7 days
The table below shows the percentage change of US Dollar (USD) against listed major currencies last 7 days. US Dollar was the strongest against the New Zealand Dollar.
| USD | EUR | GBP | JPY | CAD | AUD | NZD | CHF | |
|---|---|---|---|---|---|---|---|---|
| USD | 0.22% | 0.36% | -2.55% | 0.77% | 1.97% | 2.13% | -0.50% | |
| EUR | -0.22% | 0.14% | -2.85% | 0.49% | 1.78% | 1.87% | -0.78% | |
| GBP | -0.36% | -0.14% | -3.08% | 0.35% | 1.65% | 1.69% | -0.94% | |
| JPY | 2.55% | 2.85% | 3.08% | 3.48% | 4.75% | 4.81% | 2.08% | |
| CAD | -0.77% | -0.49% | -0.35% | -3.48% | 1.28% | 1.35% | -1.28% | |
| AUD | -1.97% | -1.78% | -1.65% | -4.75% | -1.28% | 0.06% | -2.54% | |
| NZD | -2.13% | -1.87% | -1.69% | -4.81% | -1.35% | -0.06% | -2.55% | |
| CHF | 0.50% | 0.78% | 0.94% | -2.08% | 1.28% | 2.54% | 2.55% |
The heat map shows percentage changes of major currencies against each other. The base currency is picked from the left column, while the quote currency is picked from the top row. For example, if you pick the US Dollar from the left column and move along the horizontal line to the Japanese Yen, the percentage change displayed in the box will represent USD (base)/JPY (quote).
EUR/USD registered small gains on Thursday and Friday but registered weekly losses. The pair holds steady at around 1.0850 at the beginning of the European session. On Tuesday, second-quarter Gross Domestic Product (GDP) data from Germany and the Eurozone, alongside German inflation data for July, will be featured in the European economic docket.
GBP/USD lost nearly 0.4% last week and closed the second consecutive week in negative territory. The pair stays in a consolidation phase above 1.2850 on Monday. On Thursday, the Bank of England (BoE) will announce its interest rate decisions.
Gold gained traction on Friday and erased a portion of its weekly losses. Although XAU/USD started the week on a bullish noted and climbed above $2,400 during the Asian trading hours, it retreated below this level by the European morning. At the time of press, Gold was trading marginally higher on the day at around $2,390.
The Bank of Japan (BoJ) will release its monetary policy decision in the Asian session on Wednesday. USD/JPY lost over 2% last week and edged lower early Monday. As of writing, the pair was trading slightly below 153.50.
The Australian Bureau of Statistics will publish the quarterly Consumer Price Index (CPI) data for the second quarter on Wednesday. AUD/USD posted losses for nine consecutive trading days and touched its lowest level since early May near 0.6500 before staging a modest rebound on Friday. The pair trades in a narrow channel at around 0.6550 in the European morning on Monday.
Central banks FAQs
Central Banks have a key mandate which is making sure that there is price stability in a country or region. Economies are constantly facing inflation or deflation when prices for certain goods and services are fluctuating. Constant rising prices for the same goods means inflation, constant lowered prices for the same goods means deflation. It is the task of the central bank to keep the demand in line by tweaking its policy rate. For the biggest central banks like the US Federal Reserve (Fed), the European Central Bank (ECB) or the Bank of England (BoE), the mandate is to keep inflation close to 2%.
A central bank has one important tool at its disposal to get inflation higher or lower, and that is by tweaking its benchmark policy rate, commonly known as interest rate. On pre-communicated moments, the central bank will issue a statement with its policy rate and provide additional reasoning on why it is either remaining or changing (cutting or hiking) it. Local banks will adjust their savings and lending rates accordingly, which in turn will make it either harder or easier for people to earn on their savings or for companies to take out loans and make investments in their businesses. When the central bank hikes interest rates substantially, this is called monetary tightening. When it is cutting its benchmark rate, it is called monetary easing.
A central bank is often politically independent. Members of the central bank policy board are passing through a series of panels and hearings before being appointed to a policy board seat. Each member in that board often has a certain conviction on how the central bank should control inflation and the subsequent monetary policy. Members that want a very loose monetary policy, with low rates and cheap lending, to boost the economy substantially while being content to see inflation slightly above 2%, are called ‘doves’. Members that rather want to see higher rates to reward savings and want to keep a lit on inflation at all time are called ‘hawks’ and will not rest until inflation is at or just below 2%.
Normally, there is a chairman or president who leads each meeting, needs to create a consensus between the hawks or doves and has his or her final say when it would come down to a vote split to avoid a 50-50 tie on whether the current policy should be adjusted. The chairman will deliver speeches which often can be followed live, where the current monetary stance and outlook is being communicated. A central bank will try to push forward its monetary policy without triggering violent swings in rates, equities, or its currency. All members of the central bank will channel their stance toward the markets in advance of a policy meeting event. A few days before a policy meeting takes place until the new policy has been communicated, members are forbidden to talk publicly. This is called the blackout period.
- EUR/JPY trades on a weaker note near 166.55 in Monday’s early European session, down 0.26% on the day.
- The Japanese Yen’s recent rally is supported by expectations of the BOJ rate hike on Wednesday.
- Investors will monitor the key Eurozone/German economic data on Tuesday ahead of the BoJ rate decision.
The EUR/JPY cross remains on the defensive around 166.55 during the early European trading hours on Monday. The Japanese Yen (JPY) extends a rally as traders raise their bets on the prospect of a rate hike by the Bank of Japan (BoJ) on Wednesday.
Market players await the BoJ monetary policy meeting on Wednesday for fresh catalysts. The growing speculation that a BoJ would raise interest rates and significantly reduce its monthly bond purchases continue to underpin the JPY against the Euro (EUR). Additionally, traders could potentially unwind their carry trades ahead of the BoJ's rate decision, which might lift the JPY.
Elsewhere, the escalating geopolitical risks in the Middle East might boost the safe-haven flows, benefiting the JPY. The Golan Heights attack on Saturday raised worries about a war between Israel and Hezbollah. Israel accuses Hezbollah of carrying out the strike on a football pitch, which killed at least 12 people, including children, and it has promised to react. However, Hezbollah denies being involved in the attack, according to the BBC on Sunday.
On the other hand, investors anticipate the European Central Bank (ECB) rate cuts in the near term, which exerts some selling pressure on the shared currency. ECB President Christine Lagarde indicated that additional data is necessary to confirm the ongoing disinflationary trend and to gain the ECB's confidence. The key Eurozone economic data this week might offer some hints on the path of interest rates this year.
The preliminary Gross Domestic Product (GDP) for the second quarter (Q2) from Germany and the Eurozone will be released on Wednesday, along with the German Consumer Price Index (CPI) for July. Any signs of stronger economic growth or sticky inflation could lift the Euro and cap the downside for the cross in the near term.
Japanese Yen FAQs
The Japanese Yen (JPY) is one of the world’s most traded currencies. Its value is broadly determined by the performance of the Japanese economy, but more specifically by the Bank of Japan’s policy, the differential between Japanese and US bond yields, or risk sentiment among traders, among other factors.
One of the Bank of Japan’s mandates is currency control, so its moves are key for the Yen. The BoJ has directly intervened in currency markets sometimes, generally to lower the value of the Yen, although it refrains from doing it often due to political concerns of its main trading partners. The current BoJ ultra-loose monetary policy, based on massive stimulus to the economy, has caused the Yen to depreciate against its main currency peers. This process has exacerbated more recently due to an increasing policy divergence between the Bank of Japan and other main central banks, which have opted to increase interest rates sharply to fight decades-high levels of inflation.
The BoJ’s stance of sticking to ultra-loose monetary policy has led to a widening policy divergence with other central banks, particularly with the US Federal Reserve. This supports a widening of the differential between the 10-year US and Japanese bonds, which favors the US Dollar against the Japanese Yen.
The Japanese Yen is often seen as a safe-haven investment. This means that in times of market stress, investors are more likely to put their money in the Japanese currency due to its supposed reliability and stability. Turbulent times are likely to strengthen the Yen’s value against other currencies seen as more risky to invest in.
FX option expiries for July 29 NY cut at 10:00 Eastern Time, via DTCC, can be found below.
- EUR/USD: EUR amounts
- 1.0700 809m
- 1.0800 810m
- 1.0835 888m
- 1.0900 866m
- GBP/USD: GBP amounts
- 1.2600 1.4b
- USD/JPY: USD amounts
- 153.25 815m
- 153.30 400m
- 154.00 1.5b
- AUD/USD: AUD amounts
- 0.6670 827m
- 0.6680 1.4b
- USD/CAD: USD amounts
- 1.3575 1.7b
- 1.3700 602m
- GBP/USD trades firmer near 1.2875 in Monday’s early European session.
- The negative outlook for the pair remains in play, with bearish RSI indicator on 4-hour chart.
- The first upside barrier is seen at 1.2919; initial support level is located at 1.2843.
The GBP/USD pair trades on a stronger note around 1.2875 during the early European trading hours on Monday. The softer Greenback amid the hope of an interest rate cut by the US Federal Reserve (Fed) in September provides some support to the major pair. The US Federal Reserve (Fed) Interest Rate Decision will be to highlight on Wednesday, with no change in rate expected.
GBP/USD maintains a bearish outlook on the 4-hour chart. Meanwhile, the Relative Strength Index (RSI) holds below the 50-midline, indicating that further downside looks favorable. However, the uptrend would resume once the major pair decisive crosses above the key 100-period Exponential Moving Average (EMA).
The upper boundary of the Bollinger Band at 1.2919 acts as an immediate resistance level for GBP/USD. A break above this level could pave the way to 1.2938, a high of July 24. Further north, the crucial hurdle will emerge at the 1.2990-1.3000 region, representing a high of July 12 and psychological mark.
On the flip side, the first downside target for the pair is seen at 1.2843, the lower limit of the Bollinger Band. A breach of this level will see a drop to 1.2777, a low of July 9. The additional downside filter to watch is 1.2739, a low of July 4.
GBP/USD 4-hour chart
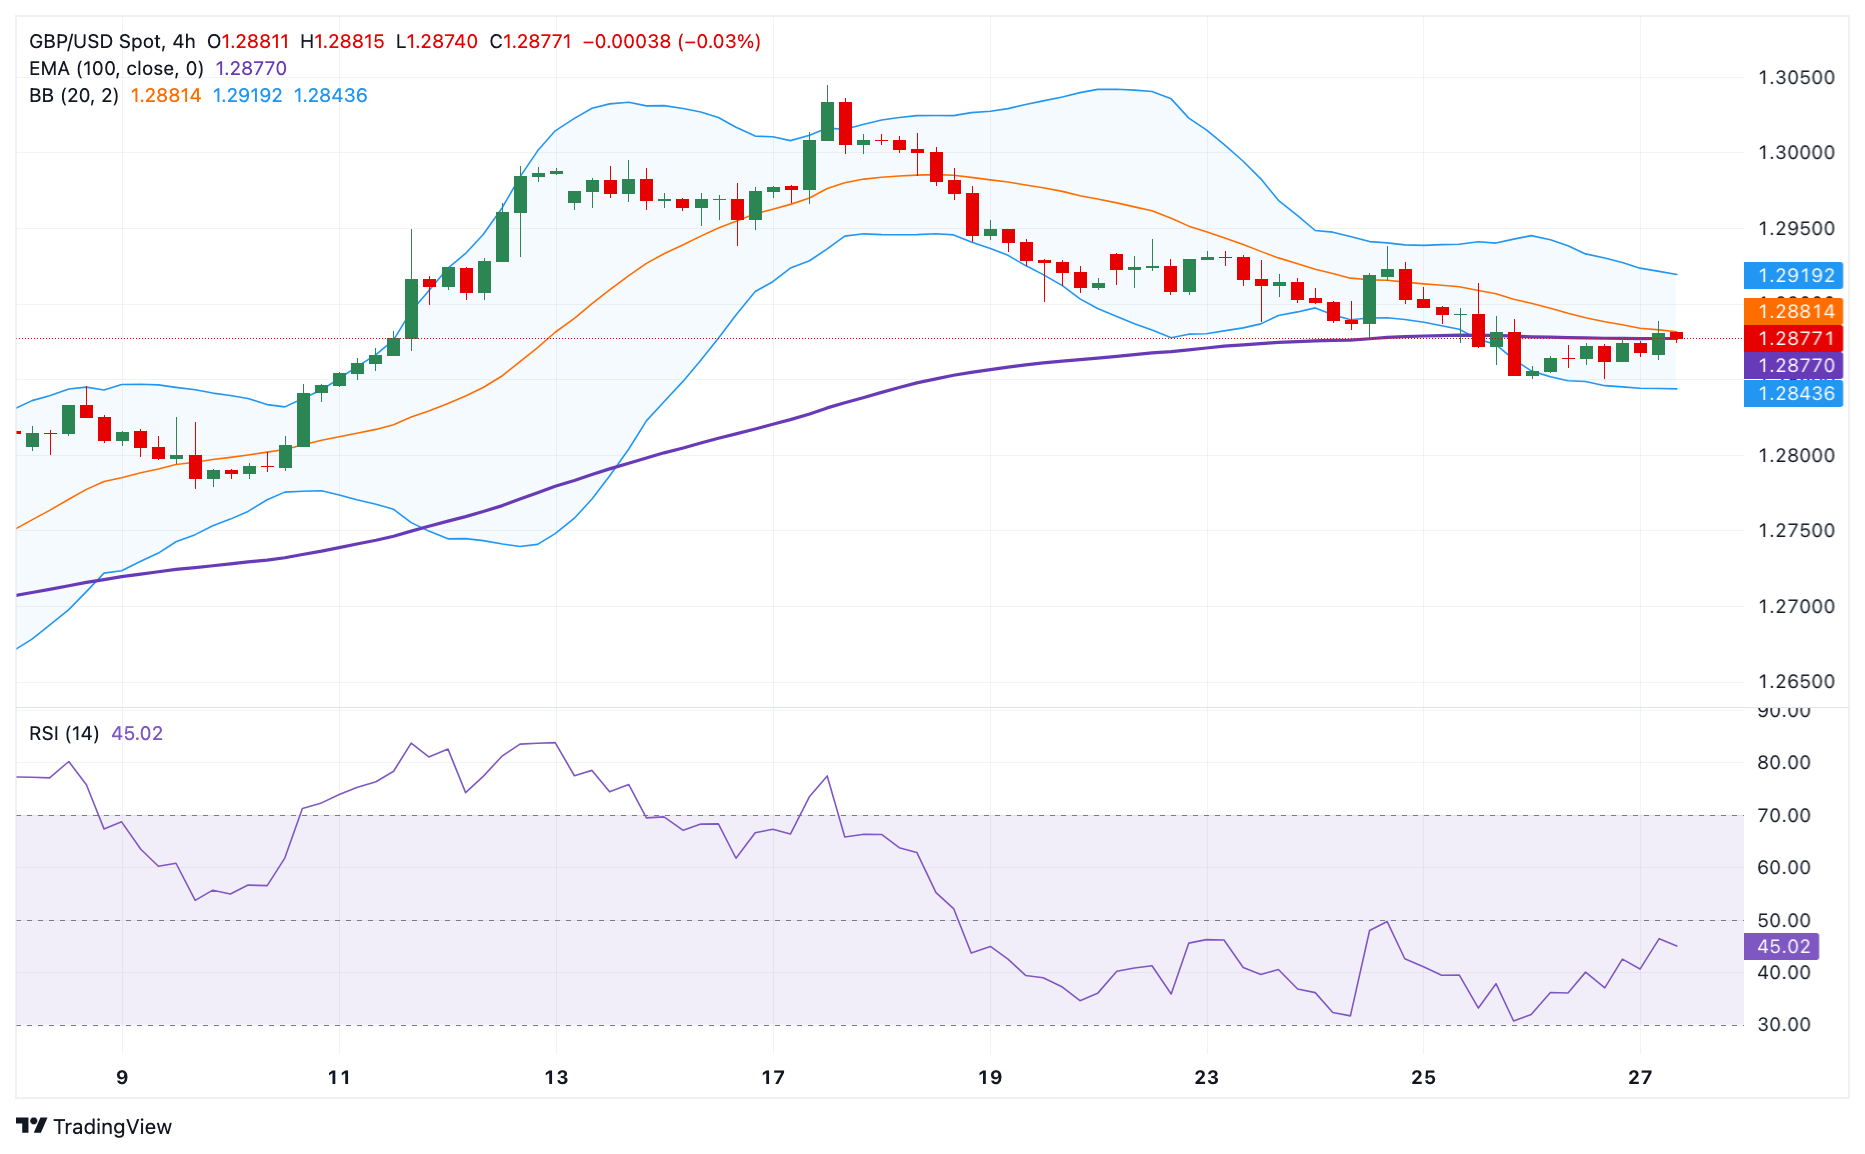
Pound Sterling FAQs
The Pound Sterling (GBP) is the oldest currency in the world (886 AD) and the official currency of the United Kingdom. It is the fourth most traded unit for foreign exchange (FX) in the world, accounting for 12% of all transactions, averaging $630 billion a day, according to 2022 data. Its key trading pairs are GBP/USD, aka ‘Cable’, which accounts for 11% of FX, GBP/JPY, or the ‘Dragon’ as it is known by traders (3%), and EUR/GBP (2%). The Pound Sterling is issued by the Bank of England (BoE).
The single most important factor influencing the value of the Pound Sterling is monetary policy decided by the Bank of England. The BoE bases its decisions on whether it has achieved its primary goal of “price stability” – a steady inflation rate of around 2%. Its primary tool for achieving this is the adjustment of interest rates. When inflation is too high, the BoE will try to rein it in by raising interest rates, making it more expensive for people and businesses to access credit. This is generally positive for GBP, as higher interest rates make the UK a more attractive place for global investors to park their money. When inflation falls too low it is a sign economic growth is slowing. In this scenario, the BoE will consider lowering interest rates to cheapen credit so businesses will borrow more to invest in growth-generating projects.
Data releases gauge the health of the economy and can impact the value of the Pound Sterling. Indicators such as GDP, Manufacturing and Services PMIs, and employment can all influence the direction of the GBP. A strong economy is good for Sterling. Not only does it attract more foreign investment but it may encourage the BoE to put up interest rates, which will directly strengthen GBP. Otherwise, if economic data is weak, the Pound Sterling is likely to fall.
Another significant data release for the Pound Sterling is the Trade Balance. This indicator measures the difference between what a country earns from its exports and what it spends on imports over a given period. If a country produces highly sought-after exports, its currency will benefit purely from the extra demand created from foreign buyers seeking to purchase these goods. Therefore, a positive net Trade Balance strengthens a currency and vice versa for a negative balance.
Gold prices rose in India on Monday, according to data compiled by FXStreet.
The price for Gold stood at 6,445.14 Indian Rupees (INR) per gram, up compared with the INR 6,426.02 it cost on Friday.
The price for Gold increased to INR 75,174.79 per tola from INR 74,951.87 per tola on friday.
| Unit measure | Gold Price in INR |
|---|---|
| 1 Gram | 6,445.14 |
| 10 Grams | 64,451.62 |
| Tola | 75,174.79 |
| Troy Ounce | 200,466.20 |
FXStreet calculates Gold prices in India by adapting international prices (USD/INR) to the local currency and measurement units. Prices are updated daily based on the market rates taken at the time of publication. Prices are just for reference and local rates could diverge slightly.
Gold FAQs
Gold has played a key role in human’s history as it has been widely used as a store of value and medium of exchange. Currently, apart from its shine and usage for jewelry, the precious metal is widely seen as a safe-haven asset, meaning that it is considered a good investment during turbulent times. Gold is also widely seen as a hedge against inflation and against depreciating currencies as it doesn’t rely on any specific issuer or government.
Central banks are the biggest Gold holders. In their aim to support their currencies in turbulent times, central banks tend to diversify their reserves and buy Gold to improve the perceived strength of the economy and the currency. High Gold reserves can be a source of trust for a country’s solvency. Central banks added 1,136 tonnes of Gold worth around $70 billion to their reserves in 2022, according to data from the World Gold Council. This is the highest yearly purchase since records began. Central banks from emerging economies such as China, India and Turkey are quickly increasing their Gold reserves.
Gold has an inverse correlation with the US Dollar and US Treasuries, which are both major reserve and safe-haven assets. When the Dollar depreciates, Gold tends to rise, enabling investors and central banks to diversify their assets in turbulent times. Gold is also inversely correlated with risk assets. A rally in the stock market tends to weaken Gold price, while sell-offs in riskier markets tend to favor the precious metal.
The price can move due to a wide range of factors. Geopolitical instability or fears of a deep recession can quickly make Gold price escalate due to its safe-haven status. As a yield-less asset, Gold tends to rise with lower interest rates, while higher cost of money usually weighs down on the yellow metal. Still, most moves depend on how the US Dollar (USD) behaves as the asset is priced in dollars (XAU/USD). A strong Dollar tends to keep the price of Gold controlled, whereas a weaker Dollar is likely to push Gold prices up.
(An automation tool was used in creating this post.)
- EUR/USD extends gains toward the upper boundary of the descending channel around the 1.0890 level.
- The 14-day RSI is still positioned above the 50 level, suggesting a bullish sentiment for the pair.
- The pair could find key support around the 50-day EMA at 1.0819 level.
EUR/USD advances for the third consecutive day, trading around 1.0860 during the Asian session on Monday. The analysis of the daily chart shows that the pair is positioned within a descending channel, suggesting a bearish bias.
However, the 14-day Relative Strength Index (RSI), a momentum indicator, is still positioned above the 50 level, suggesting a bullish sentiment for the EUR/USD pair. Further movement will give a clear directional trend.
The EUR/USD pair could test a potential resistance at the upper boundary of the descending channel around the level of 1.0890, followed by the psychological level of 1.0900. A breakthrough above this level could lead the pair to revisit a four-month high of 1.0948 level.
On the downside, the pair could find the key support at the lower boundary of the descending channel around the 50-day Exponential Moving Average (EMA) at 1.0819 level. A break below this level could exert downward pressure on the EUR/USD pair to navigate the region around the key level of 1.0670, potentially serving as a throwback support level.
EUR/USD: Daily Chart
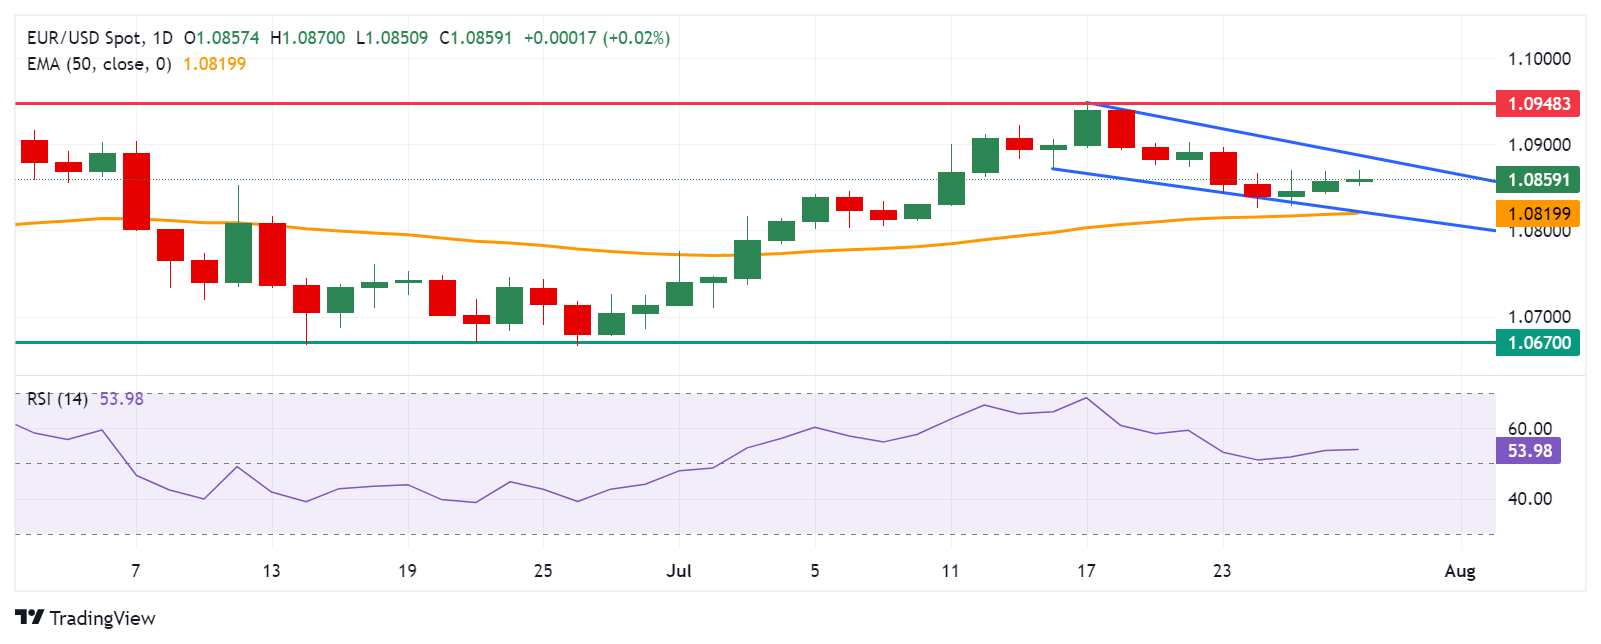
Euro PRICE Today
The table below shows the percentage change of Euro (EUR) against listed major currencies today. Euro was the strongest against the New Zealand Dollar.
| USD | EUR | GBP | JPY | CAD | AUD | NZD | CHF | |
|---|---|---|---|---|---|---|---|---|
| USD | -0.02% | -0.06% | -0.25% | -0.05% | -0.02% | 0.07% | -0.08% | |
| EUR | 0.02% | -0.07% | -0.23% | -0.01% | 0.04% | 0.07% | -0.04% | |
| GBP | 0.06% | 0.07% | -0.20% | 0.04% | 0.11% | 0.15% | 0.03% | |
| JPY | 0.25% | 0.23% | 0.20% | 0.15% | 0.23% | 0.29% | 0.19% | |
| CAD | 0.05% | 0.01% | -0.04% | -0.15% | 0.06% | 0.09% | -0.01% | |
| AUD | 0.02% | -0.04% | -0.11% | -0.23% | -0.06% | 0.06% | -0.08% | |
| NZD | -0.07% | -0.07% | -0.15% | -0.29% | -0.09% | -0.06% | -0.12% | |
| CHF | 0.08% | 0.04% | -0.03% | -0.19% | 0.00% | 0.08% | 0.12% |
The heat map shows percentage changes of major currencies against each other. The base currency is picked from the left column, while the quote currency is picked from the top row. For example, if you pick the Euro from the left column and move along the horizontal line to the US Dollar, the percentage change displayed in the box will represent EUR (base)/USD (quote).
- Silver builds on last week’s modest bounce from the lowest level since May 9.
- The technical setup warrants caution before positioning for any further gains.
- The $27.45 area, or the multi-month low, is the last line of defence for bulls.
Silver (XAG/USD) trades with a positive bias for the second straight day on Monday and moves further away from its lowest level since May 9 touched last week. The white metal currently trades just above the $28.00 mark, up over 0.50% for the day, though the technical setup warrants some caution before positioning for any further appreciating move.
Last week's sustained breakdown through the $28.65-$28.60 horizontal support or the June swing low, which coincided with the 100-day Simple Moving Average (SMA), was seen as a fresh trigger for bearish traders. Moreover, oscillators on the daily chart are holding in negative territory and are still far from being in the oversold zone. This suggests that the path of least resistance for the XAU/USD is to the downside and supports prospects for the emergence of fresh selling at higher levels.
Hence, any subsequent move up is more likely to attract fresh sellers and remain capped near the $28.55-$28.60 zone, or the 100-day SMA support breakpoint. The said area should now act as a key pivotal point, which if cleared decisively might trigger a short-covering rally and allow the XAG/USD to reclaim the $29.00 round-figure mark. The momentum could extend further towards the next relevant hurdle near the $29.40-$29.45 supply zone, coinciding with last week's swing high.
On the flip side, the $27.45 region, or the multi-month low set last Thursday, now seems to act as an immediate strong support. Some follow-through selling will reaffirm the near-term negative outlook and make the XAG/USD vulnerable to accelerate the fall to the $27.00 mark. The white metal could weaken further below the $26.60-$26.55 intermediate support and eventually drop to the very important 200-day SMA support, currently pegged just below the $26.00 round figure.
Silver daily chart
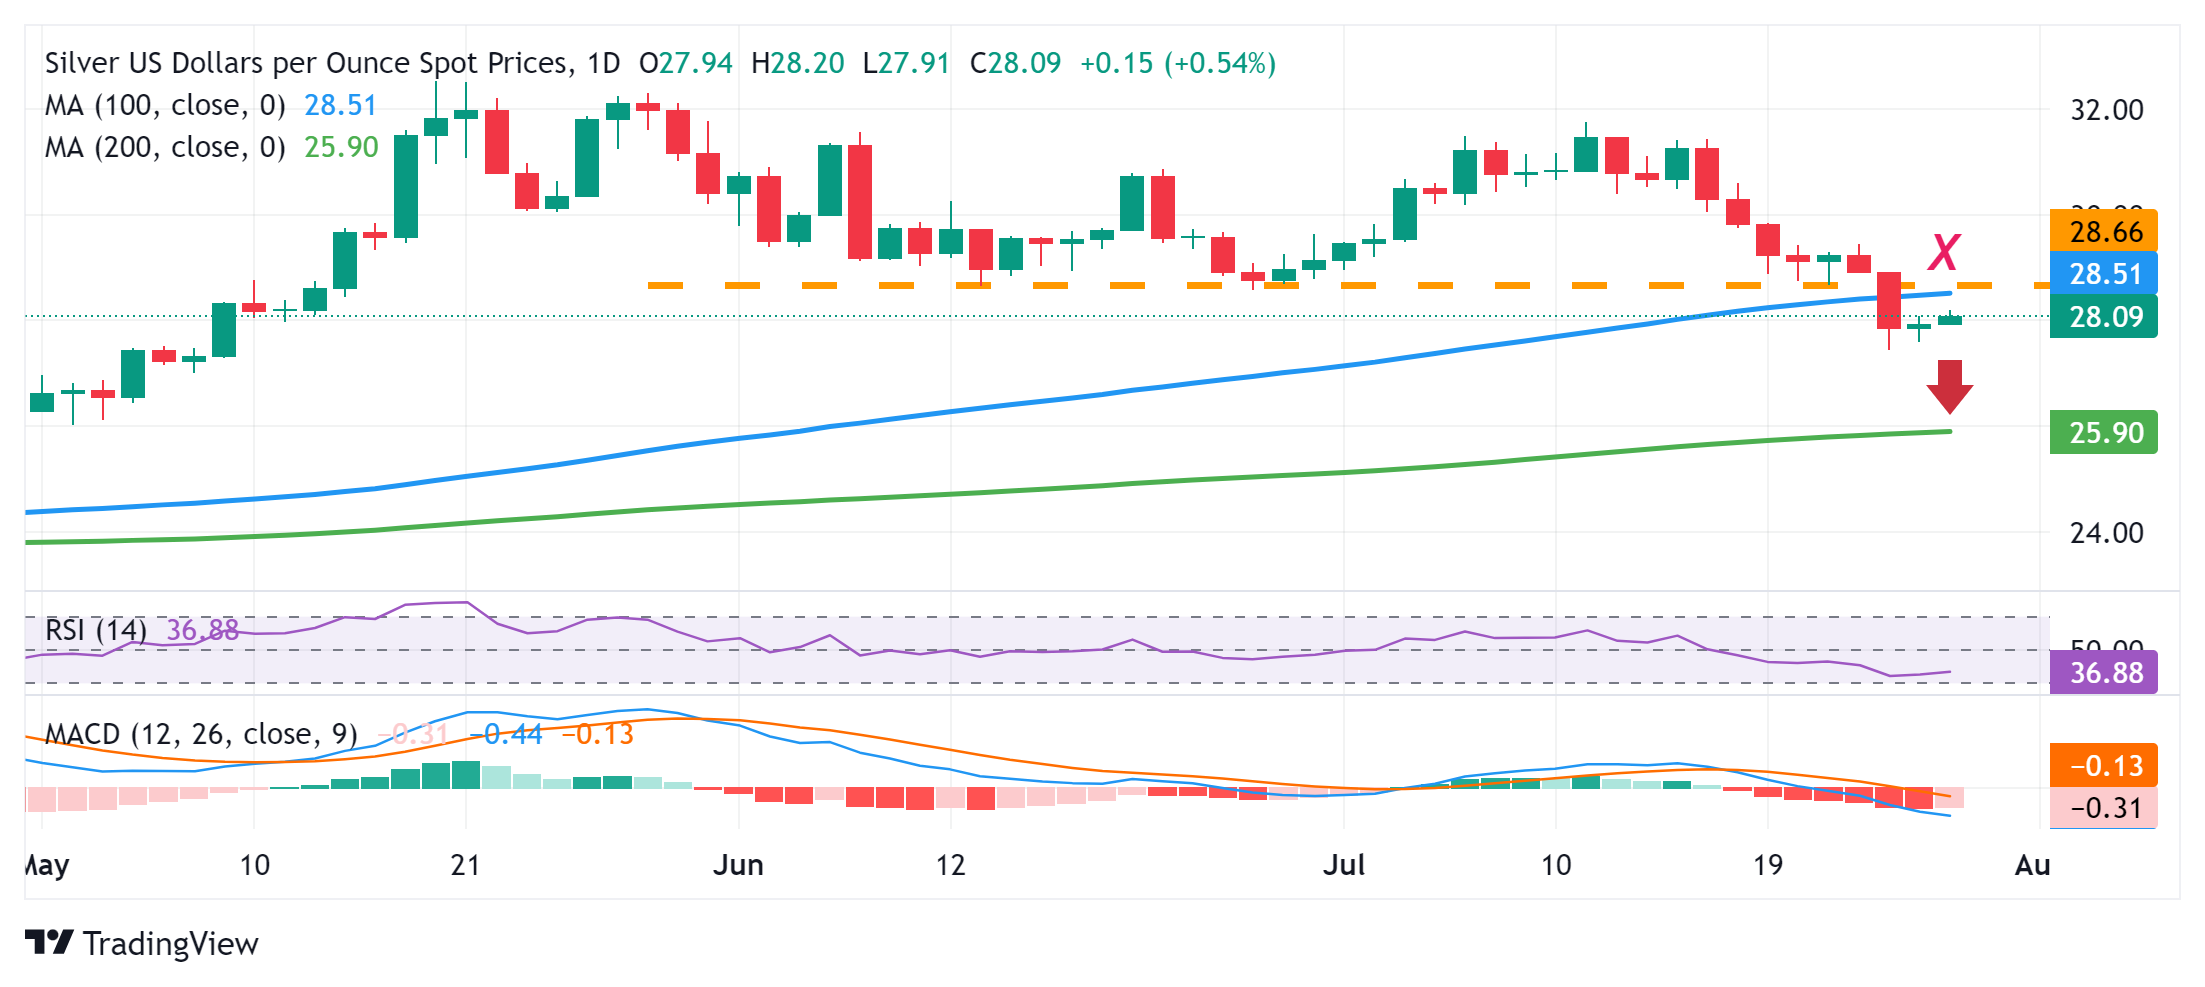
Silver FAQs
Silver is a precious metal highly traded among investors. It has been historically used as a store of value and a medium of exchange. Although less popular than Gold, traders may turn to Silver to diversify their investment portfolio, for its intrinsic value or as a potential hedge during high-inflation periods. Investors can buy physical Silver, in coins or in bars, or trade it through vehicles such as Exchange Traded Funds, which track its price on international markets.
Silver prices can move due to a wide range of factors. Geopolitical instability or fears of a deep recession can make Silver price escalate due to its safe-haven status, although to a lesser extent than Gold's. As a yieldless asset, Silver tends to rise with lower interest rates. Its moves also depend on how the US Dollar (USD) behaves as the asset is priced in dollars (XAG/USD). A strong Dollar tends to keep the price of Silver at bay, whereas a weaker Dollar is likely to propel prices up. Other factors such as investment demand, mining supply – Silver is much more abundant than Gold – and recycling rates can also affect prices.
Silver is widely used in industry, particularly in sectors such as electronics or solar energy, as it has one of the highest electric conductivity of all metals – more than Copper and Gold. A surge in demand can increase prices, while a decline tends to lower them. Dynamics in the US, Chinese and Indian economies can also contribute to price swings: for the US and particularly China, their big industrial sectors use Silver in various processes; in India, consumers’ demand for the precious metal for jewellery also plays a key role in setting prices.
Silver prices tend to follow Gold's moves. When Gold prices rise, Silver typically follows suit, as their status as safe-haven assets is similar. The Gold/Silver ratio, which shows the number of ounces of Silver needed to equal the value of one ounce of Gold, may help to determine the relative valuation between both metals. Some investors may consider a high ratio as an indicator that Silver is undervalued, or Gold is overvalued. On the contrary, a low ratio might suggest that Gold is undervalued relative to Silver.
- NZD/USD gains some positive traction on Monday amid a modest USD weakness.
- Dovish Fed expectations and a positive risk tone undermine the safe-haven buck.
- China’s economic woes and RBNZ rate cut bets to cap any further gains for the pair.
The NZD/USD pair attracts some dip-buyers near the 0.5880 area during the Asian session on Monday amid a softer US Dollar (USD), albeit lacks bullish conviction. Spot prices currently trade around the 0.5900 round figure and remain well within the striking distance of the lowest level since early May touched last Thursday.
The US Personal Consumption Expenditures (PCE) Price Index data released on Friday added to the recent signs of easing price pressures and reaffirmed bets that the Federal Reserve (Fed) will start cutting interest rates in December. This, in turn, drags the US Treasury bond yields to a nearly two-week low, which, along with the risk-on impulse, keeps the USD bulls on the defensive and turns out to be a key factor lending some support to the NZD/USD pair.
That said, persistent worries about a slowdown in China – the world's second-largest economy – might continue to act as a headwind for antipodean currencies, including the Kiwi. Adding to this, rising bets for an early interest rate cut by the Reserve Bank of New Zealand (RBNZ), bolstered by the weaker CPI report released last week, contribute to capping the NZD/USD pair. This, in turn, warrants some caution before positioning for further intraday gains.
Traders might also refrain from placing aggressive directional bets and prefer to wait for the outcome of a two-day FOMC policy meeting on Wednesday. The highly-anticipated Fed decision, along with important US macro releases scheduled at the start of a new month, including the Nonfarm Payrolls report, will play a key role in influencing the near-term USD price dynamics. This, in turn, will provide some meaningful impetus to the NZD/USD pair.
US Dollar PRICE Today
The table below shows the percentage change of US Dollar (USD) against listed major currencies today. US Dollar was the strongest against the Japanese Yen.
| USD | EUR | GBP | JPY | CAD | AUD | NZD | CHF | |
|---|---|---|---|---|---|---|---|---|
| USD | -0.05% | -0.12% | -0.03% | -0.09% | -0.23% | -0.14% | -0.08% | |
| EUR | 0.05% | -0.09% | 0.02% | -0.01% | -0.13% | -0.07% | -0.01% | |
| GBP | 0.12% | 0.09% | 0.08% | 0.06% | -0.04% | 0.04% | 0.09% | |
| JPY | 0.03% | -0.02% | -0.08% | -0.09% | -0.19% | -0.09% | -0.03% | |
| CAD | 0.09% | 0.00% | -0.06% | 0.09% | -0.11% | -0.06% | 0.02% | |
| AUD | 0.23% | 0.13% | 0.04% | 0.19% | 0.11% | 0.10% | 0.13% | |
| NZD | 0.14% | 0.07% | -0.04% | 0.09% | 0.06% | -0.10% | 0.05% | |
| CHF | 0.08% | 0.00% | -0.09% | 0.03% | -0.02% | -0.13% | -0.05% |
The heat map shows percentage changes of major currencies against each other. The base currency is picked from the left column, while the quote currency is picked from the top row. For example, if you pick the US Dollar from the left column and move along the horizontal line to the Japanese Yen, the percentage change displayed in the box will represent USD (base)/JPY (quote).
- USD/CAD loses ground as Oil prices rise due to escalated tensions in the Middle East.
- A rocket strike in the Israeli-occupied Golan Heights has heightened concerns about crude Oil supply.
- The US Dollar depreciates as the Fed may deliver three rate cuts in 2024.
USD/CAD pulls back from an eight-month high of 1.3849 recorded in the previous session, trading around 1.3820 during the Asian hours on Monday. The rise in Oil prices supports the Canadian Dollar (CAD) and puts downward pressure on the USD/CAD pair.
West Texas Intermediate (WTI) crude Oil trades around $76.80 per barrel at the time of writing. This upside is driven by concerns over a potential escalation in the Middle East following a rocket strike in the Israeli-occupied Golan Heights, which Israel and the United States (US) have attributed to the Lebanese armed group Hezbollah, according to Reuters.
Israel's security cabinet authorized Prime Minister Benjamin Netanyahu's government on Sunday to determine the "manner and timing" of a response to the rocket strike, which killed 12 teenagers and children on Saturday.
Additionally, the US Dollar (USD) faces challenges due to the cooling inflation and easing labor market conditions in the United States (US), which have fueled expectations of three rate cuts this year by the Federal Reserve (Fed), starting in September.
These expectations were bolstered by the release of the US Personal Consumption Expenditures (PCE) Price Index on Friday, which indicated a modest rise in inflation for June and provided further signs of easing price pressures.
The US PCE Price Index rose by 2.5% year-over-year in June, down slightly from 2.6% in May, meeting market expectations. On a monthly basis, the PCE Price Index increased by 0.1% after being unchanged in May.
The US Core PCE inflation, which excludes volatile food and energy prices, also climbed to 2.6% in June, consistent with May's increase and above the forecast of 2.5%. The core PCE Price Index rose by 0.2% month-over-month in June, compared to 0.1% in May.
Canadian Dollar FAQs
The key factors driving the Canadian Dollar (CAD) are the level of interest rates set by the Bank of Canada (BoC), the price of Oil, Canada’s largest export, the health of its economy, inflation and the Trade Balance, which is the difference between the value of Canada’s exports versus its imports. Other factors include market sentiment – whether investors are taking on more risky assets (risk-on) or seeking safe-havens (risk-off) – with risk-on being CAD-positive. As its largest trading partner, the health of the US economy is also a key factor influencing the Canadian Dollar.
The Bank of Canada (BoC) has a significant influence on the Canadian Dollar by setting the level of interest rates that banks can lend to one another. This influences the level of interest rates for everyone. The main goal of the BoC is to maintain inflation at 1-3% by adjusting interest rates up or down. Relatively higher interest rates tend to be positive for the CAD. The Bank of Canada can also use quantitative easing and tightening to influence credit conditions, with the former CAD-negative and the latter CAD-positive.
The price of Oil is a key factor impacting the value of the Canadian Dollar. Petroleum is Canada’s biggest export, so Oil price tends to have an immediate impact on the CAD value. Generally, if Oil price rises CAD also goes up, as aggregate demand for the currency increases. The opposite is the case if the price of Oil falls. Higher Oil prices also tend to result in a greater likelihood of a positive Trade Balance, which is also supportive of the CAD.
While inflation had always traditionally been thought of as a negative factor for a currency since it lowers the value of money, the opposite has actually been the case in modern times with the relaxation of cross-border capital controls. Higher inflation tends to lead central banks to put up interest rates which attracts more capital inflows from global investors seeking a lucrative place to keep their money. This increases demand for the local currency, which in Canada’s case is the Canadian Dollar.
Macroeconomic data releases gauge the health of the economy and can have an impact on the Canadian Dollar. Indicators such as GDP, Manufacturing and Services PMIs, employment, and consumer sentiment surveys can all influence the direction of the CAD. A strong economy is good for the Canadian Dollar. Not only does it attract more foreign investment but it may encourage the Bank of Canada to put up interest rates, leading to a stronger currency. If economic data is weak, however, the CAD is likely to fall.
- The Indian Rupee recovers on the weaker Greenback in Monday’s Asian session.
- Renewed US Dollar demand, India’s foreign outflows and geopolitical risks might weigh on the INR.
- The Fed is widely expected to keep rates unchanged at its July 30-31 meeting.
The Indian Rupee (INR) gains traction on Monday amid the softer US Dollar (USD). The upside for INR is likely to be limited after reaching an all-time low last week, pressured by continuous USD demand from oil importers and India’s outflows from local equities. Additionally, the rising geopolitical risks in the Middle East might boost the safe-haven Greenback ahead of the key US events this week. On the other hand, traders expect the Reserve Bank of India (RBI) to continue intervening in the foreign exchange (FX) market to limit volatility. This, in turn, might cap the pair’s upside in the near term.
The US Federal Reserve (Fed) Interest Rate Decision will take centre stage on Wednesday, with no change in rate expected. Investors will take cues from Fed Chair Jerome Powell's remarks to gauge the future path of US interest rates. Any dovish comments from the Fed officials or hope of a rate cut by the Fed in September might drag the Greenback lower. Later this week, the attention will shift to the Indian HSBC Manufacturing PMI on Thursday and the US Nonfarm Payrolls for July on Friday.
Daily Digest Market Movers: Indian Rupee rebounds despite multiple headwinds
- The Dollar-Rupee pair is likely to move higher steadily with support "shifting upward to 83.45 while getting resisted at 83.85," said Dilip Parmar, a foreign exchange research analyst at HDFC Securities.
- Foreign investors have net sold about $1 billion worth of Indian equities since July 23, when the Indian government proposed to raise taxes on profits from equity investments and on equity derivative transactions.
- The Golan Heights attack on Saturday has raised worries about a war between Israel and Hezbollah. Israel accuses Hezbollah of carrying out the strike on a football pitch, which killed at least 12 people, including children, and it has promised to react. However, Hezbollah denies being involved in the attack, per the BBC.
- The US Personal Consumption Expenditures (PCE) Price Index rose rose 2.5% on a yearly basis in June, compared to 2.6% in May, in line with the market consensus. On a monthly basis, the PCE Price Index increased 0.1% after staying unchanged in May.
- The US Core PCE inflation, which excludes volatile food and energy prices, climbed to 2.6% in the same period, matching May's increase and coming in above the estimation of 2.5% The core PCE Price Index increased 0.2% MoM in June, compared to 0.1% in May.
- The University of Michigan Consumer Sentiment Index jumped to 66.4 in July, better than the estimation and the previous reading of 66.
Technical analysis: Indian Rupee’s bearish picture remains intact
Indian Rupee trades on a stronger note on the day. The USD/INR pair keeps the bullish vibe unchanged as the chart shows an uptrend line, while the price holds above the key 100-day Exponential Moving Average (EMA) on the daily chart. The 14-day Relative Strength Index (RSI) stands above the midline near 58.90, suggesting the long-term trend appears to be bullish.
Bullish candlesticks above the all-time high of 83.85 could draw in enough buyers to push USD/INR up to the 84.00 psychological level.
The initial support level could be found at the uptrend line around 83.70. If bearish momentum continues, look for further downside towards 83.51, a low of July 12. The next potential support level is seen at 83.44, the 100-day EMA.
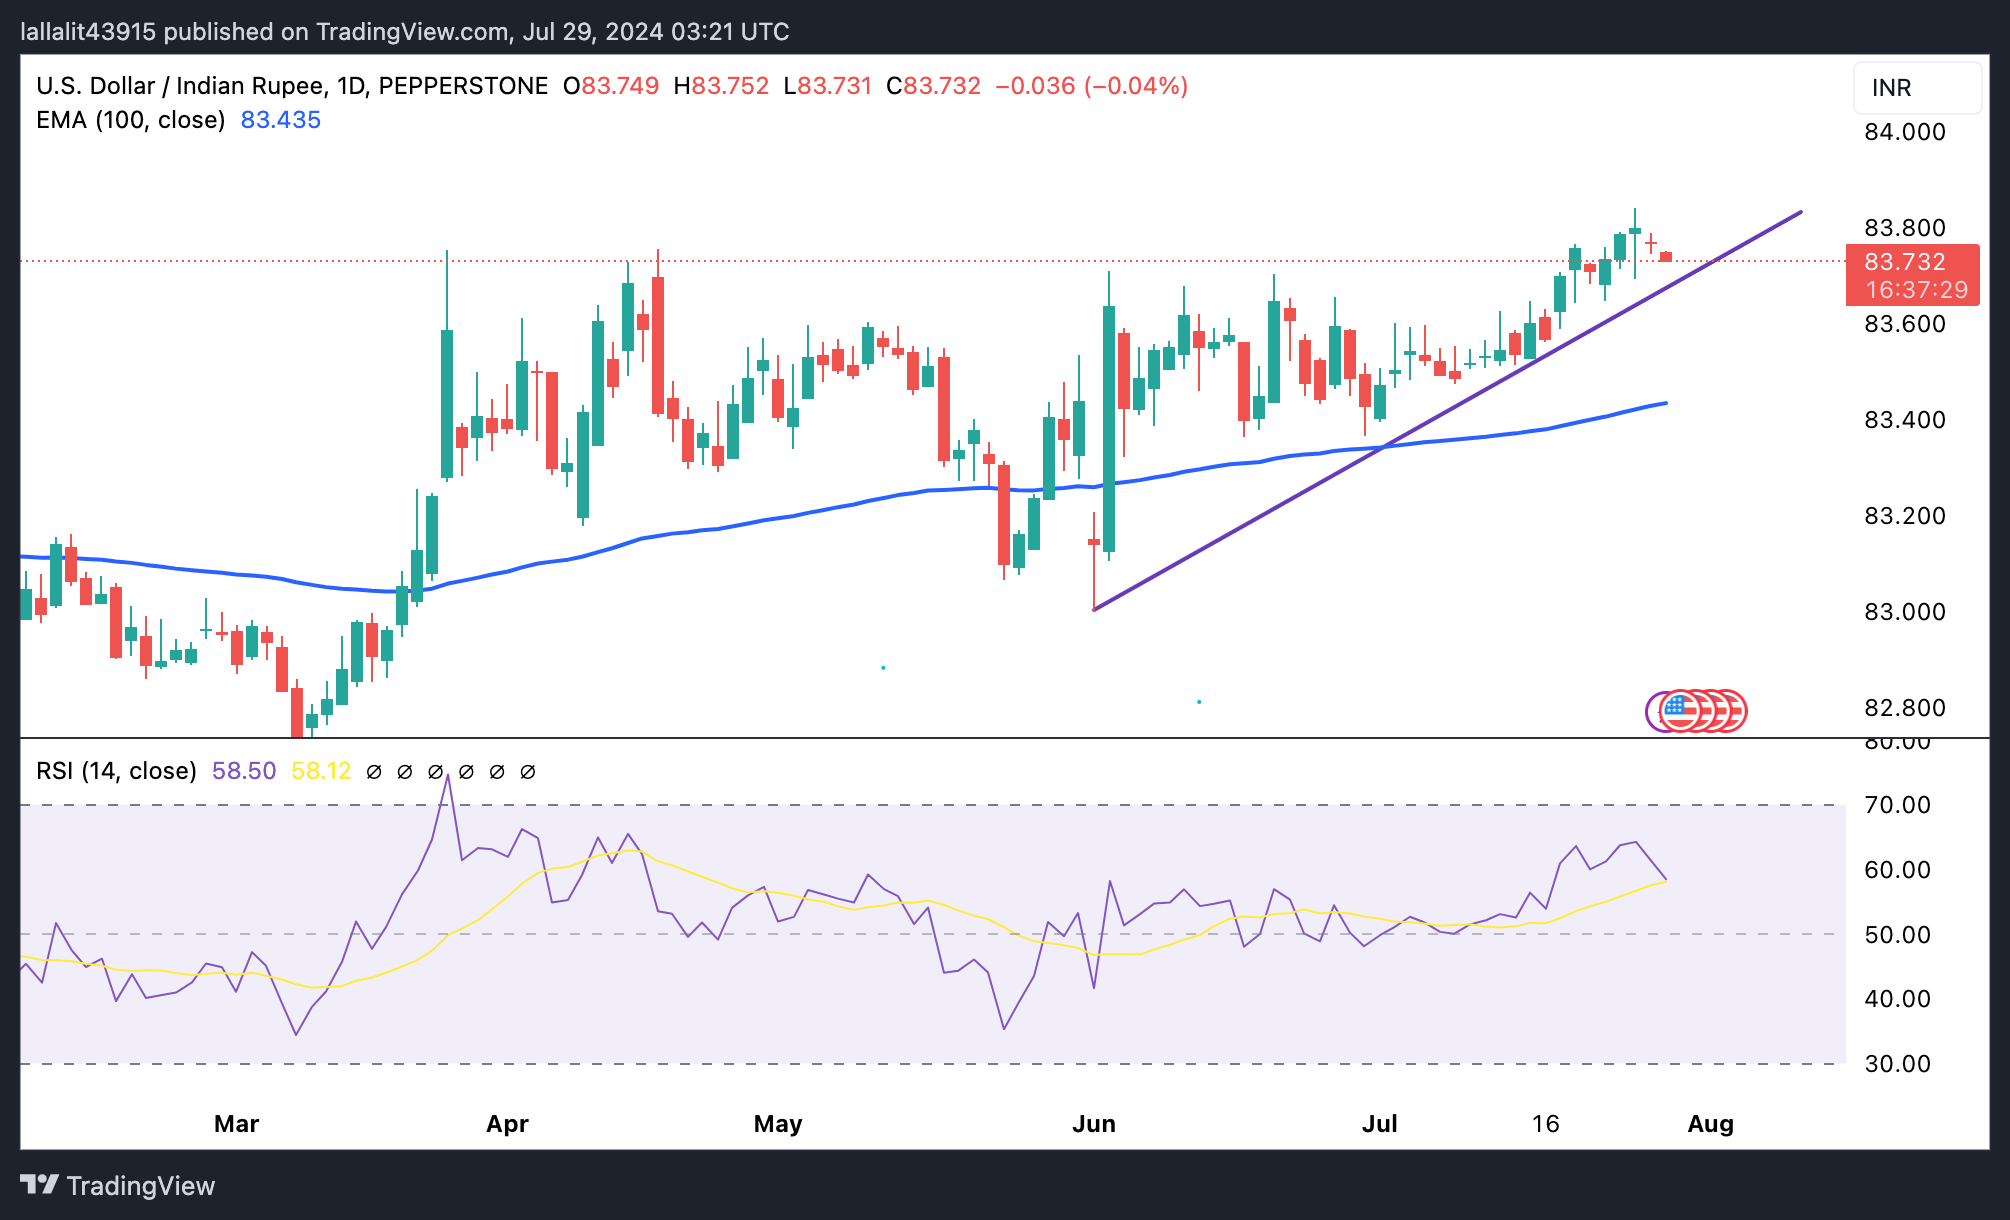
US Dollar price today
The table below shows the percentage change of US Dollar (USD) against listed major currencies today. US Dollar was the weakest against the Japanese Yen.
| USD | EUR | GBP | CAD | AUD | JPY | NZD | CHF | |
| USD | -0.10% | -0.12% | -0.07% | -0.14% | -0.39% | -0.14% | -0.18% | |
| EUR | 0.08% | -0.03% | 0.04% | 0.01% | -0.23% | 0.02% | -0.08% | |
| GBP | 0.11% | 0.03% | 0.07% | 0.02% | -0.24% | 0.01% | -0.06% | |
| CAD | 0.05% | -0.04% | -0.08% | -0.05% | -0.31% | -0.02% | -0.13% | |
| AUD | 0.09% | -0.03% | -0.03% | 0.04% | -0.27% | -0.02% | -0.11% | |
| JPY | 0.31% | 0.25% | 0.23% | 0.25% | 0.38% | 0.20% | 0.11% | |
| NZD | 0.15% | 0.04% | 0.02% | 0.04% | 0.06% | -0.24% | -0.05% | |
| CHF | 0.17% | 0.08% | 0.06% | 0.12% | 0.02% | -0.18% | -0.01% |
The heat map shows percentage changes of major currencies against each other. The base currency is picked from the left column, while the quote currency is picked from the top row. For example, if you pick the Euro from the left column and move along the horizontal line to the Japanese Yen, the percentage change displayed in the box will represent EUR (base)/JPY (quote).
Indian Rupee FAQs
The Indian Rupee (INR) is one of the most sensitive currencies to external factors. The price of Crude Oil (the country is highly dependent on imported Oil), the value of the US Dollar – most trade is conducted in USD – and the level of foreign investment, are all influential. Direct intervention by the Reserve Bank of India (RBI) in FX markets to keep the exchange rate stable, as well as the level of interest rates set by the RBI, are further major influencing factors on the Rupee.
The Reserve Bank of India (RBI) actively intervenes in forex markets to maintain a stable exchange rate, to help facilitate trade. In addition, the RBI tries to maintain the inflation rate at its 4% target by adjusting interest rates. Higher interest rates usually strengthen the Rupee. This is due to the role of the ‘carry trade’ in which investors borrow in countries with lower interest rates so as to place their money in countries’ offering relatively higher interest rates and profit from the difference.
Macroeconomic factors that influence the value of the Rupee include inflation, interest rates, the economic growth rate (GDP), the balance of trade, and inflows from foreign investment. A higher growth rate can lead to more overseas investment, pushing up demand for the Rupee. A less negative balance of trade will eventually lead to a stronger Rupee. Higher interest rates, especially real rates (interest rates less inflation) are also positive for the Rupee. A risk-on environment can lead to greater inflows of Foreign Direct and Indirect Investment (FDI and FII), which also benefit the Rupee.
Higher inflation, particularly, if it is comparatively higher than India’s peers, is generally negative for the currency as it reflects devaluation through oversupply. Inflation also increases the cost of exports, leading to more Rupees being sold to purchase foreign imports, which is Rupee-negative. At the same time, higher inflation usually leads to the Reserve Bank of India (RBI) raising interest rates and this can be positive for the Rupee, due to increased demand from international investors. The opposite effect is true of lower inflation.
- WTI attracts some buyers amid geopolitical risks stemming from conflicts in the Middle East.
- September Fed rate cut expectations undermine the USD and further benefit the commodity.
- Worries about slugging demand in China keep a lid on further gains ahead of the Fed meeting.
West Texas Intermediate (WTI) US crude Oil prices kick off the new week on a positive note and reverse a part of Friday's heavy losses back closer to the lowest level since June 10, around the $75.75 region touched the previous day. The commodity, however, struggles to build on the momentum beyond the $77.00/barrel mark, warranting some caution before positioning for any further appreciating move.
A rocket strike in the Israeli-occupied Golan Heights on Saturday, which killed 12 teenagers and children, raised fears about an all-out war between Israeli forces and Hezbollah in Lebanon. Furthermore, concerns that a wider conflict in the Middle East will
disrupt global crude supply in the key producing region turn out to be a key factor driving flows towards the black liquid. Apart from this, a modest US Dollar (USD) weakness, led by bets for an imminent start of the Federal Reserve's (Fed) policy easing cycle, lends additional support to Crude Oil prices.
Investors now seem convinced that the US central bank will start lowering borrowing costs in September and cut interest rates two more times by the end of this year. The bets were lifted by the release of the US Personal Consumption Expenditures (PCE) Price Index on Friday, which showed that inflation rose modestly in June and added to signs of easing price pressures. Additional details of the report revealed that consumer spending slowed a bit last month, suggesting that growth in the world's largest economy is waning amid a cooling labor market.
This comes on top of sluggish growth in China – the world's top Oil importer – and concerns about falling fuel demand, which, in turn, might cap the upside for the commodity. Traders might also prefer to wait for the outcome of a two-day FOMC monetary policy meeting on Wednesday, which will play a key role in influencing the USD price dynamics and provide some meaningful impetus to Crude Oil prices. This makes it prudent to wait for strong follow-through buying before confirming that the black liquid has indeed formed a near-term bottom.
WTI Oil FAQs
WTI Oil is a type of Crude Oil sold on international markets. The WTI stands for West Texas Intermediate, one of three major types including Brent and Dubai Crude. WTI is also referred to as “light” and “sweet” because of its relatively low gravity and sulfur content respectively. It is considered a high quality Oil that is easily refined. It is sourced in the United States and distributed via the Cushing hub, which is considered “The Pipeline Crossroads of the World”. It is a benchmark for the Oil market and WTI price is frequently quoted in the media.
Like all assets, supply and demand are the key drivers of WTI Oil price. As such, global growth can be a driver of increased demand and vice versa for weak global growth. Political instability, wars, and sanctions can disrupt supply and impact prices. The decisions of OPEC, a group of major Oil-producing countries, is another key driver of price. The value of the US Dollar influences the price of WTI Crude Oil, since Oil is predominantly traded in US Dollars, thus a weaker US Dollar can make Oil more affordable and vice versa.
The weekly Oil inventory reports published by the American Petroleum Institute (API) and the Energy Information Agency (EIA) impact the price of WTI Oil. Changes in inventories reflect fluctuating supply and demand. If the data shows a drop in inventories it can indicate increased demand, pushing up Oil price. Higher inventories can reflect increased supply, pushing down prices. API’s report is published every Tuesday and EIA’s the day after. Their results are usually similar, falling within 1% of each other 75% of the time. The EIA data is considered more reliable, since it is a government agency.
OPEC (Organization of the Petroleum Exporting Countries) is a group of 13 Oil-producing nations who collectively decide production quotas for member countries at twice-yearly meetings. Their decisions often impact WTI Oil prices. When OPEC decides to lower quotas, it can tighten supply, pushing up Oil prices. When OPEC increases production, it has the opposite effect. OPEC+ refers to an expanded group that includes ten extra non-OPEC members, the most notable of which is Russia.
- The Japanese Yen appreciates as BoJ could increase rates by 10 basis points on Wednesday.
- The Bank of Japan is widely expected to announce its bond purchase tapering plans.
- The US Dollar depreciates as signs of cooling inflation have fueled the odds of three rate cuts by the Fed in 2024.
The Japanese Yen (JPY) continues to gain ground on Monday as traders remain cautious ahead of the Bank of Japan’s (BoJ) policy meeting on Wednesday which could see a potential rate hike. Markets are betting that the BoJ may lift rates by 10 basis points to 0.1% and is widely expected to announce its bond purchase tapering plans.
The JPY may also receive support as traders potentially unwind their carry trades ahead of the Bank of Japan's policy decision. Japan's top currency diplomat, Masato Kanda, informed the G20 on Friday that foreign exchange (FX) volatility negatively impacts the Japanese economy. Kanda noted an increasing likelihood of a soft landing and emphasized the need to monitor the economy and implement necessary measures closely, according to Reuters.
The US Dollar (USD) faces challenges as cooling inflation and easing labor market conditions in the United States (US) have fueled expectations of three rate cuts this year by the Federal Reserve (Fed), starting in September.
Daily Digest Market Movers: Japanese Yen improves due to expected rate hikes by the BoJ
- Reuters has published an extensive article on the Bank of Japan (BOJ) review of past policy, highlighting a significant shift in the central bank's approach to inflation. The key message from the review is that Japan is "ready for higher rates." However, the review will not result in changes to the price goal or policy framework.
- On Friday, the US Personal Consumption Expenditures (PCE) Price Index rose by 2.5% year-over-year in June, down slightly from 2.6% in May, meeting market expectations. On a monthly basis, the PCE Price Index increased by 0.1% after being unchanged in May.
- The US Core PCE inflation, which excludes volatile food and energy prices, also climbed to 2.6% in June, consistent with May's increase and above the forecast of 2.5%. The core PCE Price Index rose by 0.2% month-over-month in June, compared to 0.1% in May.
- The headline Tokyo CPI for July increased by 2.2% year-over-year, slightly down from the previous 2.3% rise. The Tokyo CPI excluding Fresh Food and Energy went up by 1.5% YoY, compared to the earlier increase of 1.8%. Moreover, the CPI excluding Fresh Food also rose by 2.2% in July, matching market expectations.
- Bank of America indicates that strong economic growth in the United States allows the Federal Open Market Committee (FOMC) to "afford to wait" before making any changes. The bank states that the economy "remains on robust footing" and continues to expect the Fed to start cutting rates in December.
- Last week, Japanese Finance Minister Shunichi Suzuki, Chief Cabinet Secretary Yoshimasa Hayashi, and top currency diplomat Masato Kanda avoided commenting on foreign exchange matters, according to Reuters.
- The BlackRock Investment Institute noted in its mid-year outlook that Japan’s that the Bank of Japan will not raise interest rates at next week's meeting. Additionally, JP Morgan has also anticipated no rate hike from the Bank of Japan (BoJ) in July or at any point in 2024.
Technical Analysis: USD/JPY falls toward 153.00
USD/JPY trades around 153.20 on Monday. The daily chart analysis shows that the USD/JPY pair tests the descending channel, indicating a potential strengthening of the bearish bias. Additionally, the 14-day Relative Strength Index (RSI) is below the 30 level, signaling an oversold situation and suggesting a potential short-term rebound.
A break below the lower boundary of the descending channel around the level of 153.00 could exert downward pressure, potentially pushing the USD/JPY pair to revisit May's low of 151.86. Additional support may be found at the psychological level of 151.00.
On the upside, the USD/JPY pair may test the "throwback support turned resistance" around 154.50. Further resistance is likely at the nine-day Exponential Moving Average (EMA) of 155.24, followed by the upper boundary of the descending channel near 156.20.
USD/JPY: Daily Chart
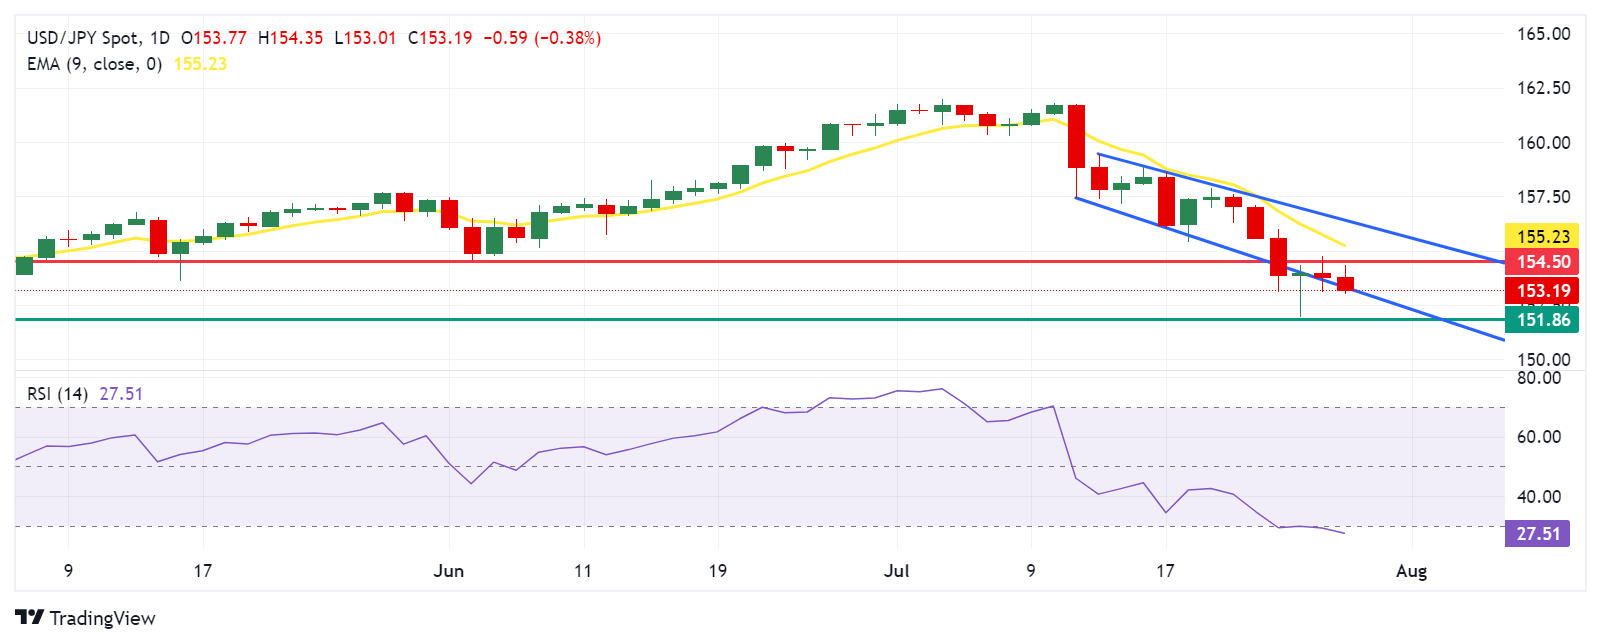
Japanese Yen PRICE Today
The table below shows the percentage change of Japanese Yen (JPY) against listed major currencies today. Japanese Yen was the strongest against the US Dollar.
| USD | EUR | GBP | JPY | CAD | AUD | NZD | CHF | |
|---|---|---|---|---|---|---|---|---|
| USD | -0.09% | -0.13% | -0.31% | -0.08% | -0.18% | -0.10% | -0.16% | |
| EUR | 0.09% | -0.07% | -0.23% | 0.03% | -0.04% | -0.02% | -0.05% | |
| GBP | 0.13% | 0.07% | -0.20% | 0.09% | 0.03% | 0.07% | 0.03% | |
| JPY | 0.31% | 0.23% | 0.20% | 0.20% | 0.16% | 0.21% | 0.18% | |
| CAD | 0.08% | -0.03% | -0.09% | -0.20% | -0.07% | -0.05% | -0.06% | |
| AUD | 0.18% | 0.04% | -0.03% | -0.16% | 0.07% | 0.05% | -0.02% | |
| NZD | 0.10% | 0.02% | -0.07% | -0.21% | 0.05% | -0.05% | -0.04% | |
| CHF | 0.16% | 0.05% | -0.03% | -0.18% | 0.06% | 0.02% | 0.04% |
The heat map shows percentage changes of major currencies against each other. The base currency is picked from the left column, while the quote currency is picked from the top row. For example, if you pick the Japanese Yen from the left column and move along the horizontal line to the US Dollar, the percentage change displayed in the box will represent JPY (base)/USD (quote).
Japanese Yen FAQs
The Japanese Yen (JPY) is one of the world’s most traded currencies. Its value is broadly determined by the performance of the Japanese economy, but more specifically by the Bank of Japan’s policy, the differential between Japanese and US bond yields, or risk sentiment among traders, among other factors.
One of the Bank of Japan’s mandates is currency control, so its moves are key for the Yen. The BoJ has directly intervened in currency markets sometimes, generally to lower the value of the Yen, although it refrains from doing it often due to political concerns of its main trading partners. The current BoJ ultra-loose monetary policy, based on massive stimulus to the economy, has caused the Yen to depreciate against its main currency peers. This process has exacerbated more recently due to an increasing policy divergence between the Bank of Japan and other main central banks, which have opted to increase interest rates sharply to fight decades-high levels of inflation.
The BoJ’s stance of sticking to ultra-loose monetary policy has led to a widening policy divergence with other central banks, particularly with the US Federal Reserve. This supports a widening of the differential between the 10-year US and Japanese bonds, which favors the US Dollar against the Japanese Yen.
The Japanese Yen is often seen as a safe-haven investment. This means that in times of market stress, investors are more likely to put their money in the Japanese currency due to its supposed reliability and stability. Turbulent times are likely to strengthen the Yen’s value against other currencies seen as more risky to invest in.
- A combination of supporting factors pushes the Gold price higher for the second straight day.
- The USD remains depressed amid the September Fed rate cut bets and underpins the metal.
- Geopolitical risks further benefit the safe-haven XAU/USD, though bulls seem reluctant.
Gold price (XAU/USD) once again showed some resilience below the 50-day Simple Moving Average (SMA) on Friday and staged a modest recovery from the vicinity of over a two-week low touched the previous day. The move up followed the release of the US Personal Consumption Expenditures (PCE) Price Index, which showed that inflation rose modestly in June and lifted bets for an imminent start of the Federal Reserve's (Fed) rate-cutting cycle. The US Treasury bond yields drifted lower after the inflation data, undermining the US Dollar (USD) and benefiting the non-yielding yellow metal.
Apart from this, persistent worries about geopolitical risks stemming from the ongoing conflicts in the Middle East assist the safe-haven Gold price to gain follow-through traction during the Asian session on Monday. That said, the risk-on impulse – as depicted by the upbeat mood across the global equity markets – could act as a headwind for the safe-haven precious metal. Traders might also prefer to move to the sidelines and wait for the outcome of a two-day Federal Open Market Committee (FOMC) meeting on Wednesday before committing to the next leg of a directional move for the commodity.
Daily Digest Market Movers: Gold price draws support from Fed rate cut bets, geopolitical risks
- A tame US inflation data reaffirmed market expectations that the Federal Reserve (Fed) will cut interest rates in September and drive flows towards the non-yielding Gold price higher on Friday.
- The US Commerce Department's Bureau of Economic Analysis reported that the Personal Consumption Expenditures (PCE) Price Index edged 0.1% higher last month after being unchanged in May.
- Over the past 12 months through June, the PCE Price Index eased slightly from 2.6% in the previous month and was up 2.5%, matching consensus estimates and adding to signs of easing price pressures.
- The core PCE Price Index, which excludes volatile food and energy prices and is the Fed's preferred inflation gauge, showed a monthly increase of 0.2% in June and the yearly rate held steady at 2.6%.
- The improving inflation landscape dragged the yield on the benchmark 10-year note yields to a nearly two-week low on Monday, which continues to undermine the US Dollar and benefits the XAU/USD.
- The Golan Heights attack on Saturday has raised worries of an all-out war between Israeli forces and Hezbollah in Lebanon, which further underpins demand for the safe-haven precious metal.
- A strong rally across the global equity markets might keep a lid on any runaway rally for the commodity ahead of the crucial two-day FOMC monetary policy meeting, starting on Tuesday.
- Investors this week will further take cues from the Bank of Japan decision on Wednesday, which will be followed by the Bank of England meeting on Thursday and important US macro releases.
Technical Analysis: Gold price struggles to build on intraday strength beyond the $2,400 mark
From a technical perspective, the recent repeated failures to find acceptance below the 50-day SMA and the subsequent bounce warrant some caution for bearish traders amid neutral oscillators on the daily chart. Bulls, however, struggle to capitalize on the Asian session uptick to levels beyond the $2,400 mark, making it prudent to wait for strong follow-through buying before confirming that the Gold price has bottomed out.
In the meantime, momentum above the $2,400 round figure is likely to confront some resistance near the $2,412 area ahead of last week's swing high, around the $2,432 region. A sustained strength beyond the latter will suggest that the corrective decline from the all-time peak touched earlier this month has run its course and set the stage for additional gains. The Gold price might then climb to the $2,469-2,470 intermediate resistance and challenge the record peak, around the $2,483-2,484 zone.
On the flip side, weakness below the $2,380 level might continue to attract buyers near the 50-day SMA, currently pegged near the $2,360-2,359 region, and remain limited. A sustained breakdown through the said support, however, will be seen as a fresh trigger for bearish traders and drag the Gold price to the next relevant support near the $2,325 area. The downward trajectory could extend further towards testing the $2,300 round-figure mark for the first time since late June.
Gold FAQs
Gold has played a key role in human’s history as it has been widely used as a store of value and medium of exchange. Currently, apart from its shine and usage for jewelry, the precious metal is widely seen as a safe-haven asset, meaning that it is considered a good investment during turbulent times. Gold is also widely seen as a hedge against inflation and against depreciating currencies as it doesn’t rely on any specific issuer or government.
Central banks are the biggest Gold holders. In their aim to support their currencies in turbulent times, central banks tend to diversify their reserves and buy Gold to improve the perceived strength of the economy and the currency. High Gold reserves can be a source of trust for a country’s solvency. Central banks added 1,136 tonnes of Gold worth around $70 billion to their reserves in 2022, according to data from the World Gold Council. This is the highest yearly purchase since records began. Central banks from emerging economies such as China, India and Turkey are quickly increasing their Gold reserves.
Gold has an inverse correlation with the US Dollar and US Treasuries, which are both major reserve and safe-haven assets. When the Dollar depreciates, Gold tends to rise, enabling investors and central banks to diversify their assets in turbulent times. Gold is also inversely correlated with risk assets. A rally in the stock market tends to weaken Gold price, while sell-offs in riskier markets tend to favor the precious metal.
The price can move due to a wide range of factors. Geopolitical instability or fears of a deep recession can quickly make Gold price escalate due to its safe-haven status. As a yield-less asset, Gold tends to rise with lower interest rates, while higher cost of money usually weighs down on the yellow metal. Still, most moves depend on how the US Dollar (USD) behaves as the asset is priced in dollars (XAU/USD). A strong Dollar tends to keep the price of Gold controlled, whereas a weaker Dollar is likely to push Gold prices up.
| Raw materials | Closed | Change, % |
|---|---|---|
| Silver | 27.914 | 0.25 |
| Gold | 238.814 | 1 |
| Palladium | 900.82 | -0.37 |
- GBP/USD trades in positive territory for the second consecutive day near 1.2885 in Monday’s Asian session.
- The US Fed is expected to hold its interest rate at its July meeting on Wednesday.
- The markets see a 50% chance of a quarter-point rate cut by the BoE on Thursday.
The GBP/USD pair holds positive ground around 1.2885 during the Asian trading hours on Monday. The uptick of the pair is bolstered by the softer US Dollar (USD) amid the hope of an interest rate cut by the Federal Reserve (Fed) in September. The Fed and Bank of England (BoE) monetary policy meetings on Wednesday and Thursday will be closely watched events.
Most analysts and traders expect the Fed to leave the interest rate unchanged at its next meeting on Wednesday. The US Fed might signal this week that interest rate cuts are on the way, although it is widely anticipated to hold steady until its next rate decision in September. Investors are now seeing that the first rate cut will come by mid-September, pricing in 100% of the Fed rate cut by at least a quarter-percentage-point by then, according to data from the CME FedWatch Tool.
Traders will also closely monitor the FOMC press conference for fresh impetus. The dovish tone from the FOMC might undermine the Greenback and create a tailwind for GBP/USD.
On the GBP’s front, the BoE might cut interest rates at its August meeting on Thursday, the first-rate cut since 2020. The markets forecast 50% odds of a quarter-point rate cut on Thursday, although views are split on whether the cut will occur now or at the next meeting in September.
Pound Sterling FAQs
The Pound Sterling (GBP) is the oldest currency in the world (886 AD) and the official currency of the United Kingdom. It is the fourth most traded unit for foreign exchange (FX) in the world, accounting for 12% of all transactions, averaging $630 billion a day, according to 2022 data. Its key trading pairs are GBP/USD, aka ‘Cable’, which accounts for 11% of FX, GBP/JPY, or the ‘Dragon’ as it is known by traders (3%), and EUR/GBP (2%). The Pound Sterling is issued by the Bank of England (BoE).
The single most important factor influencing the value of the Pound Sterling is monetary policy decided by the Bank of England. The BoE bases its decisions on whether it has achieved its primary goal of “price stability” – a steady inflation rate of around 2%. Its primary tool for achieving this is the adjustment of interest rates. When inflation is too high, the BoE will try to rein it in by raising interest rates, making it more expensive for people and businesses to access credit. This is generally positive for GBP, as higher interest rates make the UK a more attractive place for global investors to park their money. When inflation falls too low it is a sign economic growth is slowing. In this scenario, the BoE will consider lowering interest rates to cheapen credit so businesses will borrow more to invest in growth-generating projects.
Data releases gauge the health of the economy and can impact the value of the Pound Sterling. Indicators such as GDP, Manufacturing and Services PMIs, and employment can all influence the direction of the GBP. A strong economy is good for Sterling. Not only does it attract more foreign investment but it may encourage the BoE to put up interest rates, which will directly strengthen GBP. Otherwise, if economic data is weak, the Pound Sterling is likely to fall.
Another significant data release for the Pound Sterling is the Trade Balance. This indicator measures the difference between what a country earns from its exports and what it spends on imports over a given period. If a country produces highly sought-after exports, its currency will benefit purely from the extra demand created from foreign buyers seeking to purchase these goods. Therefore, a positive net Trade Balance strengthens a currency and vice versa for a negative balance.
- The Australian Dollar gains ground as the RBA is expected to hold interest rates next week.
- National Australia Bank (NAB) anticipates that the RBA’s cash rate will remain stable at 4.35% until May 2025.
- The US Dollar loses ground as the Fed is expected to deliver three rate cuts this year.
The Australian Dollar (AUD) extends its gains against the US Dollar (USD) for the second session on Monday. This upside is attributed to the hawkish sentiment surrounding the Reserve Bank of Australia’s (RBA) policy stance. Unlike other major central banks, the RBA is expected to delay easing its policy tightening due to persistent inflationary pressures and a tight labor market.
Australian Retail Sales for June will be closely watched on Tuesday. On Wednesday, the second-quarter Consumer Price Index (CPI) data will be released, potentially providing insights into the future direction of domestic monetary policy. Some economists are cautioning against further tightening due to increased recessionary risks. Last week, data indicated that private sector growth in Australia slowed in July, with manufacturing activity remaining contractionary and growth in the services sector decelerating.
The AUD/USD pair gains ground due to a weaker US Dollar. Signs of cooling inflation and easing labor market conditions in the United States (US) have fueled expectations of three rate cuts this year by the Federal Reserve (Fed), starting in September.
Daily Digest Market Movers: Australian Dollar improves due to the hawkish mood surrounding the RBA
- National Australia Bank (NAB) anticipates that the Reserve Bank of Australia's (RBA) cash rate will remain stable at 4.35% until May 2025, according to a recent NAB Economics outlook. Looking ahead, the NAB Economics team predicts a decline to 3.6% by December 2025, with further decreases expected in 2026.
- In a media release on Monday, the Australian Prudential Regulation Authority (APRA) warned that arrears rates are increasing slowly. Following their latest quarterly assessment of domestic and international economic conditions, APRA announced that they will keep macroprudential policy settings on hold. These comments reflect their ongoing evaluation of both domestic and global economic environments.
- On Friday, the US Personal Consumption Expenditures (PCE) Price Index rose by 2.5% year-over-year in June, down slightly from 2.6% in May, meeting market expectations. On a monthly basis, the PCE Price Index increased by 0.1% after being unchanged in May.
- The US Core PCE inflation, which excludes volatile food and energy prices, also climbed to 2.6% in June, consistent with May's increase and above the forecast of 2.5%. The core PCE Price Index rose by 0.2% month-over-month in June, compared to 0.1% in May.
- Bank of America suggests that robust economic growth in the United States enables the Federal Open Market Committee (FOMC) to "afford to wait" before implementing any adjustments. The BofA notes that the economy "remains strong" and expects the Fed to begin rate cuts in December.
- Last week, concerns about the weak Chinese economy were heightened by an unexpected rate cut from the People's Bank of China (PBoC). The People’s Bank of China (PBOC), cut the one-year Medium-term Lending Facility (MLF) rate from 2.50% to 2.30% on Thursday. Additionally, the Bank of China, one of the world's largest banks, announced a 10-20 basis points cut in time deposit rates. Any change in the Chinese economy could impact the Australian markets as both countries are close trade partners.
Technical Analysis: Australian Dollar moves above 0.6550
The Australian Dollar trades around 0.6560 on Monday. The daily chart analysis shows that the AUD/USD pair has returned to the descending channel, indicating a potential weakening of the bearish bias. The 14-day Relative Strength Index (RSI) is slightly above 30 level, suggesting the currency pair may be due for a potential correction soon.
The AUD/USD pair could find immediate support at the lower boundary of the descending channel around the key level of 0.6550. A break below this level could exert pressure on the pair to navigate the region around the 0.6470 level.
On the upside, key resistance appears at the nine-day Exponential Moving Average (EMA) at 0.6610. A break above this level could lead the pair to test the upper boundary of the descending channel around the psychological level of 0.6700, with a potential aim for a six-month high of 0.6798.
AUD/USD: Daily Chart
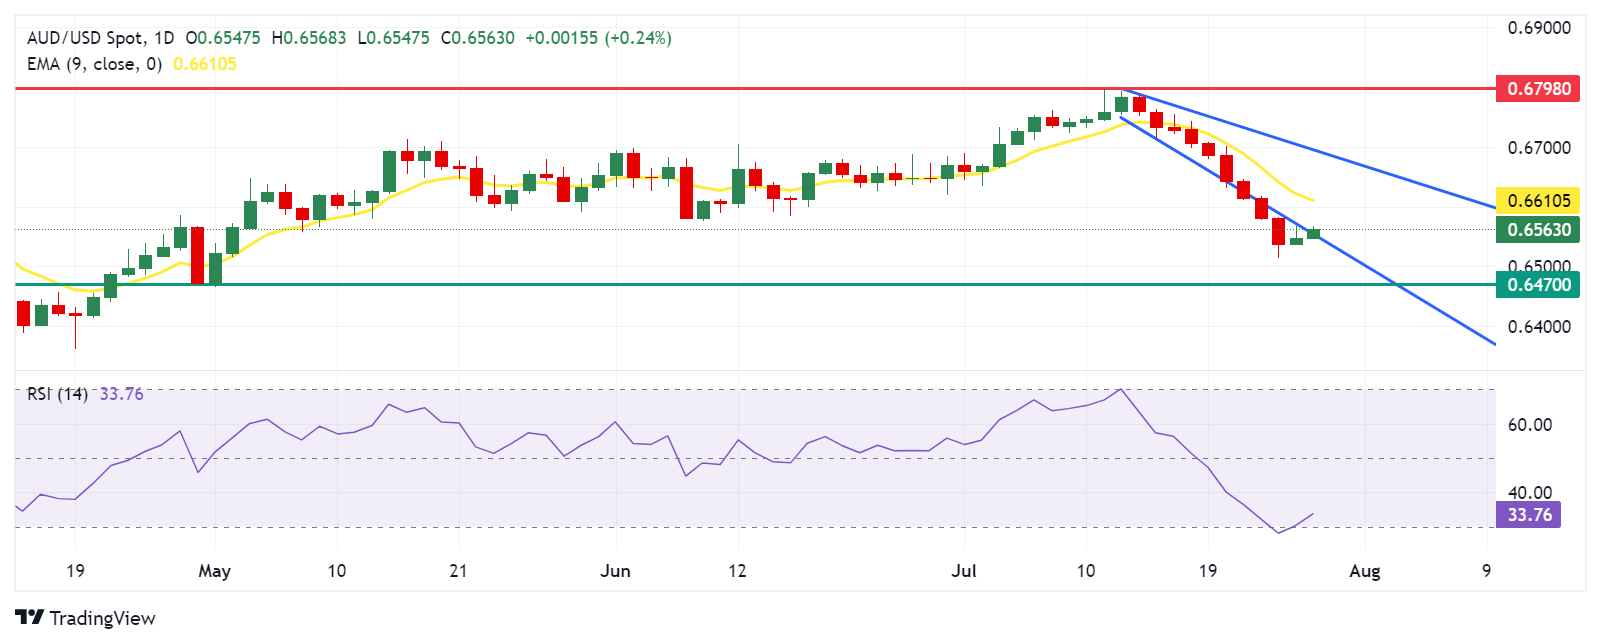
Australian Dollar PRICE Today
The table below shows the percentage change of Australian Dollar (AUD) against listed major currencies today. Australian Dollar was the strongest against the US Dollar.
| USD | EUR | GBP | JPY | CAD | AUD | NZD | CHF | |
|---|---|---|---|---|---|---|---|---|
| USD | -0.09% | -0.11% | -0.20% | -0.10% | -0.23% | -0.13% | -0.12% | |
| EUR | 0.09% | -0.06% | -0.13% | 0.02% | -0.09% | -0.06% | -0.01% | |
| GBP | 0.11% | 0.06% | -0.10% | 0.05% | -0.04% | 0.02% | 0.05% | |
| JPY | 0.20% | 0.13% | 0.10% | 0.09% | 0.00% | 0.08% | 0.13% | |
| CAD | 0.10% | -0.02% | -0.05% | -0.09% | -0.10% | -0.06% | -0.00% | |
| AUD | 0.23% | 0.09% | 0.04% | -0.01% | 0.10% | 0.07% | 0.09% | |
| NZD | 0.13% | 0.06% | -0.02% | -0.08% | 0.06% | -0.07% | 0.03% | |
| CHF | 0.12% | 0.00% | -0.05% | -0.13% | 0.00% | -0.09% | -0.03% |
The heat map shows percentage changes of major currencies against each other. The base currency is picked from the left column, while the quote currency is picked from the top row. For example, if you pick the Australian Dollar from the left column and move along the horizontal line to the US Dollar, the percentage change displayed in the box will represent AUD (base)/USD (quote).
Australian Dollar FAQs
One of the most significant factors for the Australian Dollar (AUD) is the level of interest rates set by the Reserve Bank of Australia (RBA). Because Australia is a resource-rich country another key driver is the price of its biggest export, Iron Ore. The health of the Chinese economy, its largest trading partner, is a factor, as well as inflation in Australia, its growth rate and Trade Balance. Market sentiment – whether investors are taking on more risky assets (risk-on) or seeking safe-havens (risk-off) – is also a factor, with risk-on positive for AUD.
The Reserve Bank of Australia (RBA) influences the Australian Dollar (AUD) by setting the level of interest rates that Australian banks can lend to each other. This influences the level of interest rates in the economy as a whole. The main goal of the RBA is to maintain a stable inflation rate of 2-3% by adjusting interest rates up or down. Relatively high interest rates compared to other major central banks support the AUD, and the opposite for relatively low. The RBA can also use quantitative easing and tightening to influence credit conditions, with the former AUD-negative and the latter AUD-positive.
China is Australia’s largest trading partner so the health of the Chinese economy is a major influence on the value of the Australian Dollar (AUD). When the Chinese economy is doing well it purchases more raw materials, goods and services from Australia, lifting demand for the AUD, and pushing up its value. The opposite is the case when the Chinese economy is not growing as fast as expected. Positive or negative surprises in Chinese growth data, therefore, often have a direct impact on the Australian Dollar and its pairs.
Iron Ore is Australia’s largest export, accounting for $118 billion a year according to data from 2021, with China as its primary destination. The price of Iron Ore, therefore, can be a driver of the Australian Dollar. Generally, if the price of Iron Ore rises, AUD also goes up, as aggregate demand for the currency increases. The opposite is the case if the price of Iron Ore falls. Higher Iron Ore prices also tend to result in a greater likelihood of a positive Trade Balance for Australia, which is also positive of the AUD.
The Trade Balance, which is the difference between what a country earns from its exports versus what it pays for its imports, is another factor that can influence the value of the Australian Dollar. If Australia produces highly sought after exports, then its currency will gain in value purely from the surplus demand created from foreign buyers seeking to purchase its exports versus what it spends to purchase imports. Therefore, a positive net Trade Balance strengthens the AUD, with the opposite effect if the Trade Balance is negative.
On Monday, the People’s Bank of China (PBOC) set the USD/CNY central rate for the trading session ahead at 7.1316, as against the previous day's fix of 7.1270 and 7.2522 Reuters estimates.
Israel authorised a retaliation attack against Hezbollah in Lebanon, amid an American-led diplomatic push to contain the fallout from a strike that killed 12 young people in Israel-controlled Golan Heights, per the Wall Street Journal.
The Golan Heights attack on Saturday has raised worries of a confrontation between Israel and Hezbollah. Israel accuses Hezbollah of carrying out the strike on a football pitch, which killed at least 12 people, including children, and it has promised to react. However, Hezbollah denies being involved in the attack.
Market reaction
At the time of writing, Gold price (XAU/USD) is trading 0.44% higher on the day to trade at $2,397.52.
Risk sentiment FAQs
In the world of financial jargon the two widely used terms “risk-on” and “risk off'' refer to the level of risk that investors are willing to stomach during the period referenced. In a “risk-on” market, investors are optimistic about the future and more willing to buy risky assets. In a “risk-off” market investors start to ‘play it safe’ because they are worried about the future, and therefore buy less risky assets that are more certain of bringing a return, even if it is relatively modest.
Typically, during periods of “risk-on”, stock markets will rise, most commodities – except Gold – will also gain in value, since they benefit from a positive growth outlook. The currencies of nations that are heavy commodity exporters strengthen because of increased demand, and Cryptocurrencies rise. In a “risk-off” market, Bonds go up – especially major government Bonds – Gold shines, and safe-haven currencies such as the Japanese Yen, Swiss Franc and US Dollar all benefit.
The Australian Dollar (AUD), the Canadian Dollar (CAD), the New Zealand Dollar (NZD) and minor FX like the Ruble (RUB) and the South African Rand (ZAR), all tend to rise in markets that are “risk-on”. This is because the economies of these currencies are heavily reliant on commodity exports for growth, and commodities tend to rise in price during risk-on periods. This is because investors foresee greater demand for raw materials in the future due to heightened economic activity.
The major currencies that tend to rise during periods of “risk-off” are the US Dollar (USD), the Japanese Yen (JPY) and the Swiss Franc (CHF). The US Dollar, because it is the world’s reserve currency, and because in times of crisis investors buy US government debt, which is seen as safe because the largest economy in the world is unlikely to default. The Yen, from increased demand for Japanese government bonds, because a high proportion are held by domestic investors who are unlikely to dump them – even in a crisis. The Swiss Franc, because strict Swiss banking laws offer investors enhanced capital protection.
- EUR/USD trades stronger near 1.0860 in Monday’s early Asian session.
- Fed’s key inflation gauge climbed 2.5% in June from a year ago.
- The chance of another ECB rate cut might weigh on the Euro.
The EUR/USD pair trades with mild gains around 1.0860 during the early Asian trading hours on Monday. The major pair edges higher as traders widely anticipated the September interest rate cut by the US Federal Reserve (Fed) in September, which drags the Greenback lower.
Recent US inflation, as measured by the change in the Personal Consumption Expenditures (PCE) Price Index, eased slightly from a year ago in June, paving the way for an interest rate cut by the Fed in September. The US PCE inflation continued to slow in June, slowing from a 2.6% annual gain in May to 2.5% in June. On a monthly basis, the PCE figure increased by 0.1% in June, after remaining unchanged in May. The core PCE price index, the Fed's preferred annual inflation measure, rose 2.6% YoY in June, compared to 2.5% in May, according to Commerce Department figures released Friday.
However, the softer inflation in the US for June is not enough for the Fed to start cutting interest rates at its August meeting on Wednesday. Morgan Stanley analysts noted that 'considerable progress on inflation' will allow the Fed to get closer to rate cuts, adding that they are expecting three cuts this year, beginning at the September FOMC meeting. The financial markets have priced in nearly 90% of the possibility of a Fed rate cut in September, followed by another cut in November and December, according to the CME FedWatch Tool.
On the other hand, traders see more of the European Central Bank (ECB) rate cuts in the near term. This, in turn, might weigh on the Euro (EUR) against the Greenback. The ECB left the interest rate unchanged last week, but weaker German IFO survey results and softer data are opening the door to another rate cut by the ECB. Traders will take more cues from the preliminary Gross Domestic Product (GDP) for the second quarter from Germany and the Eurozone. In the case of stronger-than-expected readings, this could lift the shared currency against the USD.
Euro FAQs
The Euro is the currency for the 20 European Union countries that belong to the Eurozone. It is the second most heavily traded currency in the world behind the US Dollar. In 2022, it accounted for 31% of all foreign exchange transactions, with an average daily turnover of over $2.2 trillion a day. EUR/USD is the most heavily traded currency pair in the world, accounting for an estimated 30% off all transactions, followed by EUR/JPY (4%), EUR/GBP (3%) and EUR/AUD (2%).
The European Central Bank (ECB) in Frankfurt, Germany, is the reserve bank for the Eurozone. The ECB sets interest rates and manages monetary policy. The ECB’s primary mandate is to maintain price stability, which means either controlling inflation or stimulating growth. Its primary tool is the raising or lowering of interest rates. Relatively high interest rates – or the expectation of higher rates – will usually benefit the Euro and vice versa. The ECB Governing Council makes monetary policy decisions at meetings held eight times a year. Decisions are made by heads of the Eurozone national banks and six permanent members, including the President of the ECB, Christine Lagarde.
Eurozone inflation data, measured by the Harmonized Index of Consumer Prices (HICP), is an important econometric for the Euro. If inflation rises more than expected, especially if above the ECB’s 2% target, it obliges the ECB to raise interest rates to bring it back under control. Relatively high interest rates compared to its counterparts will usually benefit the Euro, as it makes the region more attractive as a place for global investors to park their money.
Data releases gauge the health of the economy and can impact on the Euro. Indicators such as GDP, Manufacturing and Services PMIs, employment, and consumer sentiment surveys can all influence the direction of the single currency. A strong economy is good for the Euro. Not only does it attract more foreign investment but it may encourage the ECB to put up interest rates, which will directly strengthen the Euro. Otherwise, if economic data is weak, the Euro is likely to fall. Economic data for the four largest economies in the euro area (Germany, France, Italy and Spain) are especially significant, as they account for 75% of the Eurozone’s economy.
Another significant data release for the Euro is the Trade Balance. This indicator measures the difference between what a country earns from its exports and what it spends on imports over a given period. If a country produces highly sought after exports then its currency will gain in value purely from the extra demand created from foreign buyers seeking to purchase these goods. Therefore, a positive net Trade Balance strengthens a currency and vice versa for a negative balance.
- USD/JPY kicks off the new week on a positive note, though the upside potential seems limited.
- A positive risk tone dents demand for the safe-haven JPY and lends some support to the major.
- Traders might now prefer to wait for the crucial BoJ and Fed policy decisions on Wednesday.
The USD/JPY pair attracts fresh buyers during the Asian session on Monday and jumps to the 154.35 region in the last hour amid some repositioning trade ahead of this week's key central bank event risks.
The Bank of Japan (BoJ) and the Federal Reserve (Fed) are scheduled to announce their policy decisions at the end of a two-day meeting on Wednesday. In the meantime, the risk-on impulse – as depicted by a strong bullish sentiment surrounding the global equity markets – undermines the safe-haven Japanese Yen (JPY) and assists the USD/JPY pair in regaining positive traction. Any further appreciating move, however, seems elusive in the wake of the divergent BoJ-Fed policy expectations.
The BoJ is expected to reduce bond buying and potentially raise interest rates. In contrast, the markets have fully priced the possibility for an imminent start of the Fed's policy-easing cycle in September and a total of three interest rate cuts by the end of this year. The bets were reaffirmed by the release of the US Personal Consumption Expenditures (PCE) Price Index on Friday, which underscored an improving inflation environment and kept the US Dollar (USD) bulls on the defensive.
Hence, it will be prudent to wait for strong follow-through buying before confirming that the USD/JPY pair has bottomed out and positioning for an extension of the recent bounce from sub-152.00 levels, or the lowest since early May. Even from a technical perspective, last week's breakdown through the 100-day Simple Moving Average (SMA) was seen as a fresh trigger for bears, though a slightly oversold Relative Strength Index (RSI) on the daily chart prompted some short-covering.
Bank of Japan FAQs
The Bank of Japan (BoJ) is the Japanese central bank, which sets monetary policy in the country. Its mandate is to issue banknotes and carry out currency and monetary control to ensure price stability, which means an inflation target of around 2%.
The Bank of Japan has embarked in an ultra-loose monetary policy since 2013 in order to stimulate the economy and fuel inflation amid a low-inflationary environment. The bank’s policy is based on Quantitative and Qualitative Easing (QQE), or printing notes to buy assets such as government or corporate bonds to provide liquidity. In 2016, the bank doubled down on its strategy and further loosened policy by first introducing negative interest rates and then directly controlling the yield of its 10-year government bonds.
The Bank’s massive stimulus has caused the Yen to depreciate against its main currency peers. This process has exacerbated more recently due to an increasing policy divergence between the Bank of Japan and other main central banks, which have opted to increase interest rates sharply to fight decades-high levels of inflation. The BoJ’s policy of holding down rates has led to a widening differential with other currencies, dragging down the value of the Yen.
A weaker Yen and the spike in global energy prices have led to an increase in Japanese inflation, which has exceeded the BoJ’s 2% target. Still, the Bank judges that the sustainable and stable achievement of the 2% target has not yet come in sight, so any sudden change in the current policy looks unlikely.
| Index | Change, points | Closed | Change, % |
|---|---|---|---|
| NIKKEI 225 | -202.1 | 37667.41 | -0.53 |
| Hang Seng | 16.34 | 17021.31 | 0.1 |
| KOSPI | 21.25 | 2731.9 | 0.78 |
| ASX 200 | 60.1 | 7921.3 | 0.76 |
| DAX | 118.83 | 18417.55 | 0.65 |
| CAC 40 | 90.66 | 7517.68 | 1.22 |
| Dow Jones | 654.27 | 40589.34 | 1.64 |
| S&P 500 | 59.88 | 5459.1 | 1.11 |
| NASDAQ Composite | 176.16 | 17357.88 | 1.03 |
| Pare | Closed | Change, % |
|---|---|---|
| AUDUSD | 0.65478 | 0.17 |
| EURJPY | 166.909 | -0.07 |
| EURUSD | 1.08542 | 0.08 |
| GBPJPY | 197.832 | -0.04 |
| GBPUSD | 1.28663 | 0.11 |
| NZDUSD | 0.58885 | 0.04 |
| USDCAD | 1.38322 | 0.07 |
| USDCHF | 0.88369 | 0.27 |
| USDJPY | 153.758 | -0.15 |


© 2000-2026. Уcі права захищені.
Cайт знаходитьcя під керуванням TeleTrade DJ. LLC 2351 LLC 2022 (Euro House, Richmond Hill Road, Kingstown, VC0100, St. Vincent and the Grenadines).
Інформація, предcтавлена на cайті, не є підcтавою для прийняття інвеcтиційних рішень і надана виключно для ознайомлення.
Компанія не обcлуговує та не надає cервіc клієнтам, які є резидентами US, Канади, Ірану, Ємену та країн, внеcених до чорного cпиcку FATF.
Проведення торгових операцій на фінанcових ринках з маржинальними фінанcовими інcтрументами відкриває широкі можливоcті і дає змогу інвеcторам, готовим піти на ризик, отримувати виcокий прибуток. Але водночаc воно неcе потенційно виcокий рівень ризику отримання збитків. Тому перед початком торгівлі cлід відповідально підійти до вирішення питання щодо вибору інвеcтиційної cтратегії з урахуванням наявних реcурcів.
Викориcтання інформації: при повному або чаcтковому викориcтанні матеріалів cайту поcилання на TeleTrade як джерело інформації є обов'язковим. Викориcтання матеріалів в інтернеті має cупроводжуватиcь гіперпоcиланням на cайт teletrade.org. Автоматичний імпорт матеріалів та інформації із cайту заборонено.
З уcіх питань звертайтеcь за адреcою pr@teletrade.global.
переклади